Proceeding Paper

A Context-Aware Method-Based Cattle Vocal Classification for Livestock Monitoring in Smart Farm †

Department of Electrical and Computer Engineering, University of Victoria, Victoria, BC V8P 5C2, Canada
Presented at the 1st International Online Conference on Agriculture-Advances in Agricultural Science and Technology, 10–25 February 2022; Available online: https://iocag2022.sciforum.net/.
Chem. Proc. 2022, 10(1), 89; https://doi.org/10.3390/IOCAG2022-12233
Published: 10 February 2022

Abstract

:
This paper focuses on livestock monitoring on a smart farm to improve animal well-being and production. The great potential for increased automation and technological innovation in agriculture could help livestock farmers to monitor the welfare of their animals for precision livestock farming. A new acoustical method exploiting contextual information is introduced for cattle vocal classification. The proposed scheme considers the raw recordings which contain cattle sounds. Then a set of contextual acoustic features is constructed as input to the MSVM classifier to track the types of cattle vocalizations. Categorized noisy cattle calls are finally classified into four types of calls (i.e., cattle food anticipating call, animal estrus call, cough sound, and normal call) with an overall classification accuracy of 84% outperforming the results obtained using conventional MFCC features. We used an open access dataset consists of 270 cattle classification records acquired using multiple sound sensors. Promising results are obtained by the proposed method for livestock monitoring enabling farm owners to determine the status of their cattle.

1. Introduction

Automated acoustic monitoring could be a useful tool in precision livestock farming [1]. As farming systems become increasingly automated, it is possible to dynamically adjust the environment in which the animals are kept and automatically change the temperature, lighting, and ventilation. With the help of sensor and artificial intelligence (AI) technologies, the farmers and farm owners can also detect diseases in animals and take immediate actions accordingly. The implementation of smart technologies in livestock farming helps in gathering and processing real-time data related to animals health and general behavior, including their feeding behavior, food and water quality, hygiene levels, etc. For example, growing population of cattle with increasing dairy farms and increasing adoption of livestock monitoring technology in developing countries create a strong demand for livestock monitoring.
In agriculture, at present, there is a growing focus on livestock monitoring for smart farms. Various research works have been published in related contexts, such as animal welfare and disease detection. In [2], a deep-learning-based method was recently proposed for classification of cattle vocalization for real-time livestock monitoring. The proposed scheme consists of a 2D CNN (convolutional neural network) to classify cattle vocals as well as remove background noise using STFT, and another CNN for behavior classification from the existing datasets, achieving an overall accuracy of 81.96% using MFCC features. The work in [3] dealt with classification of cattle cough sounds using a total of 205 min of sounds resulting in 285 labelled calf coughs. The extracted features are obtained by calculating the FFT of the input audio, removing the background noise and reducing the resolution in the spectrograms by summing the frequencies into 12 separate bands and considering duration of the cough. An example-based classifier is then used based on the Euclidean distance between the two rough spectrograms of the input audio data and the labelled data. The lower the distance, the more it resembled its corresponding spectrogram providing 98% specificity rate (true negatives) and 52% sensitivity rate (true positive). Despite the low sensitivity, the method is still able to identify increased periods of coughing, allowing farmers to administer treatment for the respiratory disorder. In [4], the feeding behaviour of the cattle was studied using cattle grazing sounds by attaching microphones and cameras to a cow’s forehead and exposing the cattle to different treatments which various plant species, at two different heights, an increasing of herbage mass, and the number of bites it takes to finish (10–30). The sounds were analyzed by extracting the energy flux density from the sounds and it is found that energy flux density relates linearly to the dry matter intake. A non-human animals positive and negative emotions monitoring scheme was reported in [5] for goats using emotion-linked vocalizations based on behavioural(looking) and physiological(cardiac) measures. It was found that during the habituation phase, goats gradually reduced the duration of looking towards the sound source, and the heart rate also decreased, suggesting that habituation to the valence of the stimuli occurred. Later, the occurrences of looking and heart-rate increased immediately after the second call, and decreased during rehabituation, suggesting that goats perceived the change in call valence. In [6], a cattle call monitor (CCM) system was developed using cattle vocalizations for automatic estrus detection. By matching the information of zero-crossing (>5), frequency range (50–2000 Hz), and duration (0.5–10 s) of the windowed signals from the structure-borne and airborne sound microphones, the proposed algorithm is able to identify the estrus calls providing detection with sensitivity of 87% and specificity of 94%. Another work was published in [7] on estrus detection for dairy cattle by monitoring cattle vocalization based on vocalization rate (calls/hr) and the rate of harmonic moo and nonharmonic (noisy) bellow calls for the complete vocalizations.
In this paper, a new acoustical method is developed by using contextual information for cattle vocal classification. The proposed scheme considers the raw recordings which contain various cattle sounds. Then a set of contextual acoustic features is constructed as input to the MSVM classifier to track the types of cattle calls from the noisy raw input data.

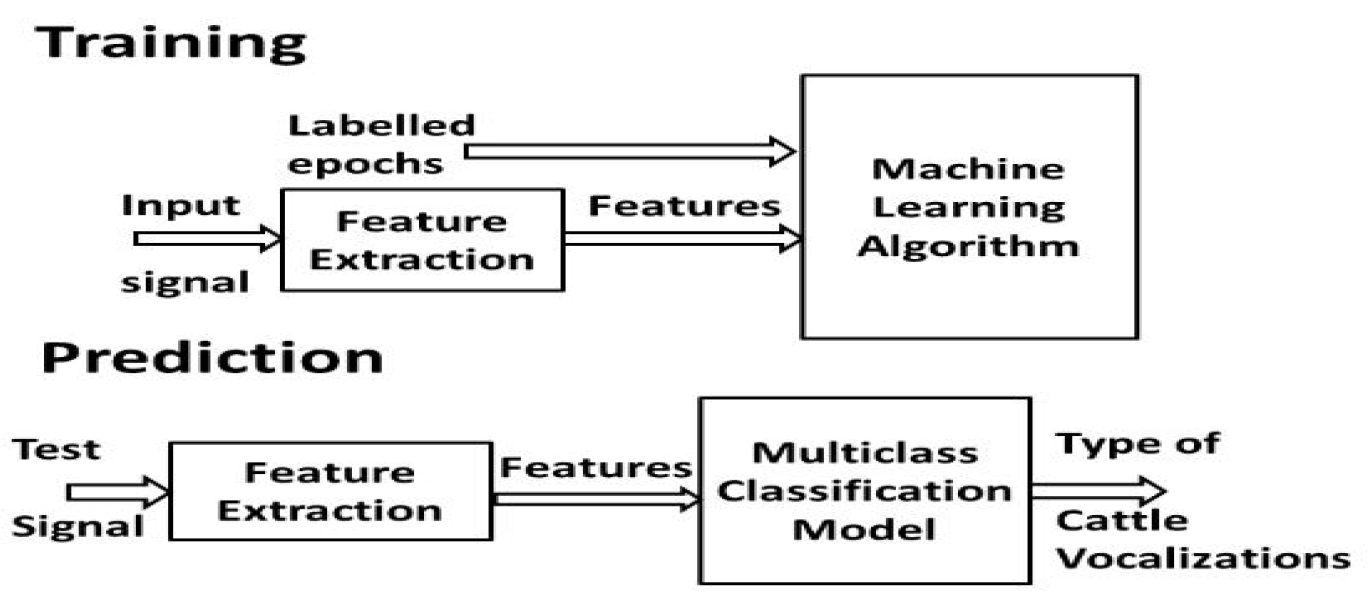
2. Materials and Methods
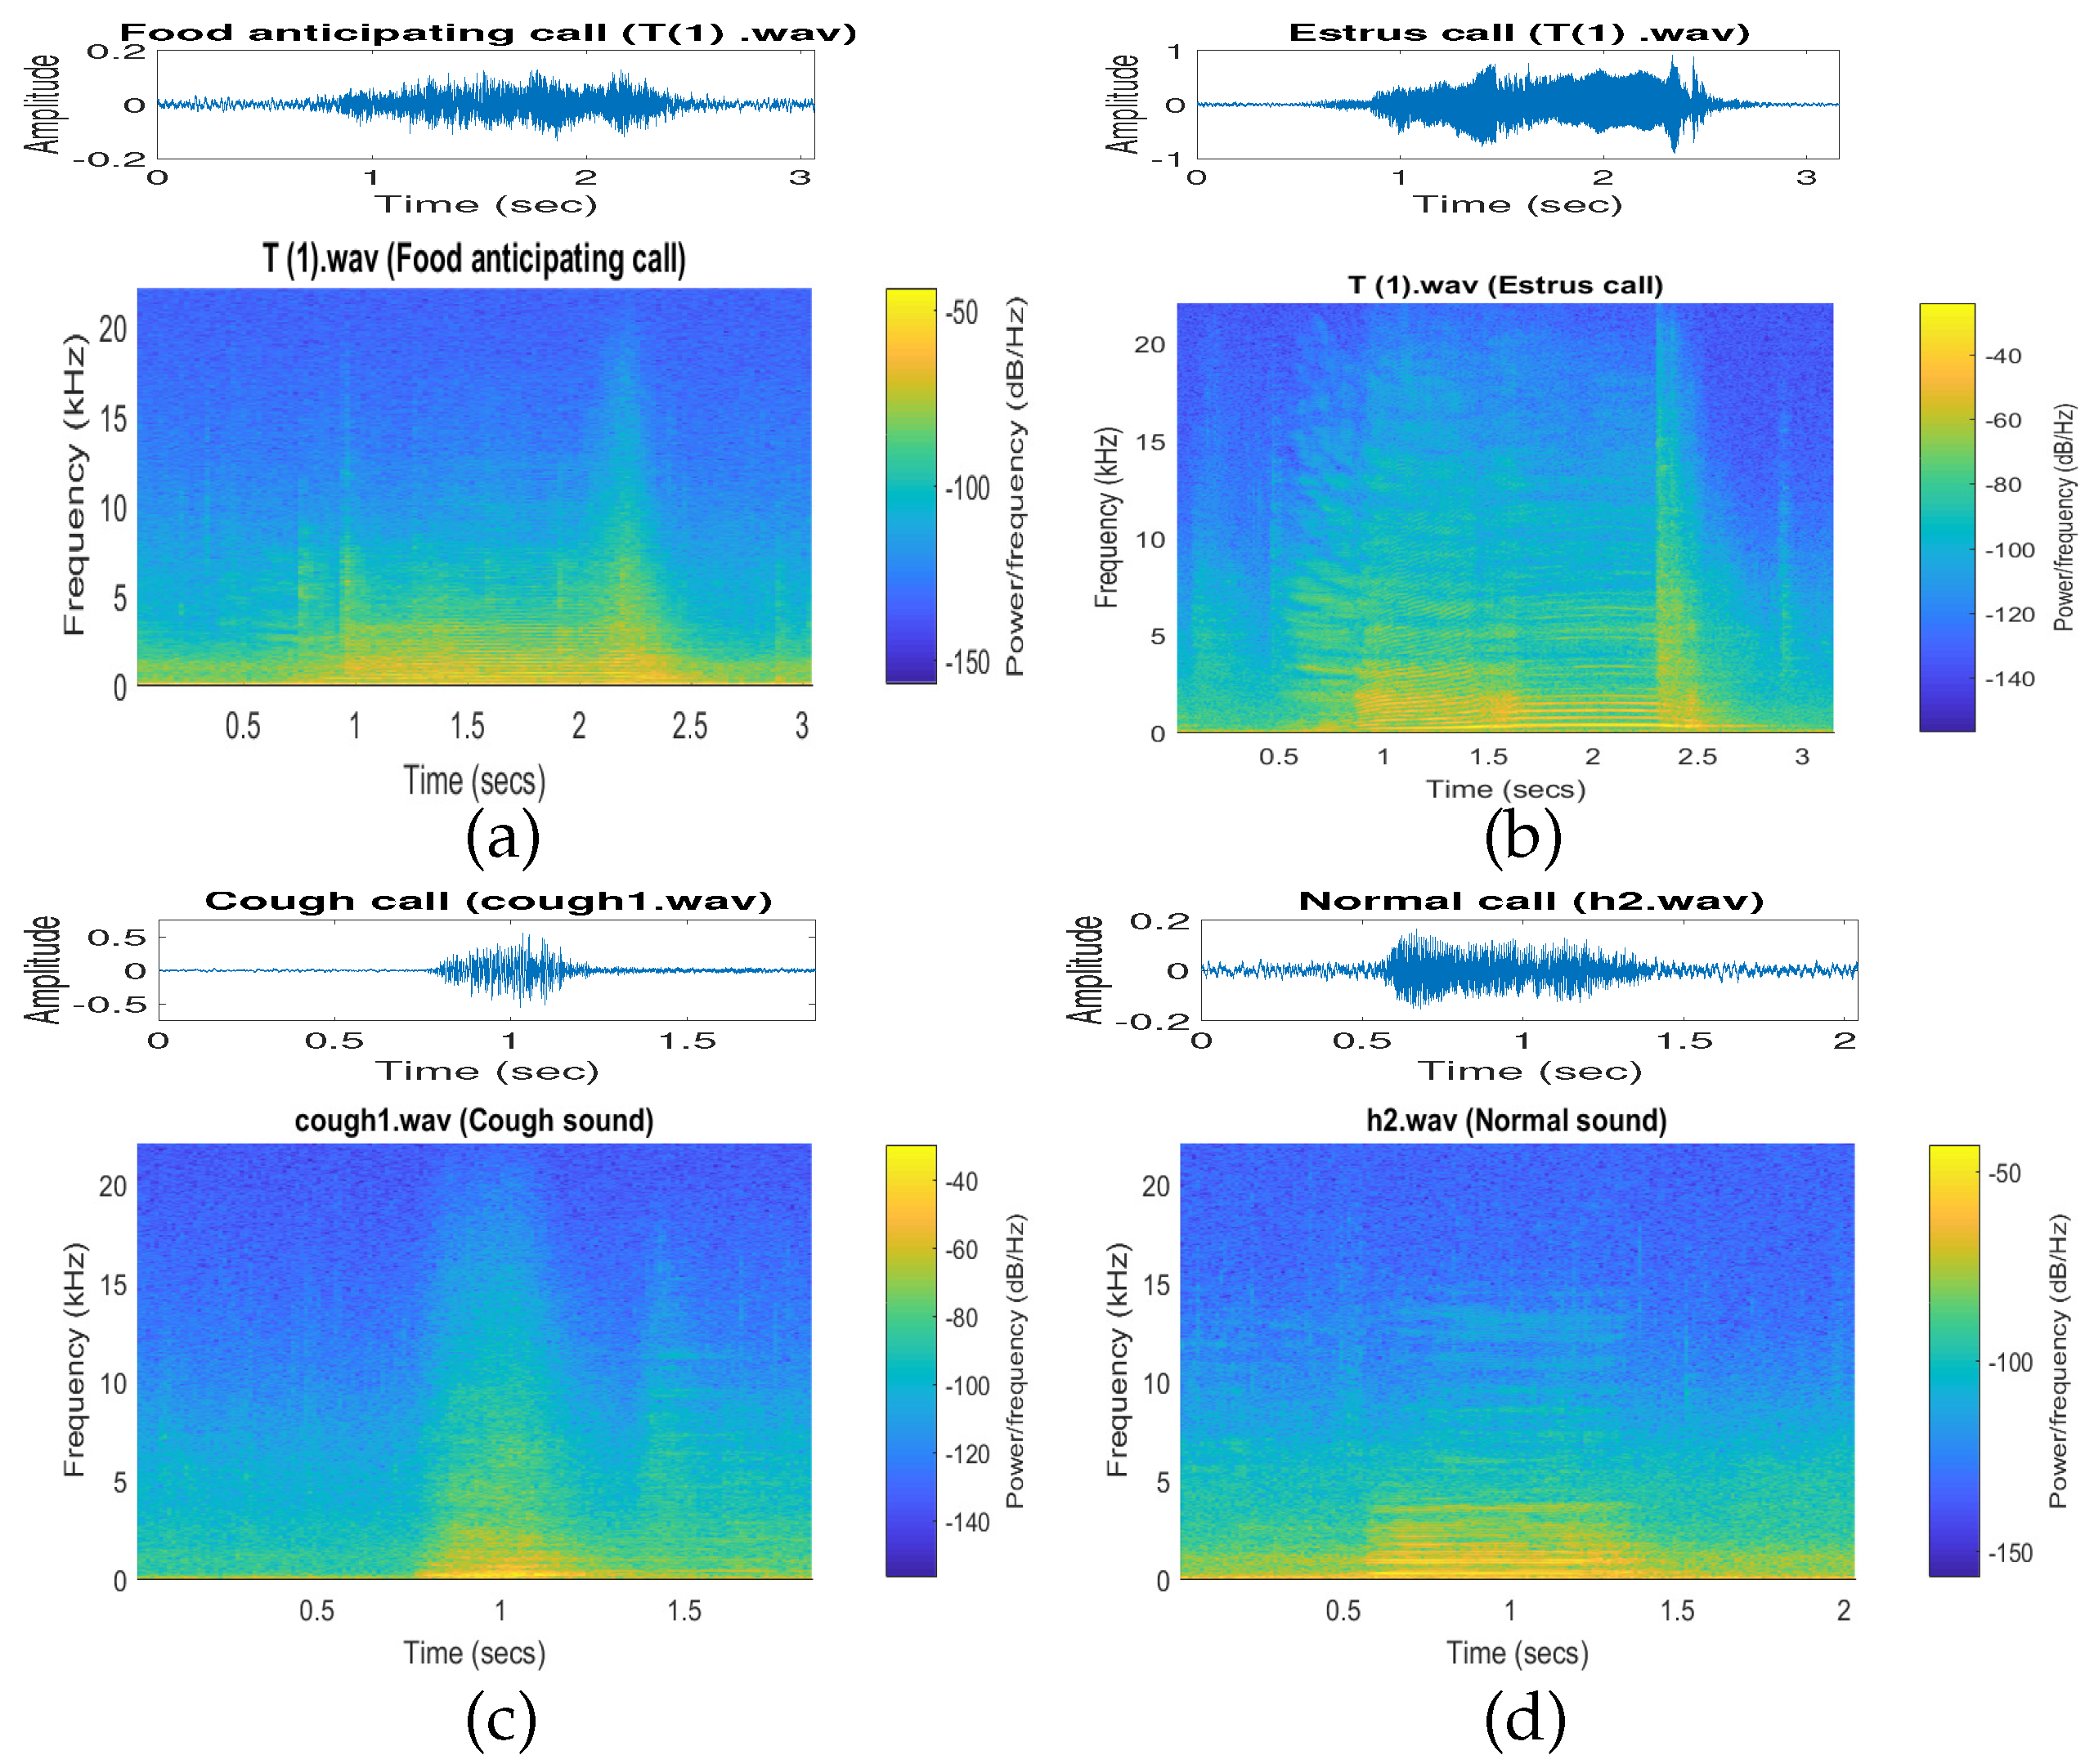
The basic idea of the proposed approach lies in the integration of auditory processing model and contextual information for extracting useful features. The method adopts the multiresolution framework. The general outline of the multiclass classification considered here is shown in Figure 1 which consists of a training stage followed by prediction.

2.1. Database Used

We used an open access dataset [8] containing 270 cattle classification records collected from 12 recording sensors (USB mic, Shenzhen kobeton technology, Shenzhen, China, frequency response: 16 Hz–100 kHz, sensitivity: −47 dB ± 4 dB). The audio data are collected in three separate zones with four microphones placed in each zone and located at a height of 3 m in three separate livestock facilities(see [2] for more details).

2.2. Proposed Method

2.2.1. Data Preprocessing

The dataset of each vocalization is resampled (from 44,100 Hz to 16,000 Hz) and resized into N-sample data blocks (N = 8192 samples here, referring to 0.512 s) followed by time windowing using N-sample Hamming windows [9]. Please note that resampling is performed here to reduce the computational complexity, while resizing is performed to save memory by compressing the signal without changing the spectral content [10].

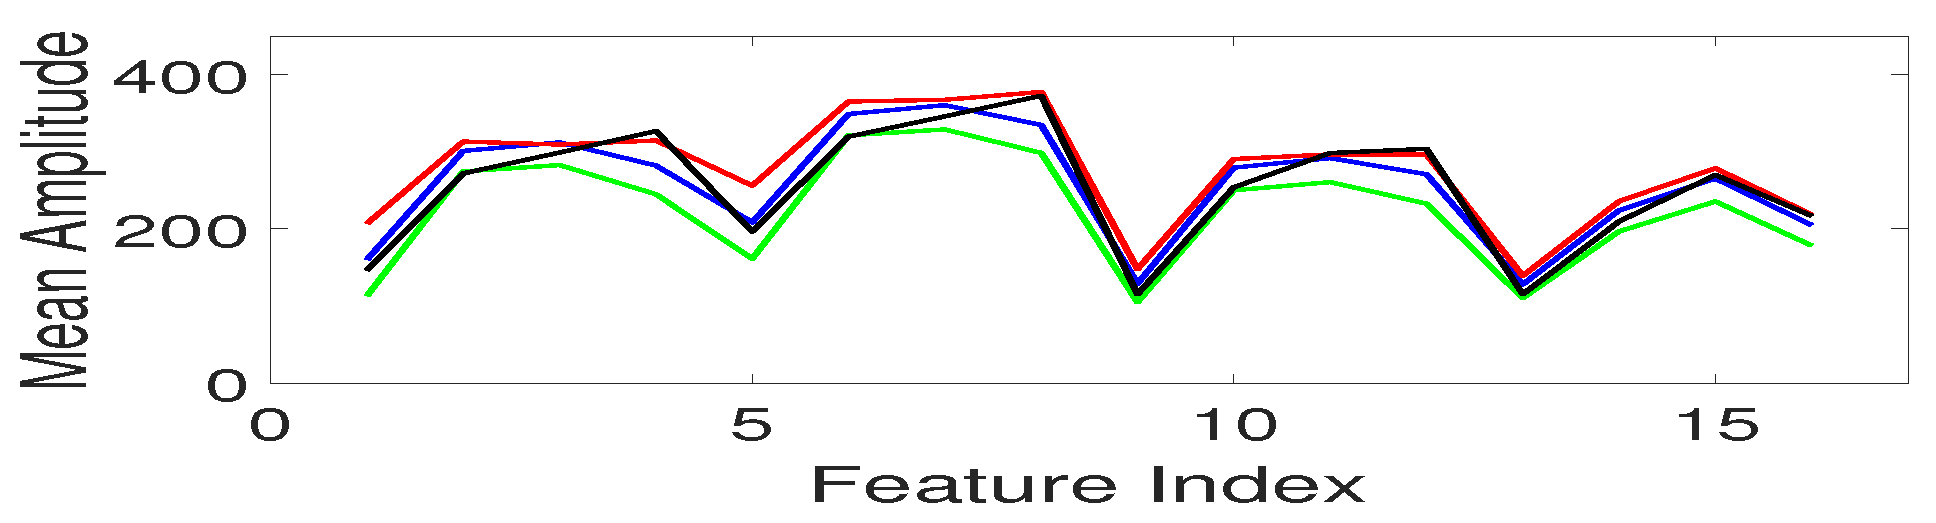
2.2.2. Contextual Acoustic Features

We introduced a set of contextual acoustic features, which encodes the multi-resolution energy distributions in the time-frequency plan based on the cochleagram representation of an input signal. We incorporate several cochleagrams at different resolutions to design the contextual features set. The cochleagram with high resolution captures the local information, while the other low resolution cochleagrams capture the contextual information at different scales. To compute the cochleagram, we first pass an input signal to a gammatone filter bank, where a particular gammatone filter has an impulse response given by
h ( t ) = t ( η 1 ) e 2 π B f c t cos ( 2 π f c t ) ( t 0 ) = 0 ( t 0 )
where parameter η is the order of the filter, f c denotes the center frequency while B f c refers to the bandwidth given f c . The gammatone filter function is used in models of the auditory periphery representing critical-band filters where the center frequencies f c are uniformly spaced on the equivalent rectangular bandwidth (ERB) scale. The relation between B f c and f c is given by
B f c = 1.019 × E R B ( f c ) = 1.019 × 24.7 ( 4.37 × f c / 1000 + 1 )
Each output signal from the gammatone filter bank is then divided into 20 ms frames with a 10 ms frame shift; the cochleagram is then obtained by calculating the energy of each time frame at each frequency channel. Each T-F unit in the cochleagram contains only local information, which may not be sufficient to accommodate the diversity in the real-recorded input data. To compensate for this, the new contextual feature set provides contextual information by including the energy distribution in the neighborhood of each T-F unit. The steps for computing the features are as follows.
  • Given input data, compute the first 32-channel cochleagram (CB1) followed by a log operation applied to each T-F unit.
  • Similarly, the second cochleagram (CB2) is computed with the frame length of 200 msec and frame shift of 10 msec.
  • The third cochleagram (CB3) is derived by averaging CB1 using a rectangular window of size (5 × 5) including five frequency channels and five time frames centered at a given T-F unit. If the window goes beyond the given cochleagram, the outside units take the value of zero (i.e., zero padding).
  • The fourth cochleagram CB4 is computed in a similar way to CB3, except that a rectangular window of size (11 × 11) is used.
  • Concatenate CB1-CB4 to generate a feature matrix F and integrate it along the time frame to obtain a set of contextual features of dimension (128 × 1).

2.2.3. MSVM Classification

Separating various cattle calls is a multiple classification-based monitoring problem, which is solved here by considering one-against-all optimization formulation based on the Crammer and Singer (CS) model [11] for a multiclass support vector machine (MSVM) providing fast convergence and high accuracy. In general, a MSVM classifier solves a d-class classification problem by constructing decision functions of the form:
x arg min c { 1 , , d } { w c T ϕ ( x ) + b c }
given i.i.d. training data ( ( x 1 , y 1 ) , , ( x l , y l ) ) ( X × { 1 , , d } ) l . Here, ϕ : X H , ϕ ( x ) = k ( x , · ) , is a feature map into a reproducing kernel Hilbert space H with corresponding kernel k, w 1 , w d H are class-wise weight vectors, and T ( · ) stands for transpose operator. The CS method is usually only defined for hypotheses without bias terms, i.e., b c = 0. This CS based MSVM classifier is trained by solving the primal problem
min w c 1 2 c = 1 d w c T w c + C n = 1 l η n
subject to n { 1 , , l } , c { 1 , , d } { y n } : ( w y n w c ) T ϕ ( x n ) 1 η n and η n 0 where η n refers to ‘slack’ variables for each data item, in such a way that the margin between the correct class and the most confusing class is penalized. For learning structured data, CS’s method is usually the MSVM algorithm of choice taking all class relations into account at once to solve a single optimization problem with fewer slack variables.

3. Results and Discussion

Four types of cattle calls namely food anticipation calls, estrus calls, cough sounds, and normal calls which have been used are shown in Table 1.
In Figure 2, the spectrograms of different audio samples corresponding to food anticipation, estrus, cough sound, and normal vocals are shown for illustration.
To reduce the redundancy while maintaining the variability of the contextual features, the decimated version of the feature set is considered to be a kind of feature selection. A decimation factor of 8 is used here which reduces the length of the features from 128 to 16. For illustration the average of all the (16 × 1) features for each types of cattle vocals are plotted in Figure 3.
For simulations, 70% of the total data samples are used for training while the remaining 30% are used for prediction (testing). Each feature set is normalized to zero-mean and unit standard deviation prior to use for classification. The results presented here are the average results of 50 different realizations. For each realization, the configurations of the training and therefore, the testing sets, are changed randomly. Here we selected the default MSVM parameter C (regularization parameter) and γ (bandwidth parameter) of the radial Gaussian kernel k ( x ; x ) = exp ( γ | | x x | | 2 ) as C = 10 and γ = 2 [12]. The average of the confusion matrices of the MSVM classification over all realizations using the contextual feature set is presented in Table 2 providing the average classification accuracy of 84%. Please note that both the sensitivity and specificity are highest for the estrus which has the largest number of samples (i.e., vocalizations).
The average classification accuracy (%) for various feature size (M) are listed in Table 3, where M = 16 gives the best result by the proposed scheme.
The comparison results with MFCC (mel frequency ceptral coefficients) [13] features using the same training setup are presented in Table 4. The parameters for the MFCC are set as follows: MFCC window length = 20 ms (320 samples), number of MFCC features = 12, MFCC window overlapping = 50%. The best average classification accuracy with the MFCC features is obtained as 60.81%.
The performance of the proposed method is promising in terms of classification accuracy = TP + TN ( TP + FP ) + ( TN + FN ) (where TP: True Positive, FP: False Positive, TN: True Negative, FN: False Negative) which outperforms the results obtained by the MFCC features (c.f. Table 2 and Table 4).

4. Conclusions

This paper introduces a new acoustical method for automatic livestock monitoring in smart farms. The proposed framework is found to be effective in classifying various types of cattle sounds analyzed herein. Preliminary experimental results showed improved performance by the contextual features over the MFCC features. Future works include the use of larger dataset to improve the performance as well as analyze other types of animal vocalizations, e.g., poultry, sheep, with the aim to deliver the highest levels of animal welfare for precision livestock farming.

Funding

This research received no external funding.

Institutional Review Board Statement

Not applicable.

Informed Consent Statement

Not applicable.

Data Availability Statement

Not applicable.

Conflicts of Interest

The author declares no conflict of interest.

References

  1. Banhazi, T.M.; Lehr, H.; Black, J.L.; Crabtree, H.; Schofield, C.P.; Tscharke, M.; Berckmans, D. Precision Livestock Farming: An International Review of Scientific and Commercial Aspects. Int. J. Agric. Biol. Eng. 2012, 5, 1–9. [Google Scholar] [CrossRef]
  2. Jung, D.-H.; Kim, N.Y.; Moon, S.H.; Jhin, C.; Kim, H.-J.; Yang, J.-S.; Kim, H.S.; Lee, T.S.; Lee, J.Y.; Park, S.H. Deep Learning-Based Cattle Vocal Classification Model and Real-Time Livestock Monitoring System with Noise Filtering. Animals 2021, 11, 357. [Google Scholar] [CrossRef] [PubMed]
  3. Vandermeulen, J.; Bahr, C.; Johnston, D.; Earley, B.; Tullo, E.; Fontana, I.; Guarino, M.; Exadaktylos, V.; Berckmans, D. Early Recognition of Bovine Respiratory Disease in Calves using Automated Continuous Monitoring of Cough Sounds. Comput. Electron. Agricult. 2016, 129, 15–26. [Google Scholar] [CrossRef] [PubMed]
  4. Galli, J.R.; Cangiano, C.A.; Pece, M.A.; Larripa, M.J.; Milone, D.H.; Utsumi, S.A.; Laca, E.A. Monitoring and Assessment of Ingestive Chewing Sounds for Prediction of Herbage Intake Rate in Grazing Cattle. Animal 2018, 12, 973–982. [Google Scholar] [CrossRef] [PubMed]
  5. Baciadonna, L.; Briefer, E.F.; Favaro, L.; McElligott, A.G. Goats Distinguish Between Positive and Negative Emotion-Linked Vocalisations. Front. Zool. 2019, 16, 2–11. [Google Scholar] [CrossRef] [PubMed]
  6. Röttgen, V.; Schön, P.C.; Becker, F.; Tuchscherer, A.; Wrenzycki, C.; Düpjan, S.; Puppe, B. Automatic Recording of Individual Oestrus Vocalisation in Group-Housed Dairy Cattle: Development of a Cattle Call Monitor. Animal 2020, 14, 98–205. [Google Scholar] [CrossRef] [PubMed]
  7. Schön, P.C.; Hämel, K.; Puppe, B.; Tuchscherer, A.; Kanitz, W.; Manteuffel, G. Altered Vocalization Rate During the Estrous Cycle in Dairy Cattle. J Dairy Sci. 2007, 90, 202–206. [Google Scholar] [CrossRef]
  8. Available online: https://www.mdpi.com/2076-2615/11/2/357/s1 (accessed on 24 September 2021).
  9. Oppenheim, A.V.; Schafer, R.W. Digital Signal Processing; Prentice-Hall: Hoboken, NJ, USA, 1975. [Google Scholar]
  10. Proakis, J.; Manolakis, D. Digital Signal Processing: Principles, Algorithms and Applications; Macmillan Publishing Company: New York, NY, USA, 1992. [Google Scholar]
  11. Crammer, K.; Singer, Y. On the Algorithmic Implementation of Multiclass Kernel-Based Vector Machines. J. Mach. Learn. Res. 2001, 2, 265–292. [Google Scholar]
  12. Mishra, A. Multi Class Support Vector Machine. MATLAB Central File Exchange. 2021. Available online: https://www.mathworks.com/matlabcentral/fileexchange/33170-multi-class-support-vector-machine (accessed on 15 October 2021).
  13. Devi, M.R.; Ravichandran, T. A Novel Approach for Speech Feature Extraction by Cubic-Log Compression in MFCC. In Proceedings of the IEEE Conference on Pattern Recognition, Informatics and Mobile Engineering, Salem, India, 21–22 February 2013. [Google Scholar]
Figure 1. The general outline of multiclass classification for identifying cattle vocals.
Chemproc 10 00089 g001
Figure 2. Illustrative spectrogram plots for various cattle vocal samples referring to (a) food anticipation call, (b) estrus call, (c) cough sound, (d) normal call.
Chemproc 10 00089 g002
Figure 3. Plots for the average of the contextual features for each types of cattle calls; ’blue’ : food anticipation, ’green’ : estrus, ’red’ : cough, ’black’ : normal calls.
Chemproc 10 00089 g003
Table 1. Number of various cattle vocalizations (calls) used.
Type of VocalizationNumber of Vocalization
Food anticipation100
Estrus117
Cough11
Normal42
Table 2. Confusion matrix with the contextual feature set where the average classification accuracy (%) is shown in the right bottom corner (bold face) calculated from the confusion matrix as Sum   of   diagonal   elements Sum   of   all   elements .
Food AnticipationEstrus Cough Normal Specificity
Food anticipation243010.85
Estrus629000.82
Cough00110.50
Normal10090.90
Sensitivity0.770.9010.8184.00
Table 3. Average classification accuracy (%) for different feature size M.
M81632
Average accuracy (%)78.6784.0080.82
Table 4. Confusion matrix with the MFCC feature set where the average classification accuracy (%) is shown in the right bottom corner (bold face) calculated from the confusion matrix as Sum   of   diagonal   elements Sum   of   all   elements .
Food AnticipationEstrus Cough Normal Specificity
Food anticipation234100.82
Estrus1815010.44
Cough20000
Normal30070.70
Sensitivity0.500.7800.8760.81
Publisher’s Note: MDPI stays neutral with regard to jurisdictional claims in published maps and institutional affiliations.

