1. Introduction
With 767 million people still living in extreme poverty [
1], investments in agriculture prove very effective in reducing economic hardship. This is one reason why there exists an urgent need to promote innovative technologies for the optimal management of irrigation systems and water resources. It is possible for an irrigation system to be dynamically adjusted to the water demand of each crop [
2], by implementing a network of pipes terminated by emitters that deliver water to the soil as droplets or spray [
3]. Irrigation sprinklers are the most basic component of such a system and vary from one-piece sprinklers to highly complex designs such as a transmitter with multiple assemblies working together as a single unit [
4]. It is important to understand the features of each emission source to best design a solution to meet the water demand of a crop [
5].
The main emitters selected for field work in this research are sprinklers, micro-sprinklers, and drippers. High-pressure sprinklers are designed to cover large irrigation diameters from 20 m to 40 m and typically require operation at more 20 m water columns (mwc). A micro-sprinkler allows water to be discharged to the ground in a circular pattern, and the irrigation diameter is smaller: from 3 m to 15 m. These work from 10 mwc to 35 mwc. Compared to sprinklers and micro-sprinklers, drippers are designed to use water most efficiently from 4 mwc to 25 mwc and maintain optimal plant humidity [
6].
The discharge coefficient Ke is determined as a function of the flow rate and working pressure of the emitter. Ke is fundamental for the proper modelling and control of irrigation systems because it includes both the hydraulic performance of the emitter and its discharge under different pressure conditions [
7], which ultimately reflects the amount of water delivered to the plant. To obtain the homogeneous and high yield of agricultural products, the available water resources must be used effectively [
8].
2. Methods
To explain the methodology, the Mini Wobbler micro-sprinkler (1/2″) was used, and the following sequence was applied.
2.1. Recognition and Topographical Mapping
This mainly included field work, identifying, and analyzing the characteristics of the study area. A topographical mapping of the study area was conducted to obtain the topographical features of the sector and to establish the final topological structure of the irrigation system pipe network.
2.2. Network Design
For the study network design, the hydraulic gradient method was used. The design and analysis considered the nominal flow demand of the emitter with the highest hydraulic requirements, and the continuous and local losses in the network. As a result, two networks were created. One was low-pressure gravity fed and the other used a high-pressure pumping system.
2.3. Installation of Irrigation System with the Emitters to Be Evaluated and Calibration of Electronic Equipment
This consisted of the installation of the materials and equipment of the study network, followed by the calibration of the sensors used to measure the pressure and flow rate of the emitters deployed.
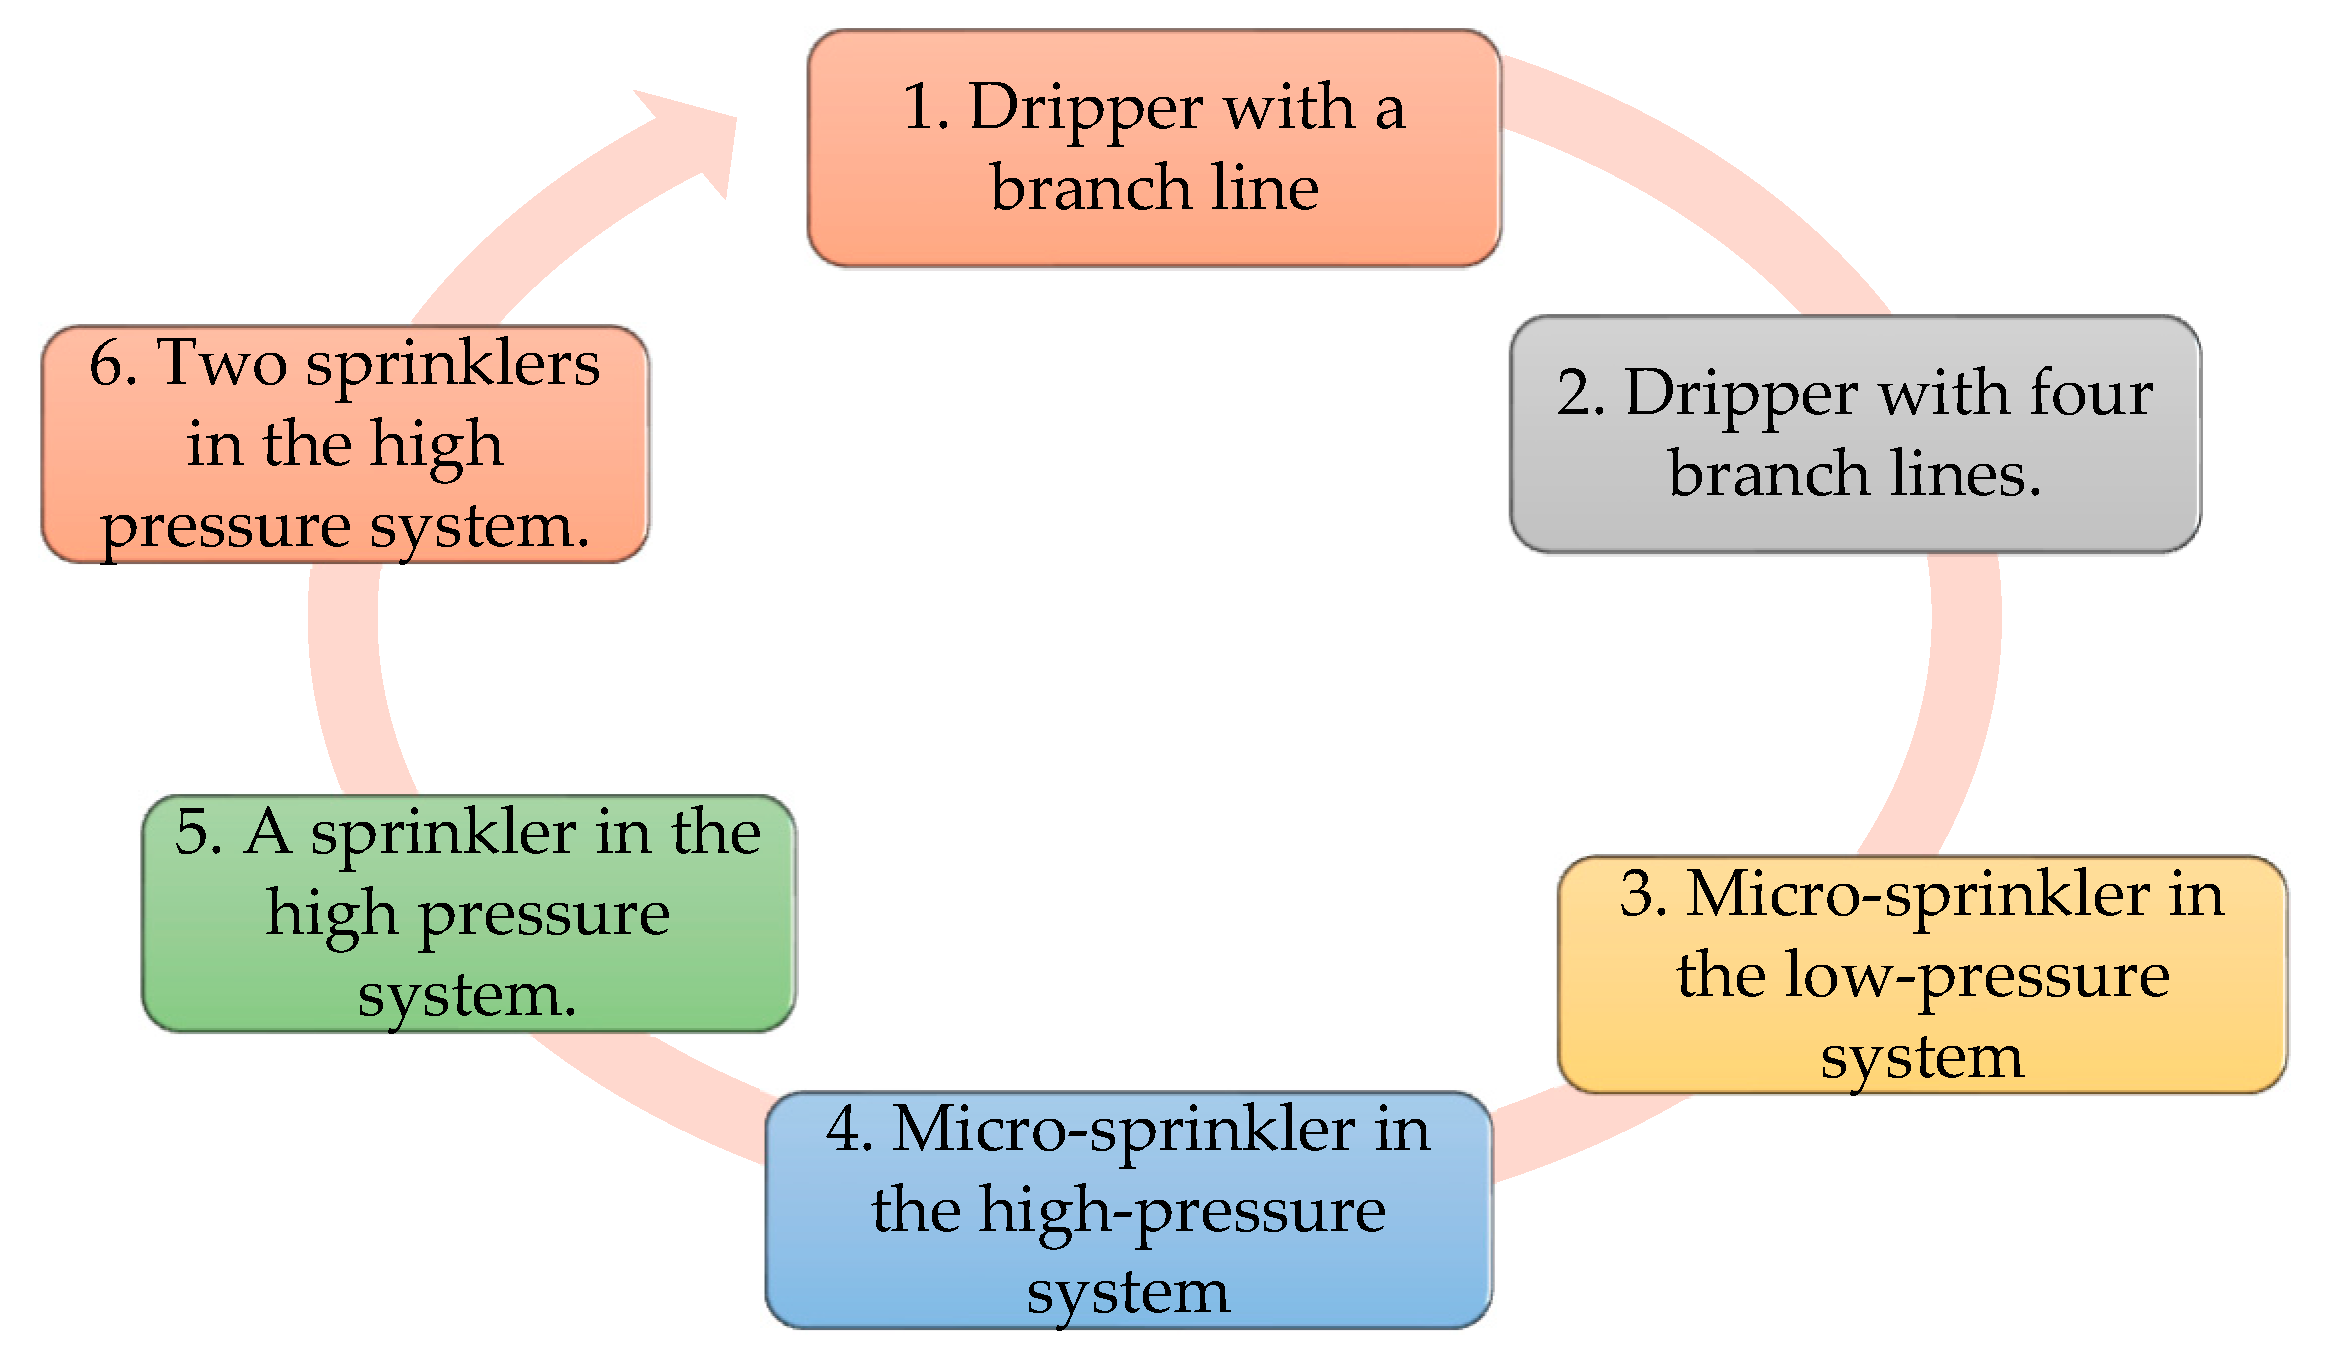
2.4. Obtaining Experimental Data
The pressure and flow data were measured electronically, and the logged values were constantly double-checked with analogue measurements. The data collection time for each emitter was 30 min, in the following order (
Figure 1):
2.5. Calculation and Analysis of Ke Discharge Coefficients of Selected Emitters
To calculate the emitter Ke flow coefficient, the flow equation proposed by [
9] in Equation (1) was used:
where
CU is the coefficient of uniformity (application);
indicates the average flow rate of the 25% of the emitters with the lowest flow rate (L/h); and
is the average design flow rate (L/s).
Replacing in the discharge equation of this emitter Equation (2):
where
is the discharge flow rate of the emitter in (L/h);
is the discharge coefficient of the emitter (dimensionless);
is the hydraulic inlet pressure of the water at the emitter, in mwc or KPa; and finally,
x is the emitter coefficient depending on the flow regime (dimensionless).
Replacing values in Equations (1) and (2), the value of
Ke Equation (3) is obtained:
For the MegaNet nozzle (orange 650 L/h), the following specification was available, as seen in
Table 1.
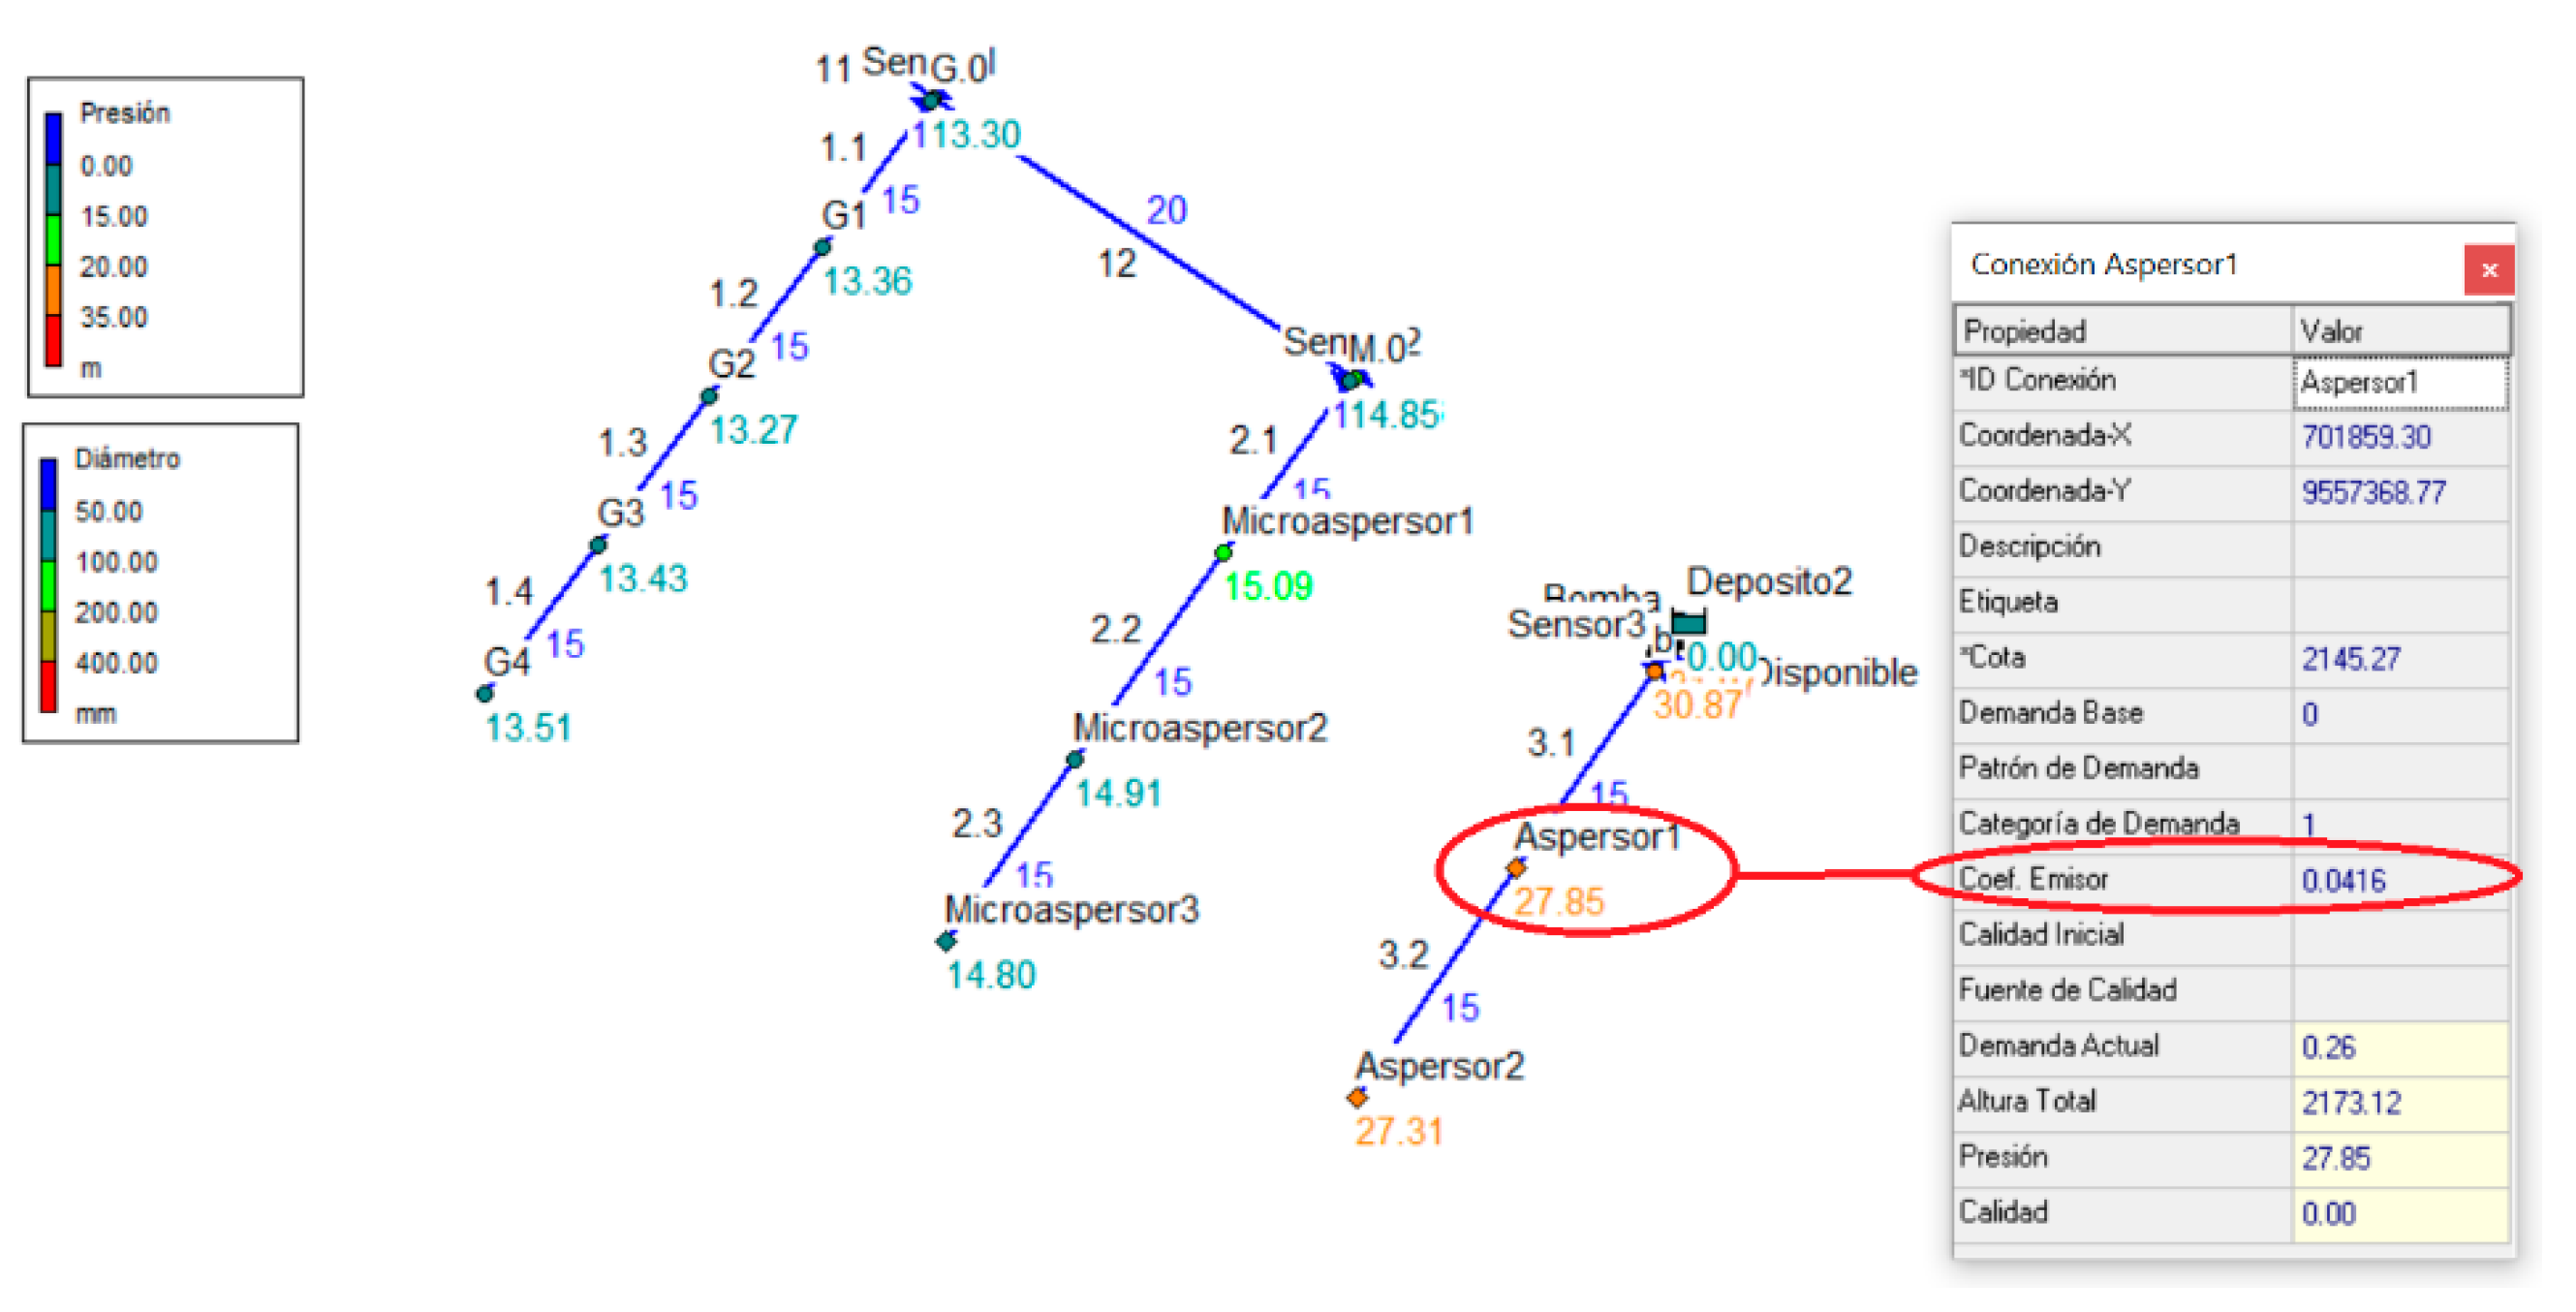
2.6. Modelling of the Ke Coefficient of Sprinklers and Micro-Sprinklers in the Study Network Using the Free Software EPANET 2.0 v.E
The Ke coefficients obtained from the emitter discharge equation were used, and the Epanet 2.0 software, Rossman, Cincinnati, United States, tool was used to model the research network with the implementation of sprinklers, micro-sprinklers, and drippers to analyze their hydraulic performance (
Figure 2) [
10].
2.7. Obtaining the Real Flow Rate Discharged by the Emitters in the Laboratory and Comparing It with That Obtained by Sensors
The realized flow rate was verified using the electronic data acquisition system, and the actual flow rate discharged by each emitter was quantified in the laboratory. For this purpose, the volume of water delivered by the emitter was collected over a period of 10 min.
3. Results and Discussion
3.1. Results
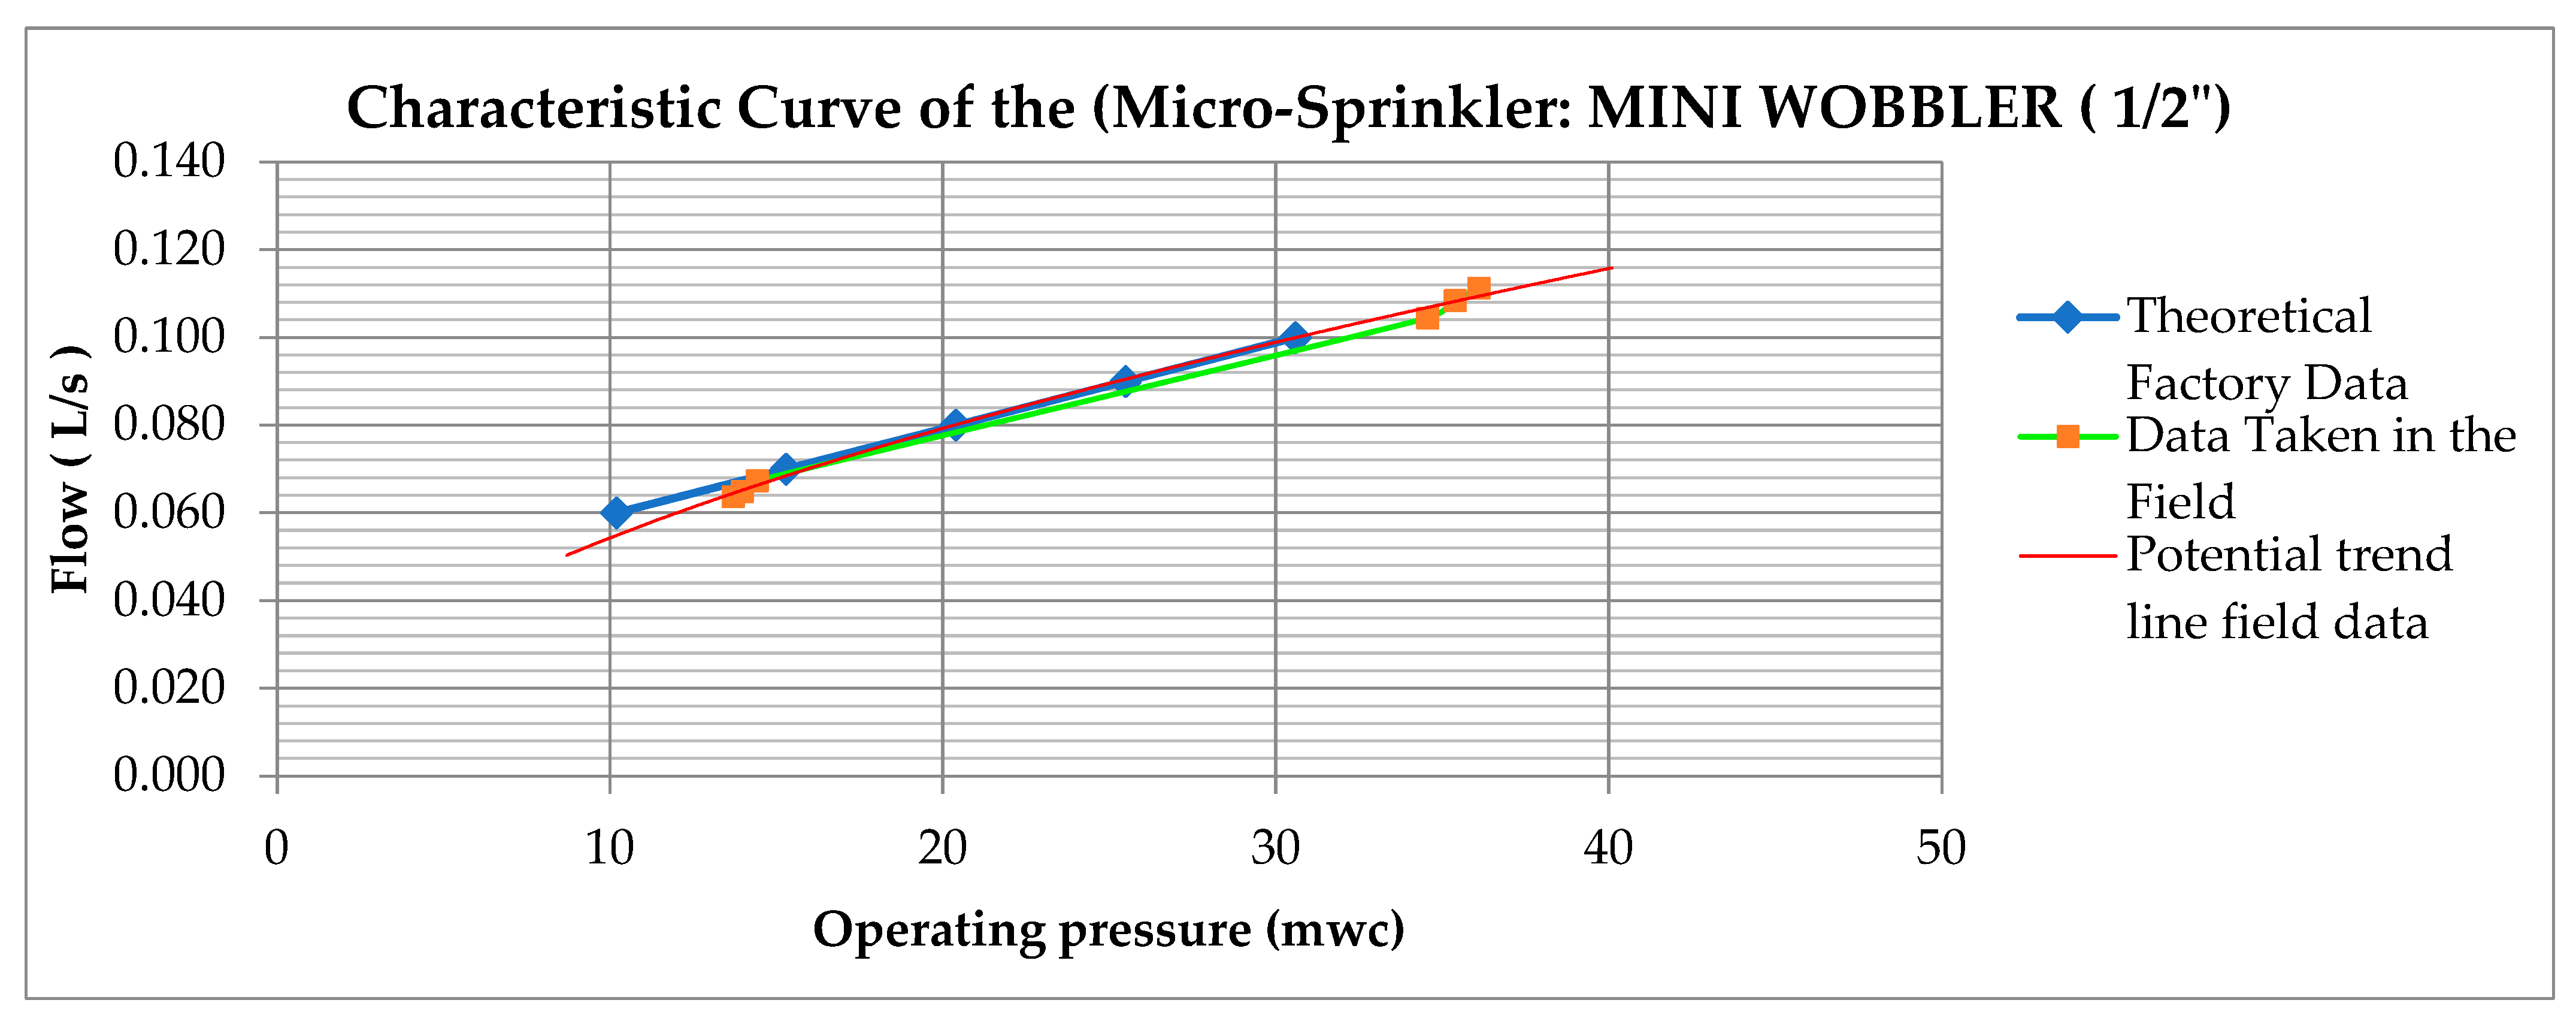
Table 2 shows the factory and field data of the Mini Wobbler micro-sprinkler and the discharge coefficients obtained. The coefficients show greater variation if the working pressure is very low or very high. It is therefore recommended to work at pressures between 1.5 bar and 2.5 bar. With the pressure and flow data obtained in the field, the characteristic equation for this emitter is obtained (Equation (4)):
Equation (4) represents the flow rate obtained under different pressures; the exponent discharge is close to 0.5 so it operates in a turbulent regime.
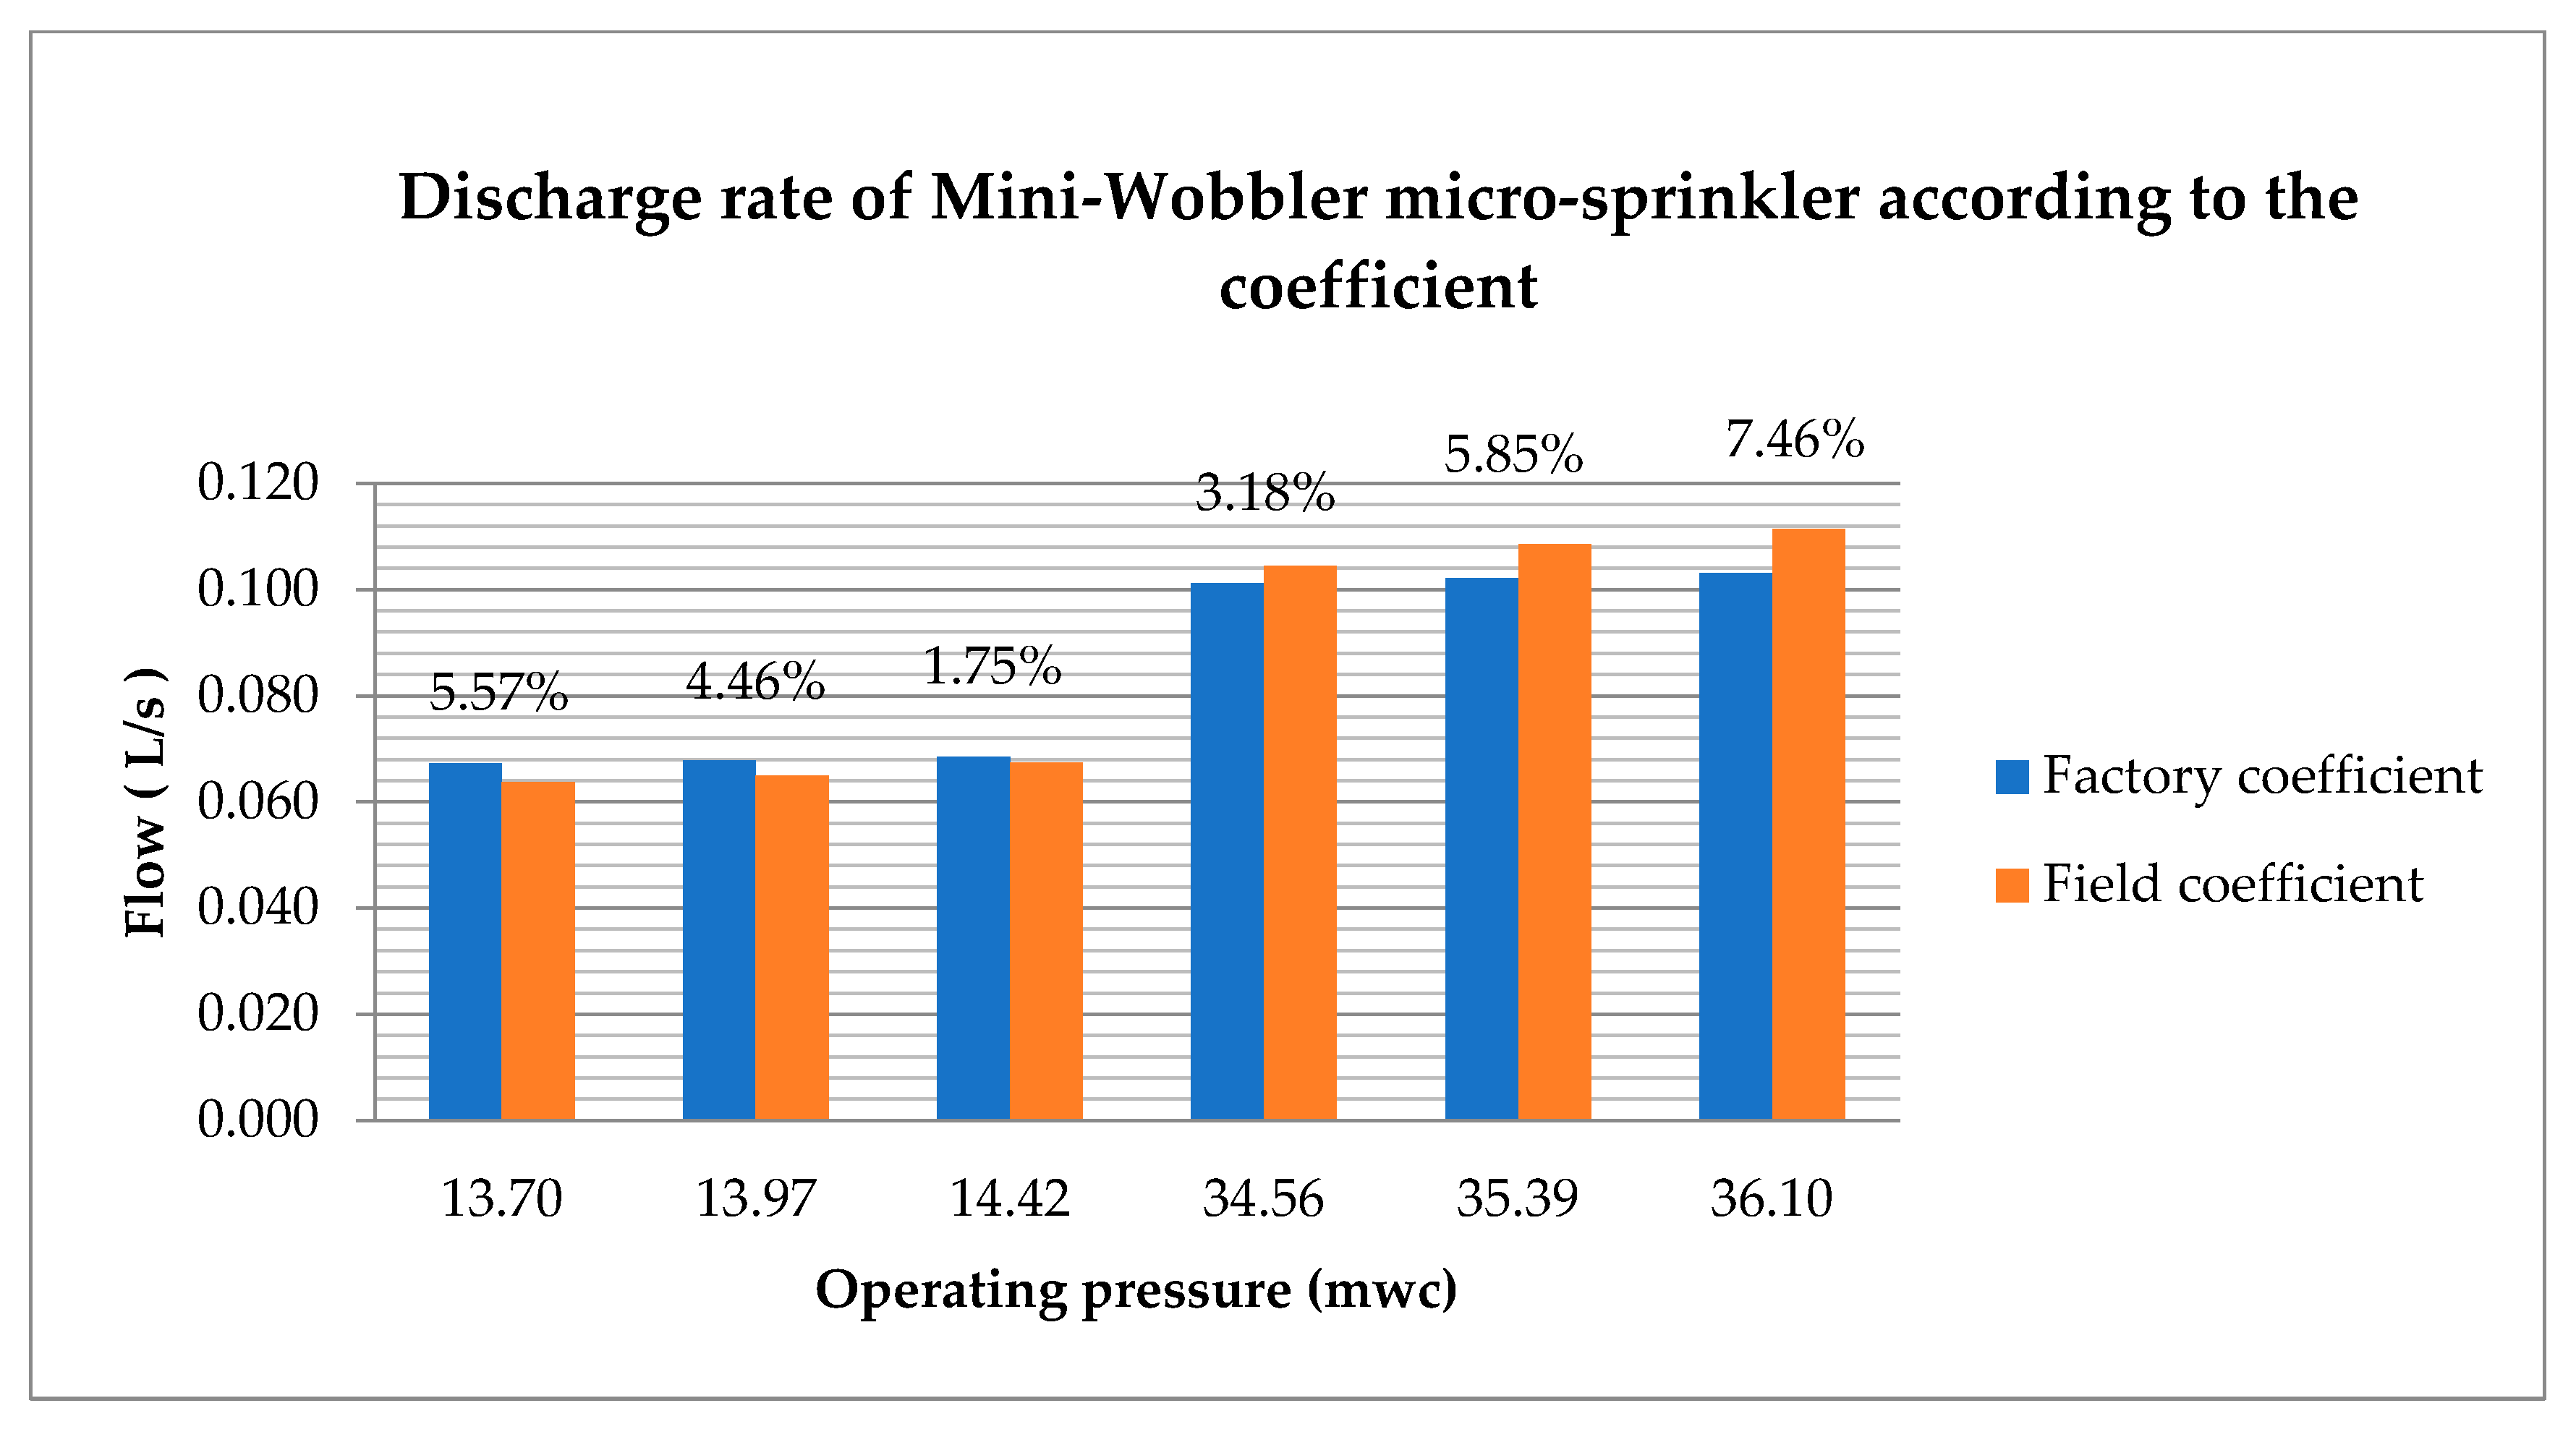
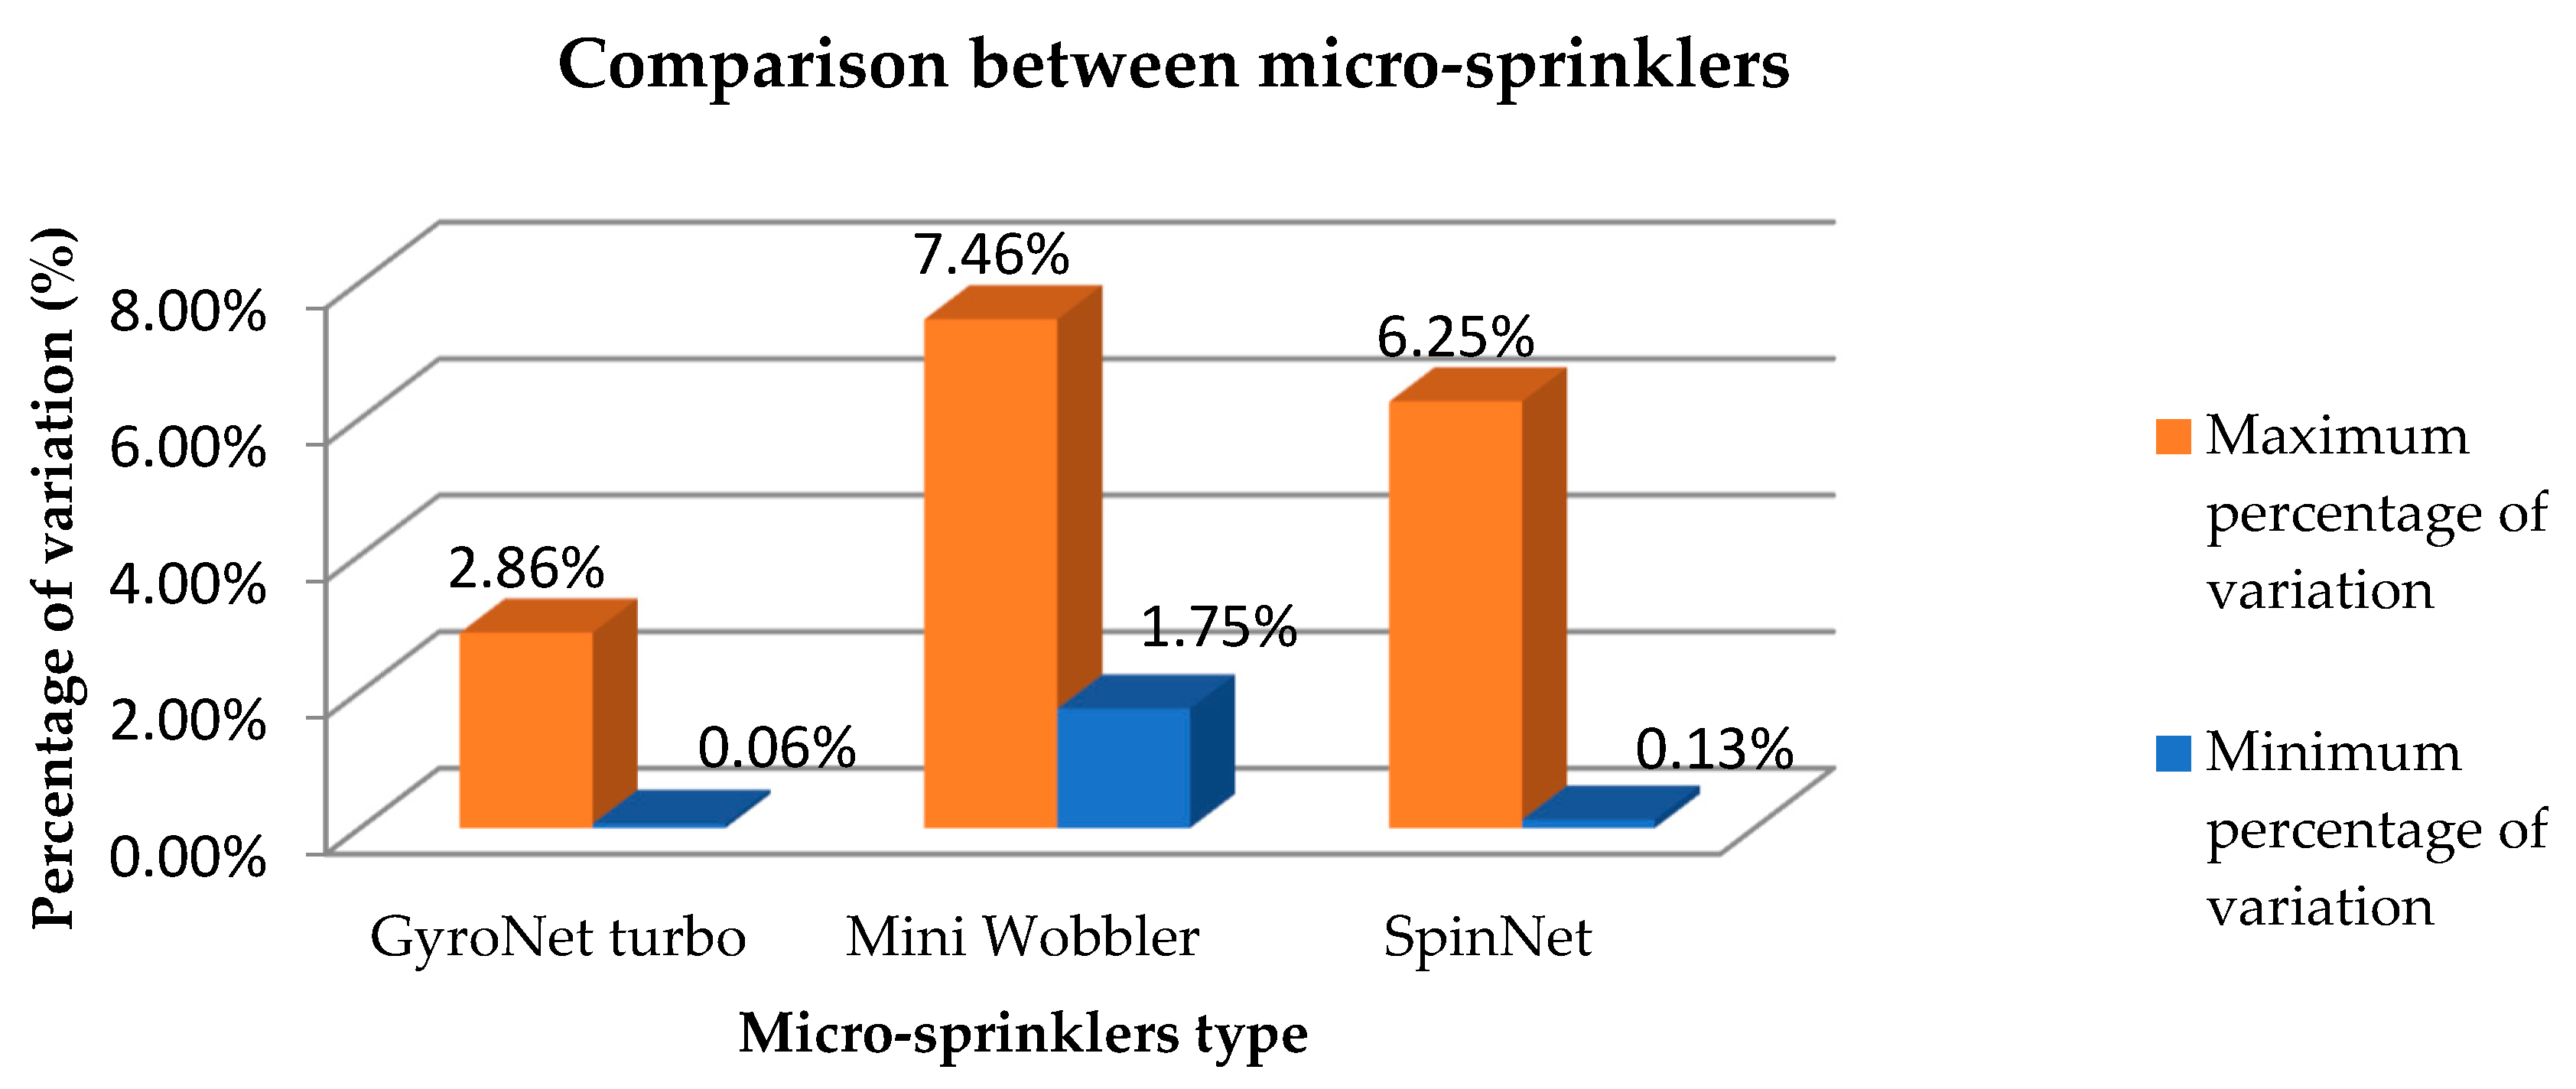
Figure 3 shows the difference between the discharge flow rate values obtained in the field and the flow rate values provided by the manufacturer operating at various working pressures, resulting in a minimum variation of 1.75% and a maximum variation of 7.46%.
The characteristic curve and trend line of the field-measured flow and pressure of the ½″ Mini Wobbler micro-sprinkler (
Figure 4) showed a significant variation, especially when the working pressure of the emitter was either very low or very high.
3.2. Discussion
3.2.1. Variation of Discharge Coefficients of Used Emitters
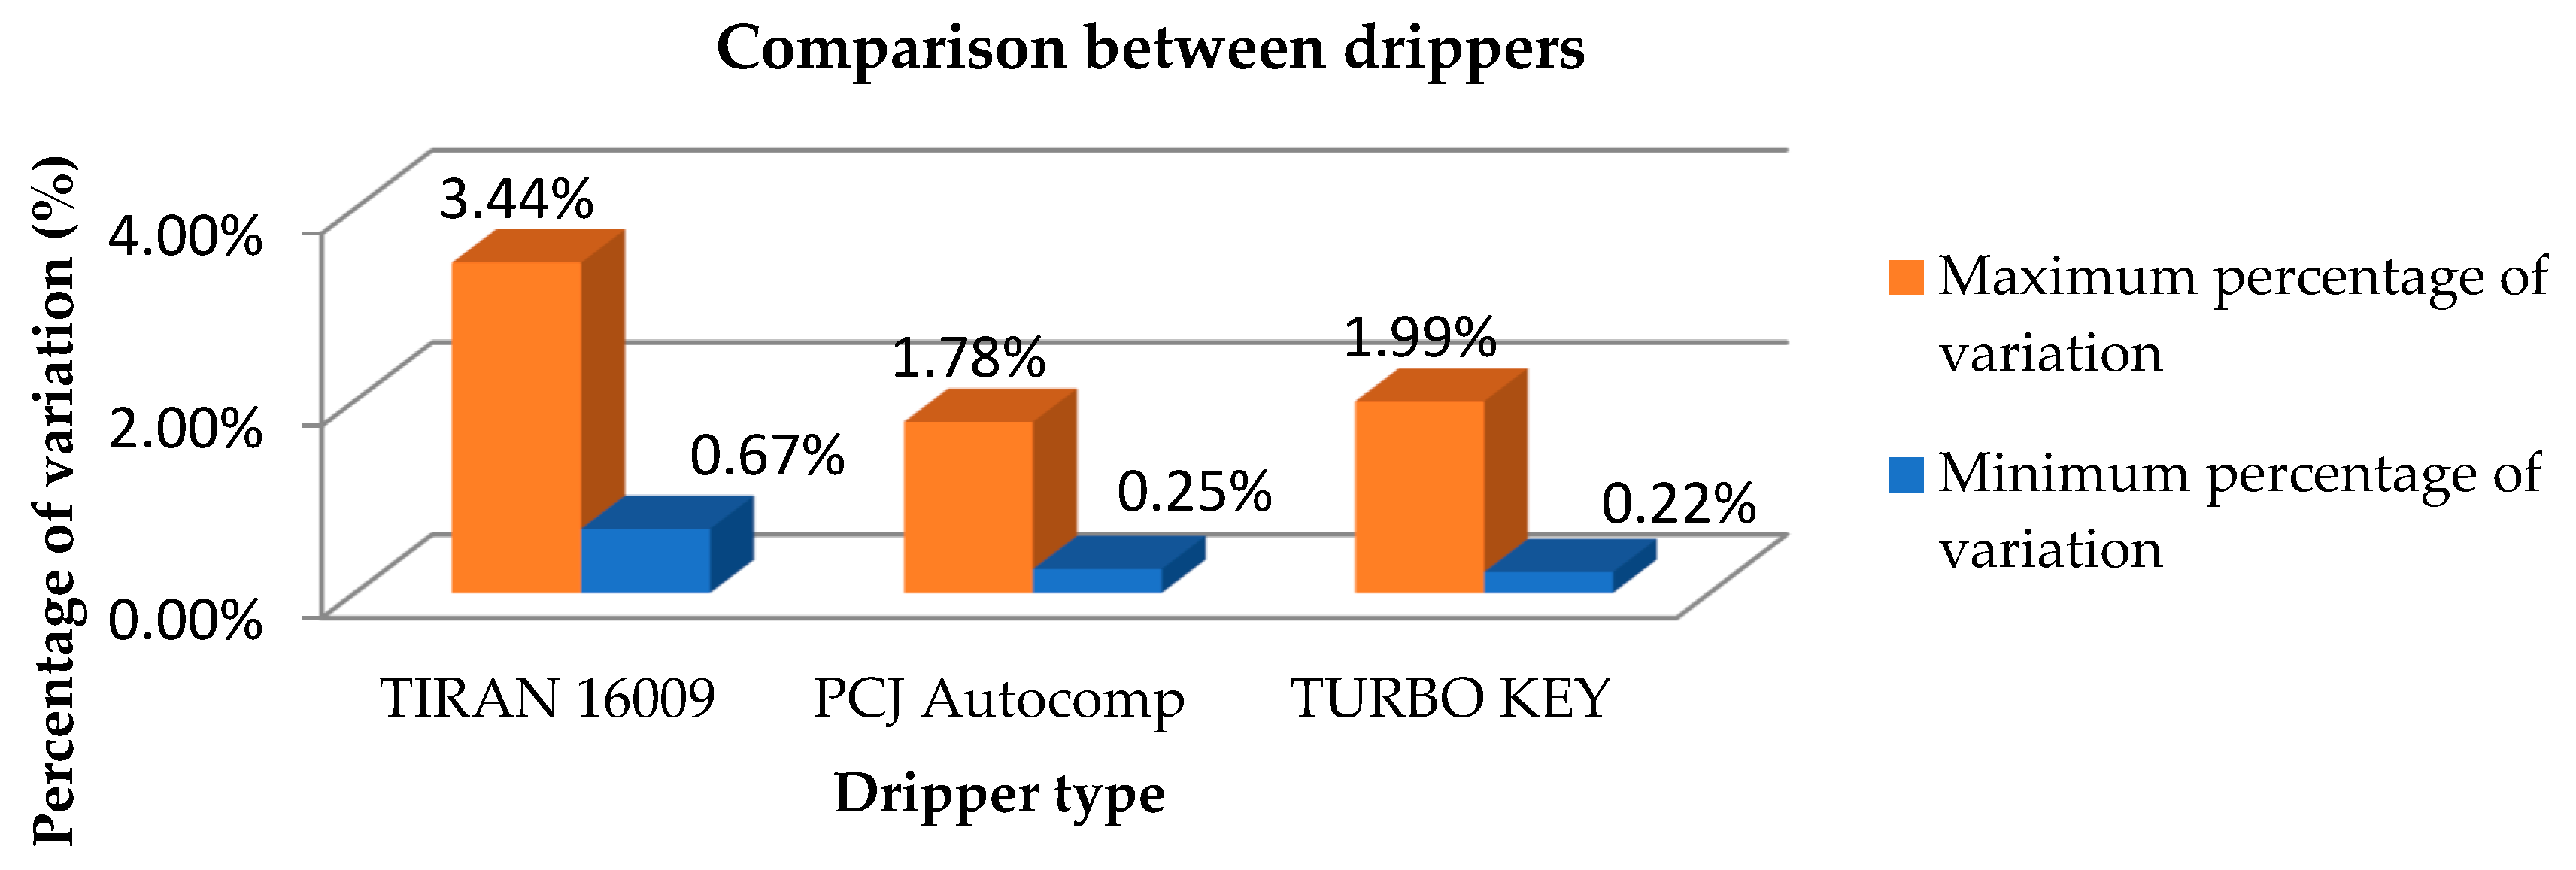
Figure 5 shows the types of drippers that were analyzed, and the maximum and minimum percentage of variation between the Ke discharge coefficients which were obtained with the factory data and those resulting in the field. It was verified that the self-compensating PCJ dripper presents less variation in the data provided by the manufacturer.
Figure 6 shows the maximum and minimum percentage variation of Ke values considering the factory and field data for all types of micro-sprinklers that were examined. It was observed that the GyroNet turbo micro-sprinkler is the most efficient and presents the lowest percentage of variation.
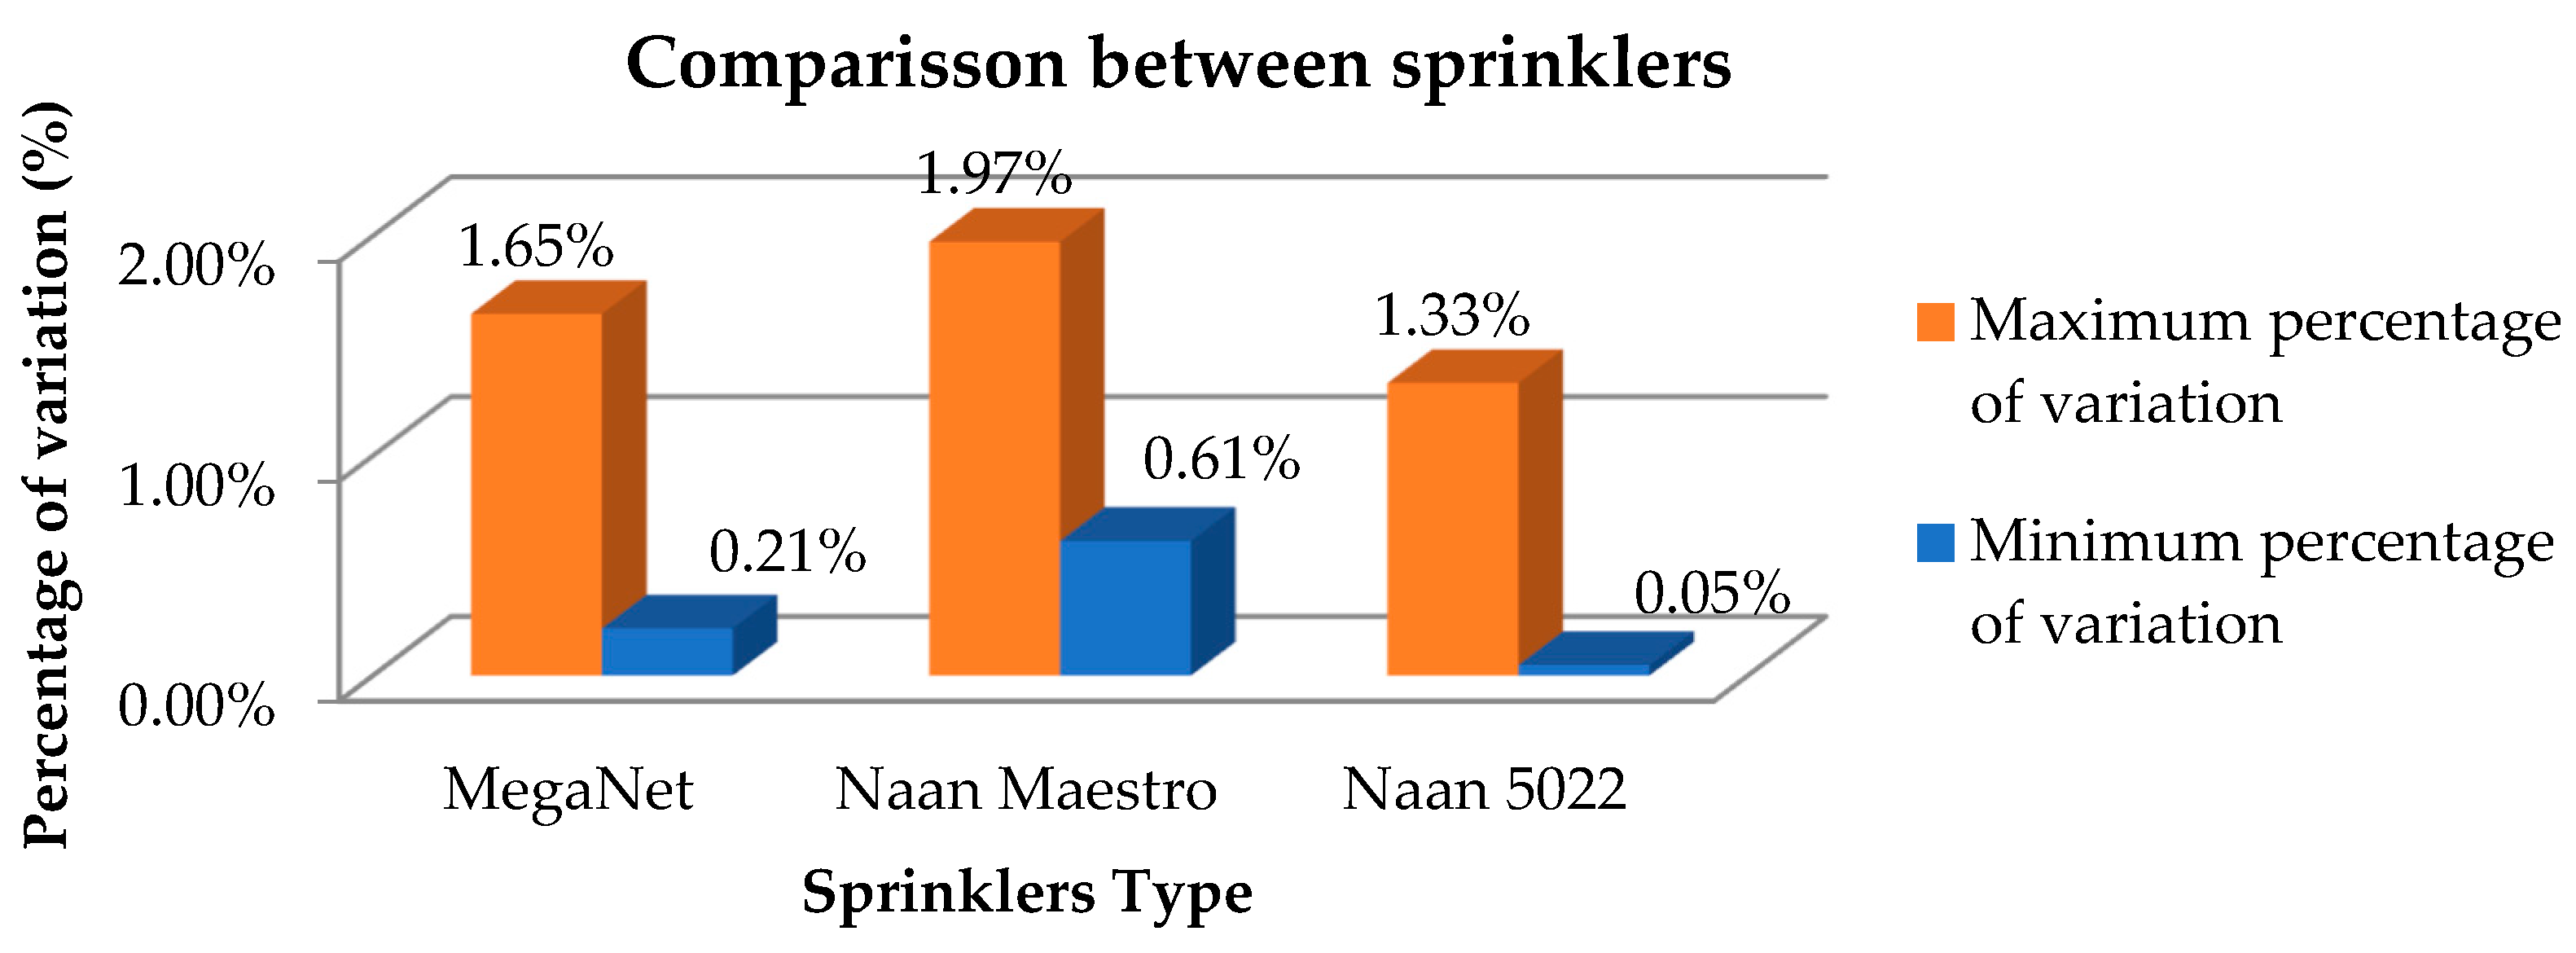
Figure 7 shows the maximum and minimum percentage variation that each type of sprinkler presented with respect to their discharge coefficients, and a comparison was made between them. As a result, it was found that the Naan 5022 sprinkler has less variation between the data obtained in the field and the data provided by the manufacturer.
3.2.2. Modelling Results in Epanet 2.0 Discharge Coefficients
Table 3 shows the results of the flow variation of the emitters tested in the field, and the flows modelled in the Epanet 2.0 software. The variation is minimal, so it is affirmed that the modelling carried out with the discharge coefficients calculated correctly represents the hydraulic performance of the emitters in the field.
Table 4 shows the comparison between the flow rates measured in the field and those resulting from the modelling in the Epanet 2.0 software. These data show a minimal variation between them, which allows us to confirm that the Ke discharge coefficients calculated are suitable for obtaining accurate results when modelling the hydraulic characteristics of an irrigation network.
4. Conclusions
Nine types of emitters were evaluated (three sprinklers, three micro-sprinklers, and three drippers). The pressure heads with the lowest percentage variation between the technical specifications of the catalogue and the data obtained in the field were determined, including Naan 5022 head, where the maximum percentage variation was 1.33%; GyroNet micro head, where the maximum variation value corresponded to 2.86%; and the self-compensating dripper PCJ, which obtained a maximum variation of 1.78%. Moreover, it was possible to obtain their corresponding discharge equations.
Using the flow and pressure data of each emitter, characteristic curves were generated. It was evident that the flow coefficients were close to 0.5, which indicates that these nozzles worked in a turbulent state for the sprinklers and micro-sprinklers and some drippers tested. The PCJ dripper is a self-compensating type, and its characteristic curve was different. Its discharge rate value was close to zero, and its characteristic curve corresponded to a straight line within the range of the working pressure.
The data obtained in situ using the electronic data acquisition system were evaluated in the laboratory using the actual emitter emission rate. The analysis showed that the variation of the discharge coefficients between field and catalogue data for all emitters was less than 2%, which ensured that the field data used in this research were reliable and representative.
Author Contributions
All authors contributed extensively to the work presented in this paper. Conceptualization, C.M.L.P. and H.M.B.-M.; Data curation, J.J.A.; Investigation, C.M.L.P., J.J.A. and H.M.B.-M.; Methodology, C.M.L.P., J.J.A. and H.M.B.-M.; Supervision, H.M.B.-M. and R.A.-S.; Writing—original draft, C.M.L.P. and H.M.B.-M.; Writing—review & editing, J.J.A., F.J.M.-S., H.M.B.-M. and R.A.-S. All authors have read and agreed to the published version of the manuscript.
Funding
This work was supported by the Universidad Técnica Particular de Loja.
Institutional Review Board Statement
Not applicable.
Informed Consent Statement
Not applicable.
Data Availability Statement
The data in this study are accessible. Please contact the corresponding author if necessary.
Acknowledgments
The authors are very grateful to the Universidad Técnica Particular de Loja and Eng. Carlos Calderon who contributed effectively to the development of this work.
Conflicts of Interest
The authors declare no conflict of interest.
References
- Ending Poverty and Hunger by Investing in Agriculture and Rural Areas. Fao.org. 2017. Available online: https://www.fao.org/policy-support/tools-and-publications/resources-details/es/c/1027619/ (accessed on 13 January 2022).
- Fernandes, L.; Friedrich, M.; Cóstola, D.; Matsumoto, E.; Labaki, L.; Wellershoff, F. Evaluación de los coeficientes de descarga de grandes ventanas que se pueden abrir utilizando muestras a escala real en ensayos en túneles de viento. Rev. Ing. Constr. 2020, 35, 203–214. [Google Scholar] [CrossRef]
- Cruz-Mayo, P.; Aguilar, A. Evaluación de la operación de un tramo del canal principal de riego con un enfoque económico. Tecnol. Cienc. Agua 2022, 13, 89–143. [Google Scholar] [CrossRef]
- Pazmiño-Mayorga, J.A.; Vivas-Vivas, R.J.; Tafur-Recalde, V.L.; Ordóñez-Pizarro, W.I. Determinación del coeficiente de descarga de un prototipo tubo de Venturi construido para uso académico en laboratorio. Polo Conoc. 2017, 2, 1081. [Google Scholar] [CrossRef]
- Liotta, M. Los Sistemas de Riego por Goteo y Micro-Aspersión. 2000. Available online: https://inta.gob.ar/sites/default/files/script-tmp-articulo_riego_presurizado.pdf (accessed on 13 January 2022).
- Chamba, D.; Zubelzu, S.; Juana, L. Hydraulic characterization of field drip irrigation. Ing. Agua 2020, 24, 31–47. [Google Scholar] [CrossRef]
- Rodríguez Santos, J.; Gómez De La Torre, M.; Arellano Guevara, A.; Romero Castillo, C.; Córdova Rizo, F. Estimación de coeficientes de descarga en orificios circulares de pared delgada, en modelos físicos. Rev. Lasallista Investig. 2018, 15, 20–32. [Google Scholar] [CrossRef]
- Muñoz Rojas, R.A.; Rodríguez Herrera, E.; Ortega Farías, S. Caracterizacion Hidraulica de Cuatro marcas de Emisores para Riego Localizado Comercializados en Chile. Ph.D. Thesis, Universidad de Talca, Talca, Chile, 2004. [Google Scholar]
- Keller, J.; Karmeli, D. Trickle Irrigation Design Parameters. Trans. Am. Soc. Agric. Eng. 1974, 17, 678–684. [Google Scholar] [CrossRef]
- Tello Solano, Y.L. Análisis y Optimización del Sistema de Riego por Aspersión de la Junta Modular Achiliguango, Parroquia Panzaleo, Cantón Salcedo, Provincia de Cotopaxi, Perteneciente al Sistema de Riego Biprovincial Latacunga-Salcedo-Ambato. Bachelor’s Thesis, Facultad de Ingeniería Civil y Mecánica, Carrera de Ingeniería Civil, Universidad Técnica de Ambato, Ambato, Ecuador, 2016. [Google Scholar]
| Publisher’s Note: MDPI stays neutral with regard to jurisdictional claims in published maps and institutional affiliations. |
© 2022 by the authors. Licensee MDPI, Basel, Switzerland. This article is an open access article distributed under the terms and conditions of the Creative Commons Attribution (CC BY) license (https://creativecommons.org/licenses/by/4.0/).


 ,
, 


