Proceeding Paper

SMART GHG Mobile Application: A New Agricultural App for Tracking GHG Emissions and Low-Carbon Rice Production in Thailand’s Local Communities †

by
Nittaya Cha-un
1,2,3,*,
Sirintornthep Towprayoon
1,2,
Amnat Chidthaisong
1,2,
Kittipong Chaimanuskul
3,
Suwapat Maiyarach
4,
Panuwat Sangsuwan
5 and
Pichit Kiatsomporn
6
1
The Joint Graduate School of Energy and Environment (JGSEE), King Mongkut’s University of Technology Thonburi (KMUTT), 126 Prachauthit Rd, Bangmod, Tungkru, Bangkok 10140, Thailand
2
Earth System Science Research and Development Center (ESS), King Mongkut’s University of Technology Thonburi (KMUTT), 126 Prachauthit Rd, Bangmod, Tungkru, Bangkok 10140, Thailand
3
Atthajariya Co., Ltd., 225/9 Lat Phrao Soi 1, Junction 4-3, Jomphol, Chatuchak, Bangkok 10900, Thailand
4
Muang Chang Subdistrict Administrative Organization, Phu Phiang, Nan 55000, Thailand
5
Ban Herb Organic Rice Community Enterprise, Na Kham, Renu Nakhon, Nakhon Phanom 48170, Thailand
6
Ban Suan Taeng Community Rice Center, Muang Suphan Buri, Suphan Buri 72210, Thailand
*
Author to whom correspondence should be addressed.
Presented at the 1st International Online Conference on Agriculture—Advances in Agricultural Science and Technology, 10–25 February 2022; Available online: https://iocag2022.sciforum.net/.
Chem. Proc. 2022, 10(1), 78; https://doi.org/10.3390/IOCAG2022-12259
Published: 14 February 2022

Abstract

:
Rice fields and cultivation activities are sources of greenhouse gas (GHG) emissions. Therefore, quantification of the baseline emissions is necessary to discover and implement the appropriate mitigation options for the transition to low-carbon rice production in order to achieve the Sustainable Development Goals (SDGs) by 2030. This study aimed to track and estimate the baseline GHG emissions and the carbon footprint (C-footprint) from rice cultivation in three farmer communities in Thailand. The SMART GHG mobile application (SGA) was used to calculate the GHG emissions from many cultivation activities and calculate the C-footprint of paddy rice production. The field activity data were collected from 71 farmer households with 134 ha of harvested areas in Muang Chang (MJ) sub-district of Nan province, Suan Taeng (ST) sub-district of Suphan Buri province, and Na Kham (NK) sub-district of Nakorn Phanom province. The results from SGA showed that the total GHG emissions of MJ, ST and NK communities accounted for 7.5, 6.3 and 2.9 tCO2e ha1, respectively. The mean of total GHG emissions from all communities accounted for 5.6 tCO2e ha1. During the rice growing period with flooded fields, the emission of CH4 contributed to 83.4% of the total GHG emissions. Whereas, the cultivation activities of fertilization, field preparation, harvest, and residue burning shared small emissions of 5.4, 4.4, 3.8 and 2.0%, respectively. The SGA also reported the C-footprint of paddy yields by 1.77, 1.10 and 1.09 kgCO2e kg yield1 in MJ, NK and ST, respectively. This study indicated that the SGA can effectively demonstrate and track the GHG emissions and C-footprint, which can be developed into a baseline emission and mitigation for low-carbon rice production. This is a challenge for agriculture and rural community development in Thailand.

1. Introduction

The Sustainable Development Goals (SDGs), or Global Goals, are an urgent call for action to end poverty, protect the planet, and ensure that all people enjoy peace and prosperity [1]. The 17 SDGs are targets for transforming our world by 2030 [2]. Achieving and maintaining global food security (SDG 2), as well as encouraging adaptation, resilience, and mitigation to climate change (SDG 13), are all intertwined [3]. One of the most significant issues we face is climate change. Agriculture is expected to be severely affected by climate change. Extreme weather, such as high temperature, floods and droughts, is having a devastating effect on livelihoods and food security [4]. Approximately 80% of the world’s food is produced on 500 million small-scale farms [5].
Approximately 90% of the world’s rice production is grown in Asia [6]. Rice fields and several activities in rice cultivation processes are a source of greenhouse gas (GHG) emissions. Field activities such as rice straw burning, field preparation by tractor, irrigation by water pump, planting by machine, flooding during the rice growing season, fertilization, and harvest by machine all contribute to climate change through GHG emissions [7]. The field burning of rice straw pollutes the air and also emits methane (CH4) and nitrous oxide (N2O) [8]. In terms of carbon dioxide (CO2) emissions, the main sources are the activities and the operation of agricultural machines use energy for tillage, transplanting, sowing, irrigation pumping and harvesting [9]. Conventional rice cultivation in a flooded field emits CH4 through organic matter decomposition by methanogenic bacteria under anaerobic soil conditions [10]. Moreover, the application of nitrogen (N) fertilizer is the main source for N2O emissions [11].
The Intergovernmental Panel on Climate Change (IPCC) guidelines for the national GHG inventory are widely applied to quantify GHG emissions at the national scale [12,13]. Based on the IPCC guidelines, several techniques or tools for calculating GHG emissions from agricultural sources have been developed in recent decades [7,14]. In Thai rice cultivation systems, Towprayoon et al. [7] developed the system of measurement, reporting and verification (MRV) of rice cultivation. The measurements of GHG emissions of rice cultivation were developed from Clean Development Mechanism (CDM) methodologies and 2006 IPCC Guidelines. In order to facilitate the measuring and reporting system, they have developed an MRV-Rice calculator via excel sheet and tested this calculator in four provinces in Thailand [7]. Furthermore, Wassmann et al. [14] also developed a GHG calculator named SECTOR, which is based on the IPCC Tier 2 approach for rice as well as other crops, and this new calculator was trialed for rice production in Vietnam [14]. The two calculator tools described above are used in XLS files, which can perform well when the number of samples is small, but this is impractical for large scale data collection and storage. In the case of estimating emissions on a large scale, the use of smart tools that are easy to use, perform accurate calculations, track emissions and develop into a big database is therefore necessary.
The SMART GHG application (SGA) is mobile application for Android devices (smart phone and tablet) [15]. SGA was further developed from the Rice-GHG application that used the MRV-Rice system in order to estimate the GHG emissions and C-footprint associated with rice and other crop productions [7,16]. SGA was tested for rice, upland crops and forests in four farmer communities at Nan, Nakorn Phanom, Suphan Buri and Nara Thiwat provinces. It was found that SGA can effectively demonstrate and track the GHG emissions, C-footprint and carbon stock [15].
Agricultural strategies are needed that not only decrease agriculture related GHG emissions, but also allow farmers to boost crop yields, while building resilience and adapting to the expanding number of challenges brought on by climate change. Therefore, quantification of the baseline emissions is necessary to discover the appropriate management practices and mitigation options for the transition to low-carbon rice production in order to achieve the Sustainable Development Goals (SDGs) by 2030. The use of SGA mobile applications for collecting and estimating GHG emissions is necessary to achieve these targets.

2. Materials and Methods

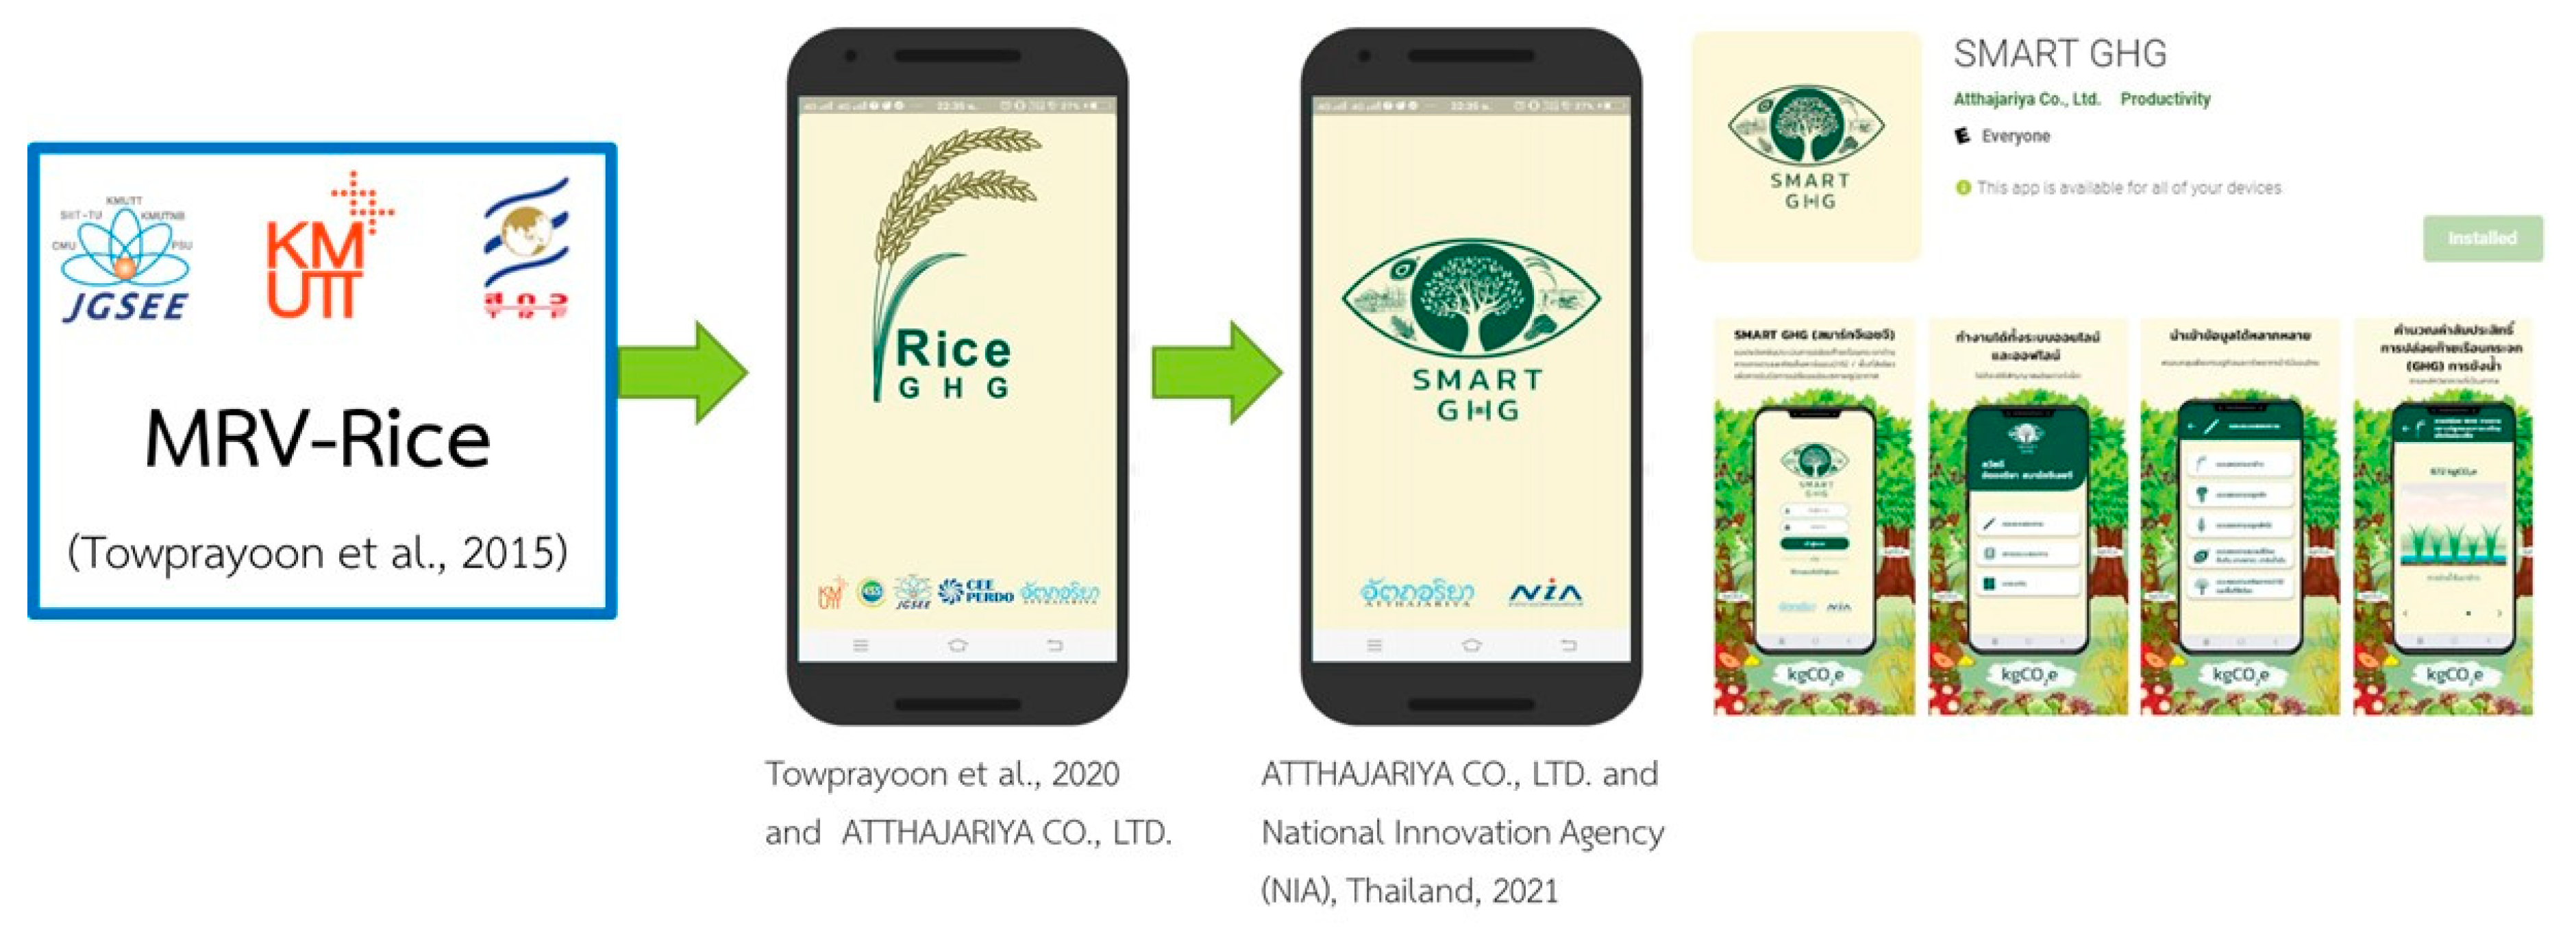
2.1. Overview of SMART GHG Application (SGA)
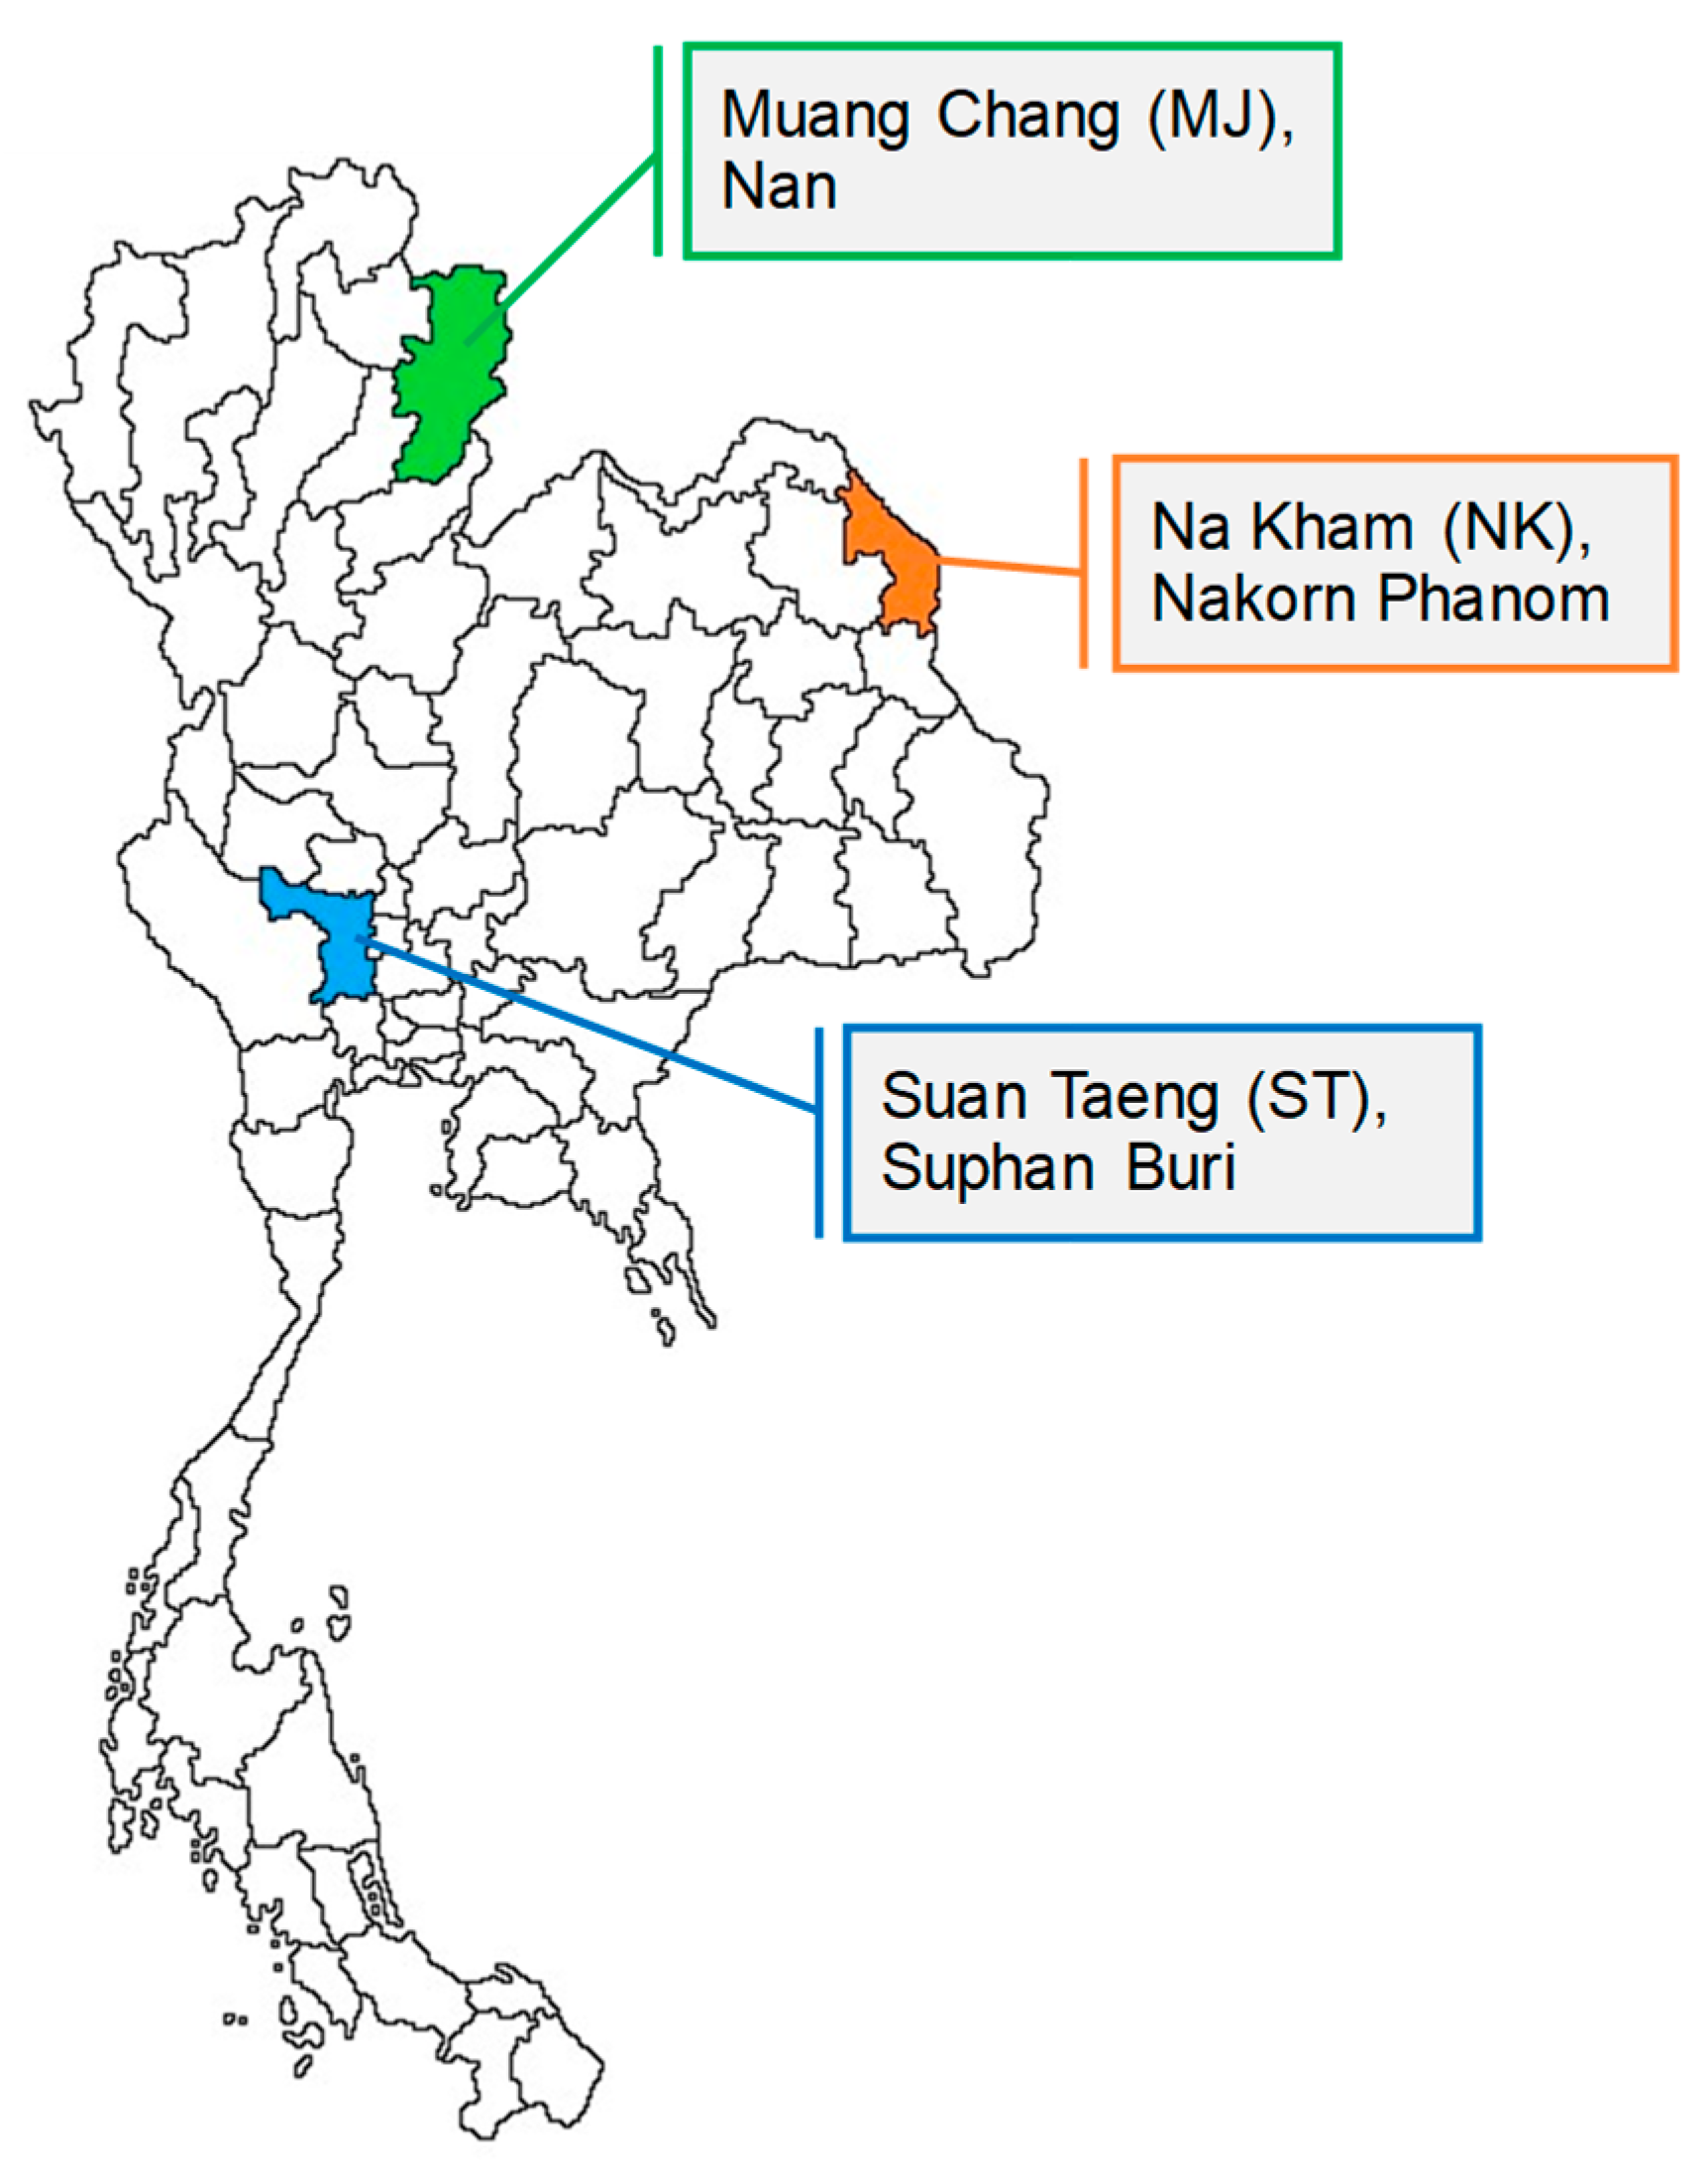
The SMART GHG mobile application (SGA) is a smart tool approach for tracking GHG from rice and other crops. In 2020, Towprayoon et al. [16] from the Joint Graduate School of Energy and Environment (JGSEE), King Mongkut’s University of Technology Thonburi (KMUTT) and Atthajariya Co., Ltd. released an application for Android devices named Rice-GHG as part of a research project funded by the National Research Council of Thailand (NRCT) (Figure 1). Rice-GHG was developed using the MRV-Rice system to estimate the GHG emissions and C-footprint associated to rice production [7,16]. This mobile application was tested with 31 farmer households in five sub-districts of Chai Nat province (Sankhaburi, Hankha, Sapphaya, Watsing and Muang Chainat). In 2021, Rice GHG was further developed into SMART GHG by Atthajariya Co., Ltd., JGSEE-KMUTT, and Kasetsart University (KU), under research funding from the National Innovation Agency (NIA), Thailand [15]. SGA is not only a tool for tracking GHG emissions from rice cultivation, but also for tracking GHG emissions from other crop productions (vegetables, upland crops and fruits), and carbon stocks in the green area and forest.
The version of SGA that was used in this study is the initial version based on the IPCC Tier 1 approach for rice and other crop cultivations. As guided by the IPCC guidelines, the generic methodological approach to estimating the amount of GHG emissions is multiplying the activity data by the emission factor. The climatic impact was calculated using the global warming potential (GWP) based on the CO2, CH4 and N2O emissions [17].
The GHG intensity or C-footprint of rice production is calculated as a ratio of net GWP and rice yield. The rice cultivation activities, their contribution to GHG emissions and calculation methods were presented Table 1.

2.2. Study Sites

At the community level, purposive sampling was used, focusing on farmers who have grown rice in three sub-districts from three provinces: (1) Muang Chang (MJ) sub-district of Nan province, (2) Suan Taeng (ST) sub-district of Suphan Buri province, and (3) Na Kham (NK) sub-district of Nakorn Phanom province) Study sites for MJ, ST and NK are located in the North, Central and Northeast regions of Thailand, respectively (Figure 2). MJ and NK represented the major rice cultivation areas that were grown in the rain-fed areas, whereas ST represented the irrigated rice cultivation areas.

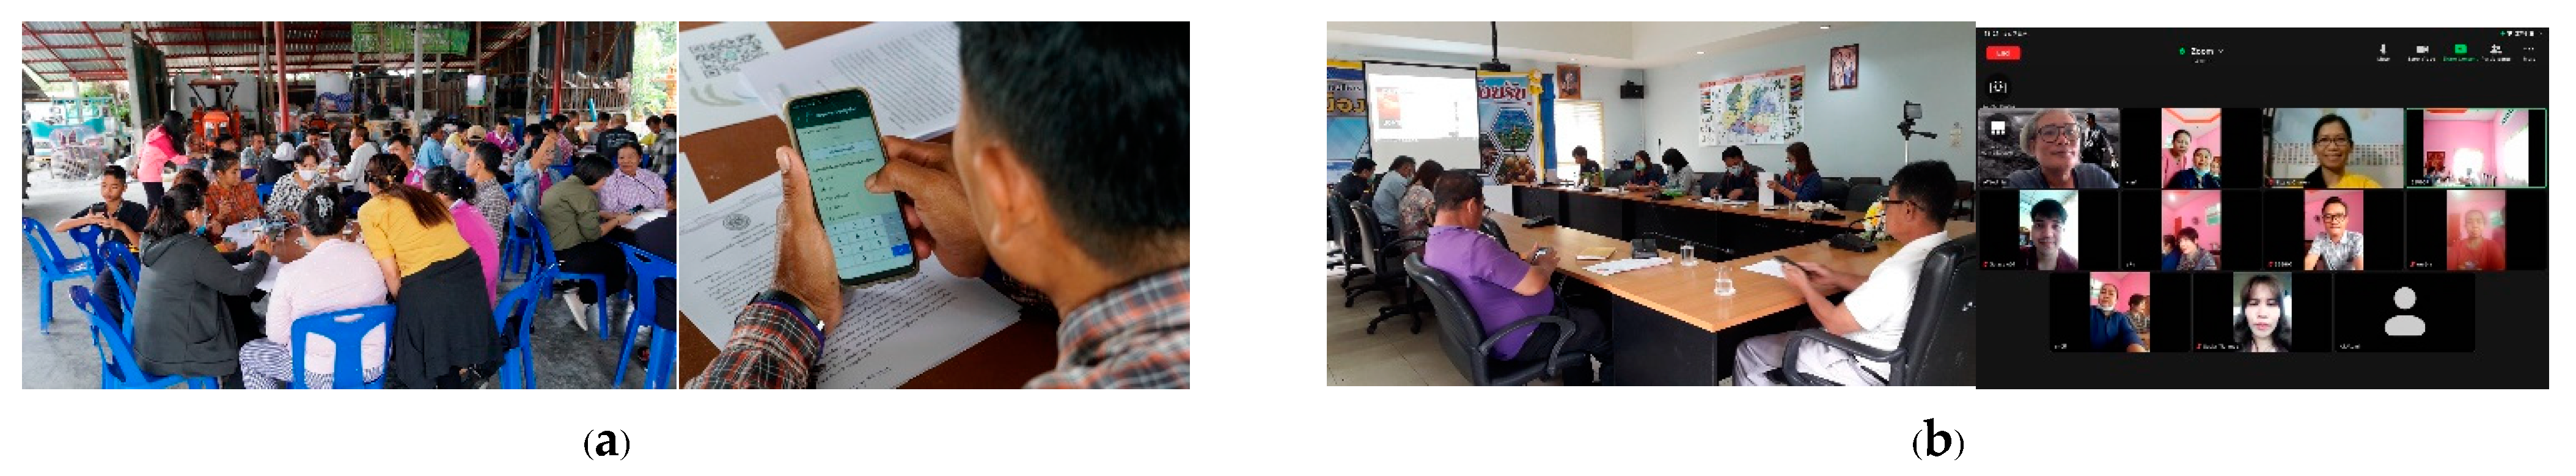
2.3. Data Collection

Initially, farmers from all communities were trained in the use of SGA either on-site or online. Farmers have downloaded the SGA app from the Android Play Store and installed it on their mobile phones. Data from each crop, including cultivation practices (straw burning, tillage, irrigation, planting, harvest), agricultural inputs (e.g., fossil fuel, fertilizer, lime, dolomite), and yields, were collected and recorded in the SGA app by farm owners. The number of famers surveyed were 9, 11, and 51 farmer households from the NK, MJ, and ST communities, respectively. After recording and synchronizing data, SGA presented the calculated results on the dashboard. Farmers are able to track and view their own data at any time.

2.4. Data Analysis

The recorded data in the SGA database was exported in the form of a text file. The summary, frequency, and mean values were analyzed using SPSS version 17.0 for Windows (SPSS Inc. Chicago, IL, USA).

3. Results and Discussion

3.1. Farmers’ Engagement in Data Collection
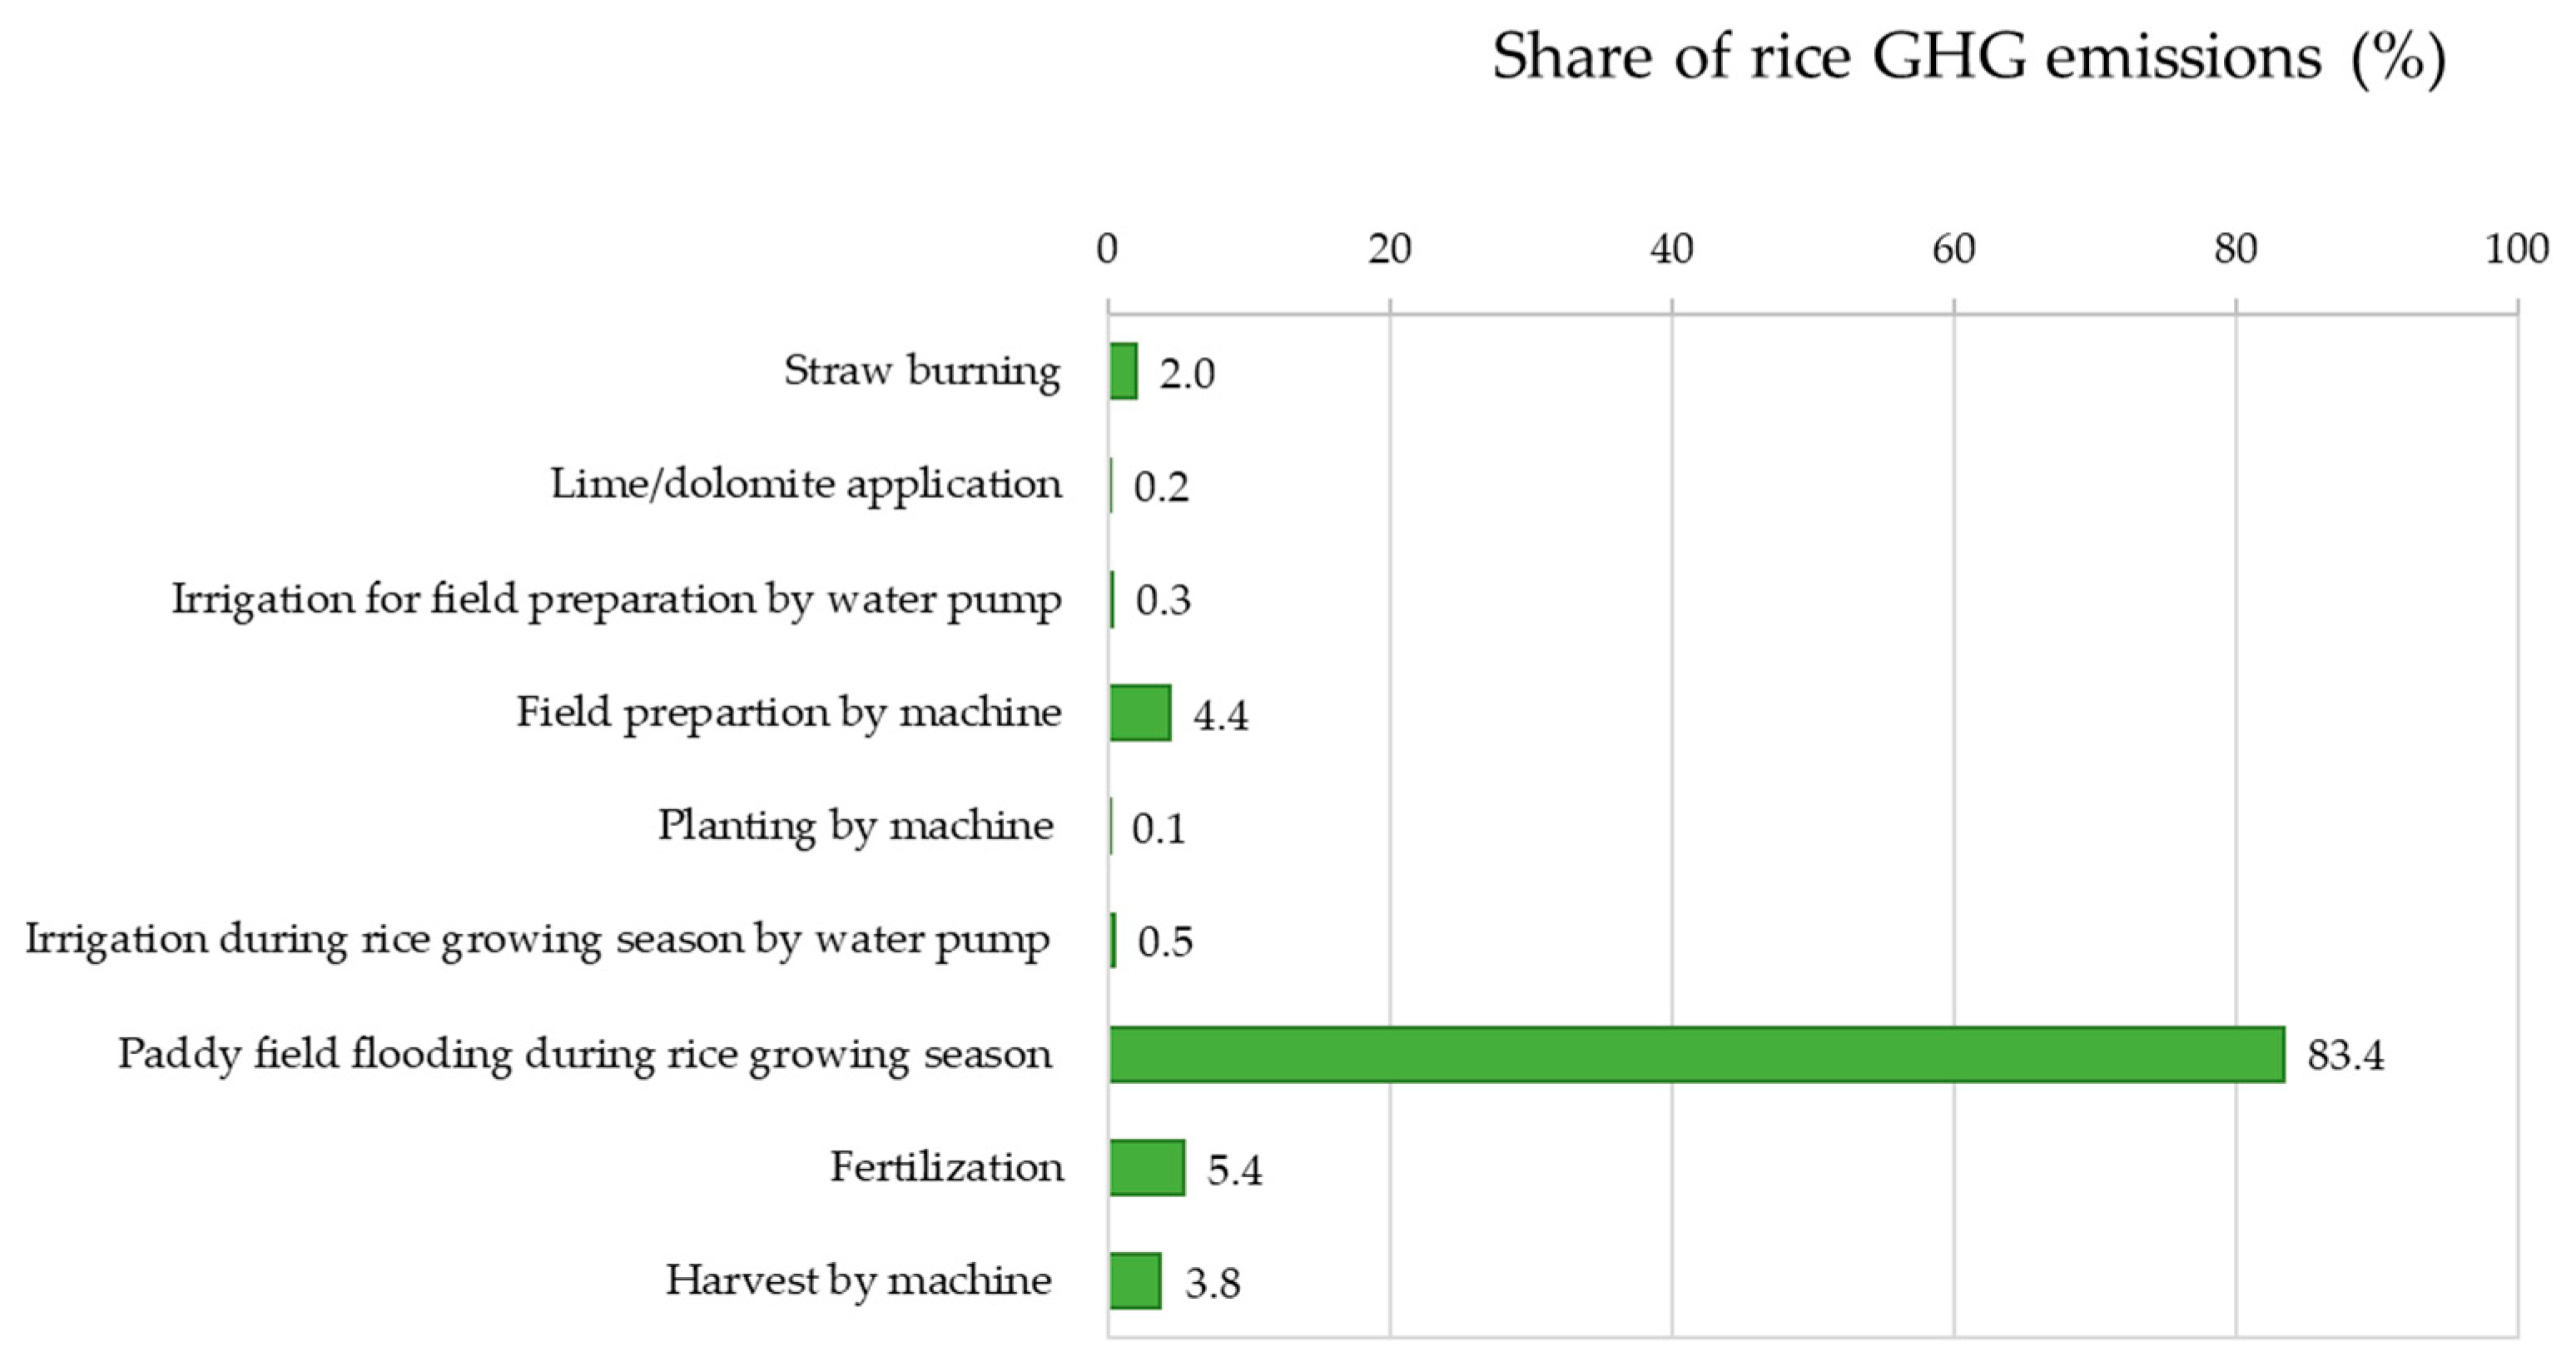
The development of SGA to track GHG emissions from rice fields was tested in the above-mentioned farmer communities. 71 farmers from three communities were invited to join the training workshop and application test (Figure 3). All farmers were able to download and install the SGA app on their mobile phones by themselves. SGA can be used effectively, especially by farmers who currently use smartphones on a daily basis.
Due to the worldwide COVID-19 pandemic, new plans had to be adopted to move from an on-site to an online survey. This situation was a great challenge for farmers’ adaptation. During the first attempt at online training, the farmers were not able to use the online meeting application. After further training, they learned how to use the online meeting system. This has resulted in farmers being able to continually attend online meetings as well as collect data for the SGA and share their screens through the online meeting system.

3.2. GHG Emissions

The results from SGA showed that the total GHG emissions of MJ, ST and NK communities accounted for 7.5, 6.3 and 2.9 tCO2e ha1 season1, respectively (Table 2). The mean of total seasonal GHG emissions from all communities accounted for 5.6 tCO2e ha1. Field management by straw burning was observed only in ST sites, which contributed to emissions of 16,343 kgCO2e. Rice straw burning is common practice during the short fallow period between the wet and dry seasons in ST sites. On the other hand, in MJ and NK, the rice straw was used for selling, growing mushrooms, mulching materials, and feeding cattle.
The use of diesel fuel in land preparation practices in NK and MJ sites resulted in higher GHG emissions (390–490 kgCO2e ha−1 season−1) than in ST (232 kgCO2e ha−1 season−1). This result can be explained by different engine types and diesel fuel consumption. In conventional practices, in NK and MJ sites, a four-wheel tractor (4 WT) with > 45 horsepower (HP) was used for both tillage and land leveling. Whereas, in ST sites, a 4 WT was only used for initial tillage and then a two-wheel tractor (2 WT) with < 45 HP was used for puddling/leveling. The diesel fuel rates of 4 WT and 2 WT were 14 L/h and 8 L/h, respectively. Therefore, the fuel consumption for soil preparation in the ST site was less than that of the NK and MJ sites by 41 and 53%, respectively. Similarly, Arunrat and Pumijumnong [9] described that the land management practice of the high amount of diesel fuel utilization caused the highest total CO2 emissions.
The seasonal emissions of CH4 from rice cultivation ranged from 1894 to 6424 kgCO2e ha−1 (Table 2). During the rice growing period with continuous flooding, the emission of CH4 contributed to 83.4% of the total GHG emissions (Table 2 and Figure 4). Irrigated areas of the ST site had clearly higher CH4 emissions from rice cultivation than the rain-fed areas of the MJ and NK sites. Similar results were also reported by Wassmann et al. [18]. They presented that the stage of water/soil management, which corresponds to CH4 emissions from flooded fields during cultivation, accounts for 54.1% of total GHG emissions in the baseline scenario [18]. Comparatively, the cultivation activities of fertilization, field preparation, harvest, and residue burning shared small emissions of 5.4, 4.4, 3.8 and 2.0%, respectively.
As the SGA calculator follows the 2019 Refinement to the 2006 IPCC Guidelines [13], we used the default emission factor (EF) for Southeast Asia (1.22 kg CH4 ha−1 d−1) and all scaling factors (SF) described by these guidelines. The water regime during the cultivation period (SFw), i.e., irrigated-continuously flooded (SFw = 1.00), irrigated-single drainage (SFw = 0.71), irrigated-multiple drainage (SFw = 0.55), rainfed-regular (SFw = 0.54), rainfed-drought prone (SFw = 0.16), and rainfed-deep water (SFw = 0.06), is the most important scaling factor of water management [13]. As CH4 is the baseline emission tracked by SGA, and in order to reduce CH4 emissions as the main GHG for approaching low-carbon rice production, water management practices, such as multiple drainage or alternate wetting and drying (AWD), should be applied.

3.3. C-Footprint

SGA also reported the C-footprint of paddy yields as 1.77, 1.10 and 1.09 kgCO2e kg yield1 in MJ, NK and ST, respectively (Table 2). Arunrat and Pumijumnong [9] also reported that GHG intensity ranged from 0.31 to 1.68 kgCO2e kg1 yield, with an average value of 0.97 kgCO2e kg−1 yield. They indicated that emissions of CO2, CH4 and N2O, Net GWP and GHG intensity related directly to the management practices [9].
It should be noted that this C-footprint is evaluated using the current baseline emissions and crop yield in only one cropping season. Therefore, more data collection is required for intensive analysis. As for the future, more data sampling with advanced technologies, such as straw baling, laser land leveling, drum seeding, AWD, and site-specific fertilizer management, could be implemented in the development of rice farming systems in order to lower the C-footprint.

4. Conclusions

This study showed that the total GHG emissions ranged from 2.9 to 7.5 tCO2e ha−1 season1, with an average value of 5.6 tCO2e ha−1 season1. CH4 emissions contributed to 83.4% of the total GHG emissions. The water management practice by continuous flooding (CF) during the rice growing season was the most significant contributor to total GHG emissions. Farmers are able to use the SGA app on their mobile phones, and this app effectively presents a thorough analysis of GHG emissions, fossil fuel consumption, fertilization, water management, seasonal yield, and C-footprint, which can be used to establish a baseline and mitigation options.

Supplementary Materials

The presentation material can be downloaded at: https://www.mdpi.com/article/10.3390/IOCAG2022-12259/s1.

Author Contributions

Conceptualization: N.C.-u., S.T., A.C. and K.C.; Methodology: N.C.-u., S.T., A.C. and K.C.; Performed the experiment: N.C.-u., S.T., K.C., S.M., P.S. and P.K.; Data analysis: N.C.-u. and K.C.; Writer: N.C.-u.; Review and editing: N.C.-u., S.T., A.C. and K.C. All authors have read and agreed to the published version of the manuscript.

Funding

Funding in this study was partly supported by the National Research Council of Thailand (NRCT) (Integrated Research and Innovation, KMUTT Fiscal year 2019), the National Innovation Agency (NIA) (CS0201-01-63-01-0011), and JGSEE-KMUTT (AGAR Lab).

Institutional Review Board Statement

Human research ethical review and approval were waived for this study by KMUTT’s Institutional Review Board.

Informed Consent Statement

Farmer’s consent was waived for this study due to not involving human research ethics.

Data Availability Statement

We also would like to thank all farmers from Muang Change sub-district, Ban Suan Taeng Community Rice center, and Ban Herb Organic Rice Community Enterprise, Na Kham sub-district for their data support.

Acknowledgments

The authors gratefully acknowledge the support of the Joint Graduate School of Energy and Environment (JGSEE) at King Mongkut’s University of Technology Thonburi, Kasetsart University (KU) and Atthajariya Co., Ltd. for field survey support.

Conflicts of Interest

The authors declare no conflict of interest.

References

  1. UNDP. Sustainable Development Goals. Available online: https://www1.undp.org/content/oslo-governance-centre/en/home/sustainable-development-goals.html (accessed on 12 January 2022).
  2. UN. The 17 Goals. Available online: https://sdgs.un.org/goals (accessed on 12 January 2022).
  3. Campbell, B.M.; Hansen, J.; Rioux, J.; Stirling, C.M.; Twomlow, S.; Wollenberg, E. Urgent action to combat climate change and its impacts (SDG 13): Transforming agriculture and food systems. Curr. Opin. Environ. Sustain. 2018, 34, 13–20. [Google Scholar] [CrossRef]
  4. FAO. Climate Change-Related Disasters a Major Threat to Food Security. Available online: https://unfccc.int/news/climate-change-related-disasters-a-major-threat-to-food-security-fao (accessed on 12 January 2022).
  5. Fairtrade. SDG13: Climate Action. Available online: https://www.fairtrade.net/issue/sdg13 (accessed on 12 January 2022).
  6. FAO. FAOSTAT Database, Data of crop production. Available online: https://www.fao.org/faostat/en/#data/QCL (accessed on 1 January 2020).
  7. Towprayoon, S.; Chidthaisong, A.; Fusuwankaya, K.; Cha-un, N. Appropriate Method for Measurement, Reporting and Verification (MRV) in Agriculture Sector: A Case Study of Rice Field; Final Report Submited to Thailand Research Fund (TRF): Bangkok, Thailand, 2015; p. 243. [Google Scholar]
  8. Romasanta, R.R.; Sander, B.O.; Gaihre, Y.K.; Alberto, M.C.; Gummert, M.; Quilty, J.; Nguyen, V.H.; Castalone, A.G.; Balingbing, C.; Sandro, J.; et al. How does burning of rice straw affect CH4 and N2O emissions? A comparative experiment of different on-field straw management practices. Agric. Ecosyst. Environ. 2017, 239, 143–153. [Google Scholar] [CrossRef]
  9. Arunrat, N.; Pumijumnong, N. Practices for reducing greenhouse gas emissions from rice production in Northeast Thailand. Agriculture 2017, 7, 4. [Google Scholar] [CrossRef] [Green Version]
  10. Le Mer, J.; Roger, P. Production, oxidation, emission and consumption of methane by soils: A review. Eur. J. Soil Biol. 2001, 37, 25–50. [Google Scholar] [CrossRef]
  11. Ludwig, B.; Jäger, N.; Priesack, E.; Flessa, H. Application of the DNDC model to predict N2O emissions from sandy arable soils with differing fertilization in a long-term experiment. J. Plant Nutr. Soil Sci. 2011, 174, 350–358. [Google Scholar] [CrossRef]
  12. IPCC. 2006 IPCC Guidelines for National Greenhouse Gas Inventories; Institute for Global Environmental Studies (IGES): Hayama, Japan, 2006. [Google Scholar]
  13. IPCC. Refinement to the 2006 IPCC Guidelines for National Greenhouse Gas Inventories; Intergovernmental Panel on Climate Change (IPCC): Geneva, Switzerland, 2019. [Google Scholar]
  14. Wassmann, R.; Pasco, R.; Zerrudo, J.; Ngo, D.M.; Vo, T.B.T.; Sander, B.O. Introducing a new tool for greenhouse gas calculation tailored for cropland: Rationale, operational framework and potential application. Carbon Manag. 2019, 10, 79–92. [Google Scholar] [CrossRef]
  15. Atthajariya. Smart GHG: An Application for Calculating Greenhouse Gas Emissions for Communities; Final Report submited to National Innovation Agency (NIA), Thailand: Bangkok, Thailand, 2021; p. 778. [Google Scholar]
  16. Towprayoon, S.; Chidthaisong, A.; Cha-un, N.; Fusuwankaya, K. Innovation of Geographic Information System for Sustainable Water Management and Rice Cultivation; Final Report submited to National Research Council of Thailand (NRCT); King Mongkut’s University of Technology Thonburi: Bangkok, Thailand, 2020; p. 131. [Google Scholar]
  17. IPCC. The Physical Science Basis: Working Group I Contribution to the Fifth Assessment Report of the Intergovernmental Panel on Climate Change; Intergovernmental Panel on Climate Change (IPCC); Cambridge University Press: Cambridge, UK, 2013. [Google Scholar]
  18. Wassmann, R.; Van-Hung, N.; Yen, B.T.; Gummert, M.; Nelson, K.M.; Gheewala, S.H.; Sander, B.O. Carbon footprint calculator customized for rice products: Concept and characterization of rice value chains in southeast Asia. Sustainability 2022, 14, 315. [Google Scholar] [CrossRef]
Figure 1. SMART GHG application development sequence [7,16].
Chemproc 10 00078 g001
Figure 2. Study site locations.
Chemproc 10 00078 g002
Figure 3. Farmers’ engagement in training workshop and data collection for (a) on-site, and (b) online.
Chemproc 10 00078 g003
Figure 4. The contribution of GHG emissions by rice cultivation activities.
Chemproc 10 00078 g004
Table 1. Rice cultivation activities, GHG emissions and calculation method.
No.Cultivation ActivityGHG EmissionsMethodology in SGA
1Straw burningCH4 and N2O2006 IPCC Guidelines,
Volume 4 Chapter 2 [12]
2Lime or dolomite applicationCO22006 IPCC Guidelines,
Volume 4 Chapter 11 [12]
3Irrigation for field preparation
by water pump
CO2, CH4 and N2O2006 IPCC Guidelines,
Volume 2 Chapter 3 [12]
4Field preparation by machineCO2, CH4 and N2O2006 IPCC Guidelines,
Volume 2 Chapter 3 [12]
5Planting by machineCO2, CH4 and N2O2006 IPCC Guidelines,
Volume 2 Chapter 3 [12]
6Irrigation during rice growing
season by water pump
CO2, CH4 and N2O2006 IPCC Guidelines,
Volume 2 Chapter 3 [12]
7Paddy field flooding during
rice growing season
CH42006 IPCC Guidelines,
Volume 4 Chapter 5 [12] and
2019 Refinement to the 2006 IPCC Guidelines [13]
8FertilizationCO2, CH4 and N2O2006 IPCC Guidelines,
Volume 4 Chapter 11 [12] and
2019 Refinement to the 2006 IPCC Guidelines [13]
9Harvest by machineCO2, CH4 and N2O2006 IPCC Guidelines,
Volume 2 Chapter 3 [12]
Table 2. Cultivation activity, amount of seasonal GHG emissions and C-footprint from three communities in Thailand.
Cultivation Activity/Study SiteMuang Chang (MJ),
Nan
Na Kham (NK),
Nakorn Phanom
Suan Taeng (ST),
Suphan Buri
Number of sample (n)11951
Harvested area (ha)815111
Straw burning (kgCO2e)--16,343
Lime or dolomite application (kgCO2e)105-1210
Irrigation for field preparation by water pump (kgCO2e)15332593
Field preparation (tillage/leveling) by machine (kgCO2e)3711602525,741
Planting by machine (kgCO2e)2176467
Irrigation during rice growing season by water pump (kgCO2e)48333841
Paddy field flooding during rice growing season (kgCO2e)48,62029,248591,767
Fertilization (kgCO2e)4051355935,362
Harvest by machine (kgCO2e)281617923,835
Total GHG emissions (kgCO2e)56,85245,153701,159
Emission per area (kgCO2e ha−1)751229246314
Paddy yield (kg ha−1)424426635788
C-footprint (kgCO2e kg yield−1)1.771.101.09
Publisher’s Note: MDPI stays neutral with regard to jurisdictional claims in published maps and institutional affiliations.

