Proceeding Paper

Evaluation of Potential Ecological Risk Index of Toxic Metals Contamination in the Soils †

by
Arnab Saha
1,*,
Bhaskar Sen Gupta
1,
Sandhya Patidar
1 and
Nadia Martínez-Villegas
2
1
Institute of Infrastructure and Environment, School of Energy, Geoscience, Infrastructure & Society, Heriot-Watt University, Edinburgh EH14 4AS, UK
2
Applied Geosciences Department, IPICyT, San Luis Potosi 78216, Mexico
*
Author to whom correspondence should be addressed.
Presented at the 1st International Online Conference on Agriculture-Advances in Agricultural Science and Technology, 10–25 February 2022; Available online: https://iocag2022.sciforum.net/.
Chem. Proc. 2022, 10(1), 59; https://doi.org/10.3390/IOCAG2022-12214
Published: 10 February 2022

Abstract

:
Toxic metal pollution in soil and the associated health risk is a global problem, with the majority of cases occurring in developing nations. The current work focuses on a contaminated site in Mexico which is used for recreational purposes. The contaminated site in Cerrito Blanco in San Luis Potosi, Mexico is close to an abandoned mining area surrounded by non-cultivated farmland. Analyses of topsoil samples indicated the presence of arsenic (As), copper (Cu), nickel (Ni), lead (Pb), and zinc (Zn). This work has estimated the potential harmful impacts of toxic metals by using the Contamination factor (Cf), Ecological risk factor (Er), and Potential ecological risk index (RI) by Hakanson’s method. The results indicated that the soil contamination factors (Cf) of toxic metals were: As > Zn > Cu > Pb > Ni. It is concluded that Cu, Pb, and Zn have been found in the soil samples because of past mining activities. The highest contamination factor (Cf) of As (11.94 mg/kg) in the soil was in the extremely high contamination category. It is also believed that the As concentration in the soil was high because arsenic-contaminated water was regularly used to irrigate the land. The Ecological risk factors (Er) for toxic metals were: As > Cu > Pb > Zn > Ni. In the surface soils of this region, As was a considerable ecological concern and contributed the most to potential ecological risk indices (RI). It is also acknowledged that various anthropogenic factors contributed significantly to the potential ecological risk index (RI). The spatial distribution of toxic metal contamination in the soil was also mapped using a Geographic Information System (GIS). This study concludes that a regular assessment is needed to estimate the risk level of toxic metal contamination in soil.

1. Introduction

One of the most serious environmental issues facing the world today is soil contamination. The toxic contaminants in soil spread to other parts of the ecosystem and pose a direct or indirect threat to human health [1,2]. Industrial emissions, illegal dumping, municipal disposal of wastes, and the improper use of agrochemicals collectively contribute to the concentration and absorption of heavy toxic metals in the environment [3,4,5]. Severe heavy metal accumulation in the soil surface will degrade the soil ecosystems and raise the possible exposure and significant risk of heavy metals to humans [6]. Toxic metal contamination has been linked to serious health consequences in humans, including cardiac diseases, skeletal illnesses, infertility as well as neurological disorders [2,7]. Some elements, like Cd, Hg, Cu, and As, etc., are poisonous and harmful to people, even at low concentrations [8,9]. These metals concentrate in adipose tissues, bones, muscles, and joints after entering the body, causing a variety of disorders [10,11].
The technique for estimating the injury or damage from a possible health threat is referred to as risk assessment. In general, risk assessment is a scientific framework for environmental policy [2]. The overall purpose of risk evaluation is to assess the environmental impact of contamination in water, air, soil, or sediment [12]. Several studies have been conducted across the world to examine the potential ecological risk of heavy metals. Rostami et al. [2] studied the concentrations of heavy metals (Cd, Cr, Cu, Ni, Pb, Zn, and As) in agricultural soils in the Kamfiruz district of Fras in Iran and assessed their ecological risk. The findings revealed that Cd was the main contaminant, which might be attributable to human activities such as the use of chemical fertilizers and pesticides in the sampling area. Qi et al. [9] investigated the levels of heavy metal contaminations (As, Cd, Cr, Cu, Hg, Ni, Pb, and Zn) and ecological risks in agricultural soil in Shanxi Province, China. A total of 33 surface soil samples were collected from 11 cities in Shanxi. The soil-heavy metals pollution levels were evaluated using a geo-accumulation index, and their ecological risks were assessed using respective risk indices. This study found that the metals Cd and Hg were present in higher concentrations and posed higher ecological concerns in agricultural soil in Shanxi. The conclusions of this study will give fundamental information on agricultural soil pollution management and control. Tisha et al. [13] performed a study in Savar tannery industrial estate, Bangladesh to assess the concentrations of heavy metals, such as Cd, Cr, Pb, Cu, and Ni, in the surface soils and to evaluate the level of contamination and ecological risks. This study concluded that continuous heavy metal contamination monitoring should be conducted to estimate the risk of heavy metal contamination in the soil.
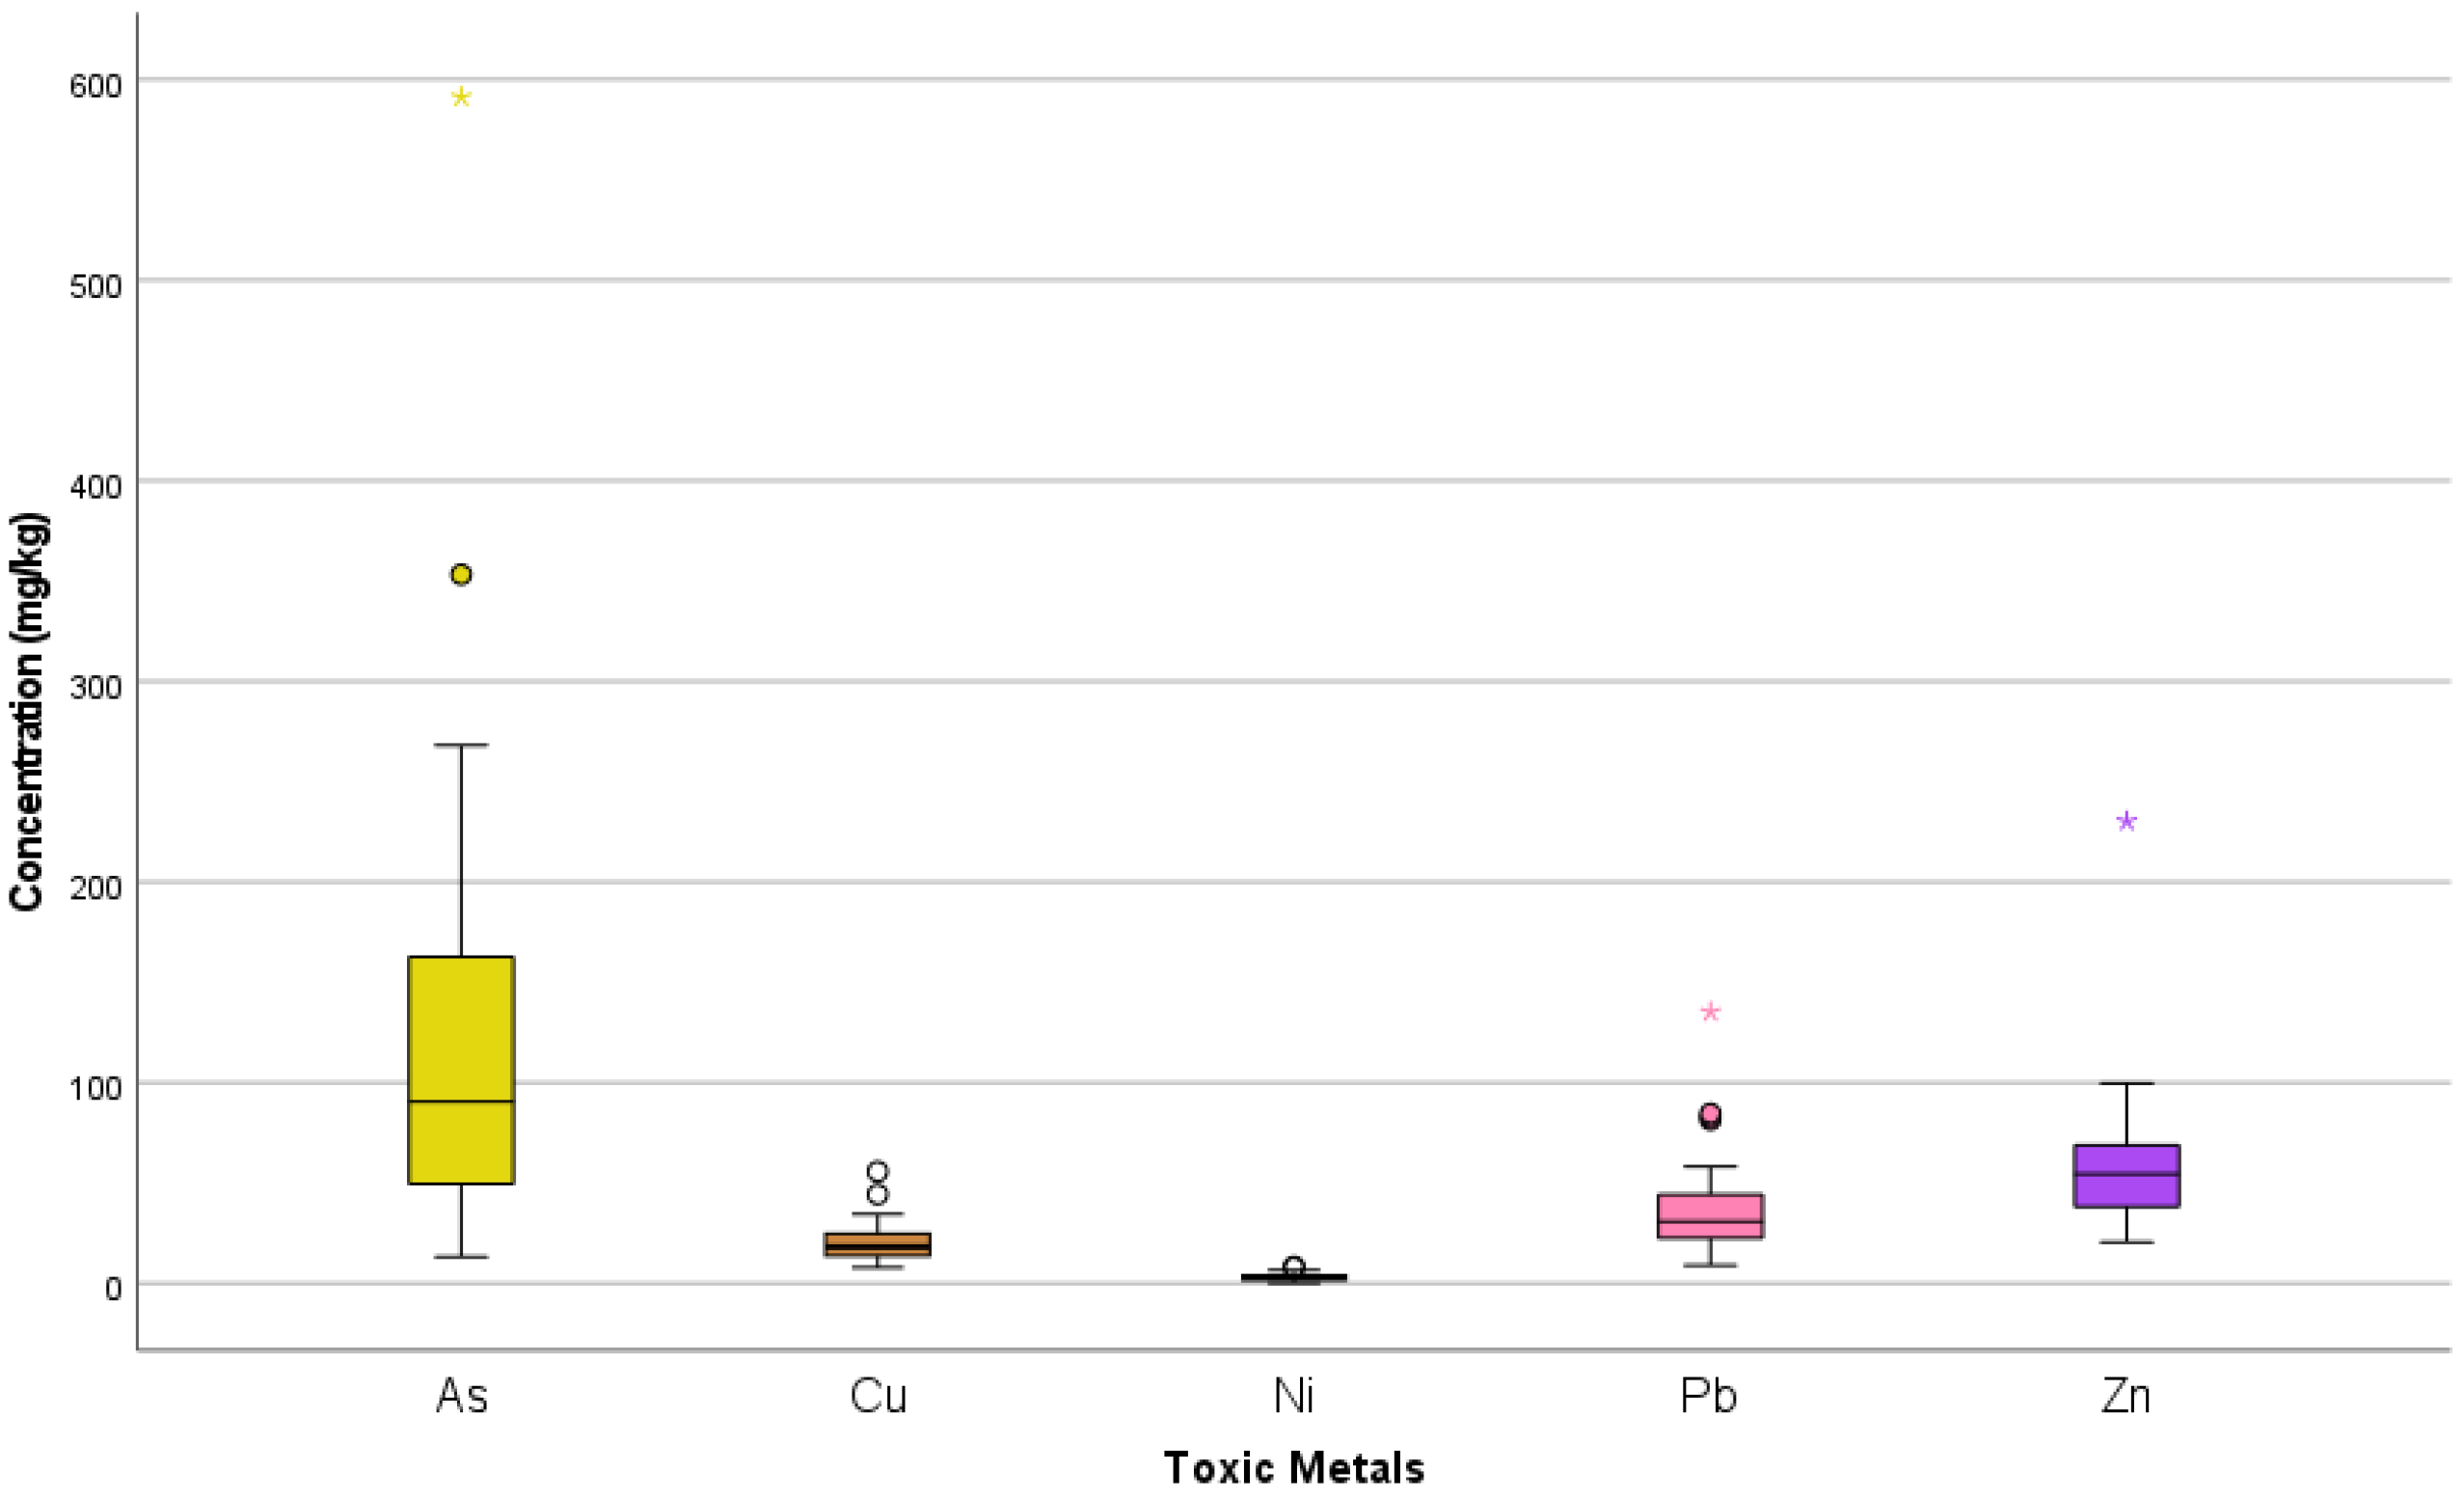
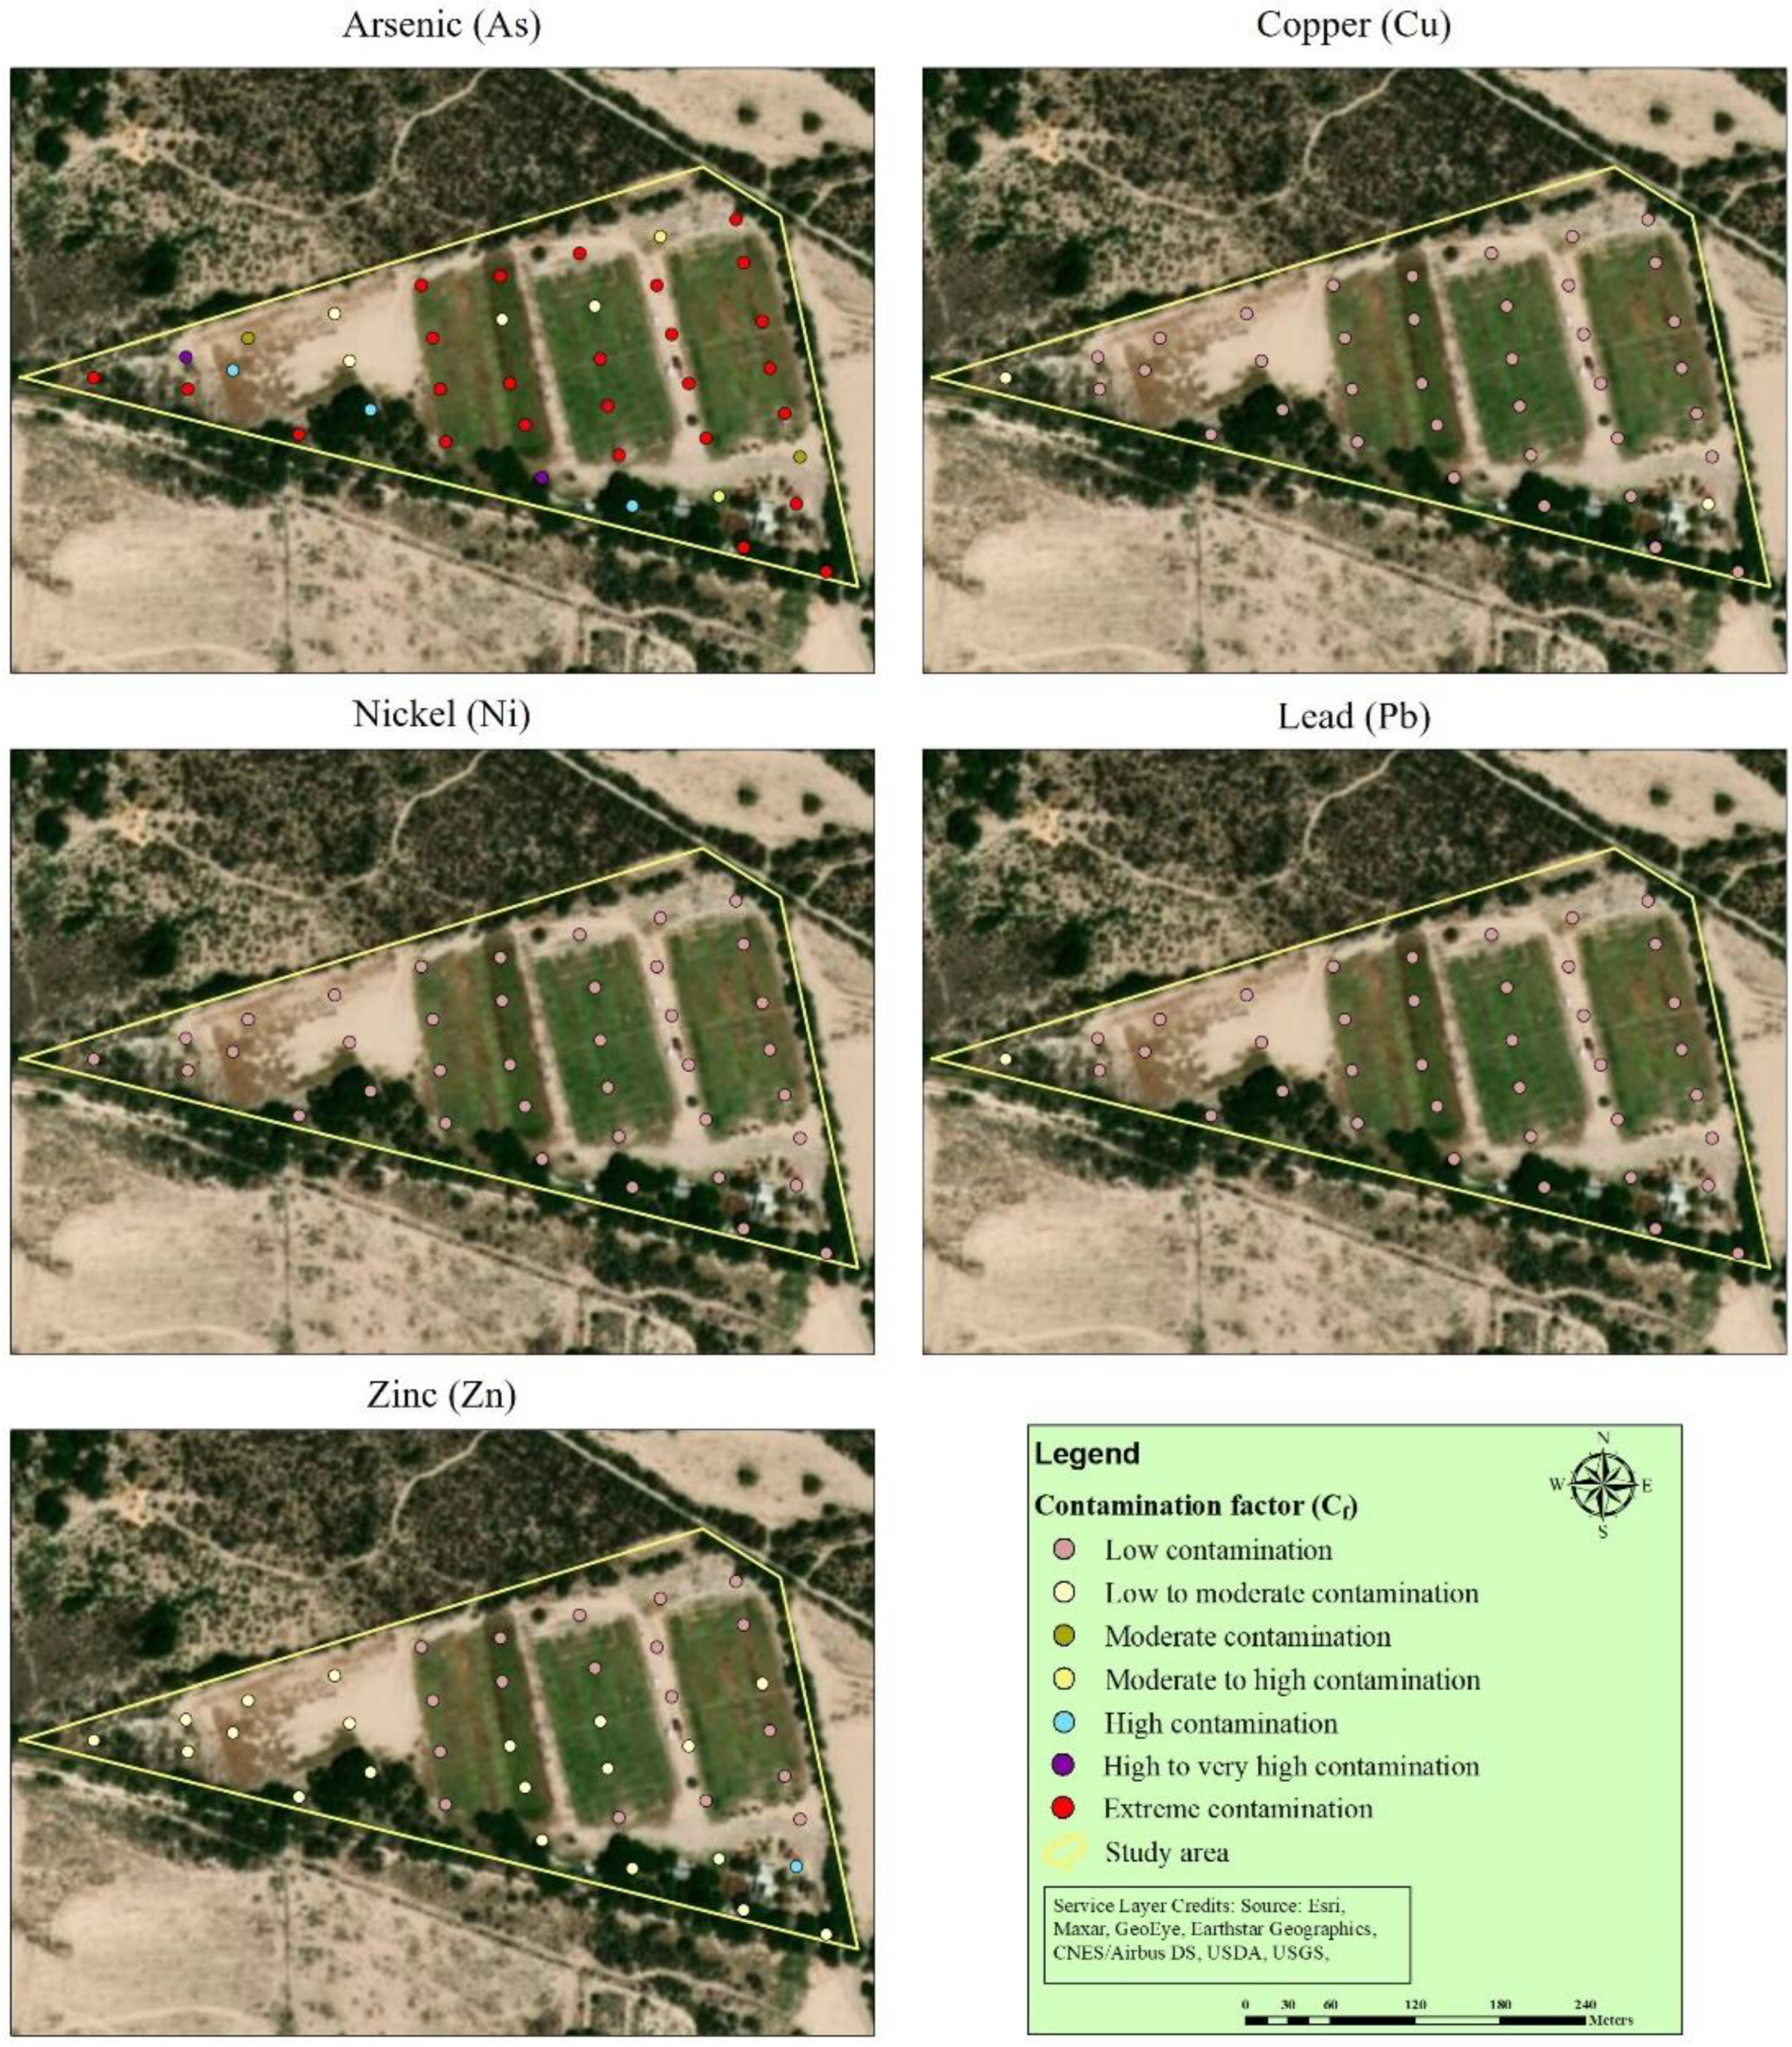
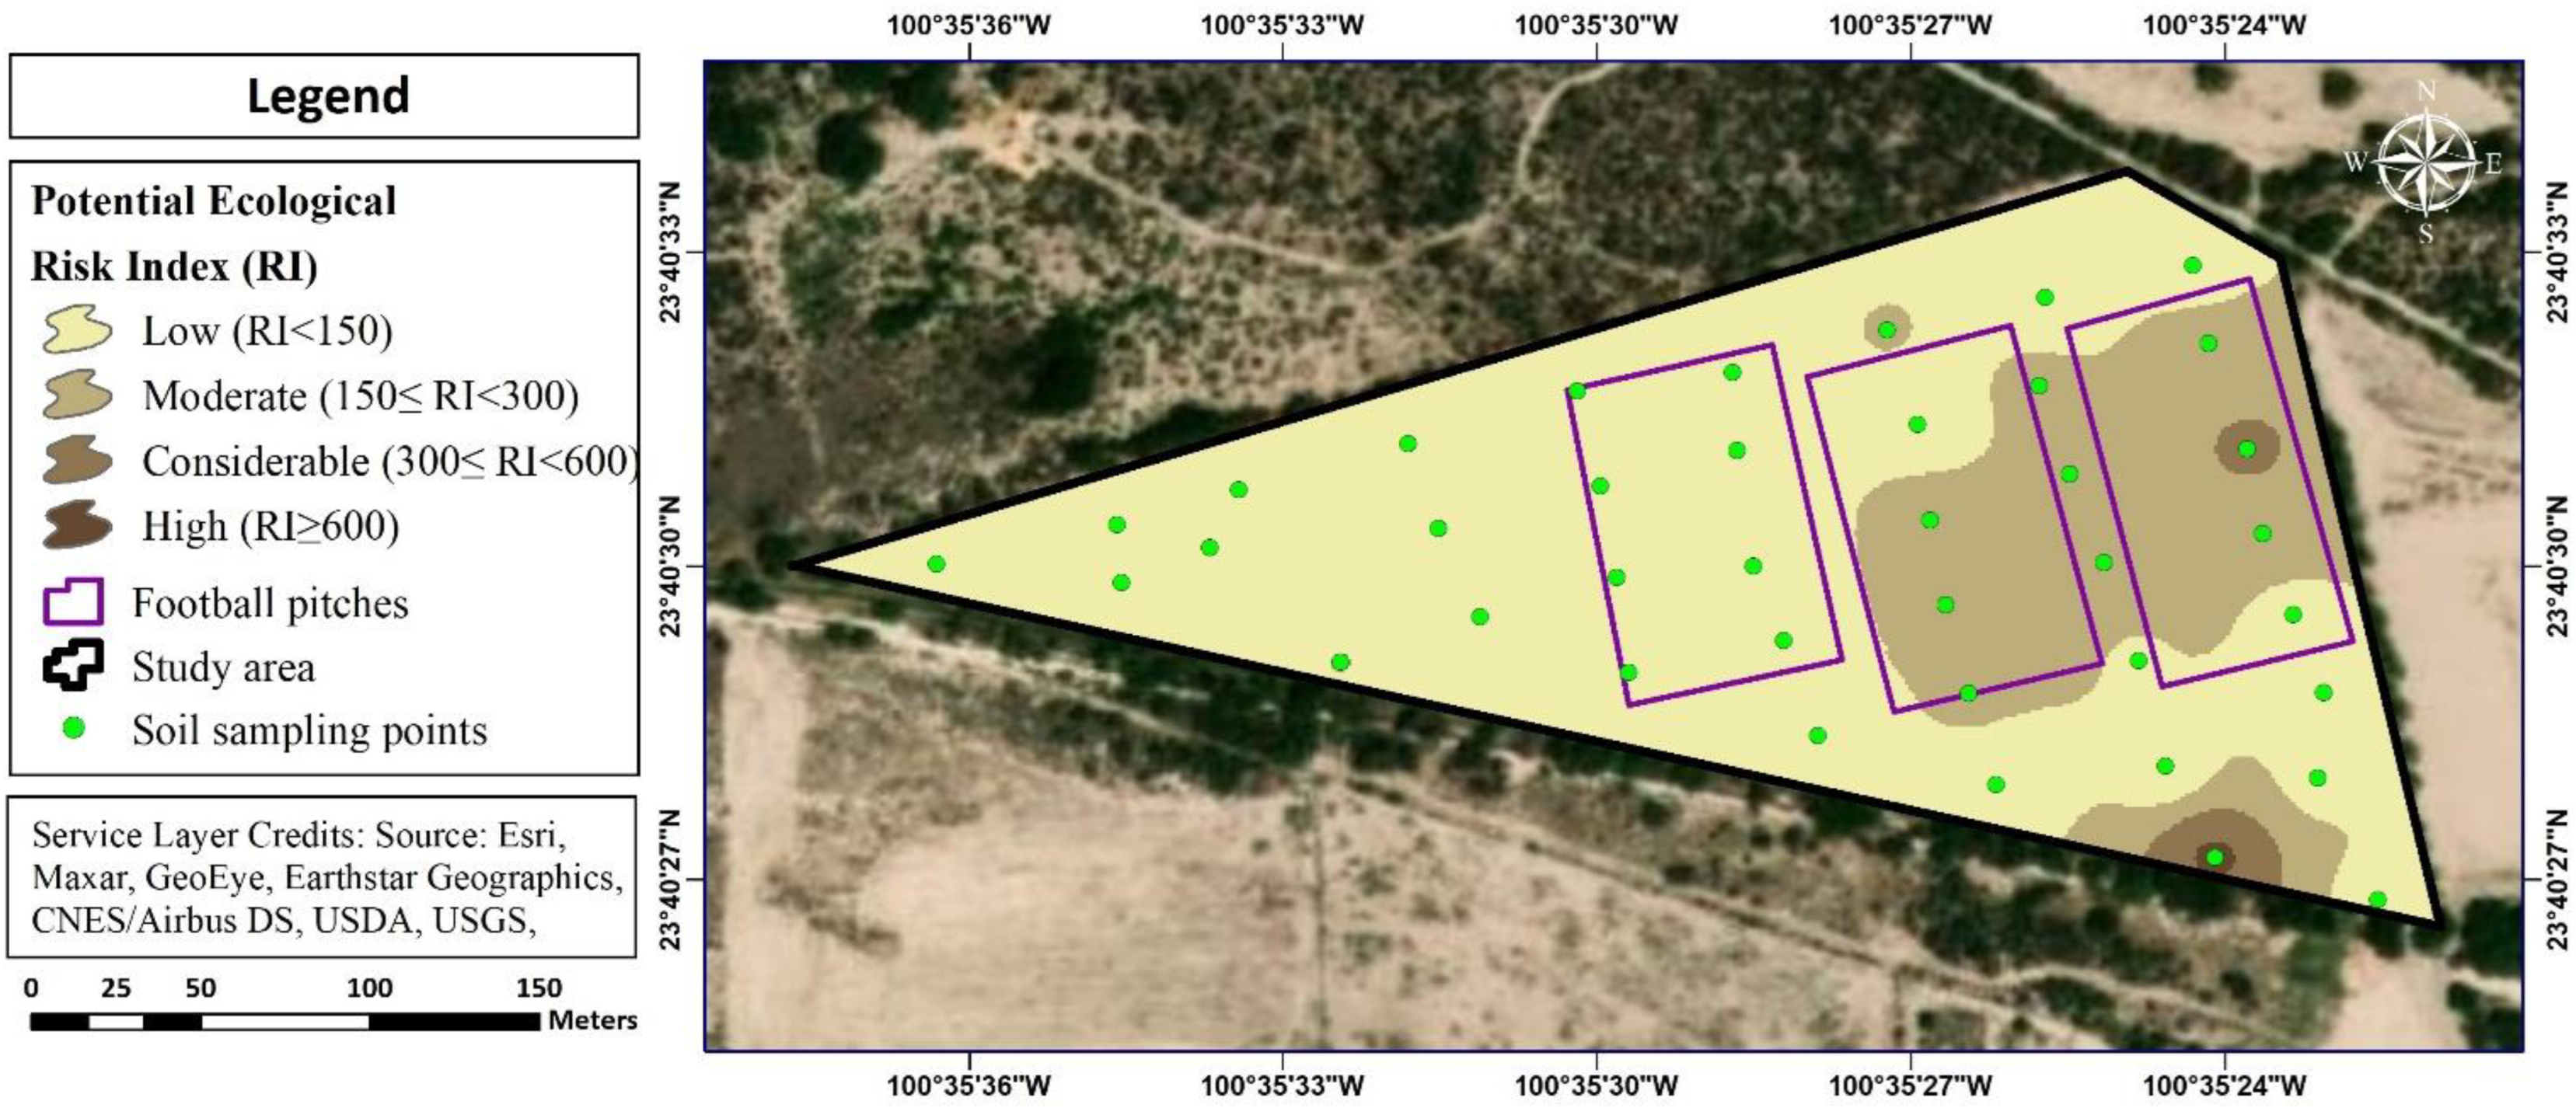
The multivariate statistical technique, along with a variety of indices, provides a modern framework for assessing toxic metal contamination in field soils that may also be used in similar soil pollution systems. In the present study, toxic metals in the soil were chosen as they cause public health concerns and influence the ecological balance. This study aims to: (i) determine the concentrations of toxic metals including arsenic (As), copper (Cu), nickel (Ni), lead (Pb), and zinc (Zn) in the surface soil, (ii) evaluate the status of contamination by using the contamination factor (Cf), (iii) assess the ecological risk factor (Er), and (iv) evaluate the potential ecological risks and spatial distributions of target toxic metals in the soil of the study area.

2. Study Area

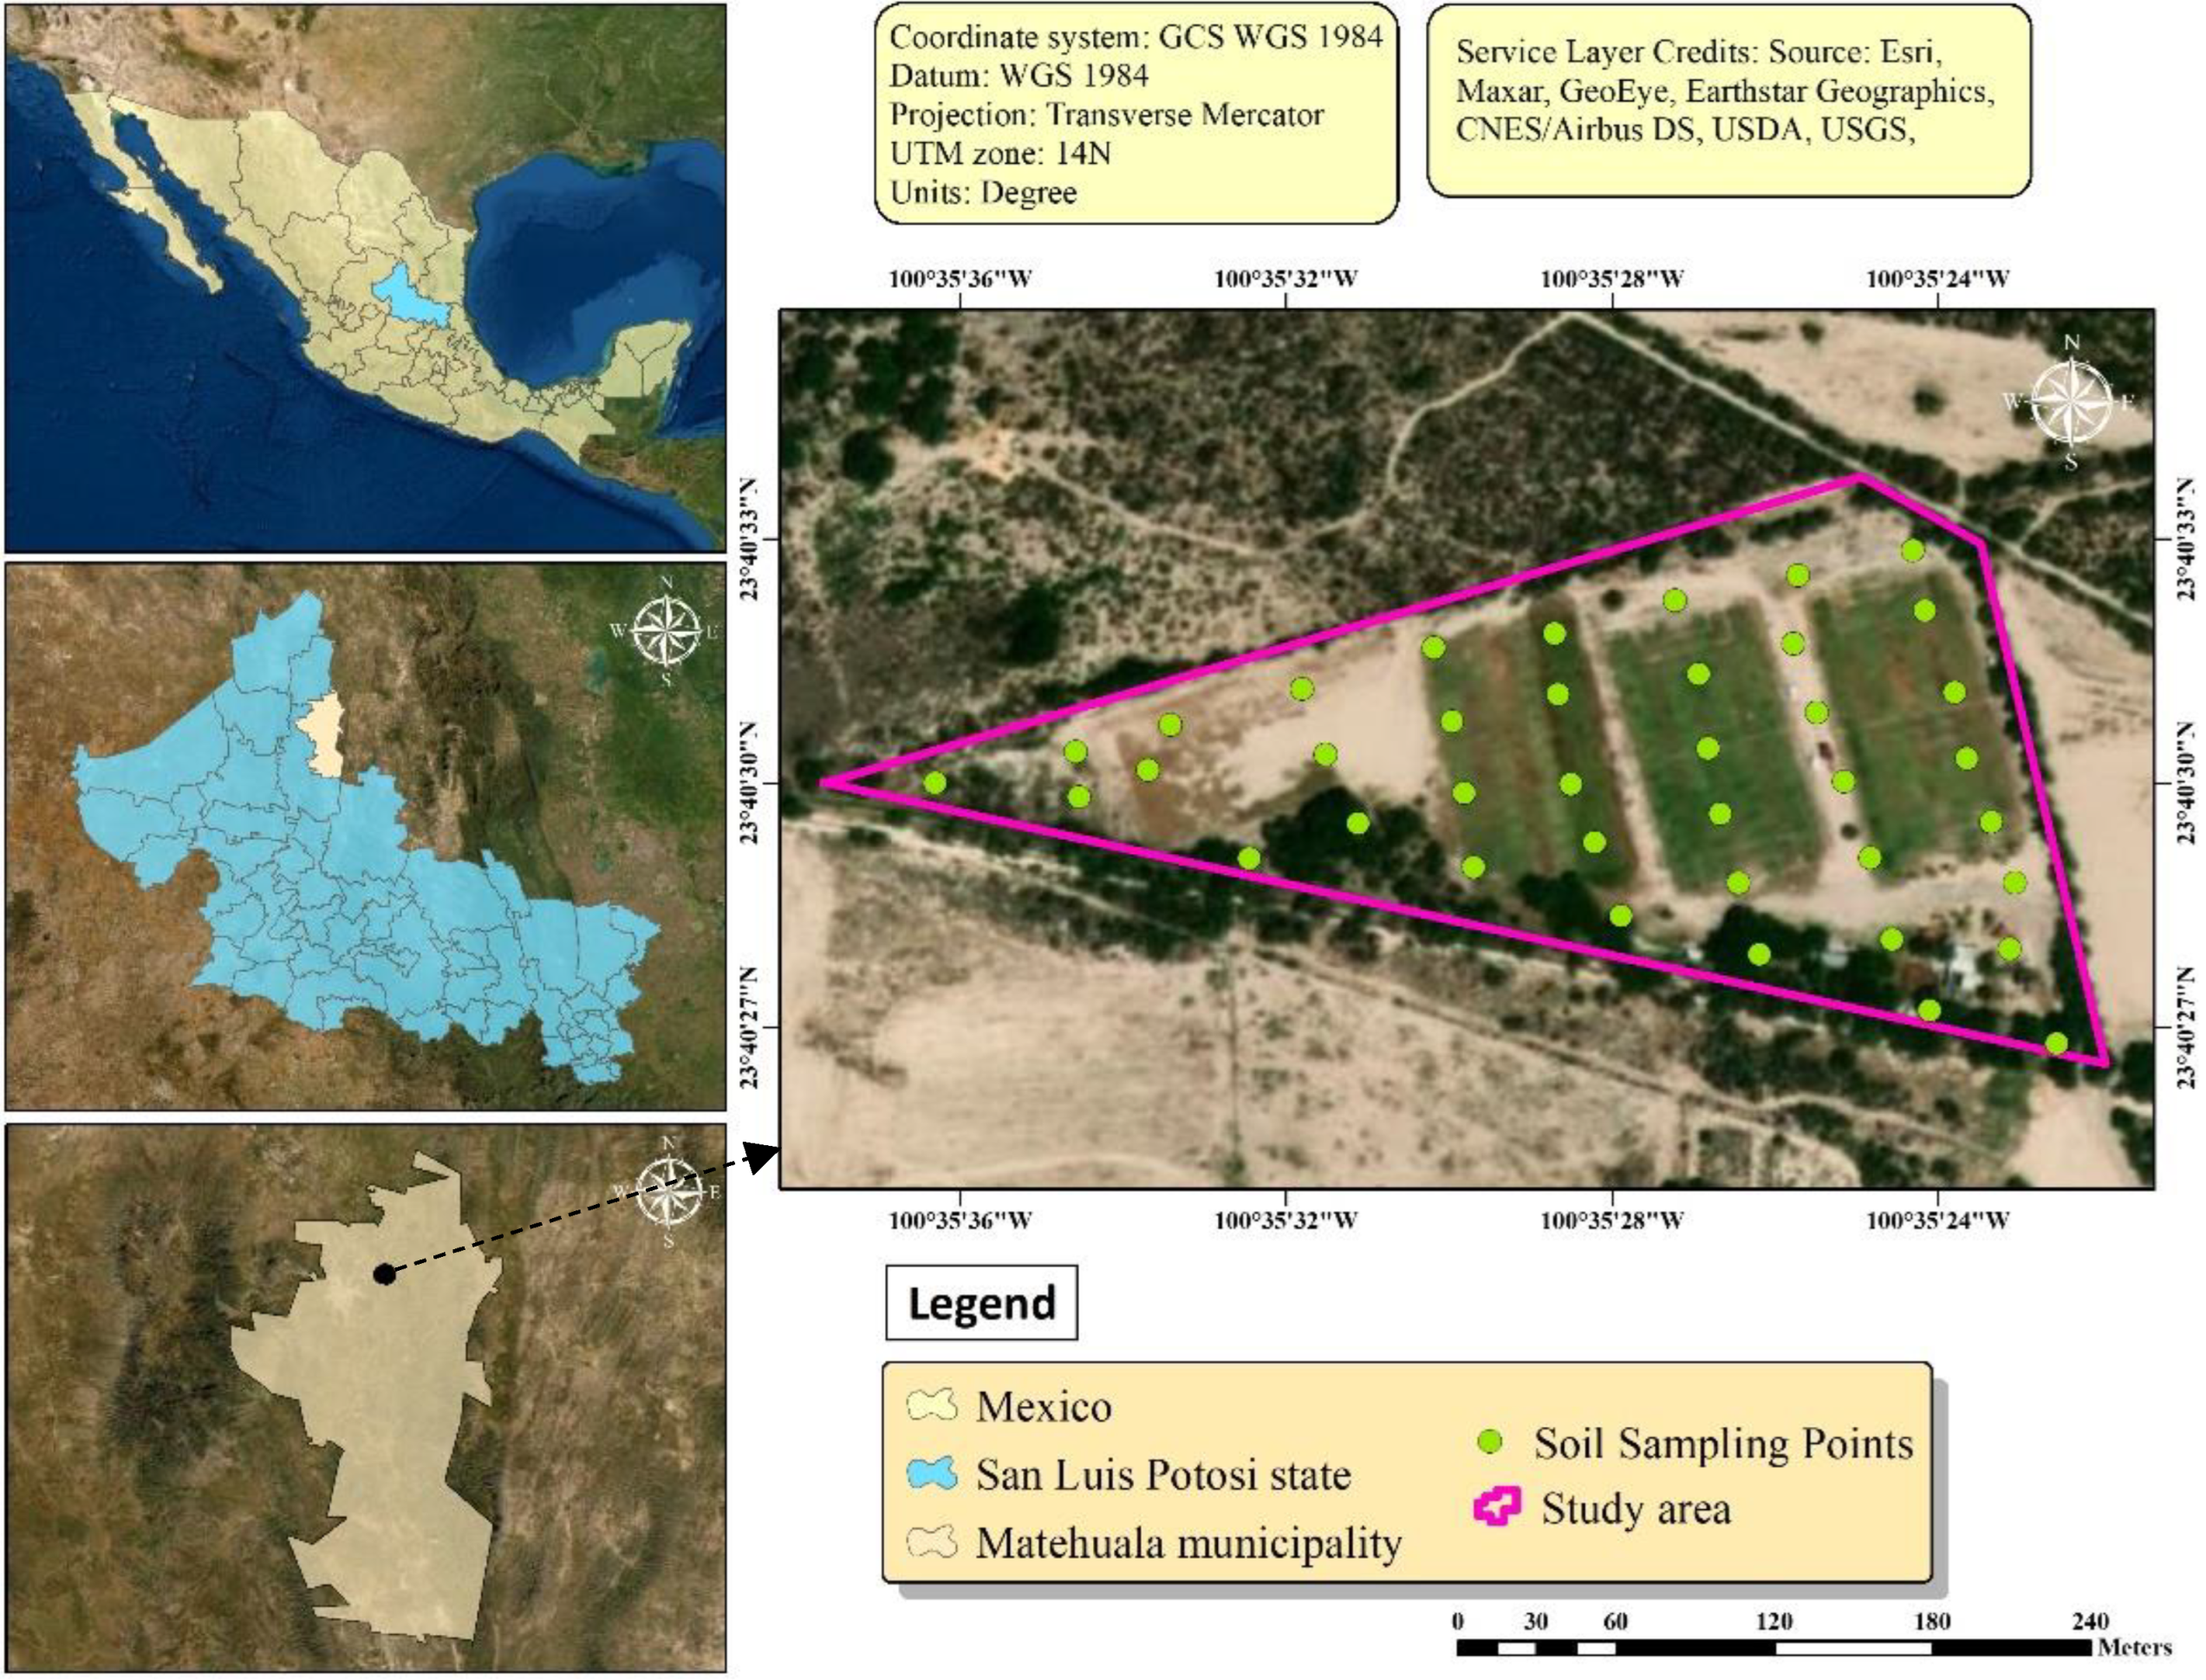
Soil samples were collected from the fields close to an abandoned mining area surrounded by non-cultivated farmland in Cerrito Blanco, Matehuala municipality, San Luis Potosi, Mexico. It has a total geographical area of around 4.84 hectares and is positioned within 23°40′30″ N latitude and 100°35′27″ W longitude (Figure 1). The study area is the Joya Verde soccer sports club, which comprises irrigated lands, including three half-hectare soccer grounds, and vegetative areas, known as non-irrigated lands, surrounding the soccer pitches [14]. Massive amounts of recent as well as historical tailings are reported to have been deposited on the surrounding terrains as a result of mining activities on an unmanaged privately owned land with no restrictions on public access [15,16,17]. Slags, wastes, and construction debris from a dormant metal ore smelter that operated within Matehuala City until the 1960s have accumulated on the site and further contaminated the environment [17,18]. The area has a semi-arid climate, and the predominant vegetation is michrophyllus scrub that is mixed with agricultural lands and susceptible to mild cattle grazing [19]. The types of soil in this area include Calcisol and Gypsisol, and the area receives limited precipitation, ranging from 300 to 500 mm per year [20,21].

3. Materials and Methods

3.1. Soil Sampling and Chemical Analyses

A total of 39 surface soil samples were collected with an auger at a depth of 0–5 cm from the study area including soccer fields. A Garmin Etrex Personal navigator global positioning system receiver was used to geo-locate all of the soil sampling locations. For data quality concerns, duplicate samples were taken from every fifth sampling point to make a total of 77 soil surface samples [14]. As a typical sample, a 1 kg specimen of fresh topsoil was taken from each location and packaged in a sealed plastic bag to preserve it as clean before transferring it to the testing laboratory. All soil samples were dried at room temperature and sieved for fractions of less than 2 mm. In a beaker, 1.0 gm of soil was poured, followed by 10 mL of aqua regia (HNO3:HCl) with a ratio of 3:1. When assessing total accessible toxic metals in soils, this digestion process is acceptable [14,22]. The different concentrations of digested samples were evaluated for As, Cu, Ni, Pb, and Zn after dilution with deionized water using inductively coupled plasma optical emission spectroscopy (ICP-EOS) [14,23].

3.2. Assessment of Soil Contamination Risk

3.2.1. Contamination Factor (Cf)

The contamination factor (Cf) is described as a basic and useful tool for detecting toxic metal contamination. Cf is used to evaluate the individual toxic metal contamination in soils. Several previous papers have made extensive use of the Cf [5,13,24]. The following Equation (1) is used to compute it:
C f = C m e t a l C b a c k g r o u n d
where C m e t a l denotes the measured metal concentration of the soil sample, and C b a c k g r o u n d is the background reference concentration values of the individual metals. The study by Hakanson [25] demonstrated the Cf values. Table 1 shows the seven different classifications into which the contamination factor (Cf) is categorized.

3.2.2. Ecological Risk Factor (Er)

The ecological risk factor (Er) is a technique for assessing the ecological risk in soil based on metal toxicity and environmental response factors. According to the study by Hakanson [25], the Er was calculated using the following Equation (2):
E r = T r × C f
where T r is the toxic response factor values for each different metal, which are described in Table 2, and C f   is the contamination factor, which has been discussed in the previous section. The classification of the soil contamination based on Er is specified in Table 1.

3.2.3. Potential Ecological Risk Index (RI)

The potential ecological risk index (RI) is a method for assessing risks to the environment from soil. It is a comprehensive assessment of a contaminated site to assess the possible ecological risk [13]. According to the study by Hakanson [25], the RI was calculated using the following Equation (3):
R I =   E r
where Er is the ecological risk factor of a toxic metal element in each soil sampling point. Table 1 shows the classification levels of toxic metals in terms of possible ecological impact.

4. Results

4.1. Descriptive Analysis of Toxic Metal Concentrations

The concentrations of toxic metals in the soils are indicated in Table 3. The mean concentrations of As, Cu, Ni, Pb, and Zn were 119.54, 20.65, 3.20, 36.95, and 58.93 mg/kg, respectively. The concentrations of As and Zn were higher than the permissible limit for this study area, while the concentrations of Cu, Ni, and Pb were lower than the permissible limit. The permissible limits of As, Cu, Ni, Pb, and Zn were 10, 36, 35, 85, and 50 mg/kg [30]. The mean concentrations of As were found to be 12 times greater, which showed a serious contamination level in the study area. The coefficient of variation (CV) was the most important factor influencing the variance of toxic metal properties. According to descriptive statistics of toxic metals (Table 3), all metals of this study area showed a considerably high variation. The box and whisker plots in Figure 2 describe the primary information for the toxic metals assessments in this analysis. The high concentration of As was probably due to effluents of nonferrous metal smelting, past mining activities as well as the use of As-contaminated irrigation water [14].
The principal component analysis (PCA) revealed the potential relationships between the various environmental conditions and the identified toxic metals. PCA with VARIMAX normalized rotation was used to determine the source of toxic metals in these study soils, since it is an efficient technique for evaluating toxic metals’ source identification. The results of the PCA for the toxic metal concentrations are shown in Table 4. The first principal component (PC1), which contained Cu, Pb, and Zn, represented the most significant variation (50.43%), while Ni and Pb made up the second principal component (PC2), which accounted for 30.35 per cent of the overall variance. The first principal component (PC1) might be interpreted as a combination of anthropogenic and lithogenic sources, with the former originating from nonferrous mining tailings. In addition, a lithogenic and environmental constituent was also seen in As contamination. The major source of As was As-contaminated irrigation water and past mining activities. This result demonstrates that As and Pb come from both geological and industrial sources.
To determine the linear correlation between two metal elements, Pearson’s correlation coefficient was performed. The results of Pearson’s correlation matrix for the toxic metal concentrations are shown in Table 5. The Pearson coefficient ranges from −1 to 1, with −1 indicating a perfect negative correlation and 1 indicating a perfect positive correlation, while 0 indicates no link [13]. On the basis of the correlation matrix, Cu-Pb (r = 0.795), Cu-Zn (r = 0.878), Ni-Pb (r = 0.410), and Pb-Zn (r = 0.537) are significantly correlated, suggesting that the contaminants may have the same or comparable sources of contamination.

4.2. Assessment of Contamination and Environmental Risk

The classifications of the contamination factor (Cf) for toxic metal contaminations in the surface soil are shown in Figure 3. Based on the measured data, the Cf varied for the corresponding toxic metals as follows: As, 1.31–59.13; Cu, 0.22–1.55; Ni, 0.01–0.24; Pb, 0.11–1.59; and Zn, 0.41–4.61. The order of mean Cf was As (11.94) > Zn (1.18) > Cu (0.57) > Pb (0.43) > Ni (0.09). The assessment of Cf values showed that As was the major contaminant in the study soil because the mean concentration level of As represented an extreme contamination level (Cf > 6). The mean concentration level of Zn was low to moderate (1 ≤ Cf < 2), while Cu, Ni, and Pb had low contamination levels (Cf < 1). For As, the Cf result showed that 26 sampled locations were at an extreme contamination level (Cf > 6), two at a high to very high contamination, three at a high contamination, two at a moderate to high contamination, two at a moderate contamination, and four at a low to moderate contamination, as shown in Figure 3.
The toxic metal contamination and potential ecological risk of the surface soils were assessed using Cf, Er, and RI, as shown in Table 6. These three metal evaluation indices based on the soil toxic metal background reference value for the study soil can demonstrate the level of external contamination. The order of mean Er was As (119.44) > Cu (2.87) > Pb (2.17) > Zn (1.18) > Ni (0.46). The assessment of Er values also showed that As was the main contaminant in the study soil because the mean concentration level of As was at a considerable risk level (80 ≤ Er < 160). With the exception of As, the mean Er values of the remaining four metals were all less than 40, indicating that these metals presented a relatively low risk level in the soil.
The potential ecological risk index (RI) indicates the susceptibility of distinct biological ecosystems to toxic contaminants and depicts the possible ecological risk posed by toxic metals in the environment and living organisms [2,5,31]. This index was used to describe the contamination risk level in the soil as classified by Hakanson [25]. The whole study area including the three soccer grounds can be categorized as having a moderate ecological risk level. Most of the locations of this study area can be classified as having a low ecological risk level (RI < 150).

4.3. Spatial Distribution of Potential Ecological Risk Level

The spatial distribution pattern of the potential ecological risk level (RI) for five different toxic metals contaminations (i.e., As, Cu, Ni, Pb, and Zn) in the soil is shown in Figure 4. For the spatial distribution, the inverse distance weighting (IDW) interpolation technique was applied to evaluate the distribution of potential ecological risk levels for toxic metals in the surface soil, because it is a suitable approach for interpolating regularly spaced specific sampling point data [14]. GIS software was used to map the potential ecological risk level areas and classify them into four categories. According to the results of the potential ecological risk level distribution pattern, 73.52 per cent of the soils were at a low ecological risk level, 24.80 per cent were at a moderate ecological risk level, 1.50 per cent of soils had a considerable ecological risk level, while 0.19 per cent of soils were at a high ecological risk level. Furthermore, most areas are in the low ecological risk level zone, but specific areas of the soccer grounds are at moderate ecological risk levels because of the persistent use of As-contaminated irrigated water.

5. Conclusions

The toxic metal contamination and accumulation in soils can result in a variety of issues for the environment, plants, and humans. In this study, the sources, as well as the status of contamination, were identified by the Cf and Er of five different toxic metals in the Joya Verde soccer sports club’s surface soils. The primary metal contaminants were arsenic (As) and zinc (Zn), with amounts in most of the soil samples above the toxic metal background reference value. The Cf values revealed that the soil had a low range of contamination with Cu, Ni, Pb, a low to moderate range of contamination with Zn, and an extreme level of contamination with As. Additionally, Er demonstrated that the soil had a low risk of contamination with Cu, Ni, Pb, and Zn, but a very high risk of contamination with As. Based on PCA, the factors influencing toxic metal accumulation varied across the sampling locations. According to the level of potential ecological risk index (RI), arsenic poses the highest risk out of toxic metals, while the other metals have a low risk level. In comparison to the study location, the surrounding areas with intensive industrial operations, past mining activities, and the growth of urban populations were often characterized by a moderate and considerable potential ecological risk. The outcomes of this work provide better knowledge of toxic metal enrichment and the risk of soil used for sports purposes, which is a significant issue for human health.

Supplementary Materials

The poster presentation can be downloaded at: https://www.mdpi.com/article/10.3390/IOCAG2022-12214/s1.

Author Contributions

Conceptualization, A.S. and B.S.G.; methodology, A.S. and B.S.G.; software, A.S.; formal analysis, A.S., B.S.G., S.P. and N.M.-V.; investigation, A.S. and B.S.G.; resources, A.S., B.S.G. and S.P.; data curation, B.S.G. and N.M.-V.; writing—original draft preparation, A.S.; writing—review and editing, A.S., B.S.G., S.P. and N.M.-V.; visualization, A.S.; supervision, B.S.G. and S.P.; project administration, B.S.G.; funding acquisition, B.S.G. and N.M.-V. All authors have read and agreed to the published version of the manuscript.

Funding

This work was partly funded by the British Council UK-Mexico Institutional Grant No. 629008622. The grant supported the part-time research assistantship of Arnab Saha.

Institutional Review Board Statement

Not applicable.

Informed Consent Statement

Not applicable.

Data Availability Statement

The data and information cited in the paper can be found in the research and supplementary file.

Acknowledgments

The authors are thankful to the Institute of Infrastructure and Environment, The School of Energy, Geoscience, Infrastructure and Society (EGIS), Heriot–Watt University, Edinburgh for providing support and a student bursary to the first author for doctoral research through the James Watt Scholarship. The authors would also like to thank IPICyT, San Luis Potosi, Mexico for providing the necessary data, feedback, and support. We used some Arsenic toxic metal data and GIS shapefile data while working on this study, and the data has been published previously in the International Journal of Environmental Research and Public Health, MDPI in 2018 for a different type of study on toxic metal contamination. The details of all this data will be found in the manuscript titled “Distribution of Arsenic and Risk Assessment of Activities on Soccer Pitches Irrigated with Arsenic-Contaminated Water”.

Conflicts of Interest

The authors declare no conflict of interest.

References

  1. Mohammadi, F.; Samaei, M.R.; Azhdarpoor, A.; Teiri, H.; Badeenezhad, A.; Rostami, S. Modelling and optimizing pyrene removal from the soil by phytoremediation using response surface methodology, artificial neural networks, and genetic algorithm. Chemosphere 2019, 237, 124486. [Google Scholar] [CrossRef]
  2. Rostami, S.; Kamani, H.; Shahsavani, S.; Hoseini, M. Environmental monitoring and ecological risk assessment of heavy metals in farmland soils. Hum. Ecol. Risk Assess. Int. J. 2021, 27, 392–404. [Google Scholar] [CrossRef]
  3. Chen, H.; Teng, Y.; Lu, S.; Wang, Y.; Wang, J. Contamination features and health risk of soil heavy metals in China. Sci. Total Environ. 2015, 512, 143–153. [Google Scholar] [CrossRef]
  4. Lee, P.K.; Yu, S.; Jeong, Y.J.; Seo, J.; Choi, S.G.; Yoon, B.Y. Source identification of arsenic contamination in agricultural soils surrounding a closed Cu smelter, South Korea. Chemosphere 2019, 217, 183–194. [Google Scholar] [CrossRef]
  5. Liu, P.; Hu, W.; Tian, K.; Huang, B.; Zhao, Y.; Wang, X.; Khim, J.S. Accumulation and ecological risk of heavy metals in soils along the coastal areas of the Bohai Sea and the Yellow Sea: A comparative study of China and South Korea. Environ. Int. 2020, 137, 105519. [Google Scholar] [CrossRef]
  6. Rinklebe, J.; Antoniadis, V.; Shaheen, S.M.; Rosche, O.; Altermann, M. Health risk assessment of potentially toxic elements in soils along the Central Elbe River, Germany. Environ. Int. 2019, 126, 76–88. [Google Scholar] [CrossRef]
  7. Rafiee, A.; Delgado-Saborit, J.M.; Sly, P.D.; Quémerais, B.; Hashemi, F.; Akbari, S.; Hoseini, M. Environmental chronic exposure to metals and effects on attention and executive function in the general population. Sci. Total Environ. 2020, 705, 135911. [Google Scholar] [CrossRef]
  8. Sharma, R.K.; Agrawal, M. Biological effects of heavy metals: An overview. J. Environ. Biol. 2005, 26, 301–313. [Google Scholar]
  9. Qi, H.; Zhao, B.; Li, L.; Chen, X.; An, J.; Liu, X. Heavy metal contamination and ecological risk assessment of the agricultural soil in Shanxi Province, China. R. Soc. Open Sci. 2020, 7, 200538. [Google Scholar] [CrossRef]
  10. Wei, B.; Yang, L. A review of heavy metal contaminations in urban soils, urban road dusts and agricultural soils from China. Microchem. J. 2010, 94, 99–107. [Google Scholar] [CrossRef]
  11. Gupta, S.K.; Ansari, F.A.; Nasr, M.; Chabukdhara, M.; Bux, F. Multivariate analysis and health risk assessment of heavy metal contents in foodstuffs of Durban, South Africa. Environ. Monit. Assess. 2018, 190, 1–15. [Google Scholar] [CrossRef]
  12. United States Environmental Protection Agency. USEPA R-bCT and Manual EPSG; United States Environmental Protection Agency: Washington, DC, USA, 2000.
  13. Tisha, S.M.; Chowdhury, T.R.; Hossain, M.D. Heavy Metal Contamination and Ecological Risk Assessment in the Soil of Tannery Industry at Savar. Chem. Eng. Res. Bull. 2020, 106–113. [Google Scholar] [CrossRef]
  14. Martínez-Villegas, N.; Hernández, A.; Meza-Figueroa, D.; Sen Gupta, B. Distribution of arsenic and risk assessment of activities on soccer pitches irrigated with arsenic-contaminated water. Int. J. Environ. Res. Public Health 2018, 15, 1060. [Google Scholar] [CrossRef] [Green Version]
  15. Castro-Larragoitia, J.; Kramar, U.; Puchelt, H. 200 years of mining activities at La Paz/San Luis Potosí/Mexico—Consequences for environment and geochemical exploration. J. Geochem. Explor. 1997, 58, 81–91. [Google Scholar] [CrossRef]
  16. Razo, I.; Carrizales, L.; Castro, J.; Díaz-Barriga, F.; Monroy, M. Arsenic and heavy metal pollution of soil, water and sediments in a semi-arid climate mining area in Mexico. Water Air Soil Pollut. 2004, 152, 129–152. [Google Scholar] [CrossRef]
  17. Martínez-Villegas, N.; Briones-Gallardo, R.; Ramos-Leal, J.A.; Avalos-Borja, M.; Castañón-Sandoval, A.D.; Razo-Flores, E.; Villalobos, M. Arsenic mobility controlled by solid calcium arsenates: A case study in Mexico showcasing a potentially widespread environmental problem. Environ. Pollut. 2013, 176, 114–122. [Google Scholar] [CrossRef]
  18. Manz, M.; Castro, L.J. The environmental hazard caused by smelter slags from the Sta. Maria de la Paz mining district in Mexico. Environ. Pollut. 1997, 98, 7–13. [Google Scholar] [CrossRef]
  19. Chapa-Vargas, L.; Mejia-Saavedra, J.J.; Monzalvo-Santos, K.; Puebla-Olivares, F. Blood lead concentrations in wild birds from a polluted mining region at Villa de La Paz, San Luis Potosi, Mexico. J. Environ. Sci. Health Part A 2010, 45, 90–98. [Google Scholar] [CrossRef]
  20. INEGI. Prontuario de Información Geográfica Municipal de los Estados Unidos Mexicanos; Instituto Nacional de EstadísticaGeografía e Informática: San Luis Potosí, Mexico, 2009. [Google Scholar]
  21. Ruíz-Huerta, E.A.; De la Garza Varela, A.; Gómez-Bernal, J.M.; Castillo, F.; Avalos-Borja, M.; SenGupta, B.; Martínez-Villegas, N. Arsenic contamination in irrigation water, agricultural soil and maize crop from an abandoned smelter site in Matehuala, Mexico. J. Hazard. Mater. 2017, 339, 330–339. [Google Scholar] [CrossRef]
  22. Vercoutere, K.; Fortunati, U.; Muntau, H.; Griepink, B.; Maier, E.A. The certified reference materials CRM 142 R light sandy soil, CRM 143 R sewage sludge amended soil and CRM 145 R sewage sludge for quality control in monitoring environmental and soil pollution. Fresenius’ J. Anal. Chem. 1995, 352, 197–202. [Google Scholar] [CrossRef]
  23. United States Environmental Protection Agency (USEPA). Method 200.7: Revision 4.4, Determination of Metals and Trace Elements in Water and Wastes by Inductively Coupled Plasma-Atomic Emission Spectrometry; United States Environmental Protection Agency: Cincinnati, OH, USA, 1994.
  24. Guo, W.; Liu, X.; Liu, Z.; Li, G. Pollution and potential ecological risk evaluation of heavy metals in the sediments around Dongjiang Harbor, Tianjin. Procedia Environ. Sci. 2010, 2, 729–736. [Google Scholar] [CrossRef] [Green Version]
  25. Hakanson, L. An ecological risk index for aquatic pollution control. A Sedimentol. Approach. Water Res. 1980, 14, 975–1001. [Google Scholar] [CrossRef]
  26. Wang, X.; Deng, C.; Yin, J.; Tang, X. Toxic heavy metal contamination assessment and speciation in sugarcane soil. In IOP Conference Series: Earth and Environmental Science; IOP Publishing: Bristol, UK, 2018; Volume 108, p. 042059. [Google Scholar] [CrossRef]
  27. Mahabadi, H.M.; Ramroudi, M.; Asgharipour, M.R.; Rahmani, H.R.; Afyuni, M. Evaluation of the ecological risk index (Er) of heavy metals (HMs) pollution in urban field soils. SN Appl. Sci. 2020, 2, 1–8. [Google Scholar] [CrossRef]
  28. Kang, Z.; Wang, S.; Qin, J.; Wu, R.; Li, H. Pollution characteristics and ecological risk assessment of heavy metals in paddy fields of Fujian province, China. Sci. Rep. 2020, 10, 12244. [Google Scholar] [CrossRef]
  29. Hu, Y.; Liu, X.; Bai, J.; Shih, K.; Zeng, E.Y.; Cheng, H. Assessing heavy metal pollution in the surface soils of a region that had undergone three decades of intense industrialization and urbanization. Environ. Sci. Pollut. Res. 2013, 20, 6150–6159. [Google Scholar] [CrossRef]
  30. Ogundele, D.T.; Adio, A.A.; Oludele, O.E. Heavy metal concentrations in plants and soil along heavy traffic roads in North Central Nigeria. J. Environ. Anal. Toxicol. 2015, 5, 1. [Google Scholar] [CrossRef]
  31. Yi, Y.; Yang, Z.; Zhang, S. Ecological risk assessment of heavy metals in sediment and human health risk assessment of heavy metals in fishes in the middle and lower reaches of the Yangtze River basin. Environ. Pollut. 2011, 159, 2575–2585. [Google Scholar] [CrossRef]
Figure 1. Locations of soil samples are shown on a map of the study area.
Chemproc 10 00059 g001
Figure 2. Box and whisker plots showing toxic metal concentrations, with the median at the middle of the box and the lower and upper quartiles at the bottom and top of the box.
Chemproc 10 00059 g002
Figure 3. Classifications of the contamination factor (Cf) for soil sampling locations.
Chemproc 10 00059 g003
Figure 4. Spatial distribution of potential ecological risk index (RI).
Chemproc 10 00059 g004
Table 1. Contamination indices classification for soil.
IndexCategoryDescriptionReferences
Contamination factor (Cf)Cf < 1Low contamination[25,26]
1 ≤ Cf < 2Low to moderate contamination
2 ≤ Cf < 3Moderate contamination
3 ≤ Cf < 4Moderate to high contamination
4 ≤ Cf < 5High contamination
5 ≤ Cf < 6High to very high contamination
Cf ≥ 6 Extreme contamination
Ecological risk factor (Er)Er < 40Low risk[2,27]
40 ≤ Er < 80Moderate risk
80 ≤ Er < 160Considerable risk
160 ≤ Er < 320High risk
Er ≥ 320Very high risk
Potential Ecological Risk Index (RI)RI < 150Low risk[28,29]
150 ≤ RI < 300Moderate risk
300 ≤ RI < 600Considerable risk
RI ≥ 600High risk
Table 2. Toxic-response factor values of toxic metals by Hakanson [25].
MetalsAsCuNiPbZn
Toxic-response factor105551
Table 3. Descriptive statistics for selected toxic metals from soil samples.
Arsenic (As)Copper (Cu)Nickel (Ni)Lead (Pb)Zinc (Zn)
Mean (Measured)119.4420.653.2036.9558.93
Standard Error17.541.560.303.975.56
Median90.5118.103.0730.8654.57
Standard Deviation109.549.751.8724.7934.71
Kurtosis8.373.630.935.7315.38
Skewness2.431.680.932.123.27
Range578.1747.858.13126.30209.81
Minimum13.147.880.248.9920.53
Maximum591.3155.738.37135.29230.34
Sum4658.01805.17124.901440.992298.24
Coefficient of variation (CV) (%)91.7147.2258.3267.1058.90
Samples3939393939
Confidence Level (95.0%)35.513.160.618.0411.25
Permissible Limits (mg/kg)1036358550
Table 4. Principal component analysis of toxic metals (Components with a value larger than 0.32 are bolded).
ElementsPrincipal ComponentsCommunalities
PC1PC2
As0.119−0.8380.717
Cu0.9810.0670.966
Ni0.2350.8160.722
Pb0.8190.3420.788
Zn0.905−0.1640.846
Eigenvalue2.5221.517
% of variance50.43130.347
Cumulative %50.43180.778
Table 5. Pearson’s correlation matrix for selected toxic metals in the surface soil.
MetalsAsCuNiPbZn
As1
Cu0.0291
Ni−0.408 **0.2641
Pb−0.1370.795 **0.410 **1
Zn0.1300.878 **0.0540.537 **1
** p < 0.01.
Table 6. Contamination factor (Cf), Ecological risk factor (Er), and Potential Ecological Risk Index (RI) assessment of the toxic metals in the study soils.
Heavy MetalsAsCuNiPbZnRI
Contamination IndicesCfErCfErCfErCfErCfEr
Mean (x)11.94119.440.572.870.090.460.432.171.181.18126.11
Median (med)9.0590.510.502.510.090.440.361.821.091.09100.34
Minimum (min)1.3113.140.221.090.010.030.110.530.410.4117.32
Maximum (max)59.13591.311.557.740.241.201.597.964.614.61601.34
Standard deviation (SD)10.95109.540.271.350.050.270.291.460.690.69109.41
Publisher’s Note: MDPI stays neutral with regard to jurisdictional claims in published maps and institutional affiliations.

