
Comparison of Soils of Two Fields for Potato Production Located in the Same Region of Portugal †

 ,
,  ,
,  ,
,  ,
,  ,
,  , , , ,
  ,
,  , , and
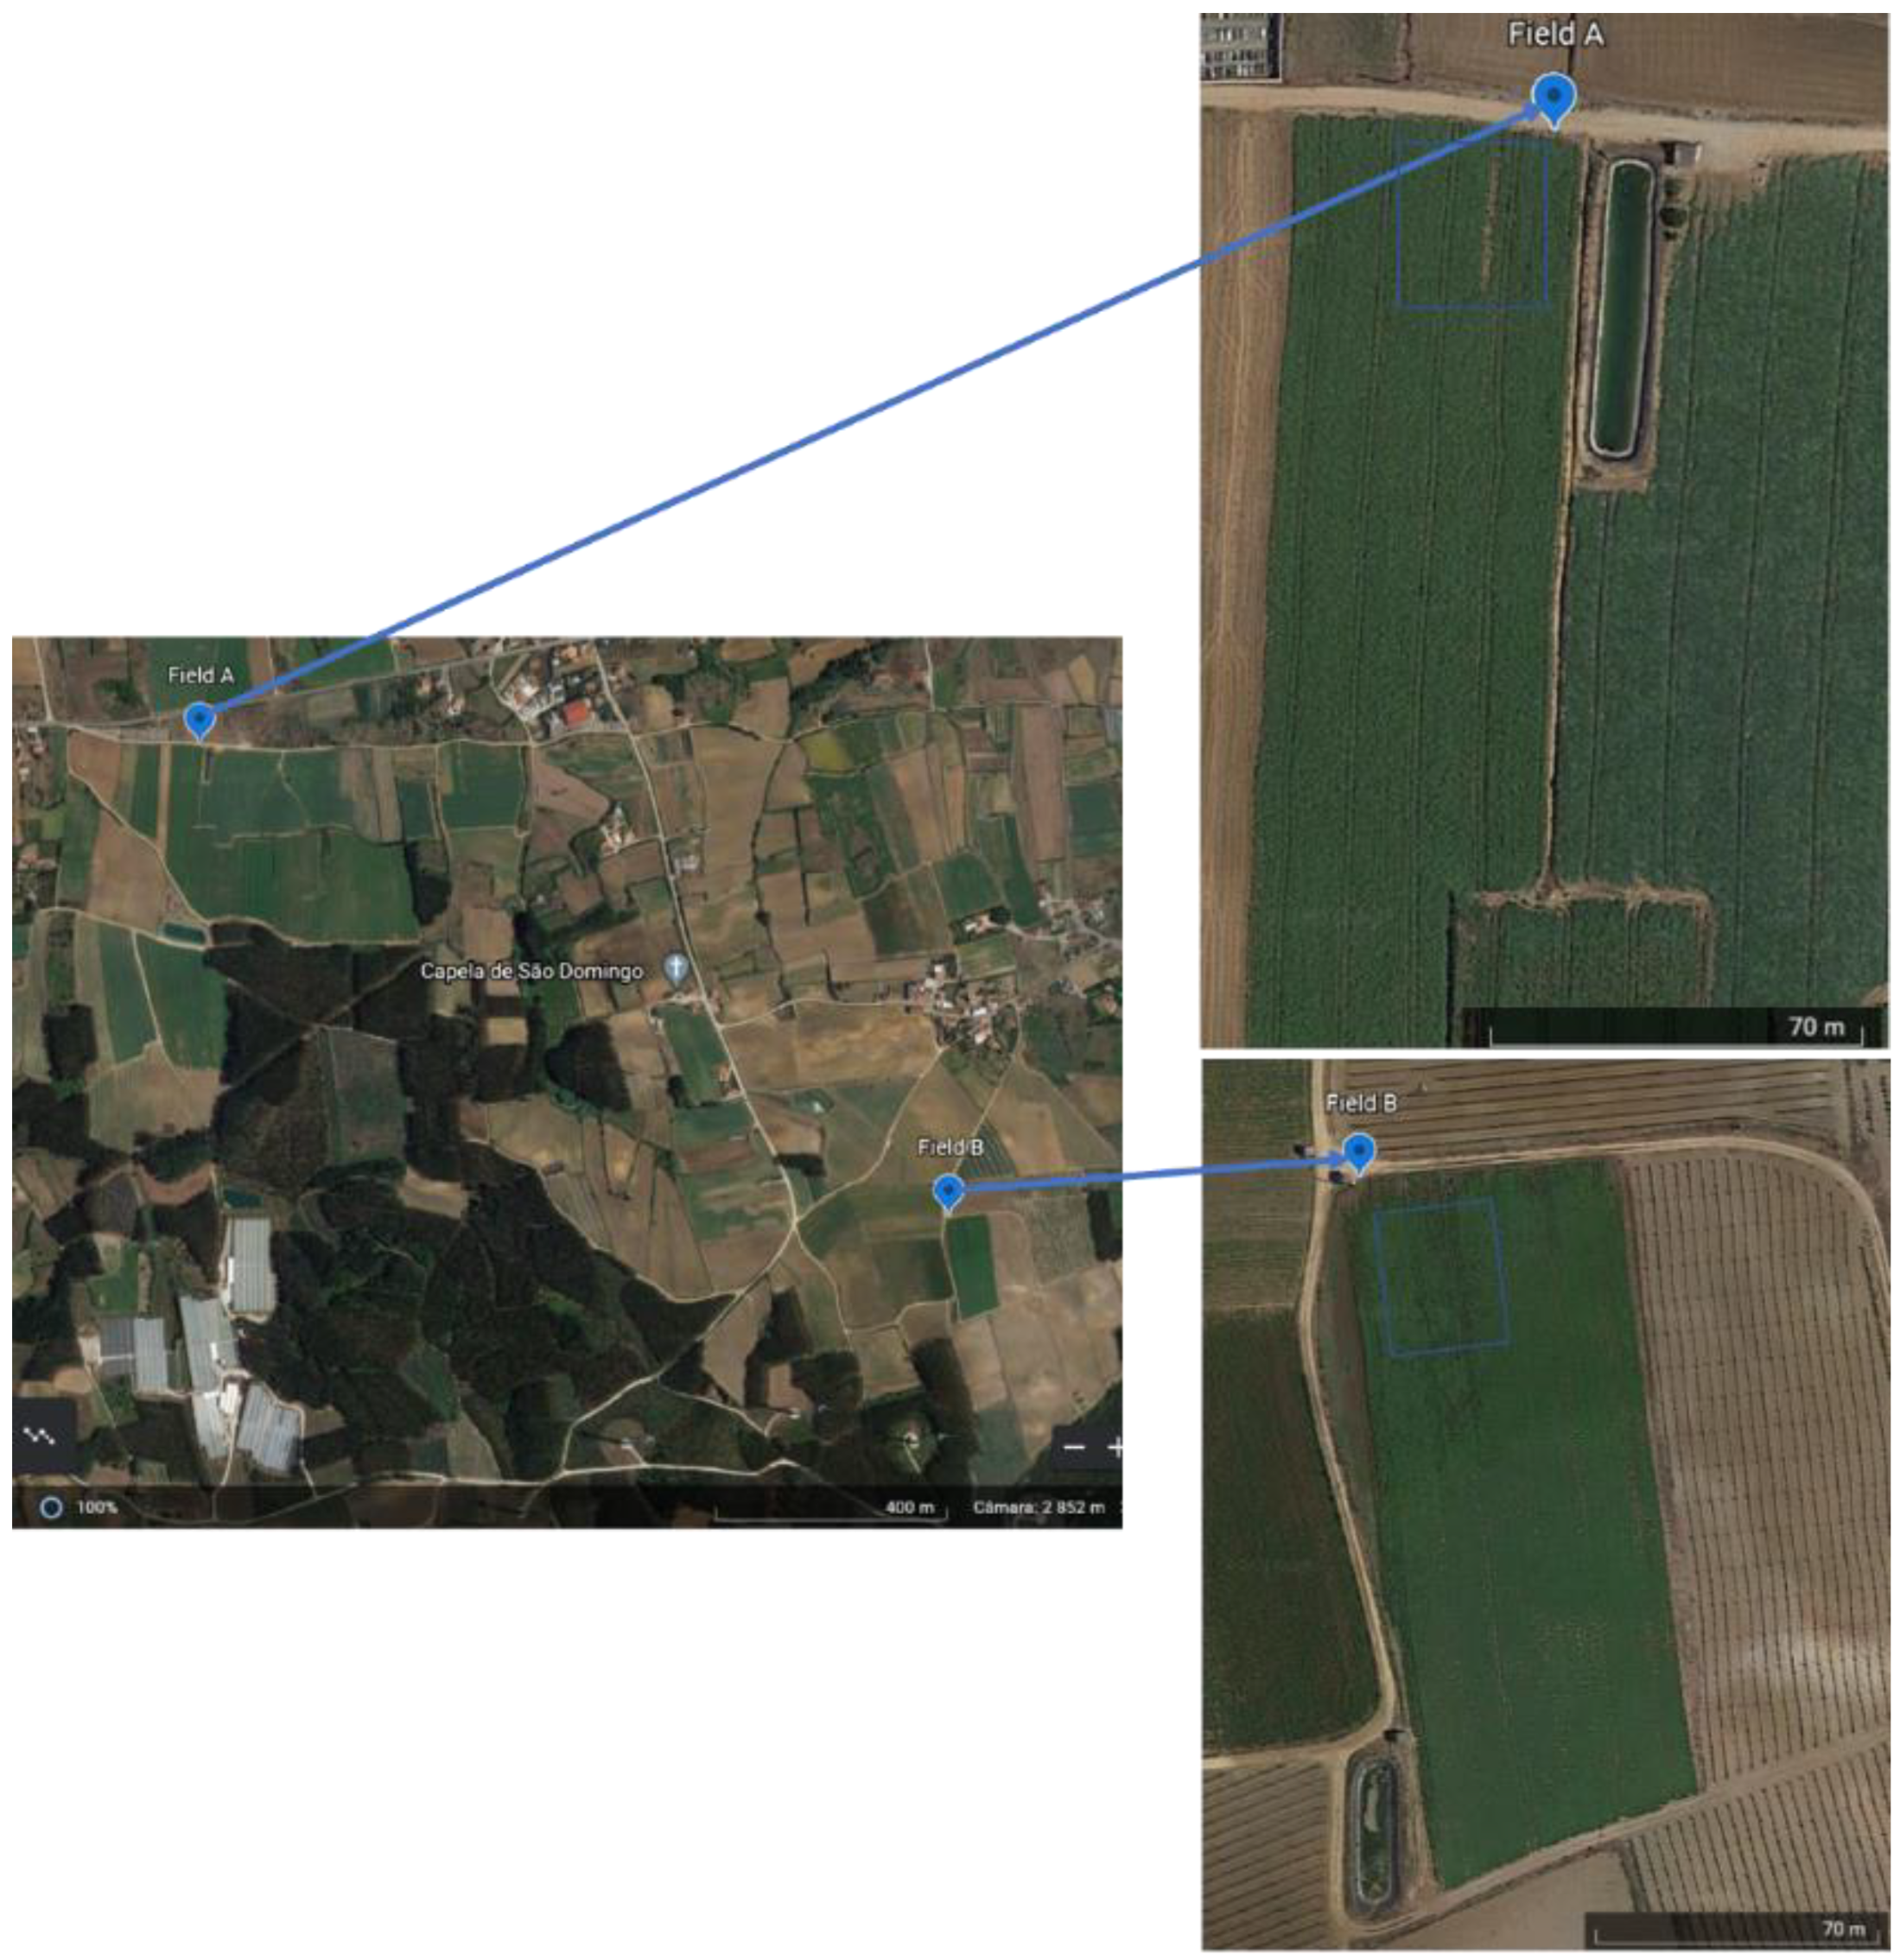
Abstract
:1. Introduction
2. Materials and Methods
2.1. Experimental Fields
2.2. Mineral Content, pH, Organic Matter, and Electrical Conductivity in Soils
2.3. Statistical Analysis
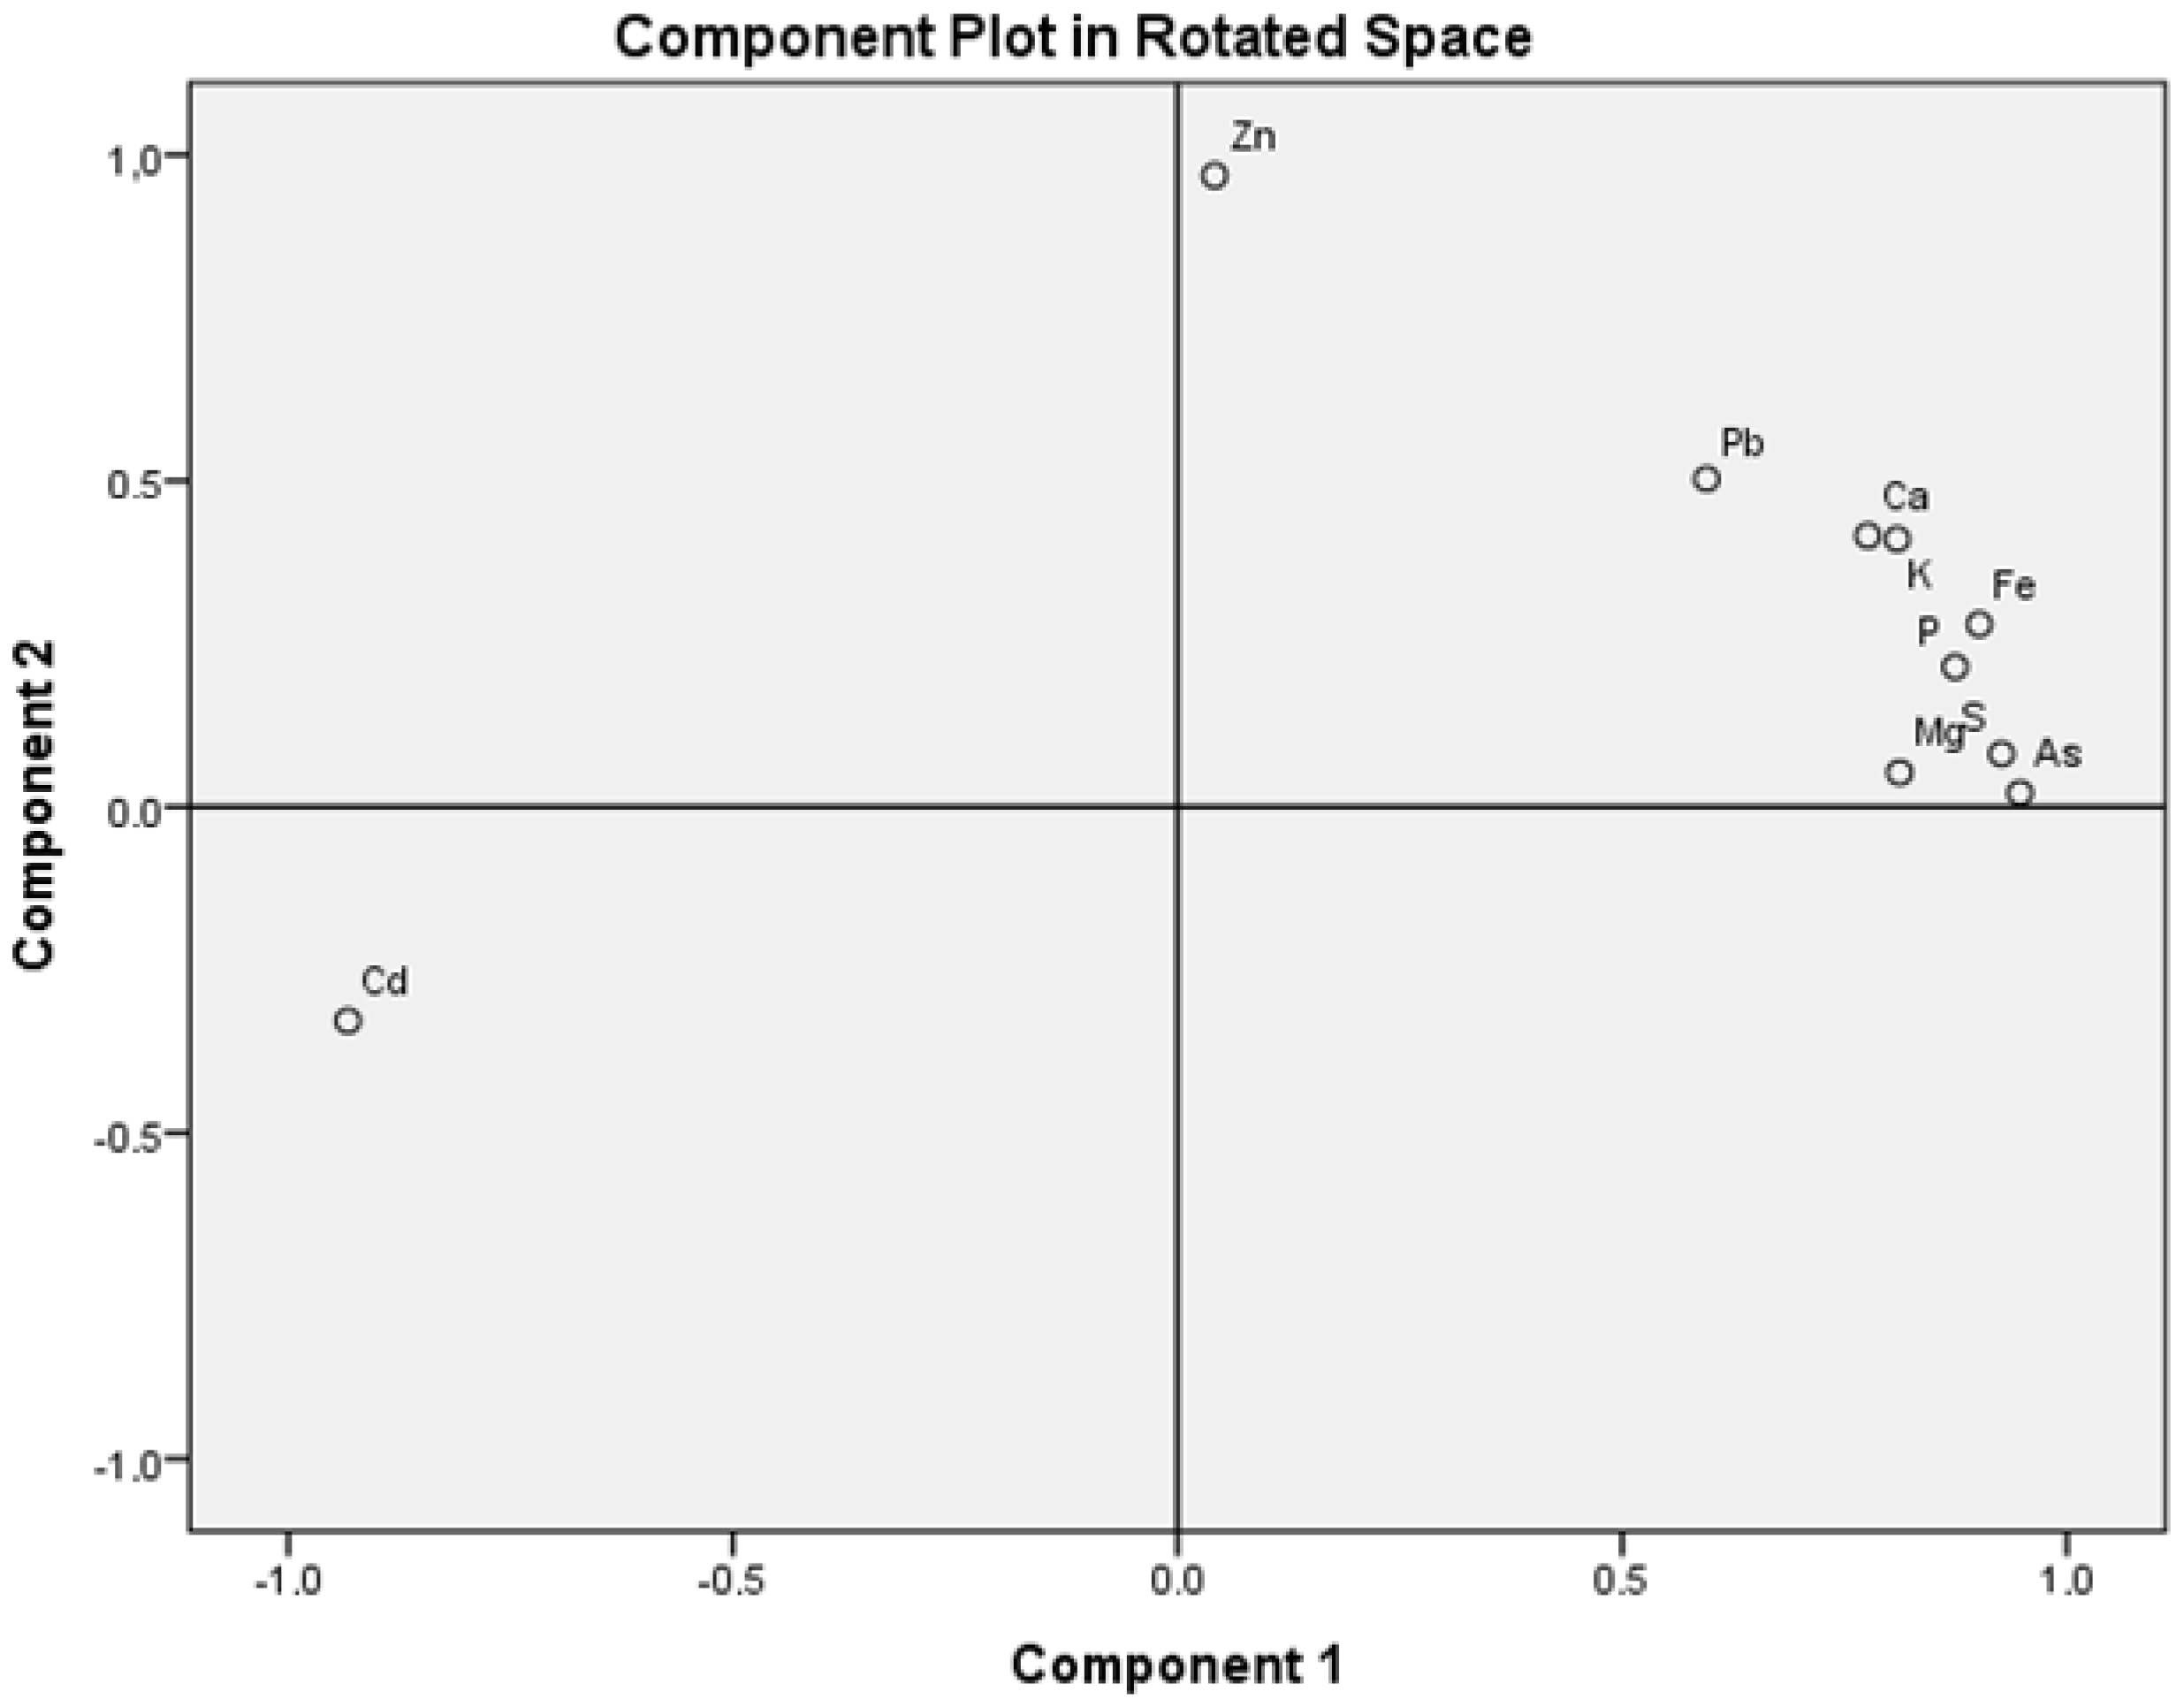
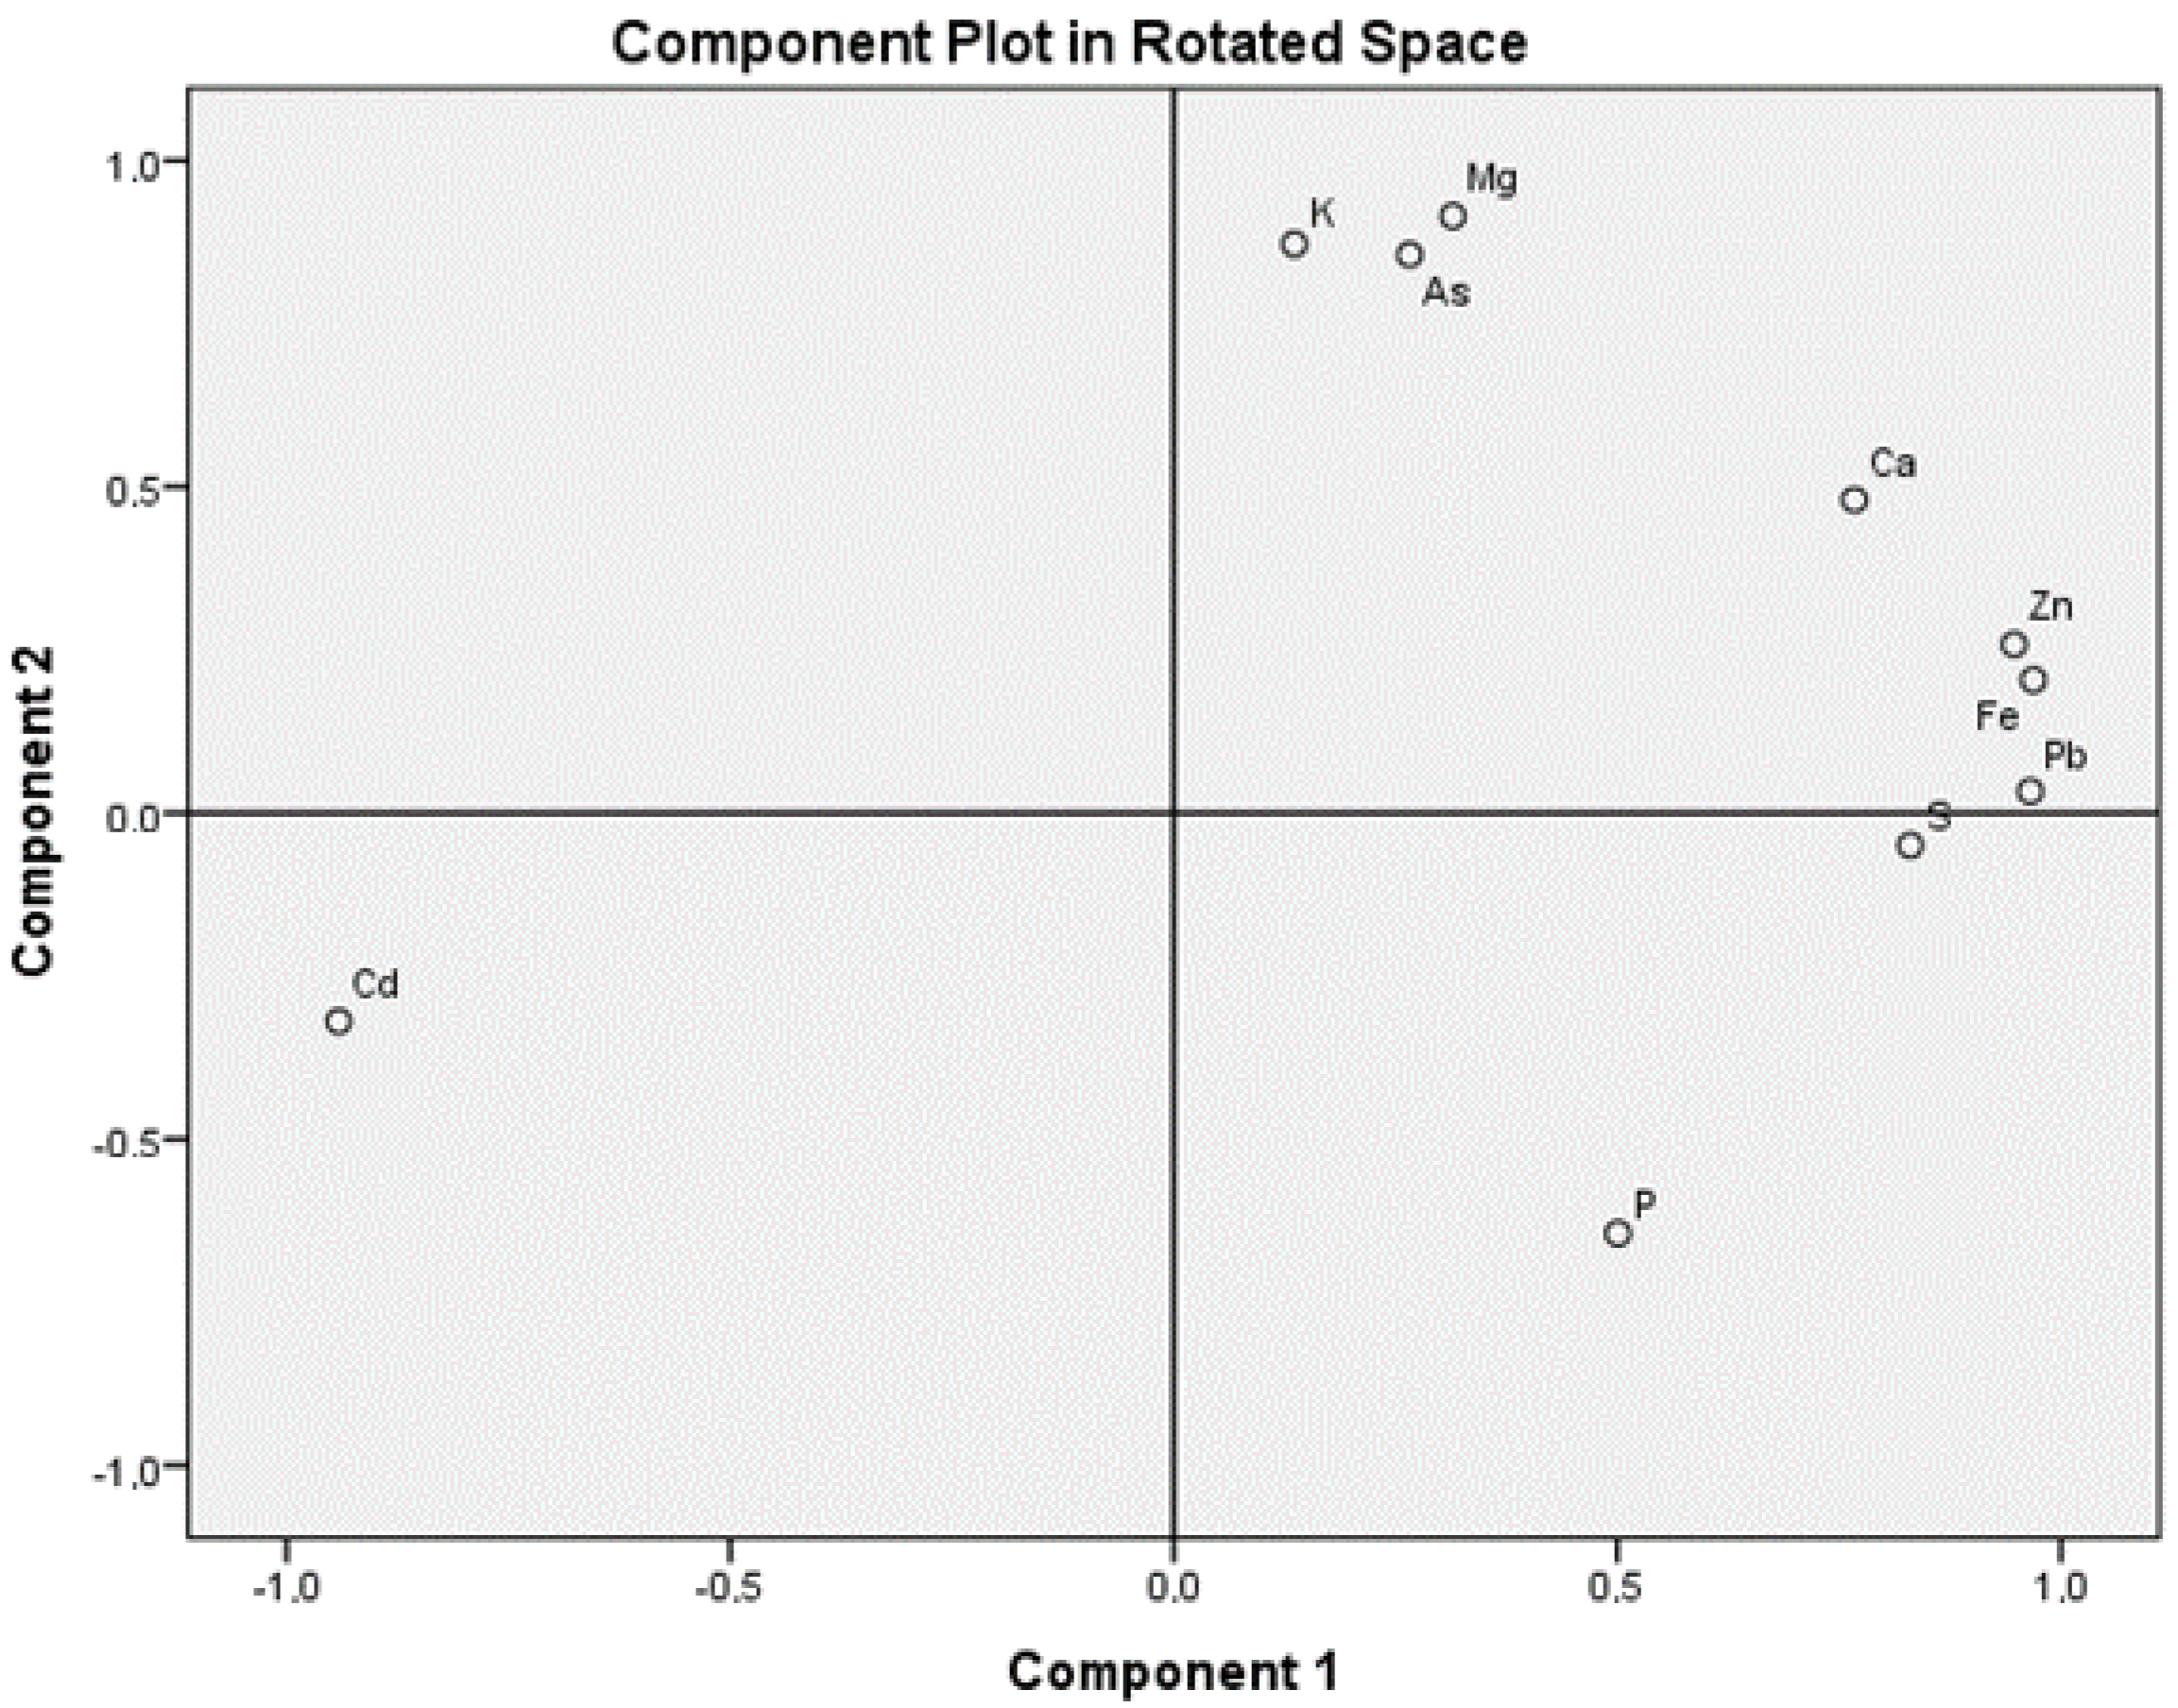
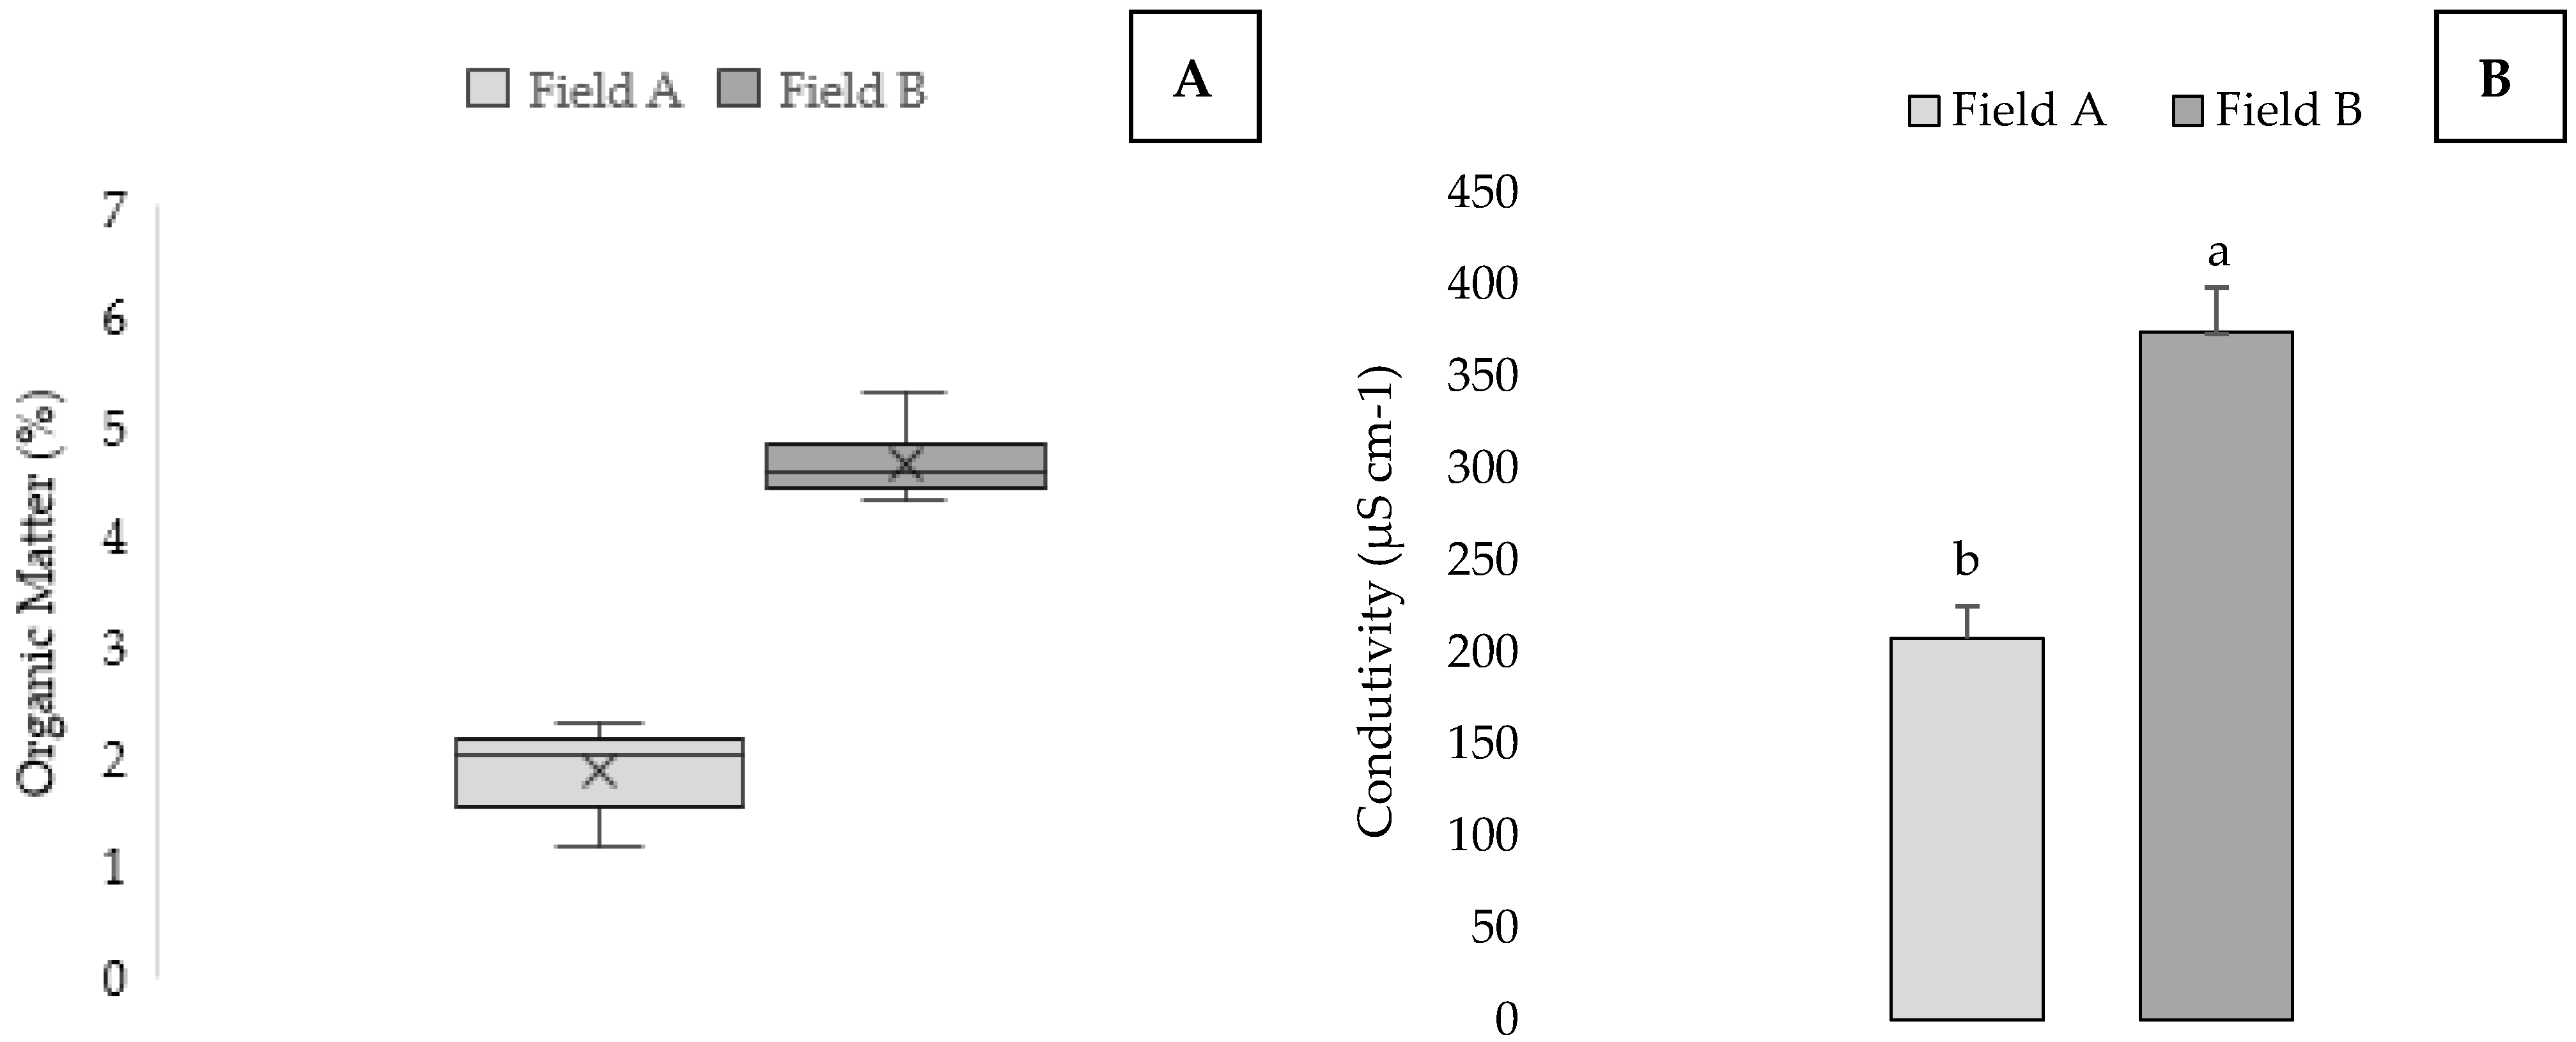
3. Results
4. Discussion
5. Conclusions
Supplementary Materials
Author Contributions
Funding
Institutional Review Board Statement
Informed Consent Statement
Data Availability Statement
Acknowledgments
Conflicts of Interest
References
- Benjamin, J.G.; Nielsen, D.C.; Vigil, M.F. Quantifying effects of soil conditions on plant growth and crop production. Geoderma 2003, 116, 137–148. [Google Scholar] [CrossRef]
- Yang, T.; Siddique, K.H.; Liu, K. Cropping systems in agriculture and their impact on soil health—A review. GECCO 2020, 23, e01118. [Google Scholar] [CrossRef]
- Khan, H.; Acharya, B.; Farooque, A.A.; Abbas, F.; Zaman, Q.U.; Esau, T. Soil and crop variability induced management zones to optimize potato tuber yield. Appl. Eng. Agric. 2020, 36, 499–510. [Google Scholar] [CrossRef]
- CIP—International Potato Center. Potato Facts and Figures. Available online: https://cipotato.org/crops/potato/potato-facts-and-figures/ (accessed on 20 November 2021).
- Subramanian, N.K.; White, P.J.; Broadley, M.R.; Ramsay, G. The three-dimensional distribution of minerals in potato tubers. Ann. Bot. 2011, 107, 681–691. [Google Scholar] [CrossRef] [PubMed] [Green Version]
- Vander, P.Z. Soil Fertility Requirements for Potato Production; CIP: Lima, Peru, 1981. [Google Scholar]
- Wood, S.A.; Tirfessa, D.; Baudron, F. Soil organic matter underlies crop nutritional quality and productivity in smallholder agriculture. Agric. Ecosyst. Environ. 2018, 266, 100–108. [Google Scholar] [CrossRef]
- Minasny, B.; Hong, S.Y.; Hartemink, A.E.; Kim, Y.H.; Kang, S.S. Soil pH increase under paddy in South Korea between 2000 and 2012. Agric. Ecosyst. Environ. 2016, 221, 205–213. [Google Scholar] [CrossRef]
- Chen, S.; Lin, B.; Li, Y.; Zhou, S. Spatial and temporal changes of soil properties and soil fertility evaluation in a large grain-production area of subtropical plain, China. Geoderma 2020, 357, 113937. [Google Scholar] [CrossRef]
- Clay, D.E.; Chang, J.; Malo, D.D.; Carlson, C.G.; Reese, C.; Clay, S.A.; Ellsbury, M.; Berg, B. Factors influencing spatial variability of soil apparent electrical conductivity. Commun. Soil Sci. Plant Anal. 2001, 32, 2993–3008. [Google Scholar] [CrossRef] [Green Version]
- Cambouris, A.N.; Nolin, M.C.; Zebarth, B.J.; Laverdière, M.R. Soil management zones delineated by electrical conductivity to characterize spatial and temporal variations in potato yield and in soil properties. Am. J. Pot Res 2006, 83, 381–395. [Google Scholar] [CrossRef]
- Hattar, B.I.; Taimeh, A.Y.; Ziadat, F.M. Variation in soil chemical properties along toposequences in an arid region of the Levant. Catena 2010, 83, 34–45. [Google Scholar] [CrossRef]
- Pelica, J.; Barbosa, S.; Reboredo, F.; Lidon, F.; Pessoa, F.; Calvão, T. The paradigm of high concentration of metals of natural or anthropogenic origin in soils–the case of Neves-Corvo mine area (southern Portugal). J. Geochem. Explor. 2018, 186, 12–23. [Google Scholar] [CrossRef]
- Pessoa, M.F.; Scotti-Campos, P.; Pais, I.; Feteiro, A.; Canuto, D.; Simões, M.; Pelica, J.; Pataco, I.; Ribeiro, V.; Reboredo, F.H.; et al. Nutritional profile of the Portuguese cabbage (Brassica oleracea L var. costata) and its relationship with the elemental soil analysis. Emir. J. Food Agric. 2016, 28, 381–388. [Google Scholar] [CrossRef] [Green Version]
- Pessoa, C.C.; Lidon, F.C.; Coelho, A.R.F.; Caleiro, J.C.; Marques, A.C.; Luís, I.C.; Kullberg, J.C.; Legoinha, P.; Brito, M.G.; Ramalho, J.C.; et al. Calcium biofortification of Rocha pears, tissues accumulation and physicochemical implications in fresh and heat-treated fruits. Sci. Hortic. 2021, 277, 109834. [Google Scholar] [CrossRef]
- Manupella, G.; Antunes, M.T.; Pais, J.; Ramalho, M.M.; Rey, J. Notícia Explicativa da Folha 30-A Lourinhã; Departamento de Geologia–Instituto Geológico e Mineiro: Lisboa, Portugal, 1999. [Google Scholar]
- Zbyszewski, G.; Ferreira, O.V.; Manupella, G.; Assunção, G.T. Carta Geológica de Portugal na escala 1/50,000—Notícia Explicativa da Folha 30-B Bombarral; Ministério da Economia, Secretaria de Estado da Indústria–Direcção-Geral de Minas e Serviços Geológicos–Serviços Geológicos de Portugal: Lisboa, Portugal, 1966. [Google Scholar]
- Decreto-Lei nº 118/2006 de 21 de Junho–O Decreto-Lei n.o 446/91, de 22 de Novembro, Estabelece o Regime Jurídico da Utilização Agrícola das Lamas de Depuração e Demais Legislação Regulamentar, Transpondo para a Ordem Jurídica Nacional a Directiva n.o 1186/278/CE, do Conselho, de 12 de Junho, Relativa à Protecção do Ambiente e em Especial dos Solos na Utilização Agrícola das Lamas. Available online: https://dre.pt/dre/detalhe/decreto-lei/118-2006-37103 (accessed on 19 November 2021).
- IPNI. Soil pH and the Availability of Plant Nutrients. Plant Nutrition TODAY. International Plant Nutrition Institute. Fall 2010, No. 2. Available online: www.ipni.net (accessed on 20 November 2021).
- Muthoni, J. Soil fertility situation in potato producing Kenyan highlands Case of KALRO-Tigoni. Int. J. Hortic. Sci. 2016, 6, 1–11. [Google Scholar] [CrossRef]
- Corwin, D.L.; Lesch, S.M. Apparent soil electrical conductivity measurements in agriculture. Comput. Electron. Agric. 2005, 46, 11–43. [Google Scholar] [CrossRef]
- Jaarsma, R.; De Boer, A.H. Salinity tolerance of two potato cultivars (Solanum tuberosum) correlates with differences in vacuolar transport activity. Front. Plant Sci. 2018, 9, 737. [Google Scholar] [CrossRef] [PubMed] [Green Version]


Publisher’s Note: MDPI stays neutral with regard to jurisdictional claims in published maps and institutional affiliations. |
© 2022 by the authors. Licensee MDPI, Basel, Switzerland. This article is an open access article distributed under the terms and conditions of the Creative Commons Attribution (CC BY) license (https://creativecommons.org/licenses/by/4.0/).
Share and Cite
Coelho, A.R.F.; Daccak, D.; Marques, A.C.; Luís, I.C.; Pessoa, C.C.; Silva, M.M.; Simões, M.; Reboredo, F.H.; Pessoa, M.F.; Legoinha, P.; et al. Comparison of Soils of Two Fields for Potato Production Located in the Same Region of Portugal. Chem. Proc. 2022, 10, 53. https://doi.org/10.3390/IOCAG2022-12184
Coelho ARF, Daccak D, Marques AC, Luís IC, Pessoa CC, Silva MM, Simões M, Reboredo FH, Pessoa MF, Legoinha P, et al. Comparison of Soils of Two Fields for Potato Production Located in the Same Region of Portugal. Chemistry Proceedings. 2022; 10(1):53. https://doi.org/10.3390/IOCAG2022-12184
Chicago/Turabian StyleCoelho, Ana Rita F., Diana Daccak, Ana Coelho Marques, Inês Carmo Luís, Cláudia Campos Pessoa, Maria Manuela Silva, Manuela Simões, Fernando H. Reboredo, Maria F. Pessoa, Paulo Legoinha, and et al. 2022. "Comparison of Soils of Two Fields for Potato Production Located in the Same Region of Portugal" Chemistry Proceedings 10, no. 1: 53. https://doi.org/10.3390/IOCAG2022-12184