1. Introduction
The world trade of agricultural products has been growing every year, having a great impact on the global economy. Data show that world trade has grown at an average of 3.3% per year since 2015, rising from USD 1.2 trillion in 2015 to USD 1.4 trillion in 2019 (13.6% increase) [
1]. The main agricultural products traded in 2019 were maize, wheat, soybean, soybean cake and palm oil. These products represent almost 40% of all agribusiness exports in metric tons [
1].
Due to the advances in cultivation methods and significant improvements in logistics systems, agribusiness and, in particular, the grain market, has been gradually growing and diversifying its players. According to Sanguinet et al. [
2], after 1994, agricultural trade became part of the World Trade Organization (WTO) rounds. This led to an intensification of international bilateral and multilateral trade.
Complex systems, such as agribusiness exports, are difficult to fully understand, so it is important to consider different approaches and tools. Mendes dos Reis et al. [
3] analyzed soybean exports using the logistics performance index (LPI) and the gravity model approach. Sutrisno et al. [
4] used interpretative structural modeling (ISM) to analyze institutions that play a role in agribusiness systems. Kamilaris, Kartakoullis and Prenafeta-Boldu [
5] studied the use of big data analysis in Agriculture.
Although these studies explore various aspects of agribusiness using different data analysis techniques, there are few studies that use social network analysis (SNA) in the trade of agricultural products, and none related to the global grain trade, reinforcing the importance of this study.
SNA can contribute to an understanding of trade relationships in the agribusiness sector. In this study, we adopted SNA to better understand trade relations in three important global commodities: soybean, soybean cake and maize. We aim to comprehend the connections between the main exporters and importers. These commodities were chosen because they use the same logistics infrastructure and are connected both to human food consumption and commercial animal production. Data analysis was conducted using UCINET and NetDRAW software, and three SNA measures were adopted: centrality degree, K-core and volume of trade (line strength).
This paper is divided as follows: the Introduction address the article proposal and some background; the Methodology presents the procedures of the research; the Results section presents the findings of the research; the Discussion shows the implications and analysis; and, finally, the Conclusion section summarizes the final remarks of the study.
2. Methodology
To conduct this study, the first step was data collection. We used the Food and Agriculture Organization of the United Nations (FAO) database to extract data on exports of soybean, soybean cake, and maize in the last year available (2019) [
1]. The FAO database gathers information provided by the countries. The data representing the exports of these commodities in metric tons were exported to a CSV (comma-separated values) file and then organized later using Microsoft Excel software.
Afterwards, we amended some of the data settings. Autonomous regions such as Taiwan, Hong Kong, and Macau were included with mainland China. Moreover, we decided to establish a minimum value of 1000 metric tones of trade. These adjustments intended to avoid data outliers and fluctuations that cause a distortion in the analysis. Despite these minor modifications, our sample represents at least 90% of trade for three categories.
Additionally, we built a matrix with exporters in rows and importers in columns. The intersections represent the amount of metric tons traded. It was necessary to set the matrix as quadratic—in other words, all countries involved in the analysis must be part of both the columns and the rows, even if they are not importers or exporters.
To perform data analysis, the quadratic matrix was loaded into the UCINET 6.732 software from Analytic Technologies [
6]. Afterwards, we transferred the data to NetDRAW 2.168 application [
7]. This module converted the data in a network graphic where the measures could be represented. The data type for the network was a 1-Mode Network, and we set the options to ignore reflexive ties, i.e., ignore missing values and zeros.
After that, we applied the node centrality measures—setting node size by degree—and volume of exports [
6].Centrality degree is a centrality measure that represents the number of ties of a given type that a node possesses [
8,
9].
Another measure applied was the k-core. A k-core is a subgraph in which every actor possesses a degree k or more with the other actors in the subgraph [
10]. We also used the thickness of connections. This measure can be used to indicate the interaction frequency [
9], the bond strength between the pairs [
11], or the connection volume [
8].
3. Results
3.1. Soybean
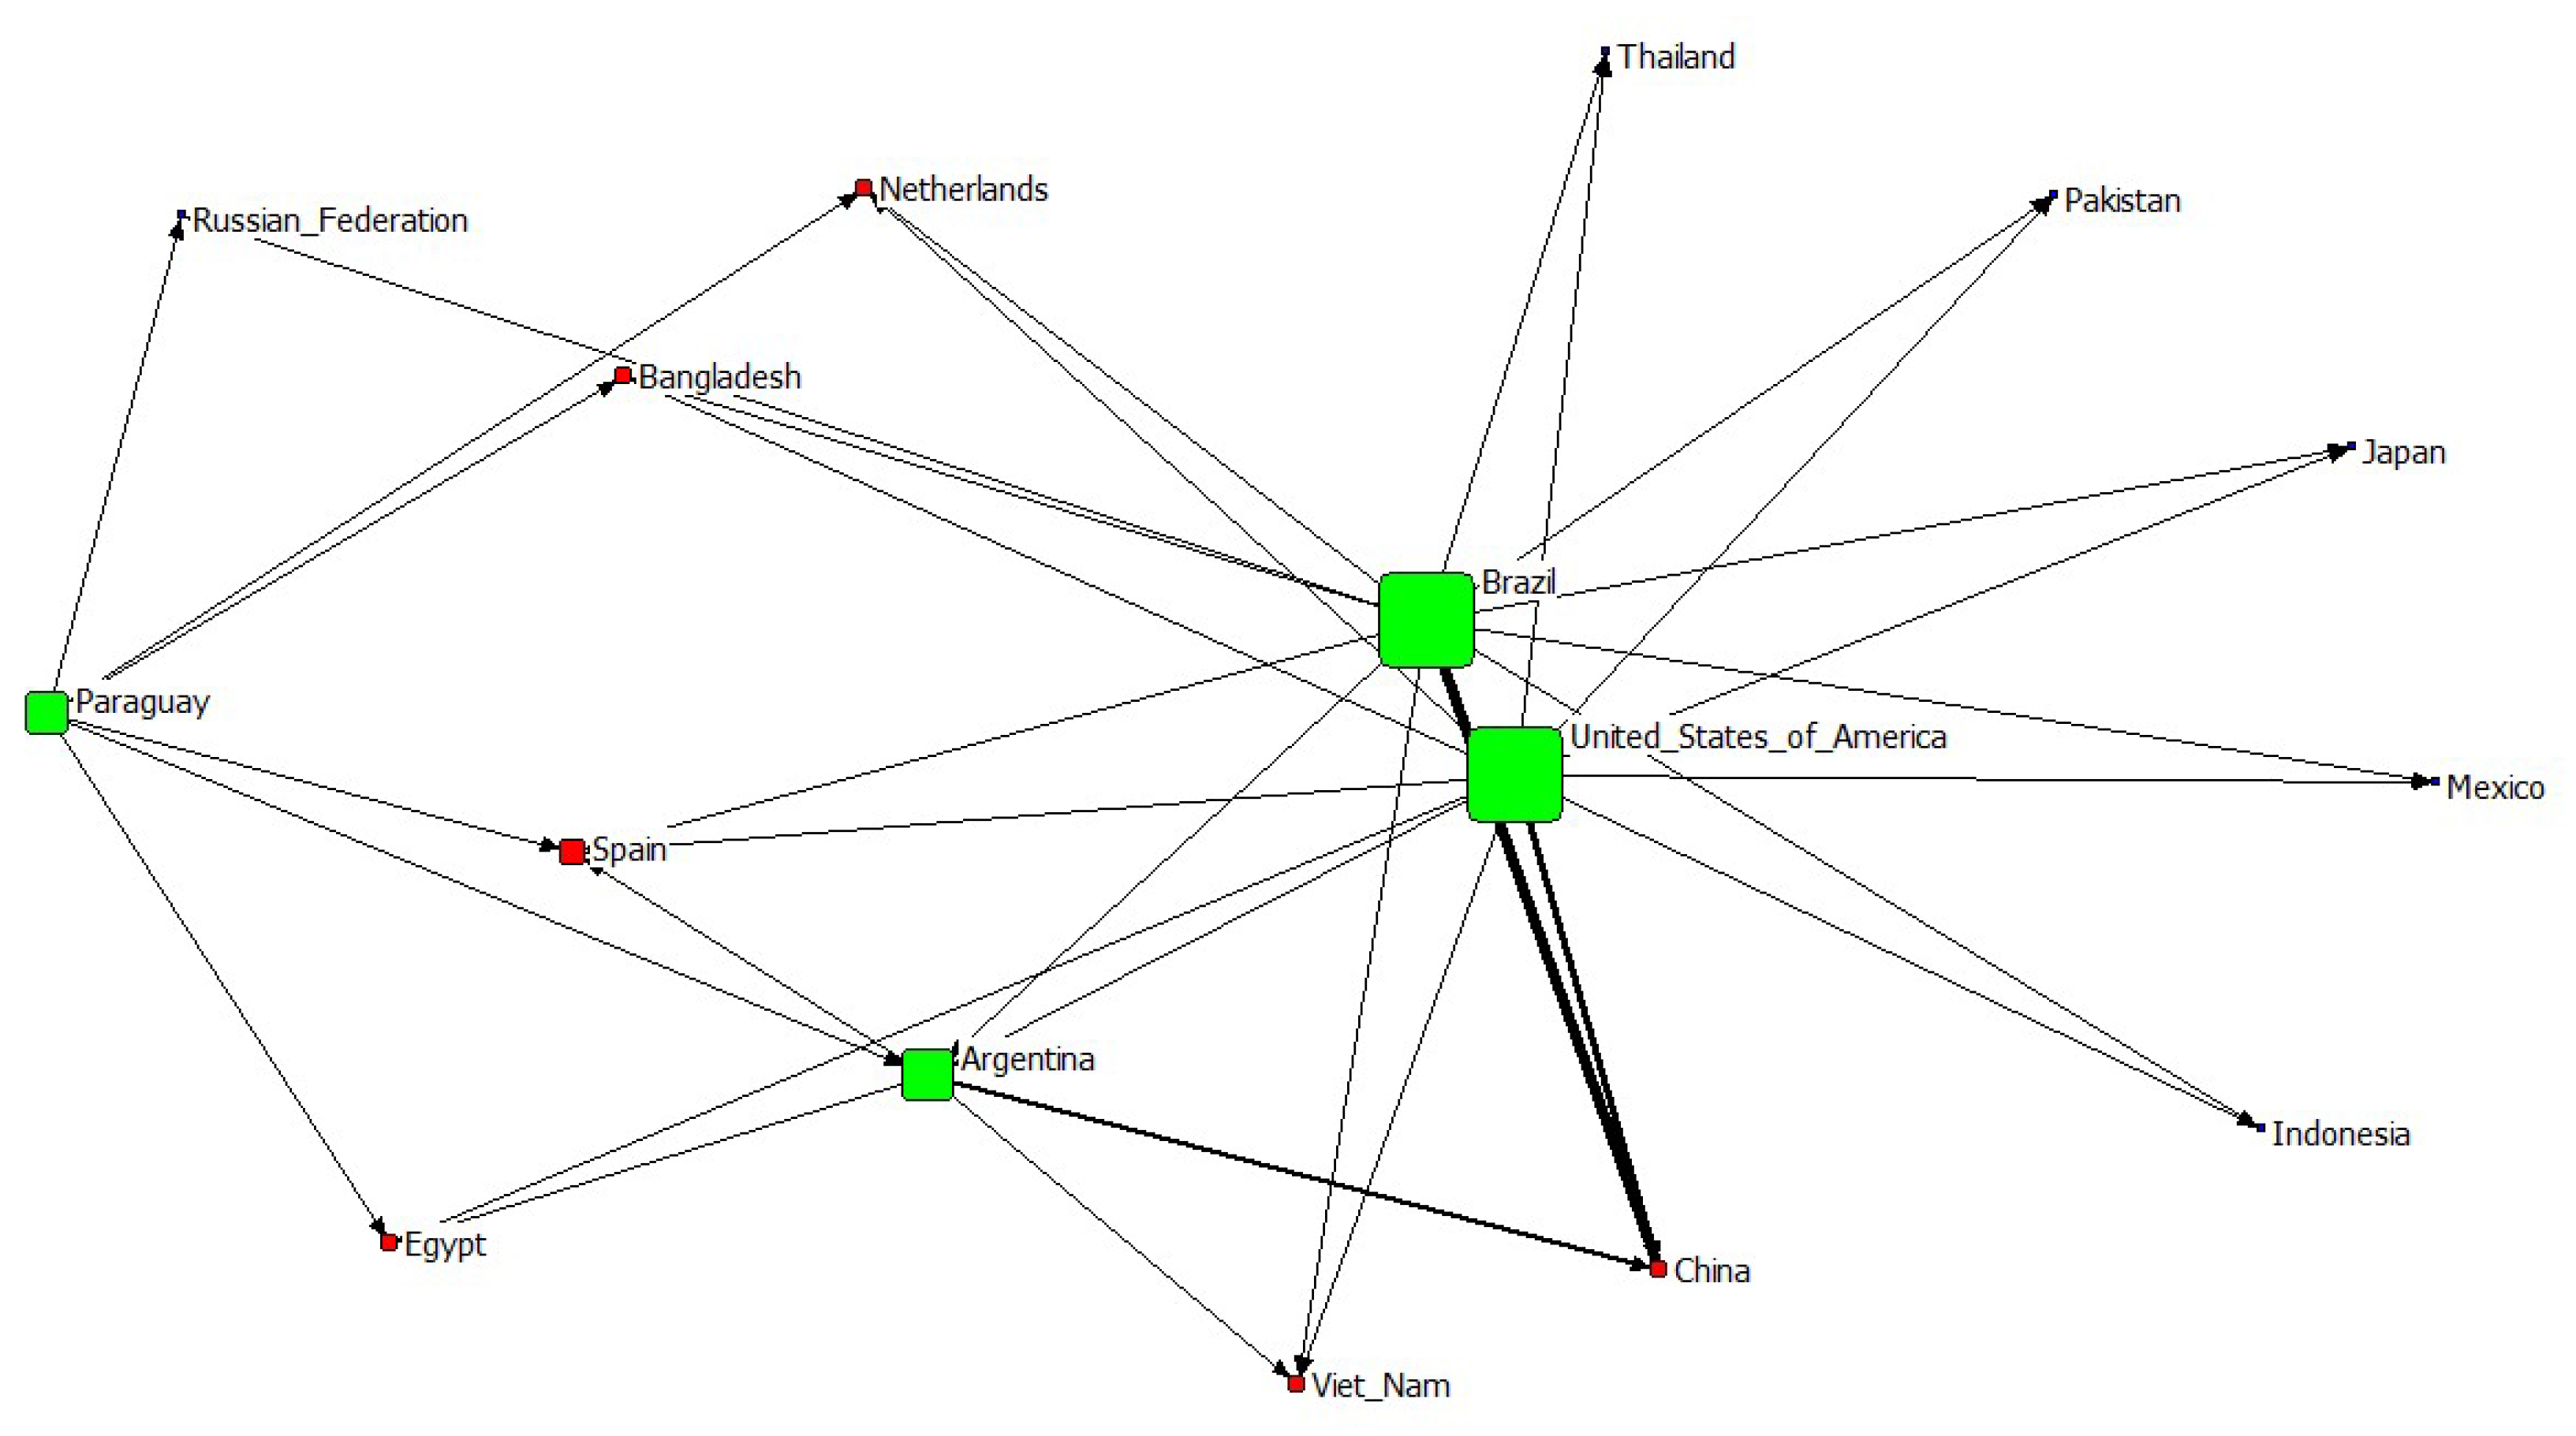
Figure 1 depicts the results of the soybean network. Green nodes represent exporters. Red nodes represent countries with a k-core of three or more, and blue nodes represent countries with a k-core of 1 or 2.
The soybean market is highly concentrated, with few exporters and relatively few importers. Historically, the US controlled the market until the 1970s. In the 1980s, Brazil and Argentina entered the market, configuring a concentrated market structure [
2]. Brazil, the US, Argentina, and Paraguay export more than 90% of soybean, and only 12 countries import 90% of soybean [
1]. There is fierce competition between Brazil and the US, where both compete directly on all importers. Mendes dos Reis et al. (2020) show that the soybean market has a huge significance for exporters and, although the US has an advantage on hinterland logistics, the three main exporters have very similar trade costs in terms of maritime freight and incoterms.
In this network, China is the biggest buyer, with 67% of the market. China has a close relationship with Brazil, being the main importer of Brazilian products [
12].
3.2. Soybean Cake
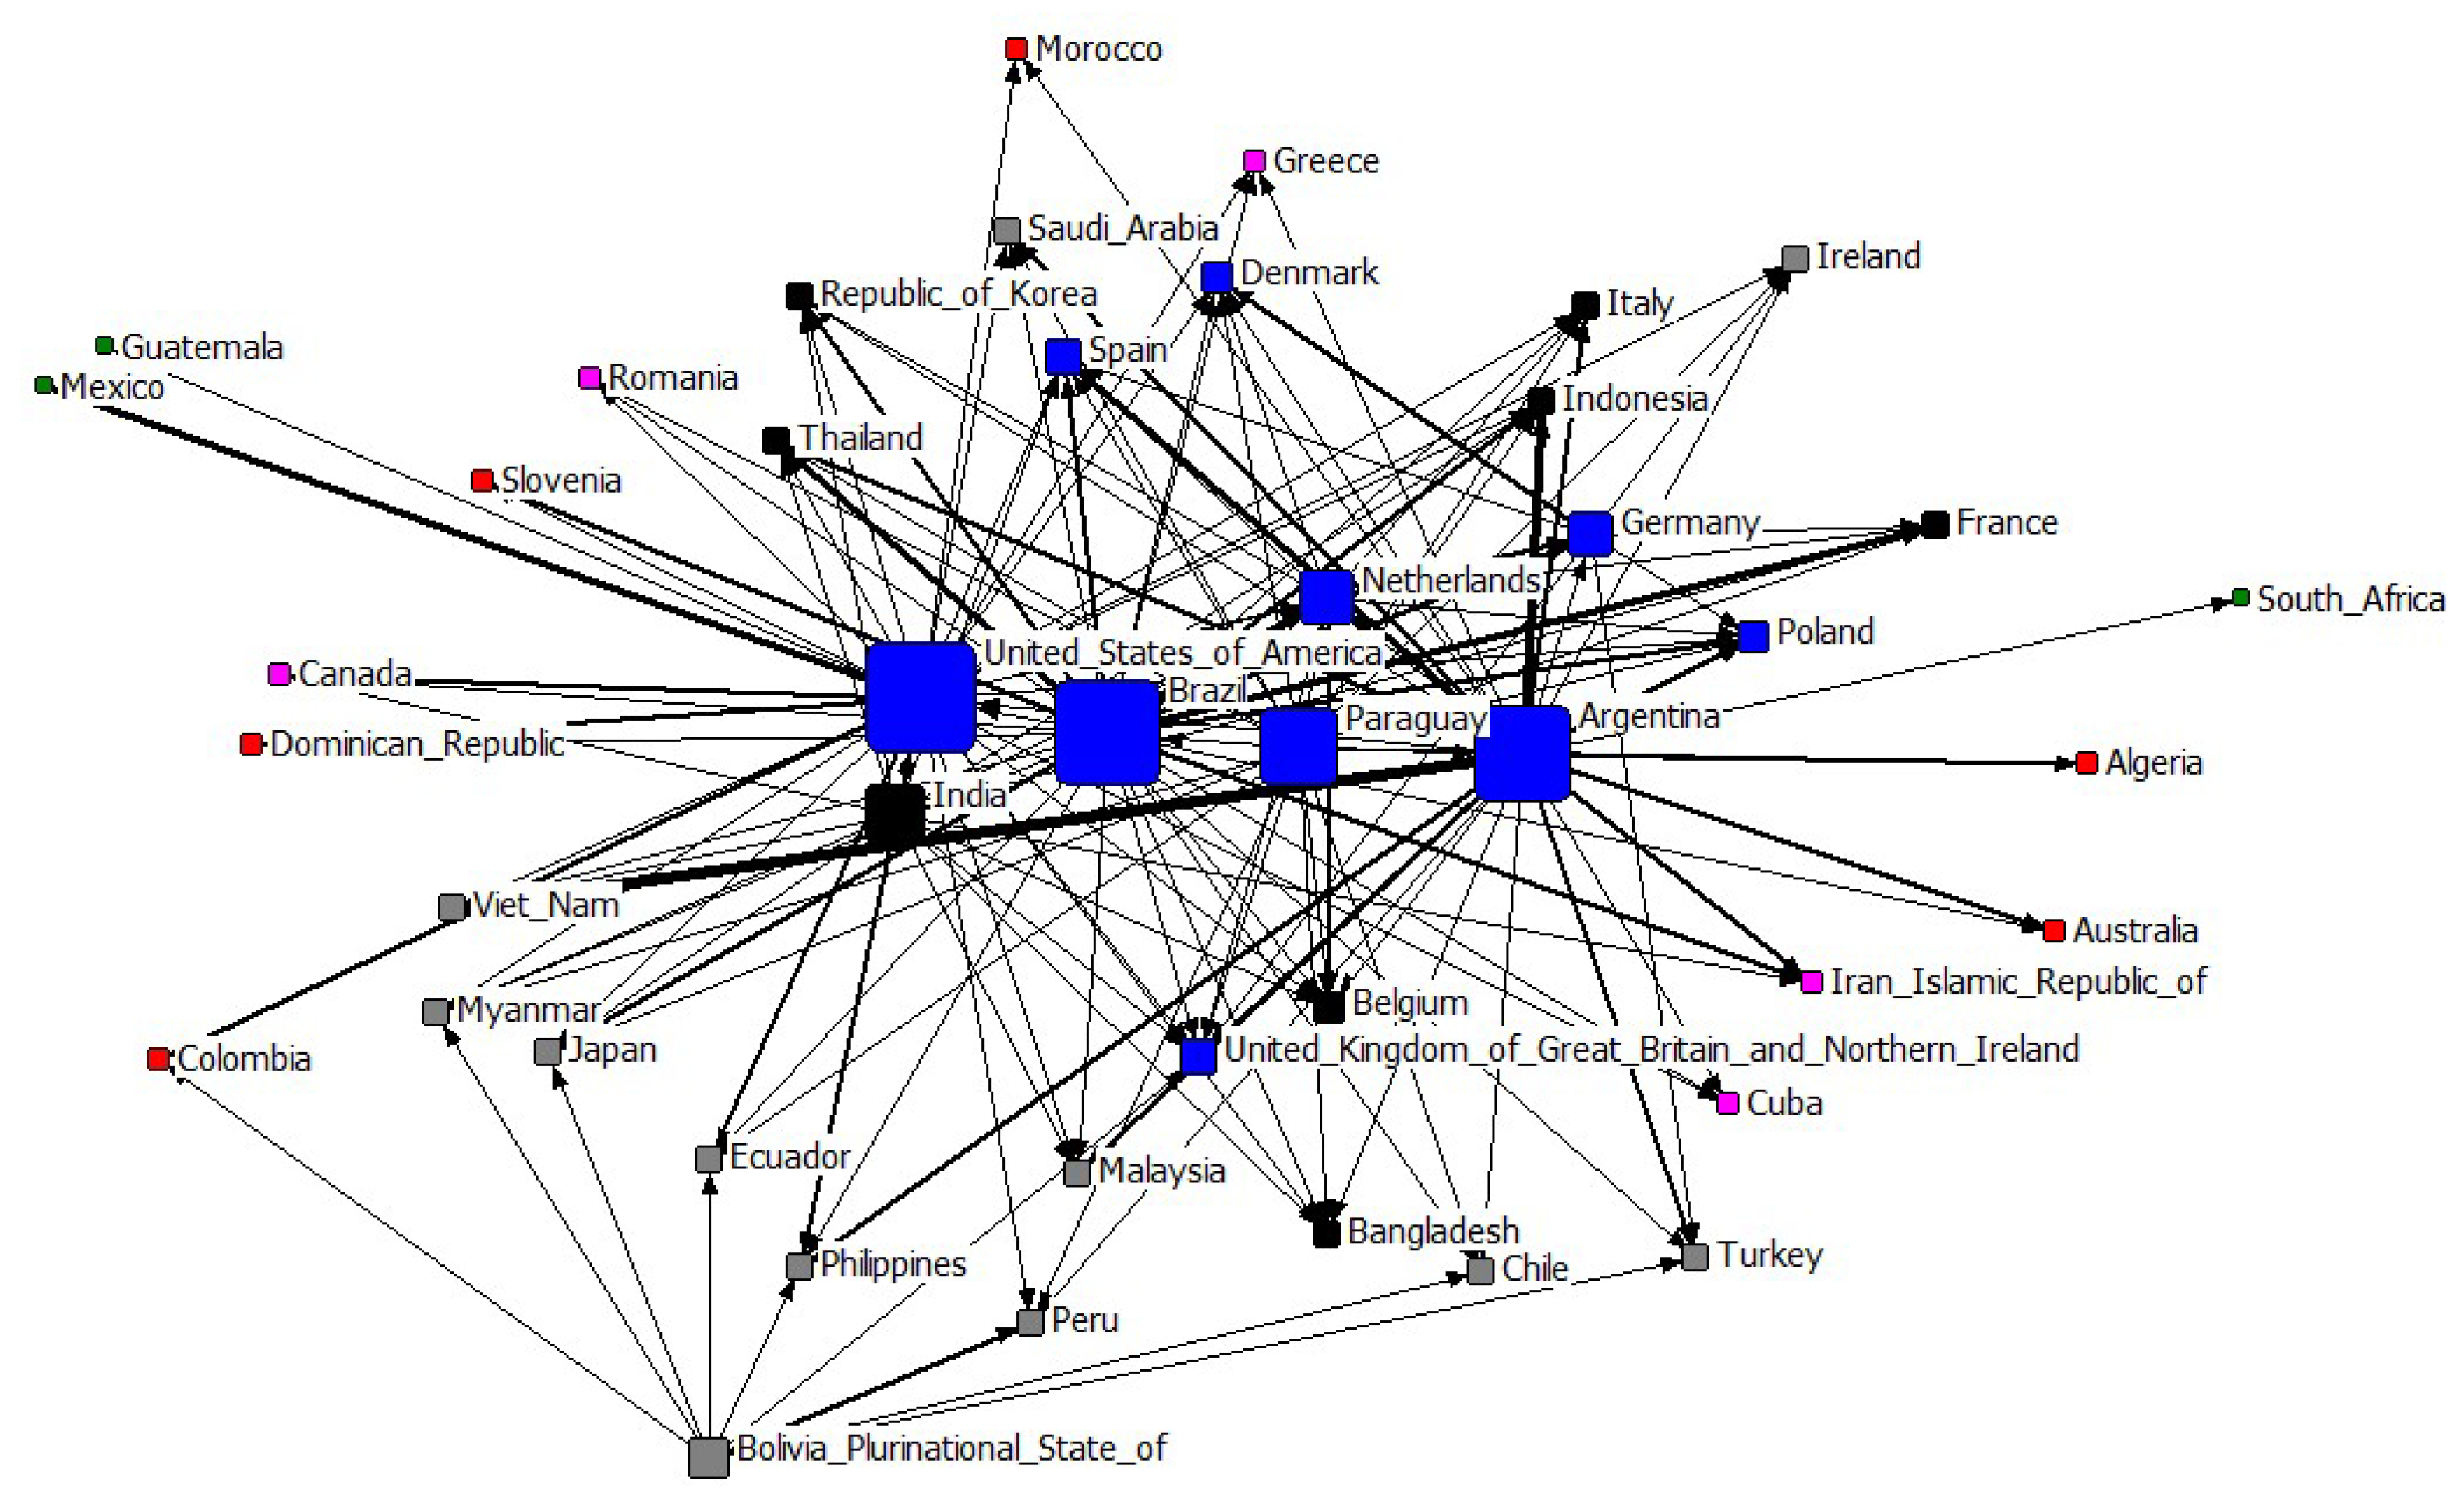
Figure 2 shows the soybean cake network. Blue nodes represent countries that have a k-core of 6 or more, black nodes represent countries that have a k-core of 5, grey nodes have a k-core of 4, pink nodes have a k-core of 3, and red nodes have a k-core of 2 or less.
The soybean cake market has a larger number of players. Argentina, Brazil and the US are the main exporters. In the number of connections, Argentina has an advantage, with 35 buyer countries (nodes); Brazil and the US have 20 and 21 nodes, respectively. The results show that Brazil and Argentina compete more in Europe and Asia, while the US mostly supplies its neighbors Mexico and Canada.
From an importer point of view, our study indicated that the Netherlands is an important importer for Brazil, and it is also an exporter for some European countries, suggesting that it is a gateway to Europe, especially for Germany. A possible explanation for this is the European dependency on, at some level, Brazil’s soybean cake. Similar dependency also occurs on Vietnam and Indonesia related to the production of Argentina [
13].
3.3. Maize
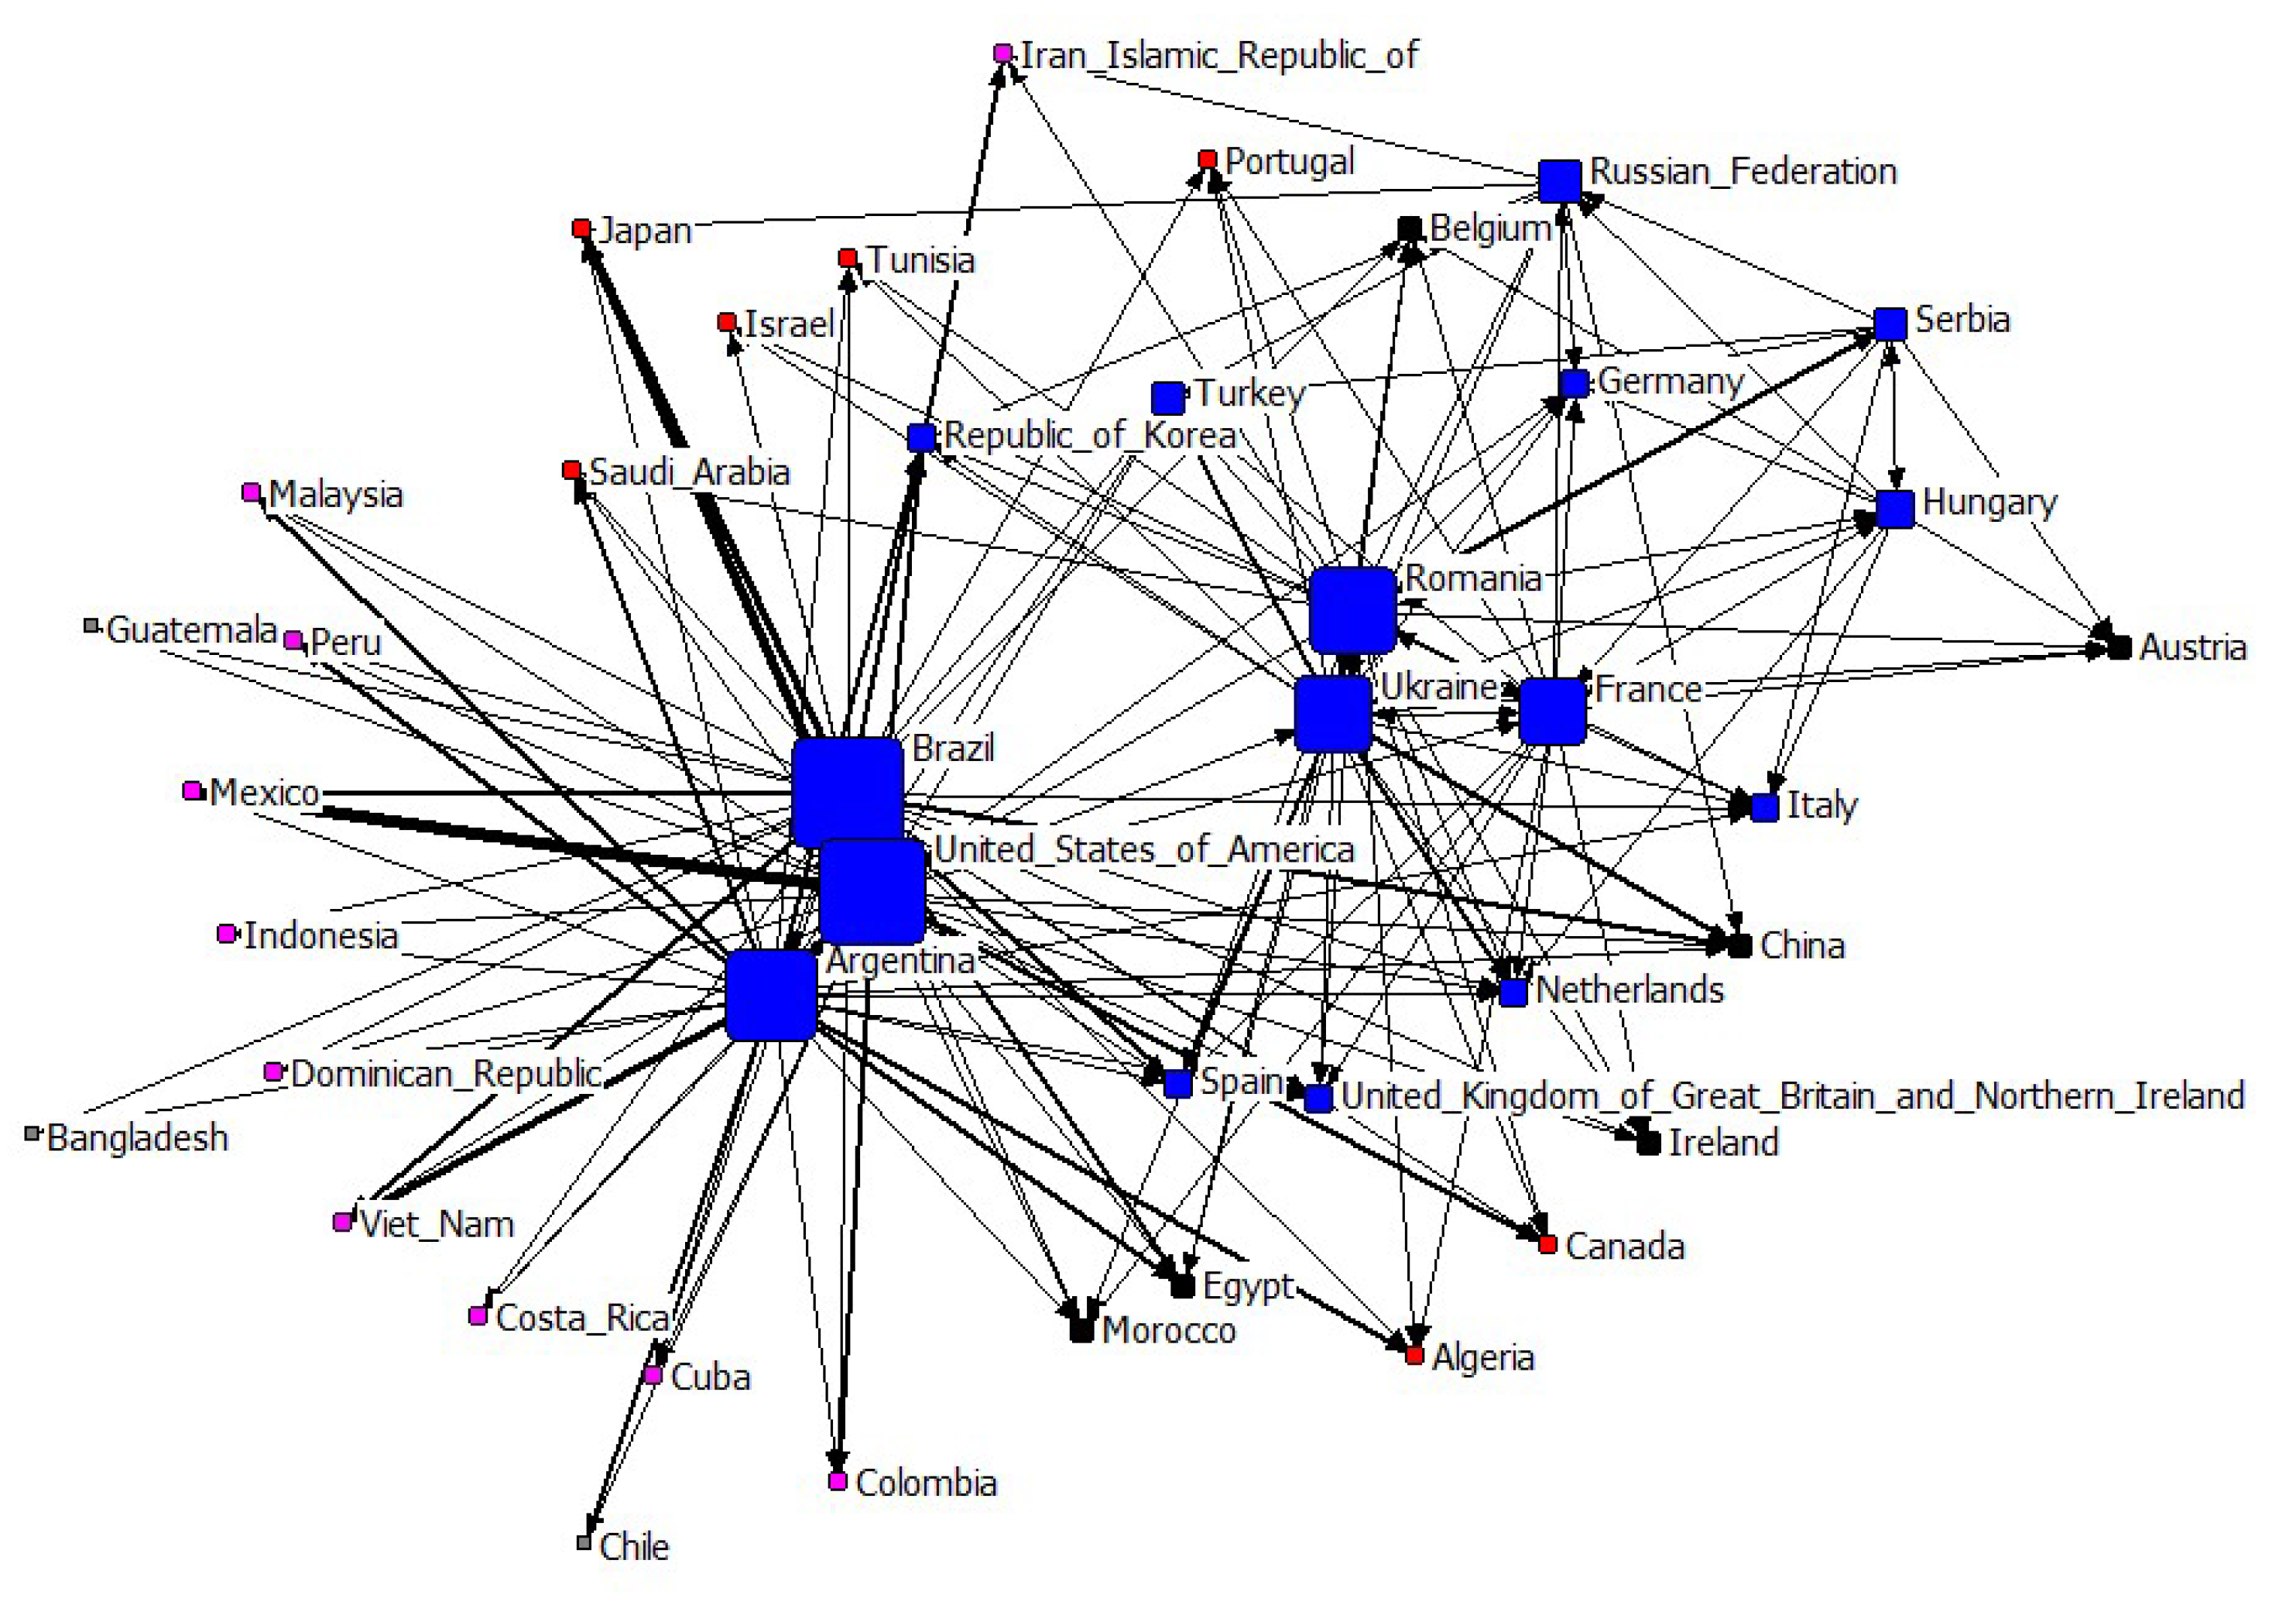
Figure 3 depicts the soybean cake network. Blue nodes represent countries that have a k-core of 6 or more, black nodes represent countries that have a k-core of 5, red nodes have a k-core of 4, and pink nodes have a k-core of 3 or less.
In the case of maize, Brazil, Argentina, and the US have similar export volumes, with Brazil and Argentina having the advantage of more diverse markets compared to the US (33, 28, and 17 nodes, respectively). Brazil and Argentina compete mainly in European and Asian markets, while the US supplies its neighbors, with the exception of Japan. Burkholz and Schweitzer [
14] studied the impact of a possible shock on Maize production from the US. The authors identified special impact in Mexico and Japan, which was corroborated by our study.
Considering the consumption market, soybean has a very peculiar result. China represents 67% of demand. For comparison purposes, Mexico is in second place, but only has 3% of imports. Maize and soybean cake do not have the same results. For maize, the main markets are Japan, Mexico, and Vietnam, with much more balanced results (about 10%, 9%, and 7%, respectively). For the soybean cake market, the main importers are Vietnam, Indonesia, and the Netherlands (about 7%, 7%, and 4%, respectively) [
1].
The agribusiness trade is essential to Brazil. According to data from Brazil’s Ministry of Agriculture, Livestock and Supply (MAPA), agribusiness was responsible for almost half of Brazil’s exports in 2020, with a 48% share, representing a trade balance surplus of USD 87.76 billion [
15].
The top five Brazilian agribusiness products exported year were soybean complex (USD 35.24 billion and 35% of exports); meat (USD 17.16 billion and 17% of exports); forest products (USD 11.41 billion and 11.3% of exports); sugar and alcohol complex (USD 9.99 billion and 9.9% of exports); and cereals, fours and preparations (USD 6.89 billion and 6.8% of exports) [
15].
Argentina had similar results in terms of agribusiness products exported. The top five were soybean complex (USD 15.23 billion and 42% of agribusiness exports), maize (USD 5.9 billion and 16% of agribusiness exports), meat (USD 3.0 billion and 8.3% of agribusiness exports), wheat (USD 2.29 billion and 6.3% of agribusiness exports) and wine (USD 792.73 million and 2.19% of exports) [
1].
For the US, the top five products exported were soybean complex (USD 22.89 billion and 16.3% of agribusiness exports), food preparation (USD 8.9 billion and 6.3% of agribusiness exports), maize (USD 8.0 billion and 5.7% of agribusiness exports), wheat (USD 6.26 billion and 4.4% of agribusiness exports) and cotton lit (USD 6.14 billion and 4.3% of agribusiness exports) [
1].
4. Conclusions
The world agribusiness market is growing and represents an important and strategic segment of countries exports and GDP. Like most complex systems, it is very difficult to study all aspects and characteristics of this trade using only a few techniques, tools or perspectives. It is, therefore, necessary to seek new perspectives and tools that enable new insights on the subject.
Therefore, this work analyzed data from exports of the soybean, soybean cake, and maize trade in 2019, obtained from FAO and analyzed using the social network analysis method. It is possible to observe that social network analysis is a relevant tool for the analysis of the global commerce of agricultural products due to its capability of graphically depicting a great amount of data. The method allows for the observation of the connections between countries that play a role in trade, along with the importance of each player, the trade volume and other insights.
The results showed that the soybean market is highly concentrated and there is high competition between Brazil and the US. China is the main importer—responsible for 67% of imports. Soybean cake data show a similar level of market competition, with Argentina, Brazil, and the US being the main exporters; the number of importers is much larger. Brazil and Argentina compete more in European and Asian countries, while the US mostly supplies its neighbors Mexico and Canada. Maize demonstrated very similar data to soybean and soybean cake. Brazil, Argentina and the US are the main competitors. However, in contrast to soybean but similar to soybean cake, the market is much more diverse in the number of importers and a less concentrated market. Brazil and Argentina compete mainly in European and Asian markets, while the US mostly supplies its neighbors, with the exception of Japan.
We suggest further studies use the same method on different trade markets in the search for similar insights. Another approach could be the use of different measures and tools, along with the comparison of results across time, using the same method on different years.
Author Contributions
Conceptualization, D.L.d.J.X. and J.G.M.d.R.; methodology, D.L.d.J.X. and J.G.M.d.R.; software, D.L.d.J.X. and J.G.M.d.R.; validation, D.L.d.J.X. and J.G.M.d.R.; formal analysis, D.L.d.J.X. and J.G.M.d.R.; investigation, D.L.d.J.X. and J.G.M.d.R.; resources, D.L.d.J.X. and J.G.M.d.R.; data curation, D.L.d.J.X. and J.G.M.d.R.; writing—original draft preparation, D.L.d.J.X. and J.G.M.d.R.; writing—review and editing, D.L.d.J.X. and J.G.M.d.R.; visualization, D.L.d.J.X. and J.G.M.d.R.; supervision, J.G.M.d.R.; project administration, D.L.d.J.X. and J.G.M.d.R.; funding acquisition, D.L.d.J.X. and J.G.M.d.R. All authors have read and agreed to the published version of the manuscript.
Funding
This research was funded by CAPES grant number 001.
Institutional Review Board Statement
Not applicable.
Informed Consent Statement
Not applicable.
Data Availability Statement
Data Available by request.
Acknowledgments
The authors would like to thank you Capes for the financial support of this research.
Conflicts of Interest
The authors declare no conflict of interest.
References
- Food and Agriculture Organization of the United Nations. Detailed Trade Matrix. Available online: https://www.fao.org/faostat/en/#data/TM (accessed on 6 November 2021).
- Sanguinet, E.R.; Siqueira, L.V.; Coronel, D.A.; Schultz, G. Práticas intervencionistas e seus efeitos sobre o comércio internacional de soja: Uma análise a partir de um modelo de equilíbrio geral computável e da teoria dos jogos. Rev. Econ. Sociol. Rural 2017, 55, 641–660. [Google Scholar] [CrossRef] [Green Version]
- Mendes dos Reis, J.G.; Sanches Amorim, P.; Sarsfield Pereira Cabral, J.A.; Toloi, R.C. The impact of logistics performance on Argentina, Brazil, and the US soybean exports from 2012 to 2018: A gravity model approach. Agriculture 2020, 10, 338. [Google Scholar] [CrossRef]
- Sutrisno, A.; Arsyad, M.; Rayhana; Khaerunnisa; Sulistyo, A.; Inten, S.; Nurlela; Zulhafandi; Rahajeng, G.Y.; Adi, A. Structural model design of the role of institutions in the development of cayenne agribusiness systems. IOP Conf. Ser. Earth Environ. Sci. 2020, 473, 012015. [Google Scholar] [CrossRef]
- Kamilaris, A.; Kartakoullis, A.; Prenafeta-Boldú, F.X. A review on the practice of big data analysis in agriculture. Comput. Electron. Agric. 2017, 143, 23–37. [Google Scholar] [CrossRef]
- Borgatti, S.P.; Everett, M.G.; Freeman, L.C. Ucinet 6 for Windows: Software for Social Network Analysis; Analytic Technologies: Harvard, MA, USA, 2002. [Google Scholar]
- Borgatti, S.P.; Everett, M.G.; Freeman, L.C. Netdraw Network Visualization; Analytic Technologies: Harvard, MA, USA, 2002. [Google Scholar]
- Borgatti, S.P.; Everett, M.G.; Johnson, J.C. Analyzing Social Networks; SAGE: Los Angeles, CA, USA, 2013. [Google Scholar]
- Saqr, M.; Fors, U.; Nouri, J. Using social network analysis to understand online Problem-Based Learning and predict performance. PLoS ONE 2018, 13, e0203590. [Google Scholar] [CrossRef] [PubMed] [Green Version]
- Kong, Y.X.; Shi, G.Y.; Wu, R.J.; Zhang, Y.C. K-core: Theories and applications. Phys. Rep. 2019, 832, 1–32. [Google Scholar] [CrossRef]
- Farine, D.R.; Whitehead, H. Constructing, conducting and interpreting animal social network analysis. J. Anim. Ecol. 2015, 84, 1144–1163. [Google Scholar] [CrossRef] [PubMed] [Green Version]
- Braga Chinelato, F.; Batista de Freitas Cruz, D.; Braga Chinelato, F.; Batista de Freitas Cruz, D. Parceiros do Brasil: Uma análise das exportações brasileiras. Cuad. Econ. 2021, 40, 459–482. [Google Scholar] [CrossRef]
- Phélinas, P.; Choumert, J. Is GM soybean cultivation iin Argentina sustainable? World Dev. 2017, 99, 452–462. [Google Scholar] [CrossRef] [Green Version]
- Burkholz, R.; Schweitzer, F. International crop trade networks: The impact of shocks and cascades. Environ. Res. Lett. 2019, 14, 114013. [Google Scholar] [CrossRef] [Green Version]
- Ministry of Agriculture, Livestock and Supply of Brazil. Agrobusiness Exportations Exceed US$100 Billion for the Second Time in History. Available online: https://www.gov.br/agricultura/pt-br/assuntos/noticias/exportacoes-do-agro-ultrapassam-a-barreira-dos-us-100-bilhoes-pela-segunda-vez (accessed on 6 November 2021).
| Publisher’s Note: MDPI stays neutral with regard to jurisdictional claims in published maps and institutional affiliations. |
© 2022 by the authors. Licensee MDPI, Basel, Switzerland. This article is an open access article distributed under the terms and conditions of the Creative Commons Attribution (CC BY) license (https://creativecommons.org/licenses/by/4.0/).


