
Crop Identification by Machine Learning Algorithm and Sentinel-2 Data †

 , ,
, ,  and
and 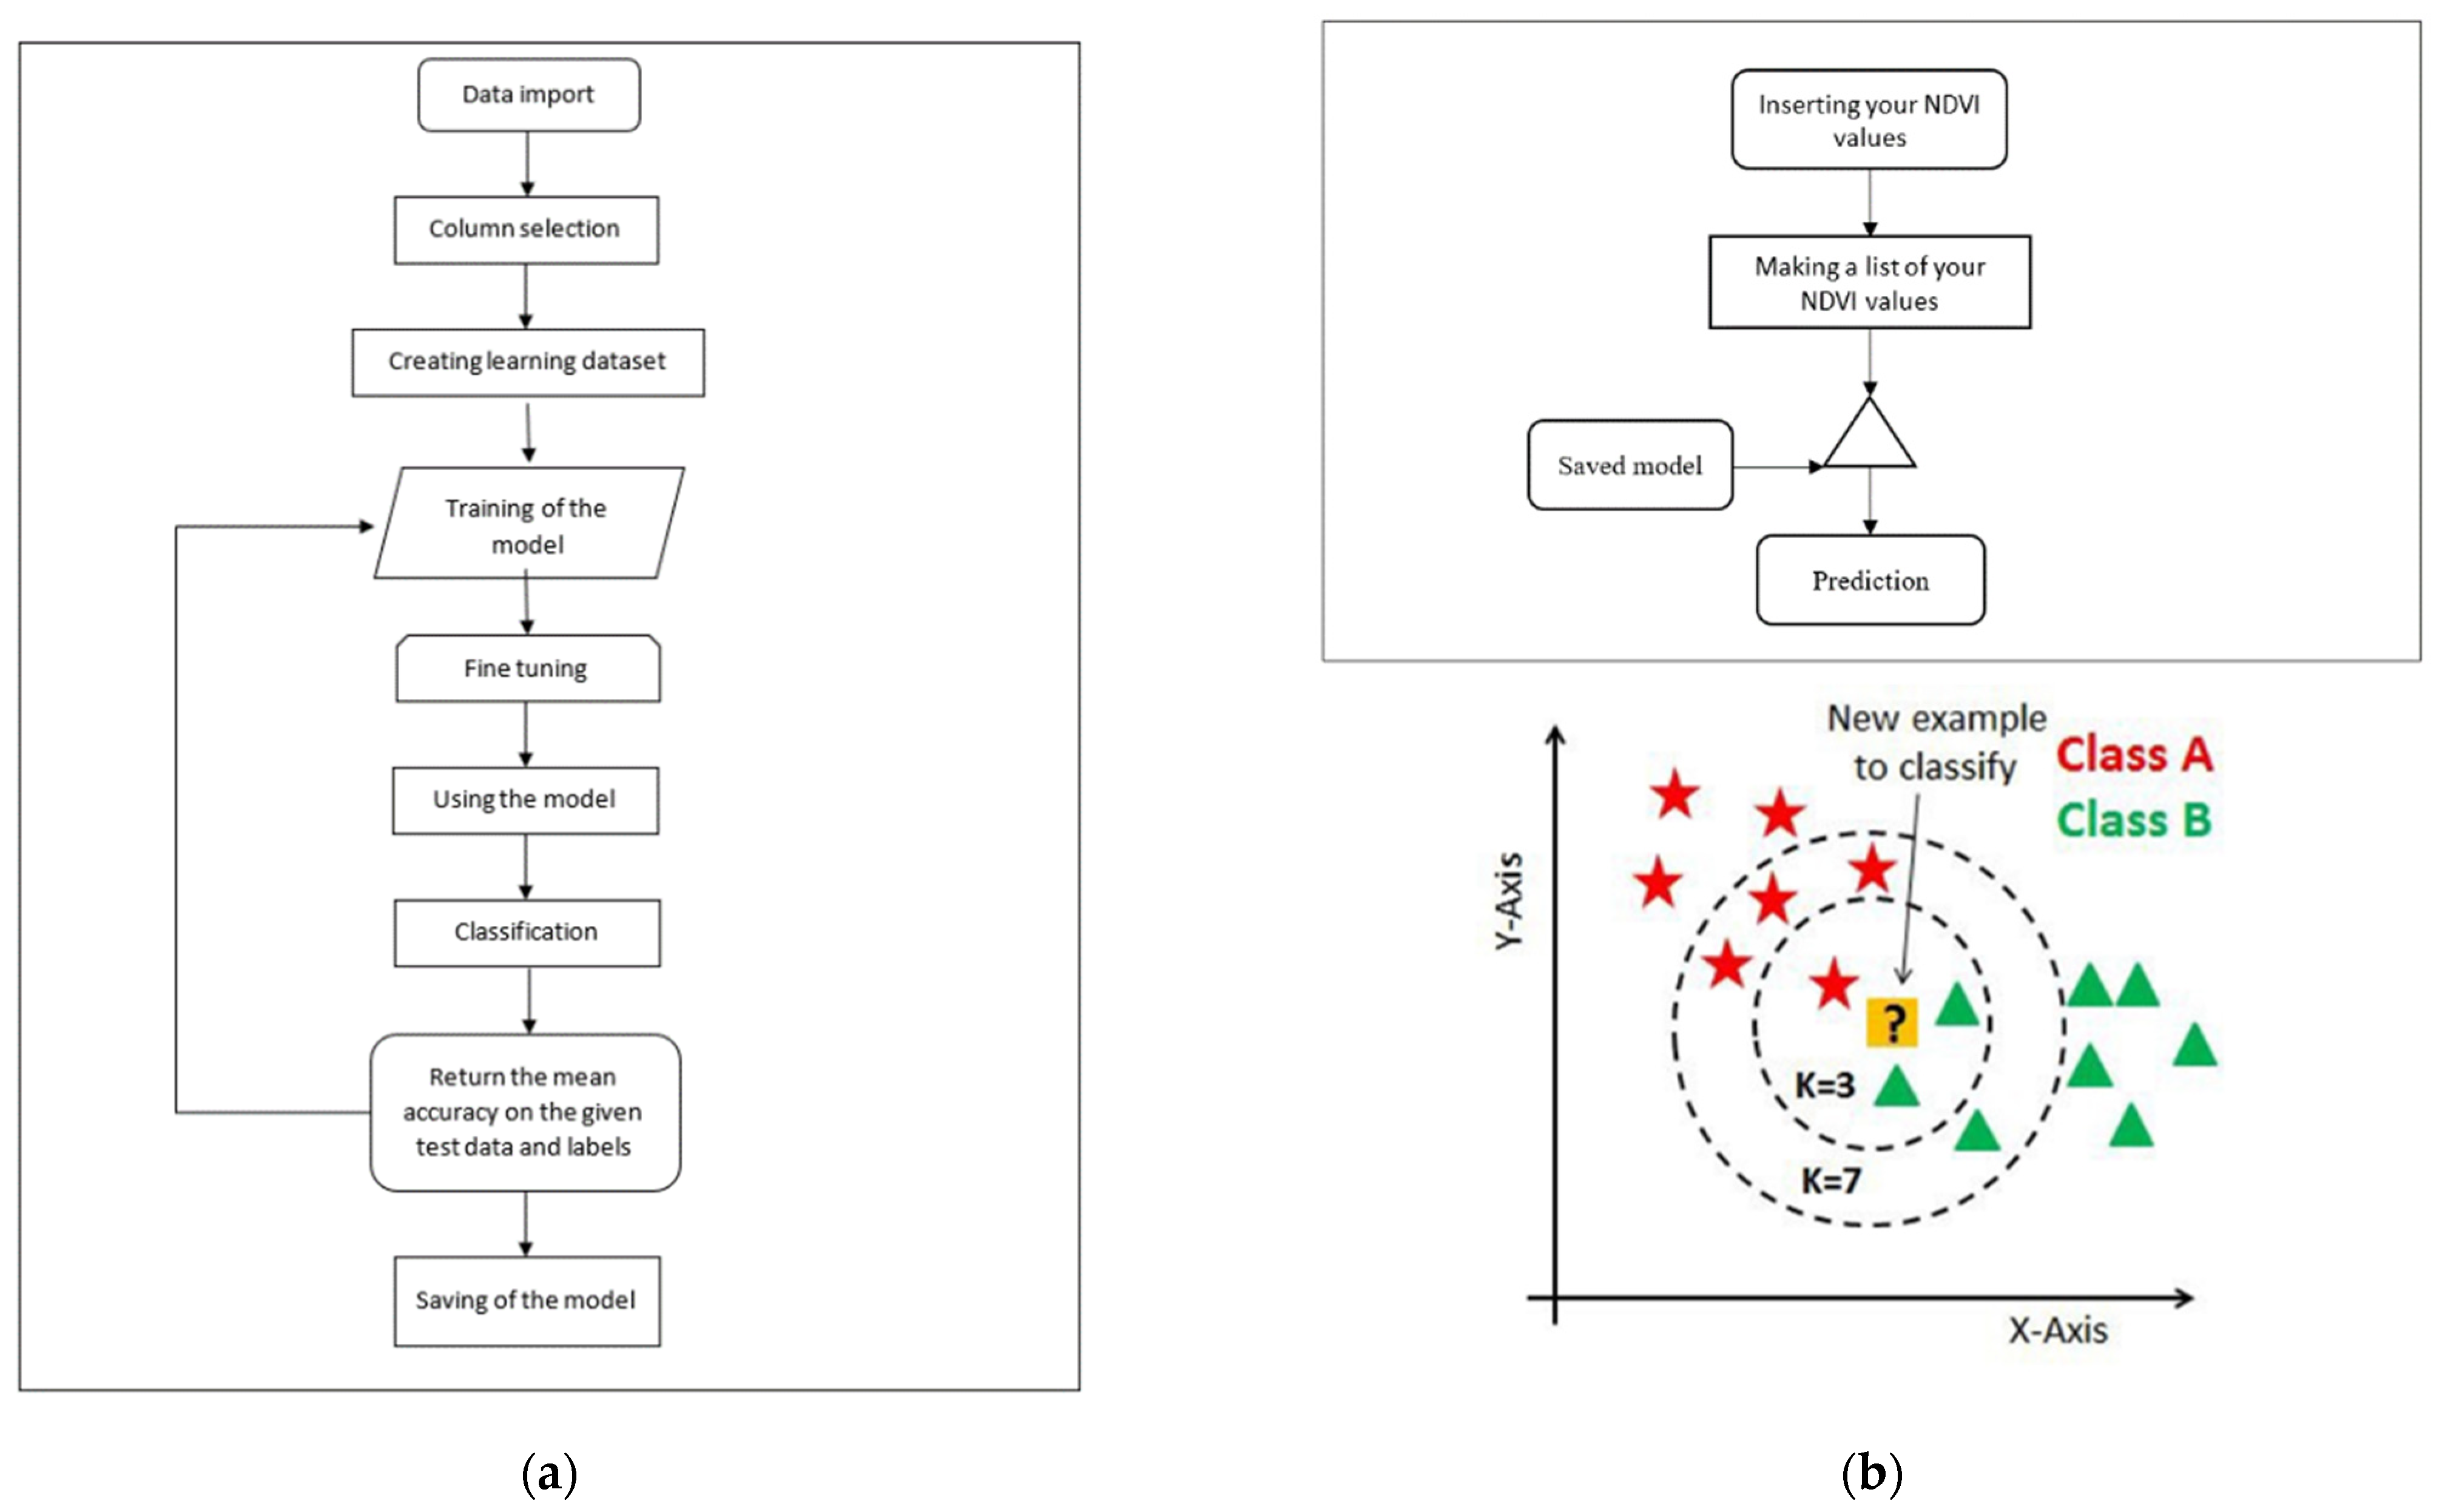
Abstract
:1. Introduction
2. Methods and Materials
- Select the K number of the neighbors. K value indicates the count of the nearest neighbors;
- Calculate the Euclidean distance of K number of neighbors;
- Take the K nearest neighbors as per the calculated Euclidean distance;
- Among these k neighbors, count the number of the data points in each category;
- Assign the new data points to that category for which the number of the neighbor is maximum;
- The KNN model is ready.
3. Experimentation, Results and Discussion
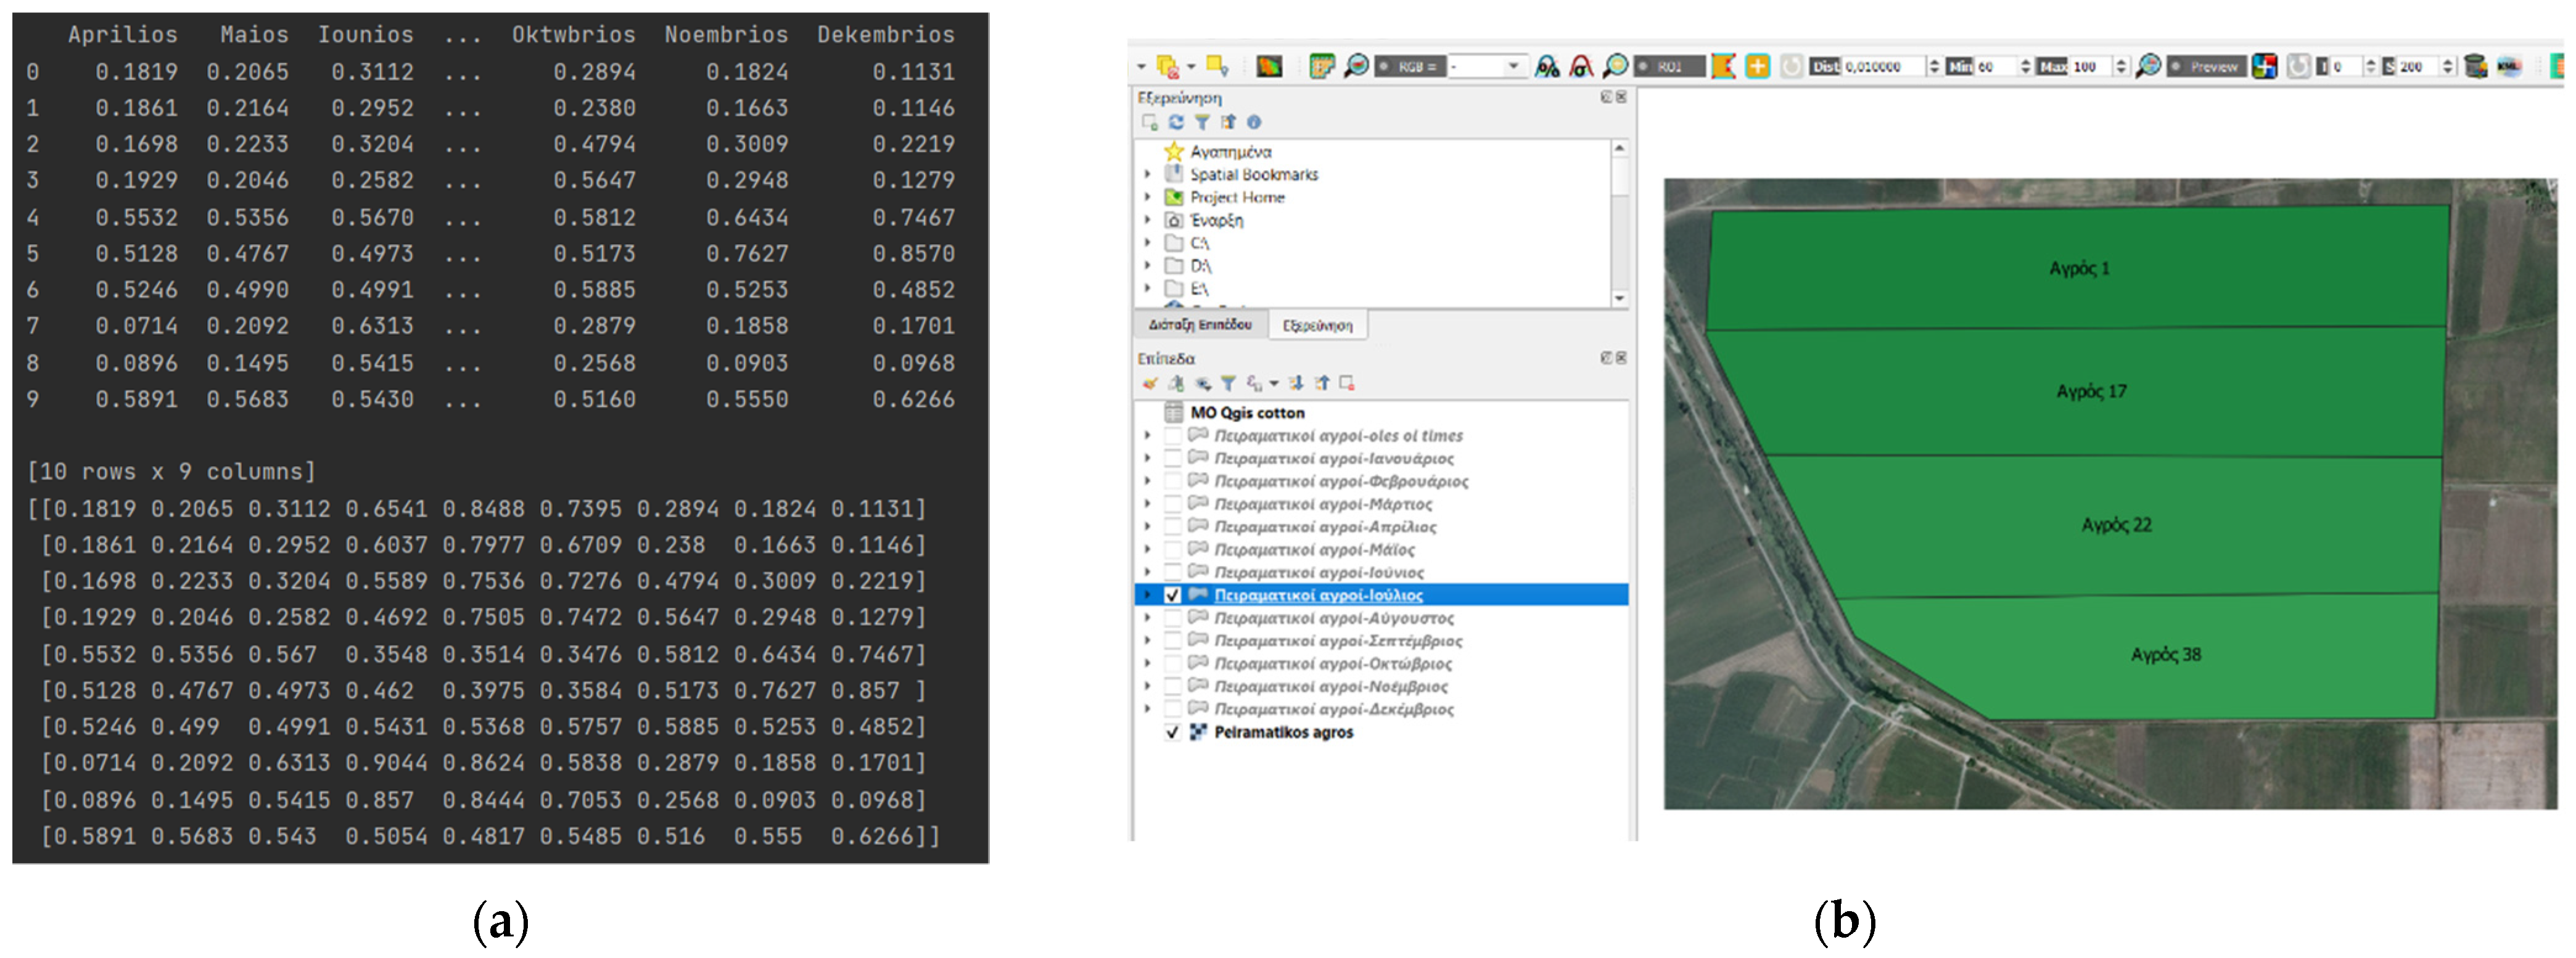
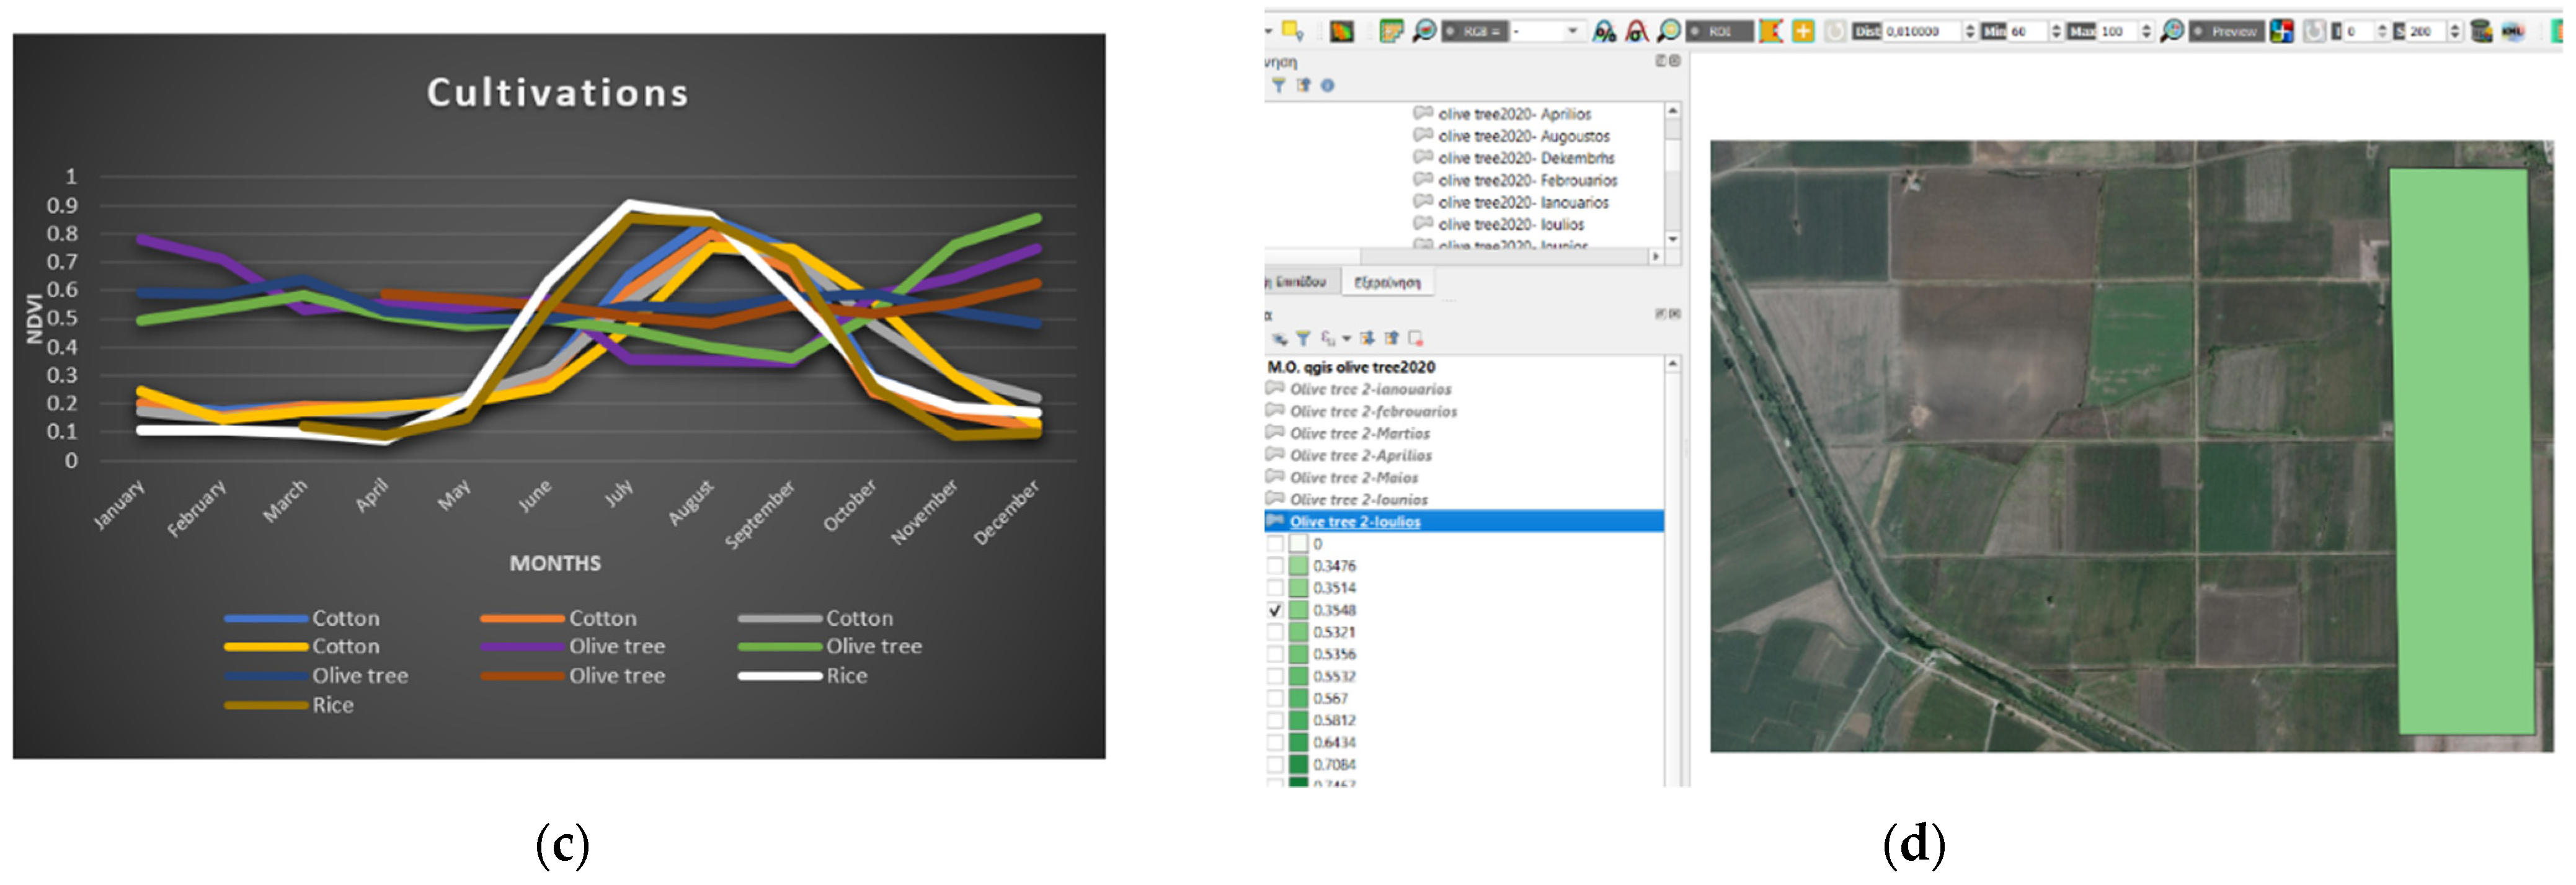
3.1. Training Process
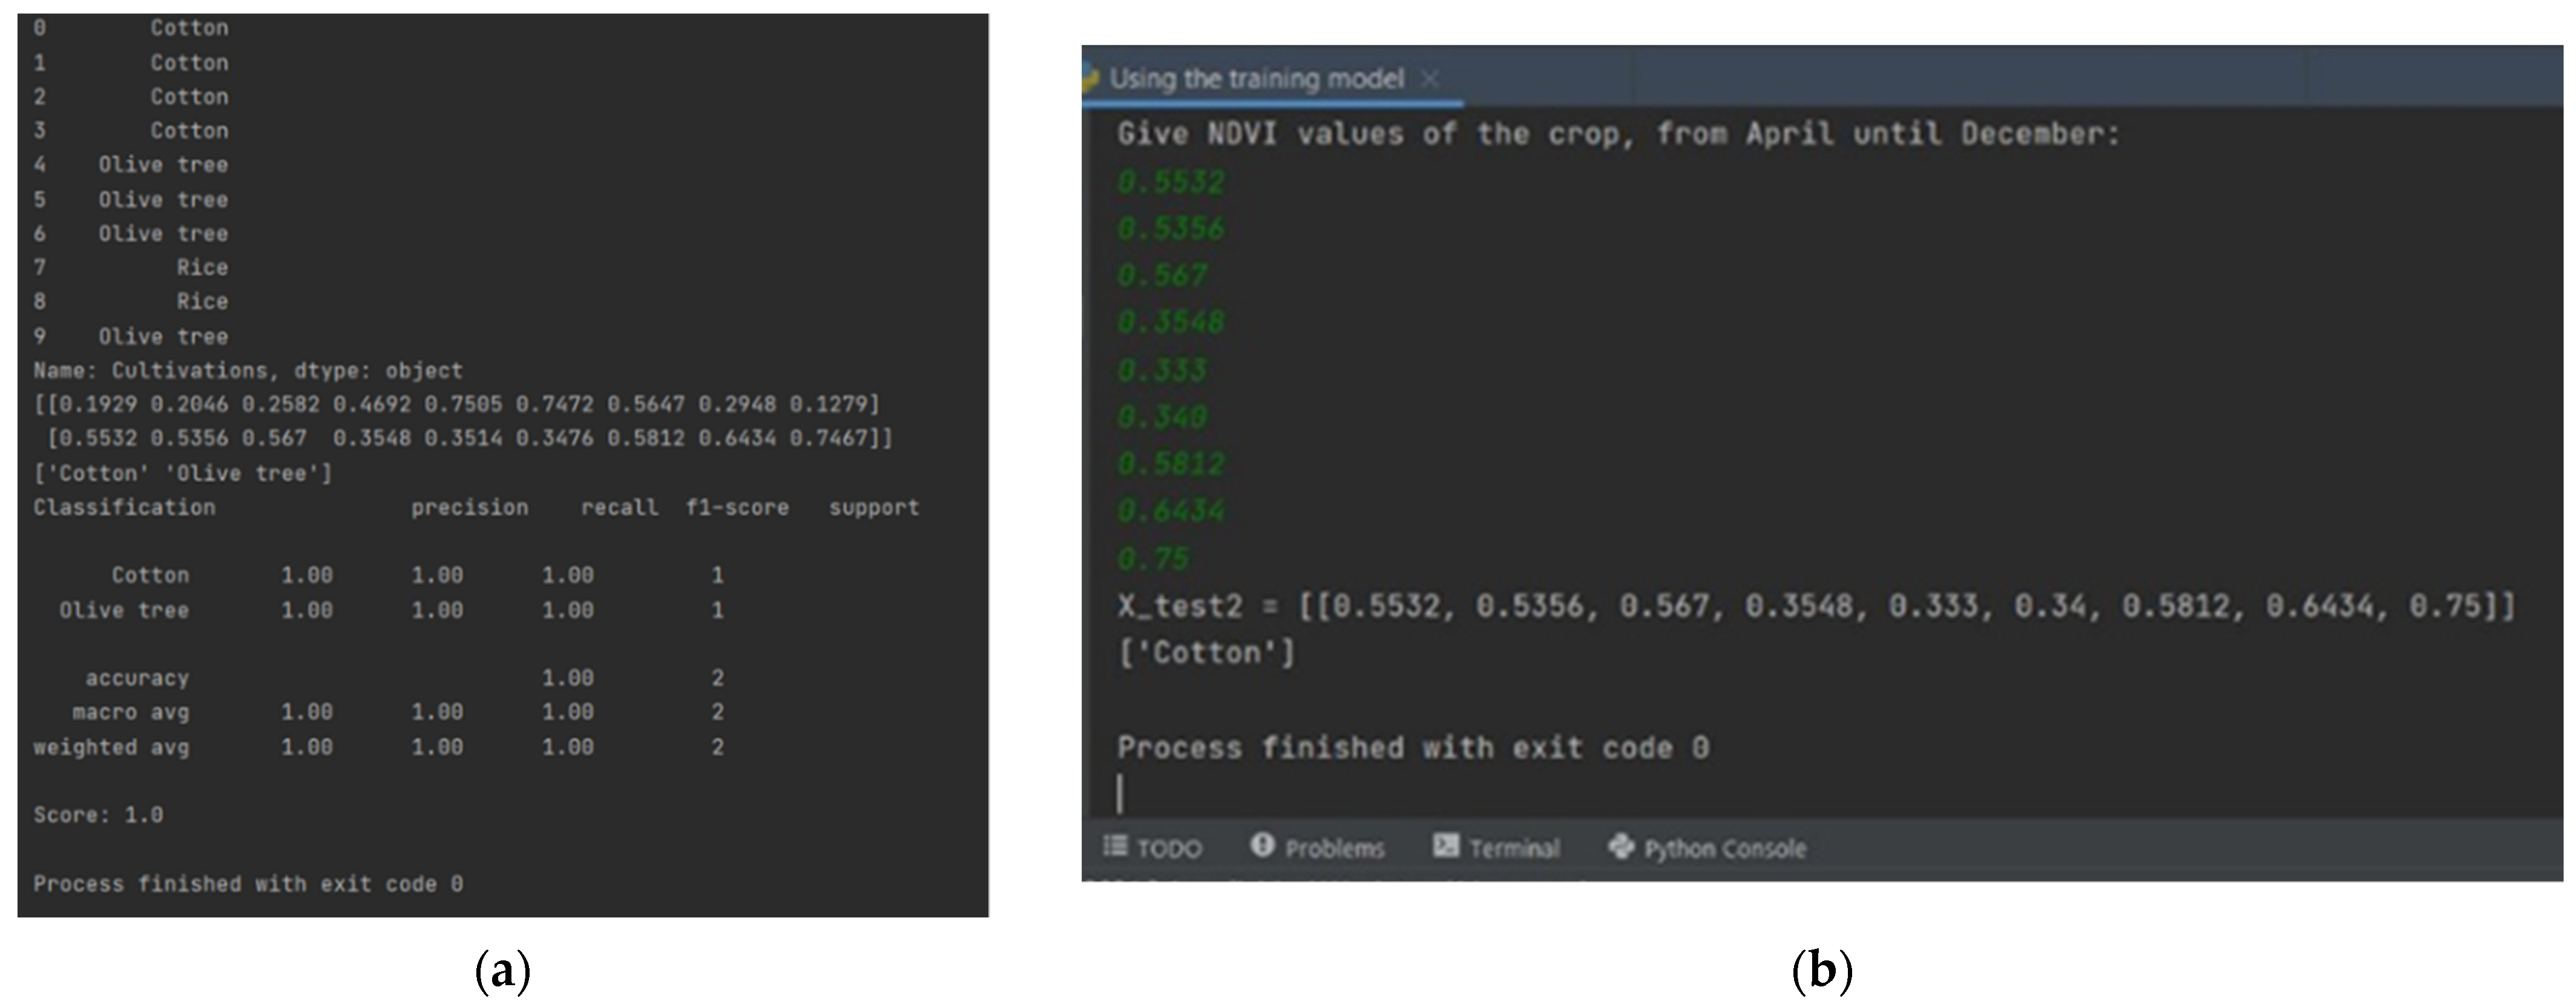
3.2. Identification Process
3.3. Discussion
4. Conclusions
Author Contributions
Funding
Institutional Review Board Statement
Informed Consent Statement
Data Availability Statement
Acknowledgments
Conflicts of Interest
References
- Bajželj, B.; Richards, K.S.; Allwood, J.M.; Smith, P.; Dennis, J.S.; Curmi, E.; Gilligan, C.A. Importance of food-demand management for climate mitigation. Nat. Clim. Chang. 2014, 4, 924–929. [Google Scholar] [CrossRef] [Green Version]
- Lobell, D.B. The use of satellite data for crop yield gap analysis. Field Crops Res. 2013, 143, 56–64. [Google Scholar] [CrossRef] [Green Version]
- Hao, P.; Di, L.; Zhang, C.; Guo, L. Transfer Learning for Crop classification with Cropland Data Layer data (CDL) as training samples. Sci. Total Environ. 2020, 733, 138869. [Google Scholar] [CrossRef] [PubMed]
- Zhang, J.; Feng, L.; Yao, F. Improved maize cultivated area estimation over a large scale combining MODIS-EVI time series data and crop phenological information. ISPRS J. Photogramm. Remote Sens. 2014, 94, 102–113. [Google Scholar] [CrossRef]
- Zhong, L.; Hu, L.; Zhou, H. Deep learning based multi-temporal crop classification. Remote Sens. Environ. 2019, 221, 430–443. [Google Scholar] [CrossRef]
- Löw, F.; Michel, U.; Dech, S.; Conrad, C. Impact of feature selection on the accuracy and spatial uncertainty of per-field crop classification using support vector machines. ISPRS J. Photogramm. Remote Sens. 2013, 85, 102–119. [Google Scholar] [CrossRef]
- Hao, P.; Wang, L.; Zhan, Y.; Niu, Z. Using moderate-resolution temporal NDVI profiles for high-resolution crop mapping in years of absent ground reference data: A case study of bole and Manas Counties in Xinjiang, China. ISPRS Int. J. Geo-Inf. 2016, 5, 67. [Google Scholar] [CrossRef] [Green Version]
- Hao, P.; Wang, L.; Zhan, Y.; Wang, C.; Niu, Z.; Wu, M. Crop classification using crop knowledge of the previous year: Case study in Southwest Kansas, USA. Eur. J. Remote Sens. 2016, 49, 1061–1077. [Google Scholar] [CrossRef] [Green Version]
- Zhong, L.; Gong, P.; Biging, G.S. Efficient corn and soybean mapping with temporal extendability: A multi-year experiment using Landsat imagery. Remote Sens. Environ. 2014, 140, 1–13. [Google Scholar] [CrossRef]
- Boryan, C.; Yang, Z.W.; Mueller, R.; Craig, M. Monitoring US agriculture: The US Department of Agriculture, National Agricultural Statistics Service, Cropland Data Layer Program. Geocarto Int. 2011, 26, 341–358. [Google Scholar] [CrossRef]
- Han, W.; Yang, Z.; Di, L.; Zhang, B.; Peng, C. Enhancing agricultural geospatial data dissemination and applications using geospatial web services. IEEE J. Sel. Top. Appl. Earth Obs. Remote Sens. 2014, 7, 4539–4547. [Google Scholar] [CrossRef]
- Arvanitis, K.G.; Symeonaki, E.G. Agriculture 4.0: The Role of Innovative Smart Technologies Towards Sustainable Farm Management. Open Agric. J. 2020, 14, 130–136. [Google Scholar] [CrossRef]
- Sentinel Online. Available online: https://sentinels.copernicus.eu/web/sentinel/user-guides/sentinel-2-msi/overview (accessed on 20 December 2021).
- Huete, A.; Didan, K.; Miura, T.; Rodriguez, E.P.; Gao, X.; Ferreira, L.G. Overview of the radiometric and biophysical performance of the MODIS vegetation indices. Remote Sens. Environ. 2002, 83, 195–213. [Google Scholar] [CrossRef]
- Hao, P.; Wu, M.; Niu, Z.; Wang, L.; Zhan, Y. Estimation of different data compositions for early-season crop type classification. PeerJ 2018, 6, e4834. [Google Scholar] [CrossRef] [PubMed]
- Zhang, X.; Liu, L.; Liu, Y.; Jayavelu, S.; Wang, J.; Moon, M.; Henebry, G.M.; Friedl, M.A.; Schaaf, C.B. Generation and evaluation of the VIIRS land surface phenology product. Remote Sens. Environ. 2018, 216, 212–229. [Google Scholar] [CrossRef]
- Model Persistence. Available online: https://scikit-learn.org/stable/modules/model_persistence.html (accessed on 20 December 2021).
- Nearest Neighbors. Available online: https://scikit-learn.org/stable/modules/neighbors.html (accessed on 20 December 2021).
- Patwardhan Sai. Simple Understanding and Implementation of KNN Algorithm. Available online: https://www.analyticsvidhya.com/blog/2021/04/simple-understanding-and-implementation-of-knn-algorithm/ (accessed on 20 December 2021).


Publisher’s Note: MDPI stays neutral with regard to jurisdictional claims in published maps and institutional affiliations. |
© 2022 by the authors. Licensee MDPI, Basel, Switzerland. This article is an open access article distributed under the terms and conditions of the Creative Commons Attribution (CC BY) license (https://creativecommons.org/licenses/by/4.0/).
Share and Cite
Stournaras, S.; Loukatos, D.; Arvanitis, K.G.; Kalatzis, N. Crop Identification by Machine Learning Algorithm and Sentinel-2 Data. Chem. Proc. 2022, 10, 20. https://doi.org/10.3390/IOCAG2022-12261
Stournaras S, Loukatos D, Arvanitis KG, Kalatzis N. Crop Identification by Machine Learning Algorithm and Sentinel-2 Data. Chemistry Proceedings. 2022; 10(1):20. https://doi.org/10.3390/IOCAG2022-12261
Chicago/Turabian StyleStournaras, Serafeim, Dimitrios Loukatos, Konstantinos G. Arvanitis, and Nikolaos Kalatzis. 2022. "Crop Identification by Machine Learning Algorithm and Sentinel-2 Data" Chemistry Proceedings 10, no. 1: 20. https://doi.org/10.3390/IOCAG2022-12261