Proceeding Paper

Microsatellite Loci Reveal Heterozygosis and Population Structure in the Critically Endangered Southern River Terrapin (Batagur affinis ssp.) of Peninsular Malaysia †

by
Mohd Hairul Mohd Salleh
1,2 and
Yuzine Esa
1,3,*
1
Department of Aquaculture, Faculty of Agriculture, Universiti Putra Malaysia, Serdang 43400, Malaysia
2
Royal Malaysian Customs Department, Persiaran Perdana, Presint 2, Putrajaya 62596, Malaysia
3
International Institute of Aquaculture and Aquatic Sciences, Universiti Putra Malaysia, Lot 960 Jalan Kemang 6, Port Dickson 71050, Malaysia
*
Author to whom correspondence should be addressed.
Presented at the 1st International Online Conference on Agriculture—Advances in Agricultural Science and Technology (IOCAG2022), 10–25 February 2022. Available online: https://iocag2022.sciforum.net/.
Chem. Proc. 2022, 10(1), 11; https://doi.org/10.3390/IOCAG2022-12230
Published: 10 February 2022

Abstract

:
These freshwater turtles are found across Indochina, mostly in large rivers. There is a lack of genetic research concentrating on Malaysia’s southern river terrapin (Batagur affinis) population. We used minimally intrusive methods to collect blood samples from a total of 80 individuals in four different sites in peninsular Malaysia. The genetic difference within and between locations was examined using five microsatellite loci. Our findings indicated that each locus was polymorphic. High numbers of heterozygotes were observed when the percentage of alleles in each locus was compared. Pairwise FST and Nei matrixes revealed considerable genetic differences across individuals from distinct geographical locations. Our population structure analysis shows a significant proportion of assigned individuals are linked to certain collection locations.

1. Introduction

Batagur affinis is a freshwater turtle species that once frequented large rivers in Vietnam, Cambodia, Thailand, peninsular Malaysia, Singapore, and Sumatra [1]. Currently, the IUCN Red List 2000 classifies it as critically endangered [2]. B. affinis [3] was divided into two subspecies based on minor morphological differences, colouration, nesting ecology, and three mitochondrial (mtDNA) and three nuclear DNA markers: B. affinis affinis, the western nominate population, and B. affinis edwardmolli, the eastern population [1,4]. The appoint subspecies B. affinis affinis is found solely on the Malaysian Peninsula’s western coast; it is undoubtedly extinct in Sumatra [5]. On the other hand, the eastern coast of peninsular Malaysia subspecies B. a. edwardmolli, which previously extended from Singapore to Indochina, is now believed to be extinct in Singapore, Thailand, and Vietnam [1]. Overall, B. a. edwardmolli survives in populations along the Malaysian peninsula’s east coast and a relict population exists in Cambodia [1], making the Malaysian population the only genetic pool persisting in all of Indochina.
A microsatellite is one of the most frequently used markers. A microsatellite is a DNA sequence consisting of two to six tandem repetitions. Due to its codominant nature, polymorphism, ability to be inherited according to Mendelian’s rule, and ability to identify variations between closely related species, the microsatellite is an excellent tool for investigating population patterns and pedigree studies [6]. As a result, microsatellites are one of the most frequently used genetic markers by scientists in a wide variety of biological studies.
We investigated the genetics of the Southern river terrapin population. Then, we examined the genetic diversity, genetic structure, genetic divergence, and distributional range of several groups in peninsular Malaysia. Our purpose was to demonstrate that Southern river terrapin populations’ genetic diversity and structure are related to the collection location and restricted migrations, with little effect at broader scales due to the Southern river terrapin’s lack of broad migratory movements. Following that, we analysed and assessed the genetic diversity of Southern river terrapin populations. Finally, we hypothesised a genetic population structure characterised by a large proportion of individuals allocated to certain places. We demonstrate that human disturbance affects the Southern river terrapin’s genetic diversity by presenting our findings in various quantitative methods.

2. Materials and Methods

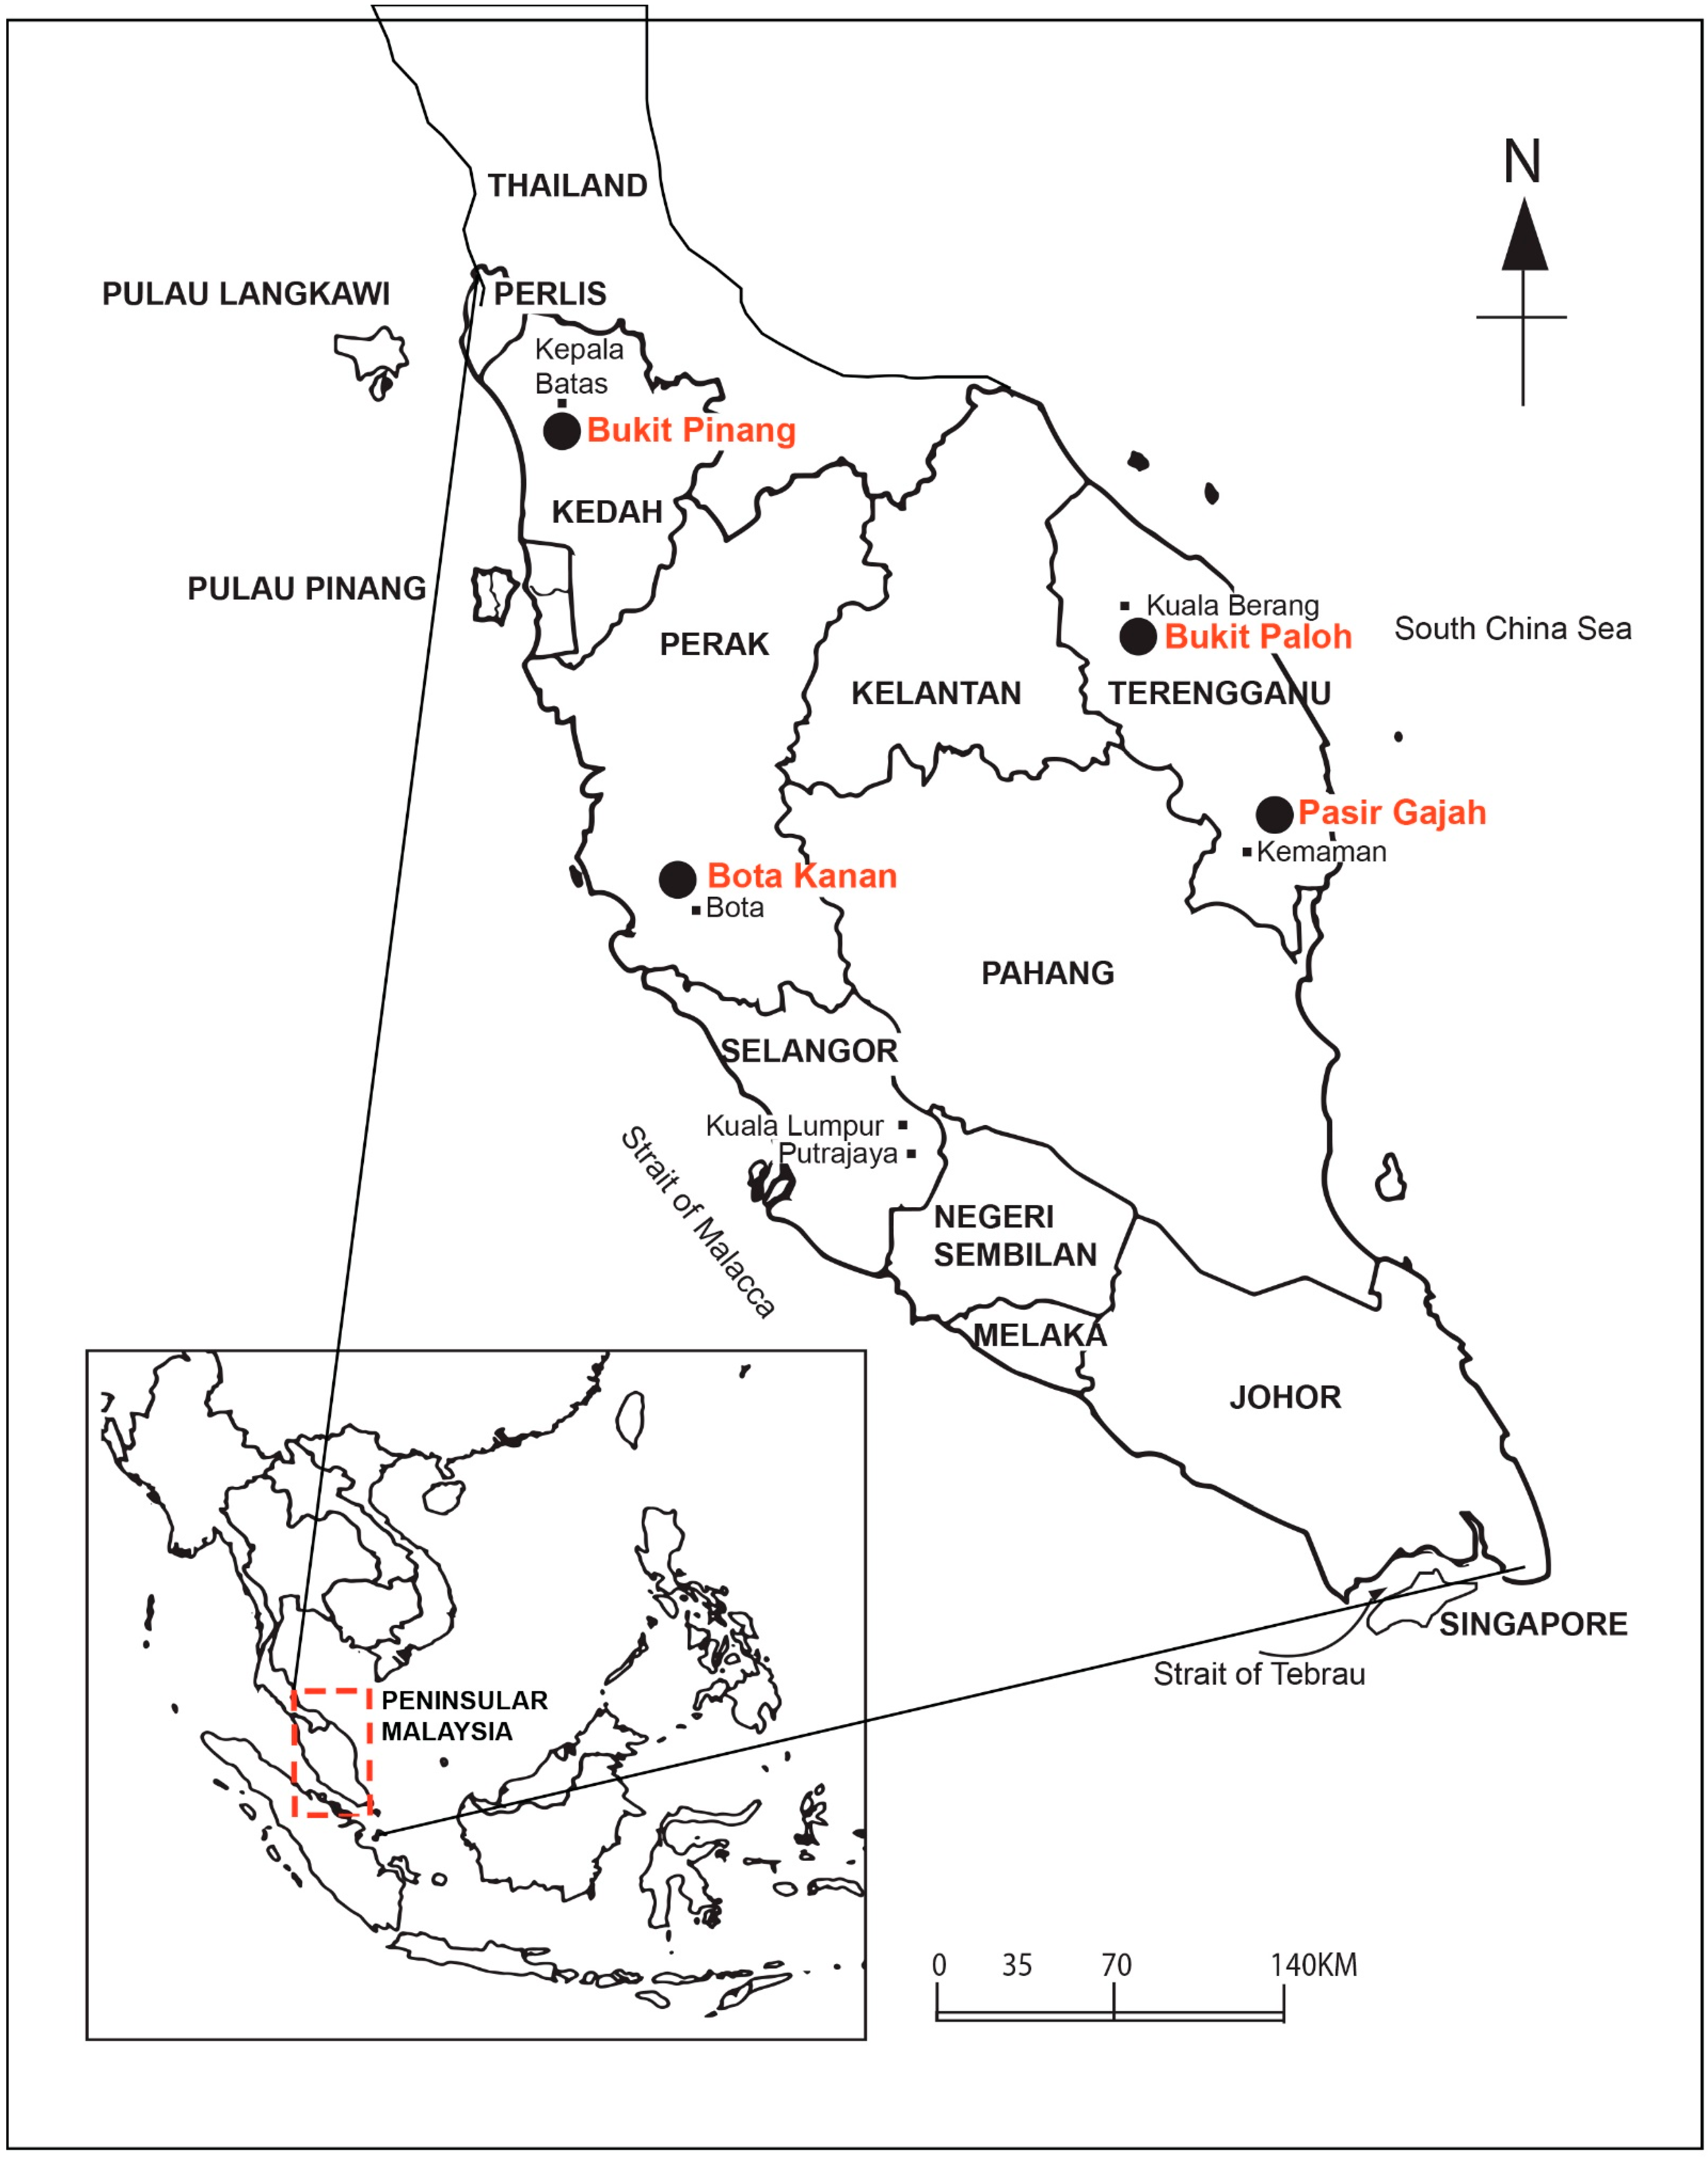
2.1. Populations Description

This study comprised 80 Batagur affinis ssp. individuals from four population regions crossing the East and West Malaysia peninsula (Figure 1): Pasir Gajah, Kemaman (KE), Terengganu (4.2524° N, 103.2957° E); Bukit Pinang, Kepala Batas (BP), Kedah (4.2221° N, 100.4370° E); Bota Kanan, Bota (BK), Perak (4.3489° N, 100.8802° E); and Bukit Paloh, Kuala Berang (KB), Terengganu (5.0939° N, 102.7821° E). A total of 20 individuals from the B. affinis ssp. population were sampled at each location in 2020. Blood was drawn using two venepuncture techniques: the subcarapacial venous plexus (SVP) and the jugular vein.

2.2. DNA Extraction and Microsatellite Analysis

Nucleic acids were isolated from each EDTA whole blood sample volume of 200 µL. Following cell lysis and protein denaturation, extractions were carried out utilising an automated system, the ReliaPrepTM Blood gDNA Miniprep System (Promega, Madison, WI, USA), with Binding Column technology following the manufacturer’s protocol. The quality and concentration of extracted DNA were estimated using the Thermo Scientific™ NanoDrop 2000c spectrophotometer (Thermo Fisher Scientific, Waltham, MA, USA) model ND −2000 and visualised in 1% agarose with molecular markers. The DNA was stored at −20 °C until further use.
Five pairs of microsatellite loci established by [7] were used for microsatellite amplification. Go Taq Flexi PCR (Promega, Madison, WI, USA) comprises 1.6 µL of MgCl2, 0.2 µL of Taq polymerase, 0.4 µL of dNTPs, 4 µL of buffer, 11 µL of ddH2O, 2 µL of DNA, and 0.4 µL of forward and reverse microsatellite primers. Thermal cycling parameters for PCRs using microsatellite markers of B. trivittata included an initial denaturation at 95 °C for 4 min, followed by 30 cycles of denaturation at 94 °C for 1 min, primer annealing at Ta °C for 1 min, extension at 72 °C for 1 min, and a final extension at 72 °C for 5 min. The full amplification procedure retained a constant temperature of 10 °C. To check for contamination during the experiment, all amplifications were carried out using negative controls. The microsatellites’ PCR products were tested on a 2% high-resolution agarose gel. To create the gel, 4 g of MetaPhorTM Agarose powder (Lonza, Rockland, ME, USA) were combined with 60 mL of 1× TBE buffer (Promega, Madison, WI, USA). A 50 bp DNA ladder (Promega, Madison, WI, USA) was also employed as a standard DNA size marker. Numerous DNA polymorphisms were revealed in the PCR results with numerous fluorescence bands. Microsatellite screening was then executed on the samples to determine the anticipated size of PCR products. At this step, colourless MyTaq Red Mix and suitable primers with appropriate fluorescent colour markers (FAM) were used for PCR amplification. In addition, for agarose gel electrophoresis, loading dye was added to the PCR products.
All PCR products were wrapped in aluminium foil and sent through the Applied Biosystems Genetic Analyzer to analyse fragments. Using GeneMapper version 5.0 [8], fragment sizes were interpreted in accordance with the 500-ROX DNA size standard. The fragment analysis findings were then used in statistical analyses of microsatellites.

2.3. Statistical Analysis

The genotypic data were interpreted into the appropriate forms for microsatellite analysis using the CONVERT 1.31 programme [9]. The GENEPOP and ARLEQUIN formats were among them. The allelic frequencies of the microsatellite loci observed in the Batagur affinis ssp. populations were also calculated using the CONVERT programme.

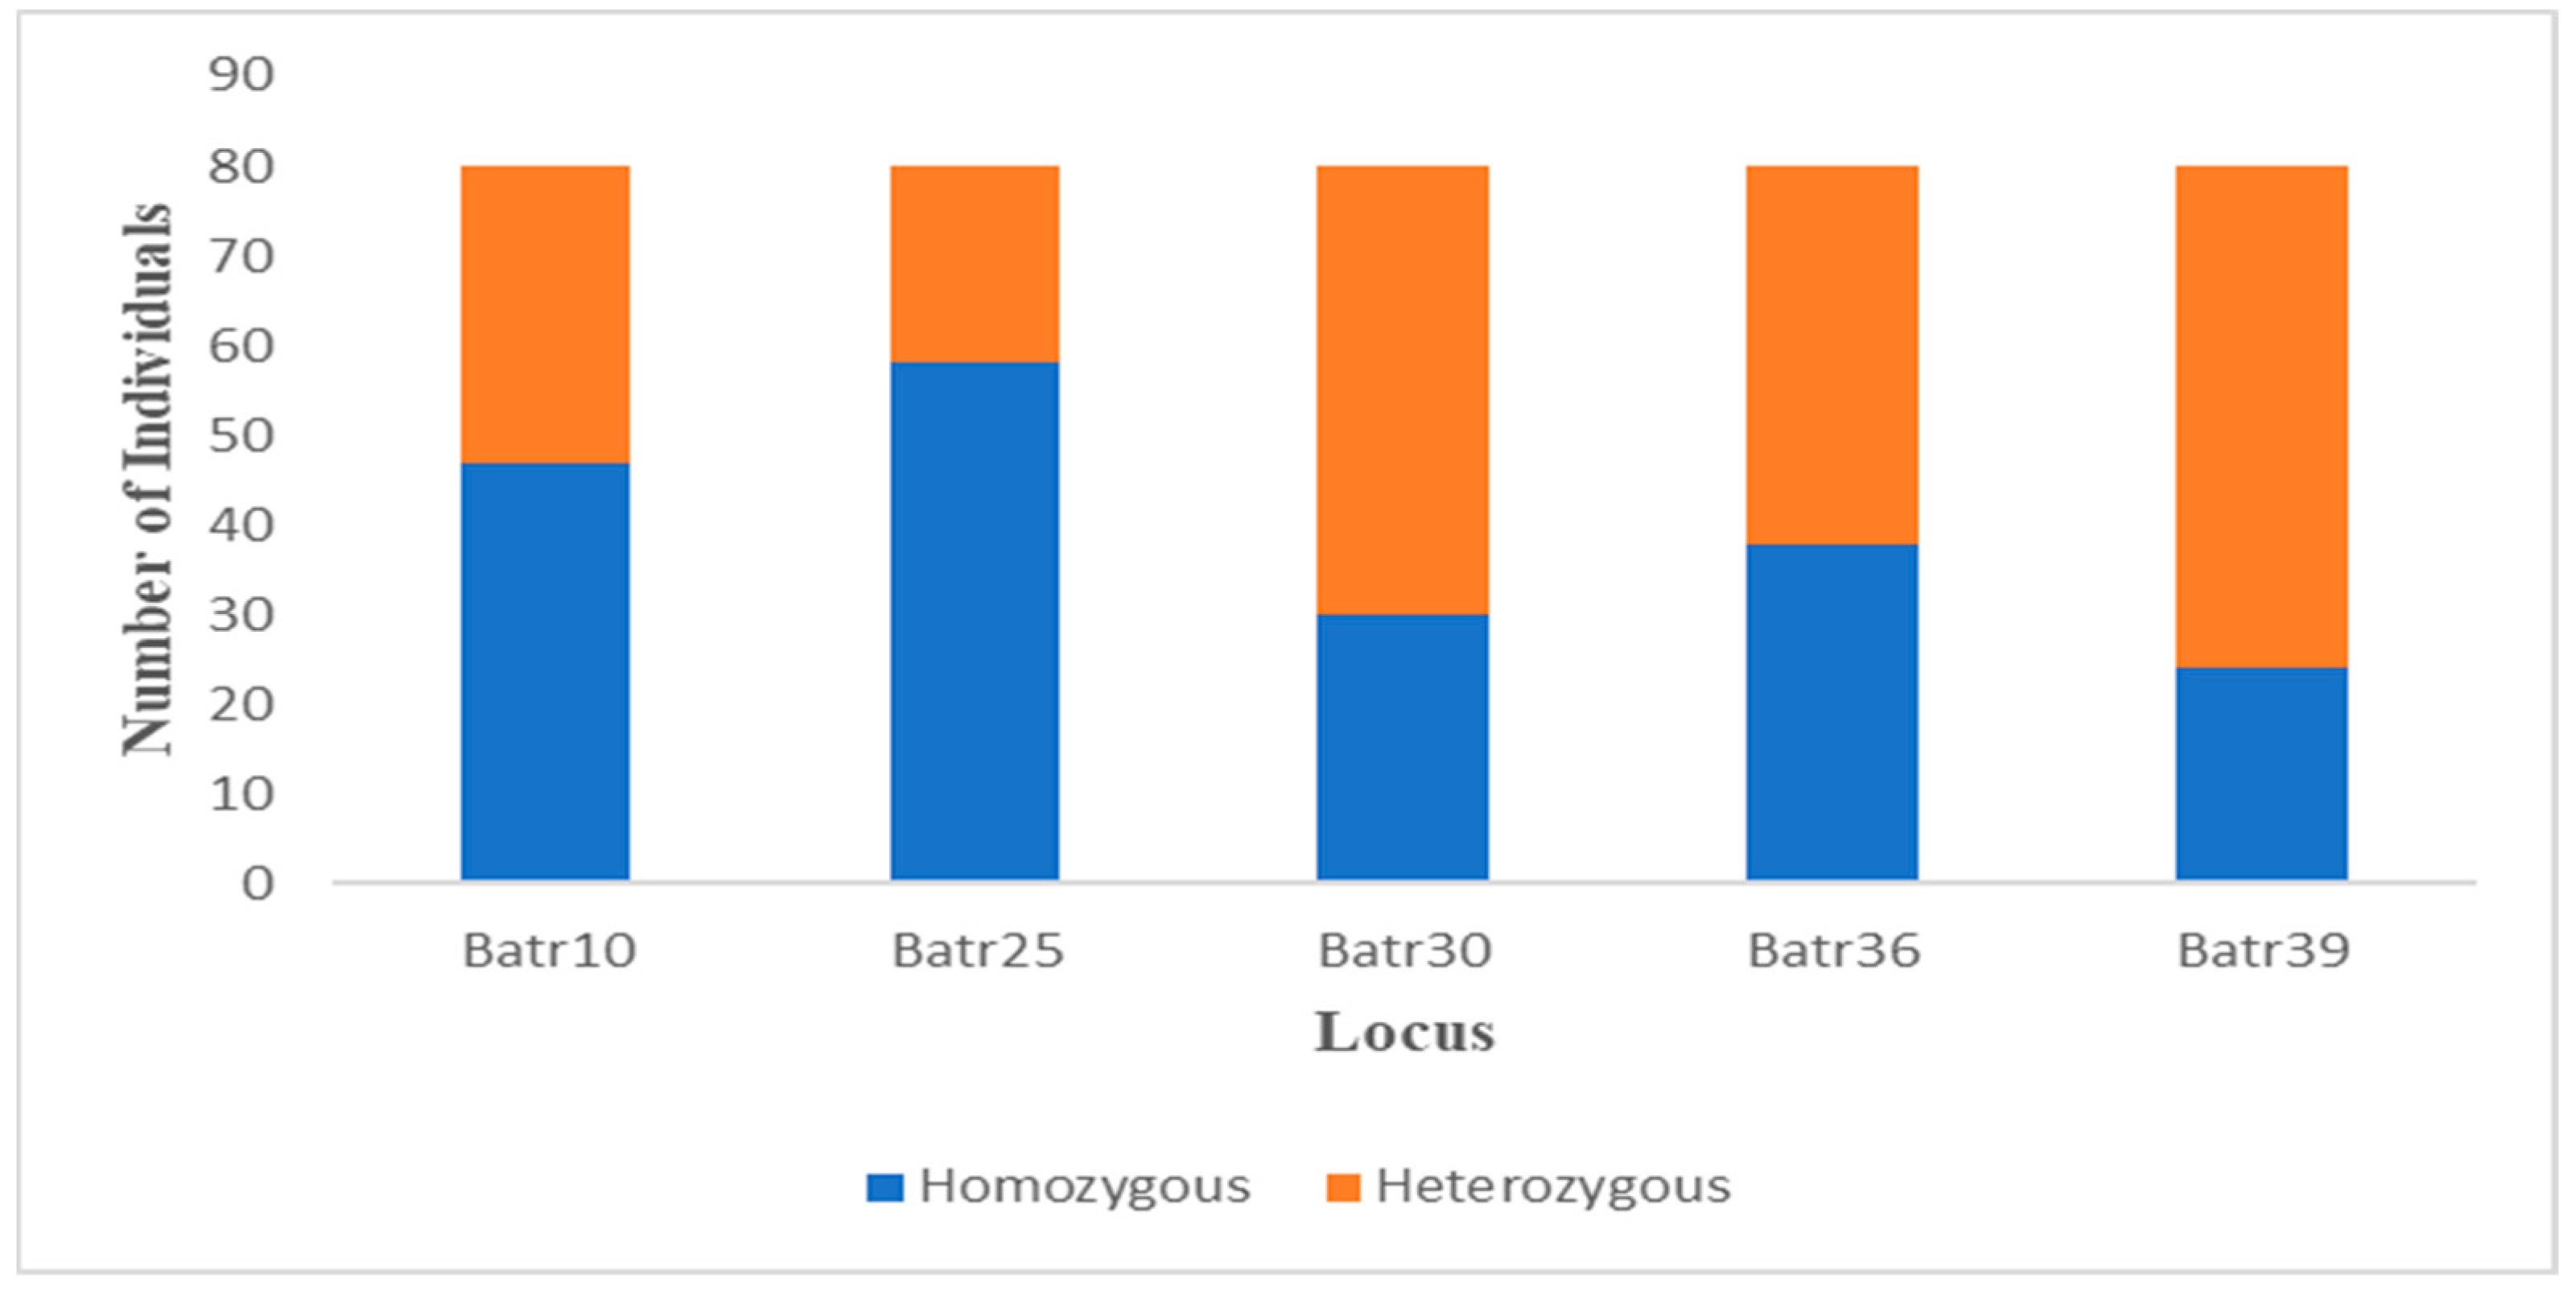
2.3.1. Genetic Diversity

The programme MicroChecker 2.2.3 [10] was used to check for genotyping errors, notably those caused by null alleles and allele dropouts, which were discovered throughout the study. According to the results of this study, the allelic richness (Rs), genetic diversity (Hs), observed heterozygosity (Ho), and expected heterozygosity (He) were estimated using FSTAT version 2.9.3.2 [11].

2.3.2. Population Structure

Furthermore, ARLEQUIN version 3.0 [12] was used to evaluate the significance of spatial variation in genetic diversity of B. affinis ssp. populations applied in AMOVA. Analyses of molecular variance (AMOVA) [13] were then performed to test the genetic relationships between the different groups. Spatial analysis of molecular variance (SAMOVA) was carried out with a microsatellite marker using SAMOVA 2.0 [14] to recognise groups of populations that are phylogeographically homogeneous and maximally differentiated from each other, taking into account the geographic distances. This analysis permits the identification of the maximally differentiated groups that parallel predefined genetic barriers by optimising the proportion of total genetic differences due to dissimilarities between groups [15]. Two measures must be considered to select the optimal number of groups (K). First, FCT values would reach a maximum or a plateau. Second, the structures with one or more single-population groups should be left out, as this indicates that the group structure is disappearing [16]. We implemented analyses for K = 2 to 3 to identify the most likely number of groups, with the four populations genotyped with microsatellites.
The other fixation indices were also measured using the ARLEQUIN software to examine the genetic differentiation among B. affinis ssp. populations [17]. Finally, assignment tests in GenAlEx 6.5 [18] were conducted by estimating the probability of individuals from each population and pairwise net matrix.

3. Results and Discussion

We identified 133 alleles at five nuclear microsatellite loci. For all locations, all loci were polymorphic (range: 21–37 alleles per locus). Marine vertebrates are thought to have more significant allele variations at their microsatellite primers than freshwater animals, which is mainly compatible with their larger population evolutionary size [19]. Batr25, Batr30, and Batr36 were identified as null alleles or linkage disequilibrium. Additionally, null alleles resulted in an excess of homozygotes in the groups examined [20,21].
Compared to [22], B. Baska research in Bangladesh does present any null allele. This, in turn, affects the FIS inquiry. According to [23], null alleles at microsatellite loci are often observed. As a result, using more heterozygous loci allows a more precise resolution of B. affinis ssp. population structure. Finally, overexploitation of B. affinis ssp. across Malaysia’s rivers and habitat changes such as sand mining has reduced the size of this species’ proper breeding population [24].
Additionally, for all populations, the observed heterozygosity (Ho) was less than the expected heterozygosity (He) (Table 1). Except for Batr10 and Batr25, the number of heterozygotes was higher than the number of homozygotes at practically all loci (Figure 2). On the other hand, various judgements revealed an ample difference between homozygote/heterozygote associations. Kuala Berang (KB) had the highest allelic richness (Rs) (13.6) and genetic diversity (Hs) (0.88), whereas Kemaman (KE) had the lowest. Bukit Pinang (BP) had the lowest Rs (9) and Hs (0.81), whereas Bota Kanan (BK) had the highest. Therefore, B. affinis edwardmolli has a higher level of genetic diversity than B. affinis affinis.
Thus, total Rs indicated that the examined populations used cross-amplified primers at a greater rate than the B. baska population [22]. The sample size may affect the allelic richness and Hs. The authors in [25] established the beneficial impacts of sampling populations of 25–30 individuals. They did, however, emphasise the importance of collecting 5–100 samples per collection in order to avoid uncommon non-informative alleles.
The FST and Nei comparisons (Table 2) were both significant, with the greatest genetic difference between BP and BK. (FST = 0.122; Nei = 1.011) and the lowest genetic divergence between KB and BK. (FST = 0.064; Nei = 0.574). Nei’s pairwise estimations of genetic distances [26], the pairwise FST values, which indicate a high degree of interaction across the populations investigated [27,28], are similar to those found in Emys orbicularis populations, with FST values ranging from 0.02 to 0.30. [29] Assignment tests confirmed this, revealing a high proportion of properly assigned individuals, indicating significant genetic differences across groups.
To determine population genetic structure, a hierarchical AMOVA was used. Between the identified populations, 8% of the variance was observed. Individuals explained 55.32% of the population variance (Table 3). Similarly, differences in AMOVA of 7% were seen in the Emys orbicularis population [29]. This situation may be impacted by the high rate of gene flow across populations [28]. Fixation indices revealed a high degree of genetic structuring across populations (FST = 0.07; p < 0.05) and a moderate degree of inbreeding within them (FIS = 0.39 and FIT = 0.44; p > 0.05). In light of the SAMOVA findings, the geographical distribution of populations revealed three groups. These three categories were as follows: group I (KB and BK), group II (KE), and group III (BP). SAMOVA distribution values were consistent with those obtained for AMOVA, with individuals within populations bringing the greatest value (55.03%), followed by disparities across populations (5.34%), Table 3. The Bayesian cluster technique may determine the population structure [30]. The results of the three clusters of B. affinis ssp. populations with individuals collected in the east and west of peninsular Malaysia in the SAMOVA were unexpected.
On the other hand, we observed large excesses of heterozygotes in populations of B. affinis ssp. in Malaysia, as determined by a single statistical comparison. High levels of heterozygosis have been documented insufficiently in mammals and reptiles such as baboons [31], domestic sheep [32], vampire bats [33], and snapping turtles [34].
Excess heterozygosity has been attributed to various factors [33,35]: (1) It could be the result of small reproductive populations with only a few capable breeders. (2) Outbreeding may occur due to the most heterozygous individuals being subjected to selection factors. (3) it could be the outcome of asexual reproduction, or (4) It could result from random mating behaviour in dense populations. We terminated hypothesis three due to the species’ natural biology. Due to the species’ existing conservation status, small reproductive populations of B. affinis ssp. are not conceivable [36]. Therefore, the most logical explanation for the high heterozygosity would be dense populations of the Southern river terrapins, with little assortative mating behaviour under the influence of natural selection pressures. However, [37] noted the positive association between inbreeding and heterozygosity. It should be investigated further by using other polymorphic markers, which exhibit a higher percentage of linkage disequilibrium.

4. Conclusions

Overall, genetic diversity in B. affinis ssp. was higher than reported by [22] for other Batagur species. Furthermore, levels of genetic divergence and population differentiation among our sampling sites may change over time, primarily due to habitat changes caused by human activities. Nevertheless, our results showed consistency with expected genetic diversity and population differentiation for a species affected by human activities. A novelty is the first study on two subspecies of B. affinis. Four populations spanning the east, and west coasts of peninsular Malaysia were disclosed using microsatellites. The study showed that B. affinis edwardmolli had more genetic diversity than B. affinis affinis, making this research beneficial beyond Malaysia to the Indochina region. This will serve as a key source for future genetic association and functional analysis to enhance breeding programmes for long-term sustainability.

Author Contributions

Conceptualisation, M.H.M.S. and Y.E.; methodology, M.H.M.S. and Y.E.; software, M.H.M.S. and Y.E.; validation, Y.E.; formal analysis, M.H.M.S.; investigation, M.H.M.S.; resources, M.H.M.S. and Y.E.; data curation, M.H.M.S.; writing—original draft preparation, M.H.M.S.; writing—review and editing, Y.E.; visualisation Y.E.; supervision, Y.E.; project administration, Y.E.; funding acquisition, Y.E. All authors have read and agreed to the published version of the manuscript.

Funding

This research received no external funding.

Institutional Review Board Statement

The study was conducted according to the guidelines and approved by the Department of Wildlife and National Parks, Peninsular Malaysia, with the research permit (B-00335-16-20).

Informed Consent Statement

Not applicable.

Data Availability Statement

Not applicable.

Acknowledgments

We want to acknowledge the Universiti Putra Malaysia for funding my study through a Graduate Research Fellowship. In addition, we would also like to express our gratitude to the Genetic and Breeding Laboratory, Department of Aquaculture, Faculty of Agriculture, Universiti Putra Malaysia for their facilities and support of this research project. Furthermore, we thank the Turtle Conservation Society of Malaysia and the Department of Wildlife and National Parks, Peninsular Malaysia, for their collaboration. Last but not least, we thank the anonymous reviewers for their insights and suggestions to improve this paper.

Conflicts of Interest

The authors declare no conflict of interest.

References

  1. Moll, E.; Platt, S.; Chan, E.H.; Horne, B.; Platt, K.; Praschag, P.; Chen, P.N.; Van Dijk, P.P. Batagur affinis (Cantor 1847)—Southern River Terrapin, Tuntong. Chelonian Res. Monogr. 2015, 5, 90–91. [Google Scholar] [CrossRef] [Green Version]
  2. Batagur affinis. The IUCN Red List of Threatened Species. Available online: https://doi.org/10.2305/IUCN.UK.2016-1.RLTS.T170501A1315041.en (accessed on 1 November 2021).
  3. Praschag, P.; Holloway, R.; Georges, A.; Päckert, M.; Hundsdörfer, A.K.; Fritz, U. A new subspecies of Batagur affinis (Cantor, 1847), one of the world’s most critically endangered chelonians (Testudines: Geoemydidae). Zootaxa 2009, 2233, 57–68. [Google Scholar] [CrossRef]
  4. Salleh, M.H.M.; Esa, Y. The mtDNA D-loop Marker Identifies the Genetic Variability of Indochina’s Batagur affinis. In 1st Postgraduate Seminar on Agriculture and Forestry 2021 (PSAF 2021); UPM Press: Serdang, Selangor, Malaysia, 2021; p. 82. [Google Scholar]
  5. Mistar Siregar, A.J.; Singleton, I. Presence and Distribution of the Southern River Terrapin Batagur Affinis and Painted Terrapin Batagur Borneoensis in Eastern Coast of Sumatra, Auckland, New Zealand; 25p, Unpublished Report to Auckland Zoo.
  6. Abdul Muneer, P.M. Molecular Genetic Characterisation of Endemic Yellow Catfish, Horabagrus brachysoma (Gunther). Ph.D. Thesis, Cochin University of Science and Technology, Cochin, India, 2005. [Google Scholar]
  7. Love, C.N.; Hagen, C.; Horne, B.D.; Jones, K.L.; Lance, S.L. Development and characterization of thirty novel microsatellite markers for the critically endangered Myanmar Roofed Turtle, Batagur trivittata, and cross-amplification in the Painted River Terrapin, B. borneoensis, and the Southern River Terrapin, B. affinis, using paired-end Illumina shotgun sequencing. Conserv. Genet. Resour. 2013, 5, 383–387. [Google Scholar] [CrossRef]
  8. Chatterji, S.; Pachter, L. Reference based annotation with GeneMapper. Genome Biol. 2006, 7, R29. [Google Scholar] [CrossRef] [Green Version]
  9. Glaubitz, J.C. convert: A user-friendly program to reformat diploid genotypic data for commonly used population genetic software packages. Mol. Ecol. Notes 2004, 4, 309–310. [Google Scholar] [CrossRef]
  10. Van Oosterhout, C.; Hutchinson, W.F.; Wills, D.P.M.; Shipley, P. Micro-checker: Software for identifying and correcting genotyping errors in microsatellite data. Mol. Ecol. Notes 2004, 4, 535–538. [Google Scholar] [CrossRef]
  11. Goudet, J. FSTAT (Version 1.2): A Computer Program to Calculate F-Statistics. J. Hered. 1995, 86, 485–486. [Google Scholar] [CrossRef]
  12. Excoffier, L.; Laval, G.; Schneider, S. Arlequin (version 3.0): An integrated software package for population genetics data analysis. Evol. Bioinform. 2005, 1, 47–50. [Google Scholar] [CrossRef] [Green Version]
  13. Excoffier, L.; Smouse, P.E.; Quattro, J.M. Analysis of molecular variance inferred from metric distances among DNA haplotypes: Application to human mitochondrial DNA restriction data. Genetics 1992, 131, 479–491. [Google Scholar] [CrossRef]
  14. Dupanloup, I.; Schneider, S.; Excoffier, L. A simulated annealing approach to define the genetic structure of populations. Mol. Ecol. 2002, 11, 2571–2581. [Google Scholar] [CrossRef]
  15. Crawford, M.H. Genetic structure of circumpolar populations: A synthesis. Am. J. Hum. Biol. 2007, 19, 203–217. [Google Scholar] [CrossRef] [PubMed]
  16. Magri, D.; Vendramin, G.G.; Comps, B.; Dupanloup, I.; Geburek, T.; Gömöry, D.; Latałowa, M.; Litt, T.; Paule, L.; Roure, J.M.; et al. A new scenario for the Quaternary history of European beech populations: Palaeobotanical evidence and genetic consequences. New Phytol. 2006, 171, 199–221. [Google Scholar] [CrossRef] [PubMed]
  17. Weir, B.S.; Cockerham, C.C. Estimating F-Statistics for the Analysis of Population Structure. Evolution 1984, 38, 1358–1370. [Google Scholar] [CrossRef] [PubMed]
  18. Peakall, R.; Smouse, P.E. GenAlEx 6.5: Genetic analysis in Excel. Population genetic software for teaching and research-an update. Bioinformatics 2012, 28, 2537–2539. [Google Scholar] [CrossRef] [Green Version]
  19. Neff, B.D.; Gross, M.R. Microsatellite evolution in vertebrates: Inference from ac dinucleotide repeats. Evolution 2001, 55, 1717–1733. [Google Scholar] [CrossRef]
  20. Esa, Y.B.; Siraj, S.S.; Rahim, K.A.A.; Daud, S.K.; Ho, G.H.; Tan, S.G.; Syukri, M.F. Genetic Characterisation of Two Mahseer Species (Tor douronensis and Tor tambroides) Using Microsatellite Markers from Other Cyprinids. Sains Malays. 2011, 40, 1087–1095. [Google Scholar]
  21. Xu, Q.; Liu, R. Development and Characterization of Microsatellite Markers for Genetic Analysis of the Swimming Crab, Portunus trituberculatus. Biochem. Genet. 2010, 49, 202–212. [Google Scholar] [CrossRef]
  22. Spitzweg, C.; Praschag, P.; DiRuzzo, S.; Fritz, U. Conservation genetics of the northern river terrapin (Batagur baska) breeding project using a microsatellite marker system. Salamandra 2018, 54, 63–70. [Google Scholar]
  23. Callen, D.F.; Thompson, A.D.; Shen, Y.; Phillips, H.A.; Richards, R.I.; Mulley, J.C.; Sutherland, G.R. Incidence and origin of “null” alleles in the (AC)n microsatellite markers. Am. J. Hum. Genet. 1993, 52, 922–927. [Google Scholar]
  24. Chen, P.N. Conservation of the Southern River Terrapin Batagur affinis (Reptilia: Testudines: Geoemydidae) in Malaysia: A case study involving local community participation. J. Threat. Taxa 2017, 9, 10035. [Google Scholar] [CrossRef]
  25. Hale, M.L.; Burg, T.M.; Steeves, T.E. Sampling for Microsatellite-Based Population Genetic Studies: 25 to 30 Individuals per Population Is Enough to Accurately Estimate Allele Frequencies. PLoS ONE 2012, 7, e45170. [Google Scholar] [CrossRef] [PubMed]
  26. Nei, M. Estimation of average heterozygosity and genetic distance from a small number of individuals. Genetics 1978, 89, 583–590. [Google Scholar] [CrossRef] [PubMed]
  27. Samani, N.K.; Esa, Y.; Amin, S.N.; Ikhsan, N.F.M. Phylogenetics and population genetics of Plotosus canius (Siluriformes: Plotosidae) from Malaysian coastal waters. PeerJ 2016, 4, e1930. [Google Scholar] [CrossRef] [PubMed] [Green Version]
  28. Chai, C.J.; Bin Esa, Y.; Ismail, S.; Kamarudin, M.S. Population Structure of the Blue Swimmer Crab Portunus pelagicus in Coastal Areas of Malaysia Inferred from Microsatellites. Zool. Stud. 2017, 56, e26. [Google Scholar] [CrossRef]
  29. Pedall, I.; Fritz, U.; Stuckas, H.; Valdeón, A.; Wink, M. Gene flow across secondary contact zones of the Emys orbicularis complex in the Western Mediterranean and evidence for extinction and re-introduction of pond turtles on Corsica and Sardinia (Testudines: Emydidae). J. Zool. Syst. Evol. Res. 2010, 49, 44–57. [Google Scholar] [CrossRef]
  30. Evanno, G.; Regnaut, S.; Goudet, J. Detecting the number of clusters of individuals using the software structure: A simulation study. Mol. Ecol. 2005, 14, 2611–2620. [Google Scholar] [CrossRef] [Green Version]
  31. Huchard, E.; Alvergne, A.; Féjan, D.; Knapp, L.A.; Cowlishaw, G.; Raymond, M. More than friends? Behavioural and genetic aspects of heterosexual associations in wild chacma baboons. Behav. Ecol. Sociobiol. 2010, 64, 769–781. [Google Scholar] [CrossRef]
  32. Smith, E.M.; Hoffman, J.I.; Green, L.E.; Amos, W. Preliminary association of microsatellite heterozygosity with footrot in domestic sheep. Livest. Sci. 2012, 143, 293–299. [Google Scholar] [CrossRef] [Green Version]
  33. Romero-Nava, C.; León-Paniagua, L.; Ortega, J. Microsatellites loci reveal heterozygosis and population structure in vampire bats (Desmodus rotundus) (Chiroptera: Phyllostomidae) of Mexico. Revista Biol. Trop. 2014, 62, 659–669. [Google Scholar] [CrossRef] [Green Version]
  34. Das, D.; Singh, S.K.; Bierstedt, J.; Erickson, A.; Galli, G.L.; Crossley, D.A.; Rhen, T. Draft Genome of the Common Snapping Turtle, Chelydra serpentina, a Model for Phenotypic Plasticity in Reptiles. G3 Genes Genomes Genet. 2020, 10, 4299–4314. [Google Scholar] [CrossRef]
  35. Stoeckel, S.; Grange, J.; Fernández-Manjarres, J.F.; Bilger, I.; Frascaria-Lacoste, N.; Mariette, S. Heterozygote excess in a self-incompatible and partially clonal forest tree species—Prunus aviumL. Mol. Ecol. 2006, 15, 2109–2118. [Google Scholar] [CrossRef] [PubMed]
  36. Medellín, R.A.; Equihua, M.; Amin, M.A. Bat diversity and abundance as indicators of disturbance in Neotropical rain forests. Conserv. Biol. 2000, 14, 1666–1675. [Google Scholar] [CrossRef] [PubMed]
  37. Balloux, F.; Amos, W.; Coulson, T. Does heterozygosity estimate inbreeding in real populations? Mol. Ecol. 2004, 13, 3021–3031. [Google Scholar] [CrossRef] [PubMed]
Figure 1. Sampling locations of Batagur affinis in four areas of peninsular Malaysia.
Chemproc 10 00011 g001
Figure 2. Frequencies of homozygous/heterozygous individual alleles represented for the five loci.
Chemproc 10 00011 g002
Table 1. Descriptive statistics for each population including a range of alleles, expected heterozygosity (He), and observed heterozygosity (H0), allele richness (Rs), gene diversity (Hs), sample size (N).
LocalityStatistical
HoHeAllele Rangep ValueRsHsN
KE0.660.857–170.0211.40.8620
KB0.490.879–16013.60.8820
BP0.510.88–11090.8120
BK0.370.817–130.01100.8120
Table 2. Pairwise genetic distance based on the FST matrix (below diagonal) and Nei Matrix (upper diagonal), a measure of divergence among the B. affinis ssp. populations. * p < 0.05.
RegionKemamanKuala BerangBukit PinangBota Kanan
Kemaman-0.9620.8940.823
Kuala Berang0.080 *-0.7490.574
Bukit Pinang0.096 *0.083 *-1.011
Bota Kanan0.088 *0.064 *0.122 *-
Table 3. Summary of AMOVA and SAMOVA statistics for alternative groupings of populations.
Source of VariationdfSum of SquaresVariance ComponentsPercentage of VarianceFixation
Indices
AMOVA.
Among populations within groups330.8690.183468.00FIS = 0.39871
Among individuals within populations76224.30.8412836.68FST = 0.07999
Among individuals within individuals80101.51.2687555.32FIT = 0.44680
SAMOVA, 3 groups
Among groups222.9940.072443.14FIS = 0.39871
Among populations within groups17.8750.123095.34FSC = 0.05512
Among individuals within populations76224.30.8412836.49FCT = 0.03142
Among individuals within individuals80101.51.2687555.03FIT = 0.44970
Publisher’s Note: MDPI stays neutral with regard to jurisdictional claims in published maps and institutional affiliations.

