Article

Optimization of Pulsed Electric Field-Based Extraction of Bioactive Compounds from Cannabis sativa Leaves

by
Dimitrios Mpakos
1,
Theodoros Chatzimitakos
2,
Vassilis Athanasiadis
2,
Martha Mantiniotou
2,
Eleni Bozinou
2 and
Stavros I. Lalas
2,*
1
Department of Chemical Engineering, University of Western Macedonia, 50100 Kozani, Greece
2
Department of Food Science & Nutrition, University of Thessaly, 43100 Karditsa, Greece
*
Author to whom correspondence should be addressed.
Analytica 2024, 5(1), 90-106; https://doi.org/10.3390/analytica5010006
Submission received: 9 January 2024 / Revised: 27 January 2024 / Accepted: 30 January 2024 / Published: 4 February 2024

Abstract

:
The current investigation examines the application of pulsed electric fields (PEFs) for isolating polyphenols from Cannabis sativa var. Futura 75 leaves. Firstly, the solvent composition, which included ethanol, water, and various mixtures of the two, was explored, along with the liquid-to-solid ratio. Subsequently, the primary parameters associated with PEFs (namely, pulse duration, pulse period, electric field intensity, and treatment duration) were optimized. The extracted samples were analyzed to determine their total polyphenol content (TPC), and individual polyphenols were also evaluated through high-performance liquid chromatography. In addition, the antioxidant activity of the extracts was assessed through ferric-reducing antioxidant power (FRAP) and DPPH assays. The extracts prepared utilizing PEFs were compared to the extracts obtained without PEFs in terms of their TPC, FRAP values, and DPPH activity. The results indicate that the most effective extraction parameters were a pulse duration of 10 μs, a pulse period of 1000 μs, and an electric field strength of 0.9 kV/cm after 25 min of extraction. The most efficient solvent was determined to be a 50% (v/v) mixture of ethanol and water in a 20:1 liquid-to-solid ratio. The extract obtained under the optimal conditions exhibited a ~75% increase in TPC compared to the extract obtained without any application of PEFs, while some individual polyphenols exhibited an increase of up to ~300%. Furthermore, significant increases of ~74% and ~71% were observed in FRAP and DPPH assays. From the information provided, it was observed that the tested variables had an impact on the recovery of polyphenols from C. sativa leaves.

1. Introduction

Up to now, continuous efforts have been made to develop new, advanced processes to overcome the drawbacks of existing techniques for extracting bioactive compounds from plants, as there is increasing interest in this field. Thus, one such new technique is the use of pulsed electric fields (PEFs) [1]. PEF treatment, as a green, non-thermal technique used for food preservation, which is based on the principle of applying short bursts of electricity to inactivate microorganisms, minimizes the negative impact on food quality [2]. The most common conditions of usage are short-duration pulses between 100 ns and 1 ms with a voltage between 1 kV and 3 kV [3]. Besides being used to enhance extraction processes [1], PEF treatment has recently gained popularity for diffusion, osmosis, pressing, and drying of food waste and by-products [4]. Another advantage is that it reduces the negative effects of conventional heating methods [2,5] and can electrify cell membranes. Therefore, it is used as a pretreatment to enhance the recovery of bioactive compounds such as polyphenols, carotenoids, and proteins [6,7]. In addition, water extraction procedures using PEFs showed lower temperatures, lower solvent consumption, and improved extraction rates of components [5]. Thus, it is considered an extraction technique that increase efficiency while reducing energy costs and preserving heat-sensitive substances [8,9,10].
Various sectors of the food industry are making use of PEFs [11]. This is due to the greater environmental sustainability and eco-efficiency attributed to the reduced overall energy consumption and lower energy requirements per unit of processed products [12]. Industrial PEF systems differ from research PEF systems, with the industrial systems exhibiting higher power/capacity and enhanced monitoring and control systems [13]. PEFs are being used for the pasteurization of food products, inactivation of bacterial spores, and enhancement of extraction. It is noteworthy that the use of PEFs can increase the yield of juice production by up to 32% [5]. This outcome is particularly significant, as it reflects a measurable enhancement directly associated with the adoption of PEF technology. The scope of PEF applications extends beyond fresh fruits and vegetables, encompassing the treatment of biomass waste generated in the agricultural and food sectors. PEF treatment of such waste holds promise for yielding valuable products, thereby contributing positively to waste utilization and resource recovery [5]. In addition to the above, PEF treatment has also been used to isolate bioactive compounds from medicinal plants. Representative examples are barberry [14], Melissa officialis leaves, Cistus incanus and Cistus creticus leaves [15], Sideritis sardica and Crocus sativus [3], Nepeta binaludensis [16], and Vinca rosea root [17]. Although the benefits of PEF treatment as well as the global interest among researchers in this method have increased in the last decade [18,19], cases were reported, such as that of Thymus serpyllum, where the use of PEFs did not increase the total polyphenol content (TPC) [7]. Therefore, its benefits should not be taken for granted and further exploited in specific cases.
Cannabis sativa L., known since ancient times, mainly in Central Asia (India and China), as an annual herbaceous plant, is also known as Indian hemp [20]. Human uses of C. sativa date back thousands of years and vary according to time and place. It has been used as a source of fiber, food, oil, and medicine [21], and also for religious and recreational purposes [20,22]. Its therapeutic action is attributed to the chemically active compounds it contains, such as cannabinoids, terpenoids, flavonoids, and alkaloids [23]. Cannabinoids, which are its most active compounds, belong to a family of more than 100 related terpenophenolic compounds with a wide range of biological activities [24] and accumulate mainly in the hair cavity of female flowers [21]. The main biologically active cannabinoids are Δ9-tetrahydrocannabinol, commonly referred to as Δ9-THC, known for its psychoactive properties [25], and the non-psychoactive cannabidiol (CBD) [26], characteristic of fiber-type cannabis. However, hemp plants also contain other considerable polyphenolic compounds, such as gallic acid, catechin [27], caffeic acid, coumaric acid, ferulic acid, luteolin-7-O-glucoside, apigenin, kaempferol-3-O-glucoside, apigenin-7-glucoside, myricitrin, rutin, chlorogenic acid, and quercetin-3-glucoside [28]. All these polyphenols give hemp significant antioxidant capacity [29], more specifically resulting in a range of 1.72 to 12.40 μmol Trolox equivalents (TE)/g dw of hemp sample when measured with the DPPH (2,2-diphenyl-1-picrylhydrazyl) assay. When the FRAP (ferric-reducing antioxidant power) assay was employed on C. sativa species, it resulted in an antioxidant capacity that ranged from 0.262 to 0.533 mg/mL [30]. Other researchers [31] determined the antioxidant capacity with both assays on hemp seed oil, and the reported values were 146.76 mmol of TE/100 g oil for the DPPH assay and 3690.6 µmol of TE/100 g oil for the FRAP assay.
PEF treatment is an environmentally friendly, rapid, and highly effective extraction method. The leaves of C. sativa could be a viable source of bioactive compounds, with a focus on their possible applications in the food and pharmaceutical industries. Hence, the objective of this study is to enhance the efficiency of recovering bioactive compounds from C. sativa leaves through PEF treatment. Response surface methodology (RSM) was employed to assess the suitable solvent and liquid-to-solid ratio and to optimize the parameters of PEF extraction. The efficiency of the extraction was determined by measuring the total polyphenol yield through the Folin–Ciocalteu method, while the antioxidant capacity of the extracts was assessed through ferric-reducing antioxidant power (FRAP) assay and DPPH radical scavenging activity assay.

2. Materials and Methods

2.1. Chemicals, Materials, and Reagents

Ethanol, gallic acid, and the Folin–Ciocalteu reagent were bought from Panreac Co. (Barcelona, Spain). Hydrochloric acid, methanol, 2,2-diphenyl-1-picrylhydrazyl (DPPH), 2,4,6-tris(2-pyridyl)-s-triazine (TPTZ), and all chemical standards for the HPLC determination of polyphenols were obtained from Sigma-Aldrich (Darmstadt, Germany). Anhydrous sodium carbonate was purchased from Penta (Prague, Czech Republic). Ιron (III) chloride was purchased from Merck (Darmstadt, Germany). Deionized water was used throughout all experiments.

2.2. Hemp Leaf Material

For all experiments, hemp (Cannabis sativa var. Futura 75) leaves (without flowering and fruiting tops) were donated by CBD Extraction Ι.Κ.Ε. (Farsala, Greece), gathered from the Farsala region (at 39°18′22″ N and 22°22′11″ E, based on Google Earth version 9.185.0.0). Leaves were rinsed extensively with distilled water and dried with paper towels. The leaf sample underwent lyophilization through a Biobase BK-FD10P freeze-dryer (Jinan, China). The moisture content of the fresh leaves was measured to be 79.12 ± 1.26%. The dried C. sativa leaves were then ground to a fine powder (<400 μm diameter) using a blender. Finally, until further analysis, the powder was preserved at −40 °C.

2.3. Extraction Procedure

The PEF processing of the samples was carried out using two custom stainless steel chambers (Val-Electronic, Athens, Greece), a mode/arbitrary waveform generator (UPG100, ELV Elektronik AG, Leer, Germany), a digital oscilloscope (Rigol DS1052E, Beaverton, OR, USA), and a high-voltage power generator (Leybold, LD Didactic GmbH, Huerth, Germany). Initially, the optimal liquid-to-solid ratio and solvent concentration were explored. To assess this, hemp powder was weighed (Kern PLS 3100-2F, Kern & Sohn GmbH, Balingen, Germany) and mixed with 20 mL of aqueous ethanol in ratios shown in Table 1. After the extraction through PEF treatment was completed, samples were centrifuged for 10 min at 10,000× g in a NEYA 16R centrifuge (Remi Elektrotechnik Ltd., Palghar, India). Finally, supernatants were collected and stored at −40 °C.

2.4. Optimization with Response Surface Methodology (RSM) and Experimental Design

The RSM technique was employed to achieve optimal efficiency in extracting bioactive compounds and evaluating antioxidant activity from C. sativa extracts. Therefore, the goal of the design was to effectively maximize the levels of these values. This was accomplished by optimizing the liquid-to-solid ratio (R, mL/g), solvent concentration (C %, v/v), extraction time (t, min), and PEF conditions. The optimization process was based on an experiment that utilized a Box–Behnken design with a main impact screening arrangement. The experiment consisted of 27 design points, including 3 center points. According to the experimental design, three levels of process variables were created. The overall model significance, as shown by the R2 and p-values, and the significance of the model coefficients, as represented by the equations, were assessed by employing analysis of variance (ANOVA) and summary-of-fit tests, with a minimum level of 95% confidence.
In addition, the response variable was predicted as a function of the examined independent factors using a second-order polynomial model, as illustrated in Equation (1):
Y k = β 0 + i = 1 2 β i X i + i = 1 2 β i i X i 2 + i = 1 2 j = i + 1 3 β i j X i X j
The predicted response variable is denoted as Yk, while the independent variables are Xi and Xj. The intercept and regression coefficients for the linear, quadratic, and interaction terms of the model are denoted as β0, βi, βii, and βij, respectively.
To determine the greatest peak area and assess the effect of a substantial independent variable on the response, RSM was applied. The development of three-dimensional surface response graphs was initiated to represent the model equation visually.

2.5. Total Polyphenol Content (TPC)

A previously established methodology [32] was applied to determine TPC. Briefly, 0.10 mL of the extract was combined with 0.10 mL of Folin–Ciocalteu reagent, and after 2 min, 0.80 mL of 5% w/v aqueous sodium carbonate solution was added. The mixture was incubated at 40 °C for 20 min and the absorbance was recorded at 740 nm in a Shimadzu UV-1700 PharmaSpec Spectrophotometer (Kyoto, Japan). The total polyphenol concentration (CTP) was calculated from a gallic acid calibration curve. Total polyphenol yield (YTP) was determined as mg gallic acid equivalents (GAE) per g of dry weight (dw), using the following Equation (2):
TPC   ( mg GAE / g dw ) = C T P × V w
where the volume of the extraction medium is indicated with V (expressed in L) and the dry weight of the sample as w (expressed in g).

2.6. Ferric-Reducing Antioxidant Power (FRAP) Assay

An established technique by Shehata et al. [33] was used for the evaluation of FRAP. A total of 0.05 mL of properly diluted sample was mixed with 0.05 mL of FeCl3 solution (4 mM in 0.05 M HCl). The mixture was incubated for 30 min at 37 °C, with 0.9 mL of TPTZ solution (1 mM in 0.05 M HCl) being immediately added right after, and the absorbance was measured after 5 min at 620 nm. The ferric-reducing power (PR) was calculated using an ascorbic acid calibration curve (CAA) in 0.05 M HCl with ranging values (50–500 μM). The PR was calculated as μmol of ascorbic acid equivalents (AAE) per gram of dw, using Equation (3):
P R   ( μ mol AAE / g   d w ) = C A A × V w
where V is represented (in L) as the entire volume of the extraction medium and w (in g) represents the dried weight of the material.

2.7. DPPH Antiradical Activity Assay

The extracted polyphenols from the dried material were evaluated for their antiradical activity (AAR) using a slightly modified DPPH method, as previously established by Shehata et al. [33]. In brief, 4 mL of the sample was mixed with a quantity of 1 mL of a 0.1 mM DPPH solution in methanol, with the solution being kept at room temperature for 30 min in the dark right after. The absorbance was measured at 515 nm. Moreover, a blank sample was used instead of the sample, including DPPH solution and methanol, with the absorbance immediately being measured. To calculate the percentage of scavenging, Equation (4) was employed:
%   Scavenging = A control A sample A control × 100
An ascorbic acid calibration curve in Equation (5) was used to evaluate antiradical activity (AAR), which was expressed as μmol AAE per gram of dw:
A AR   ( μ mol AAE / g   d w ) = C A A × V w
where V is represented (in L) as the entire volume of the extraction medium and w (in g) represents the dried weight of the material.

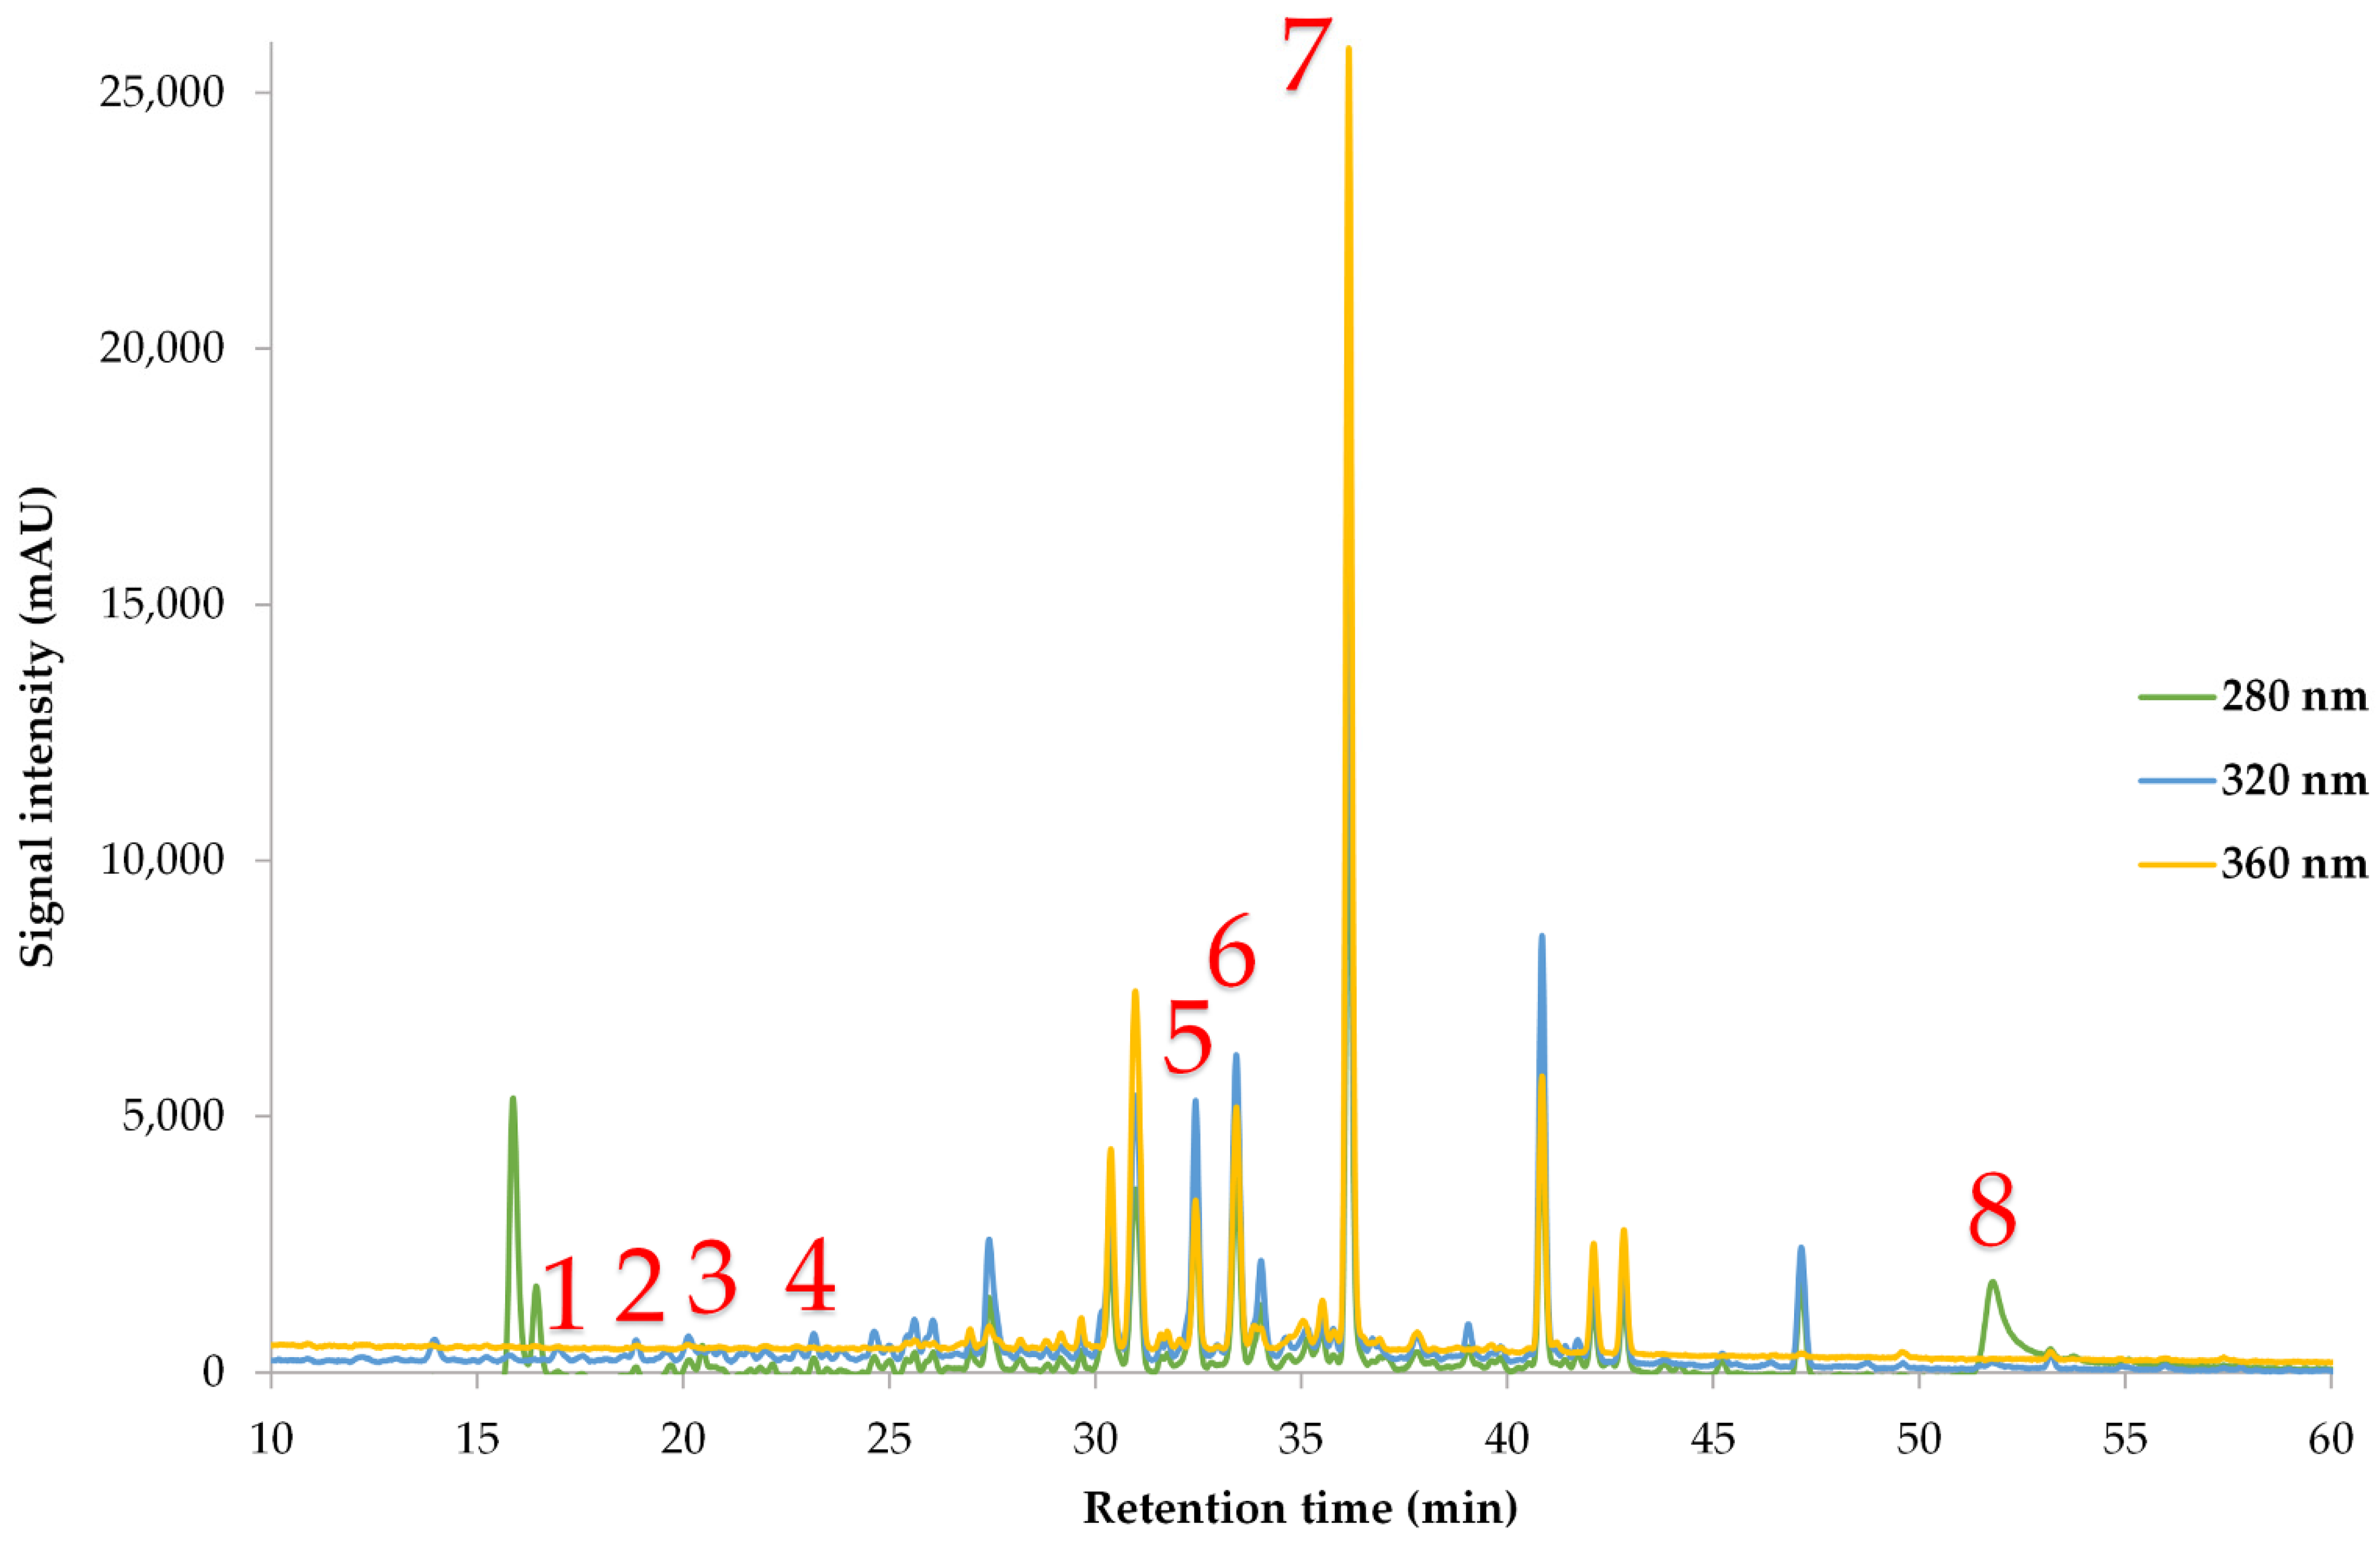
2.8. HPLC Quantification of Polyphenolic Compounds

High-performance liquid chromatography (HPLC) was used to detect and quantify individual polyphenols from the sample extracts, as established in our previous research [32]. A Shimadzu CBM-20A liquid chromatograph and a Shimadzu SPD-M20A diode array detector (DAD) (both purchased by Shimadzu Europa GmbH, Duisburg, Germany) was employed for the analysis of C. sativa extracts. The compounds were separated into a Phenomenex Luna C18(2) column from Phenomenex Inc. in Torrance, California and kept at 40 °C (100 Å, 5 μm, 4.6 mm × 250 mm). The mobile phase included 0.5% aqueous formic acid (A) and 0.5% formic acid in acetonitrile/water (3:2) (B). The gradient program was as follows: initially from 0 to 40% B, then to 50% B in 10 min, to 70% B in another 10 min, and then constant for 10 min. The flow rate of the mobile phase was set at 1 mL/min. The compounds were identified by comparing the absorbance spectrum and retention time to those of pure standards and then quantified through calibration curves (0–50 μg/mL).

2.9. Statistical Analysis

The statistical analysis related to response surface methodology and distribution analysis, which were applicable through JMP® Pro 16 software (SAS, Cary, NC, USA). The Kolmogorov–Smirnov test was utilized to assess the normality of the data. The one-way analysis of variance (ANOVA) was carried out. The quantitative analysis was performed in triplicate, and the extraction procedures were repeated at least twice for each batch of C. sativa extract. The results are represented in the form of means and standard deviations. A significance level of p < 0.05 was applied to evaluate the statistical significance. Principal component analysis (PCA), multivariate correlation analysis (MCA), and partial least squares (PLS) analysis were conducted through JMP® Pro 16 software.

3. Results and Discussion

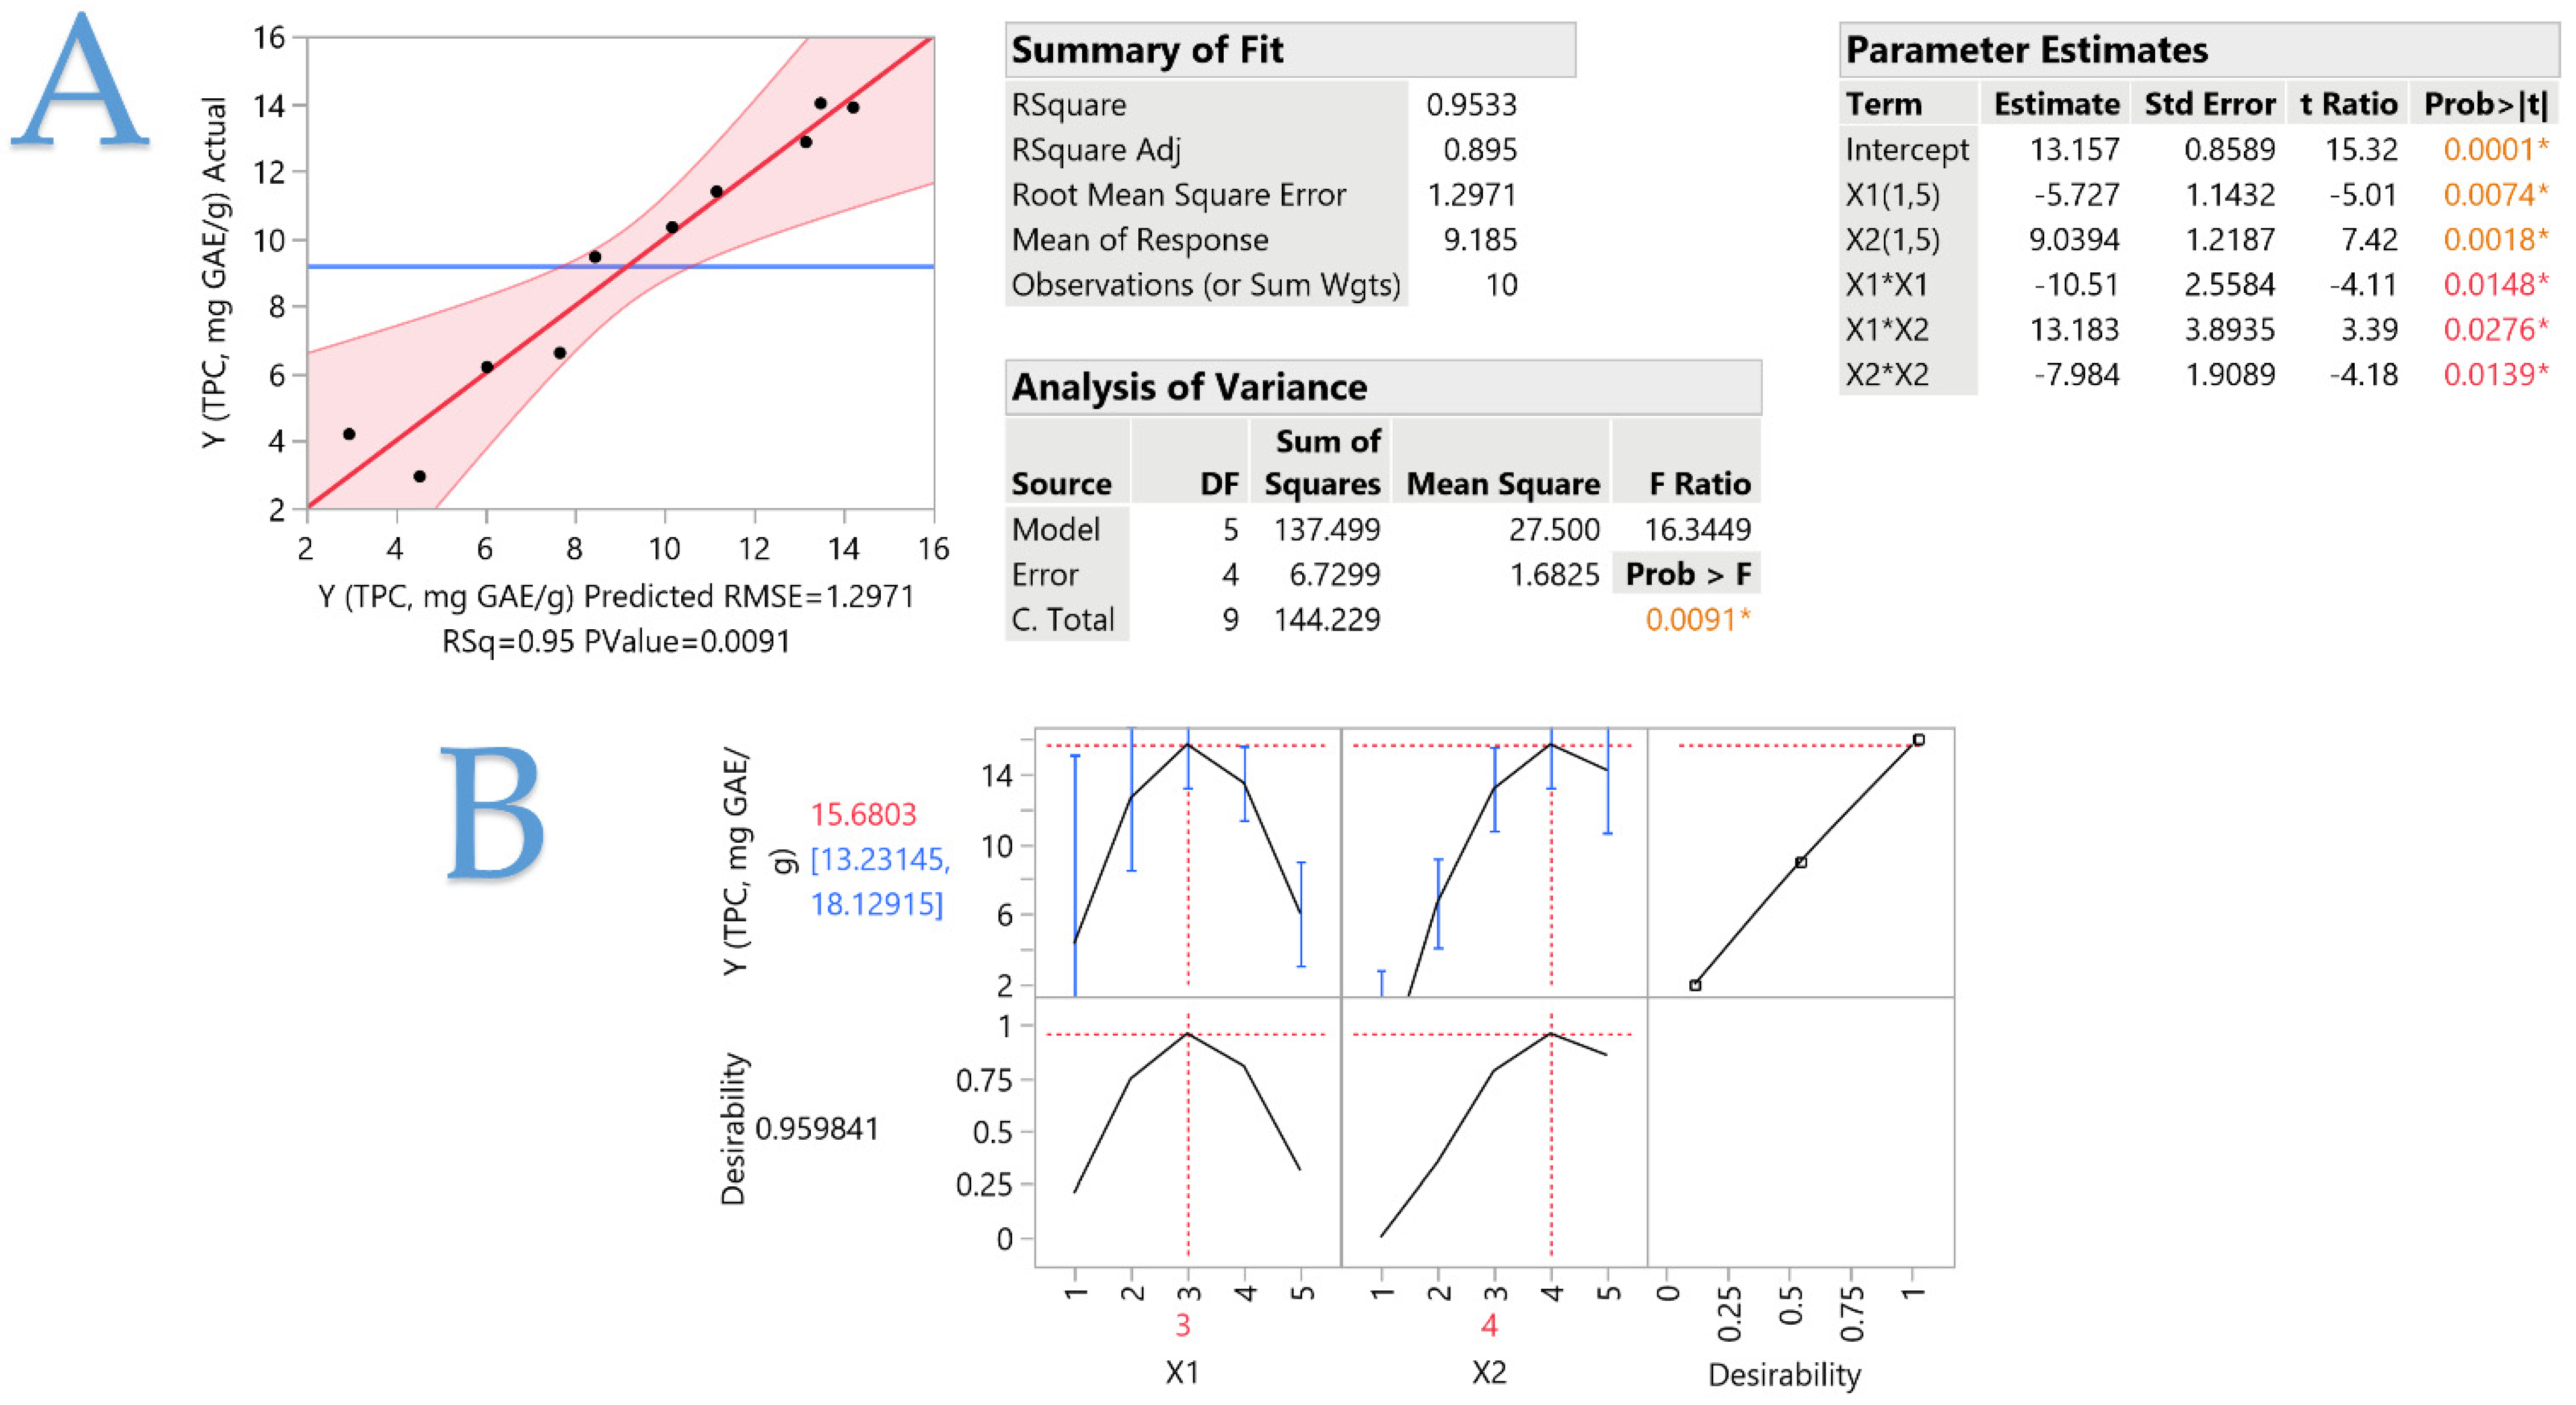
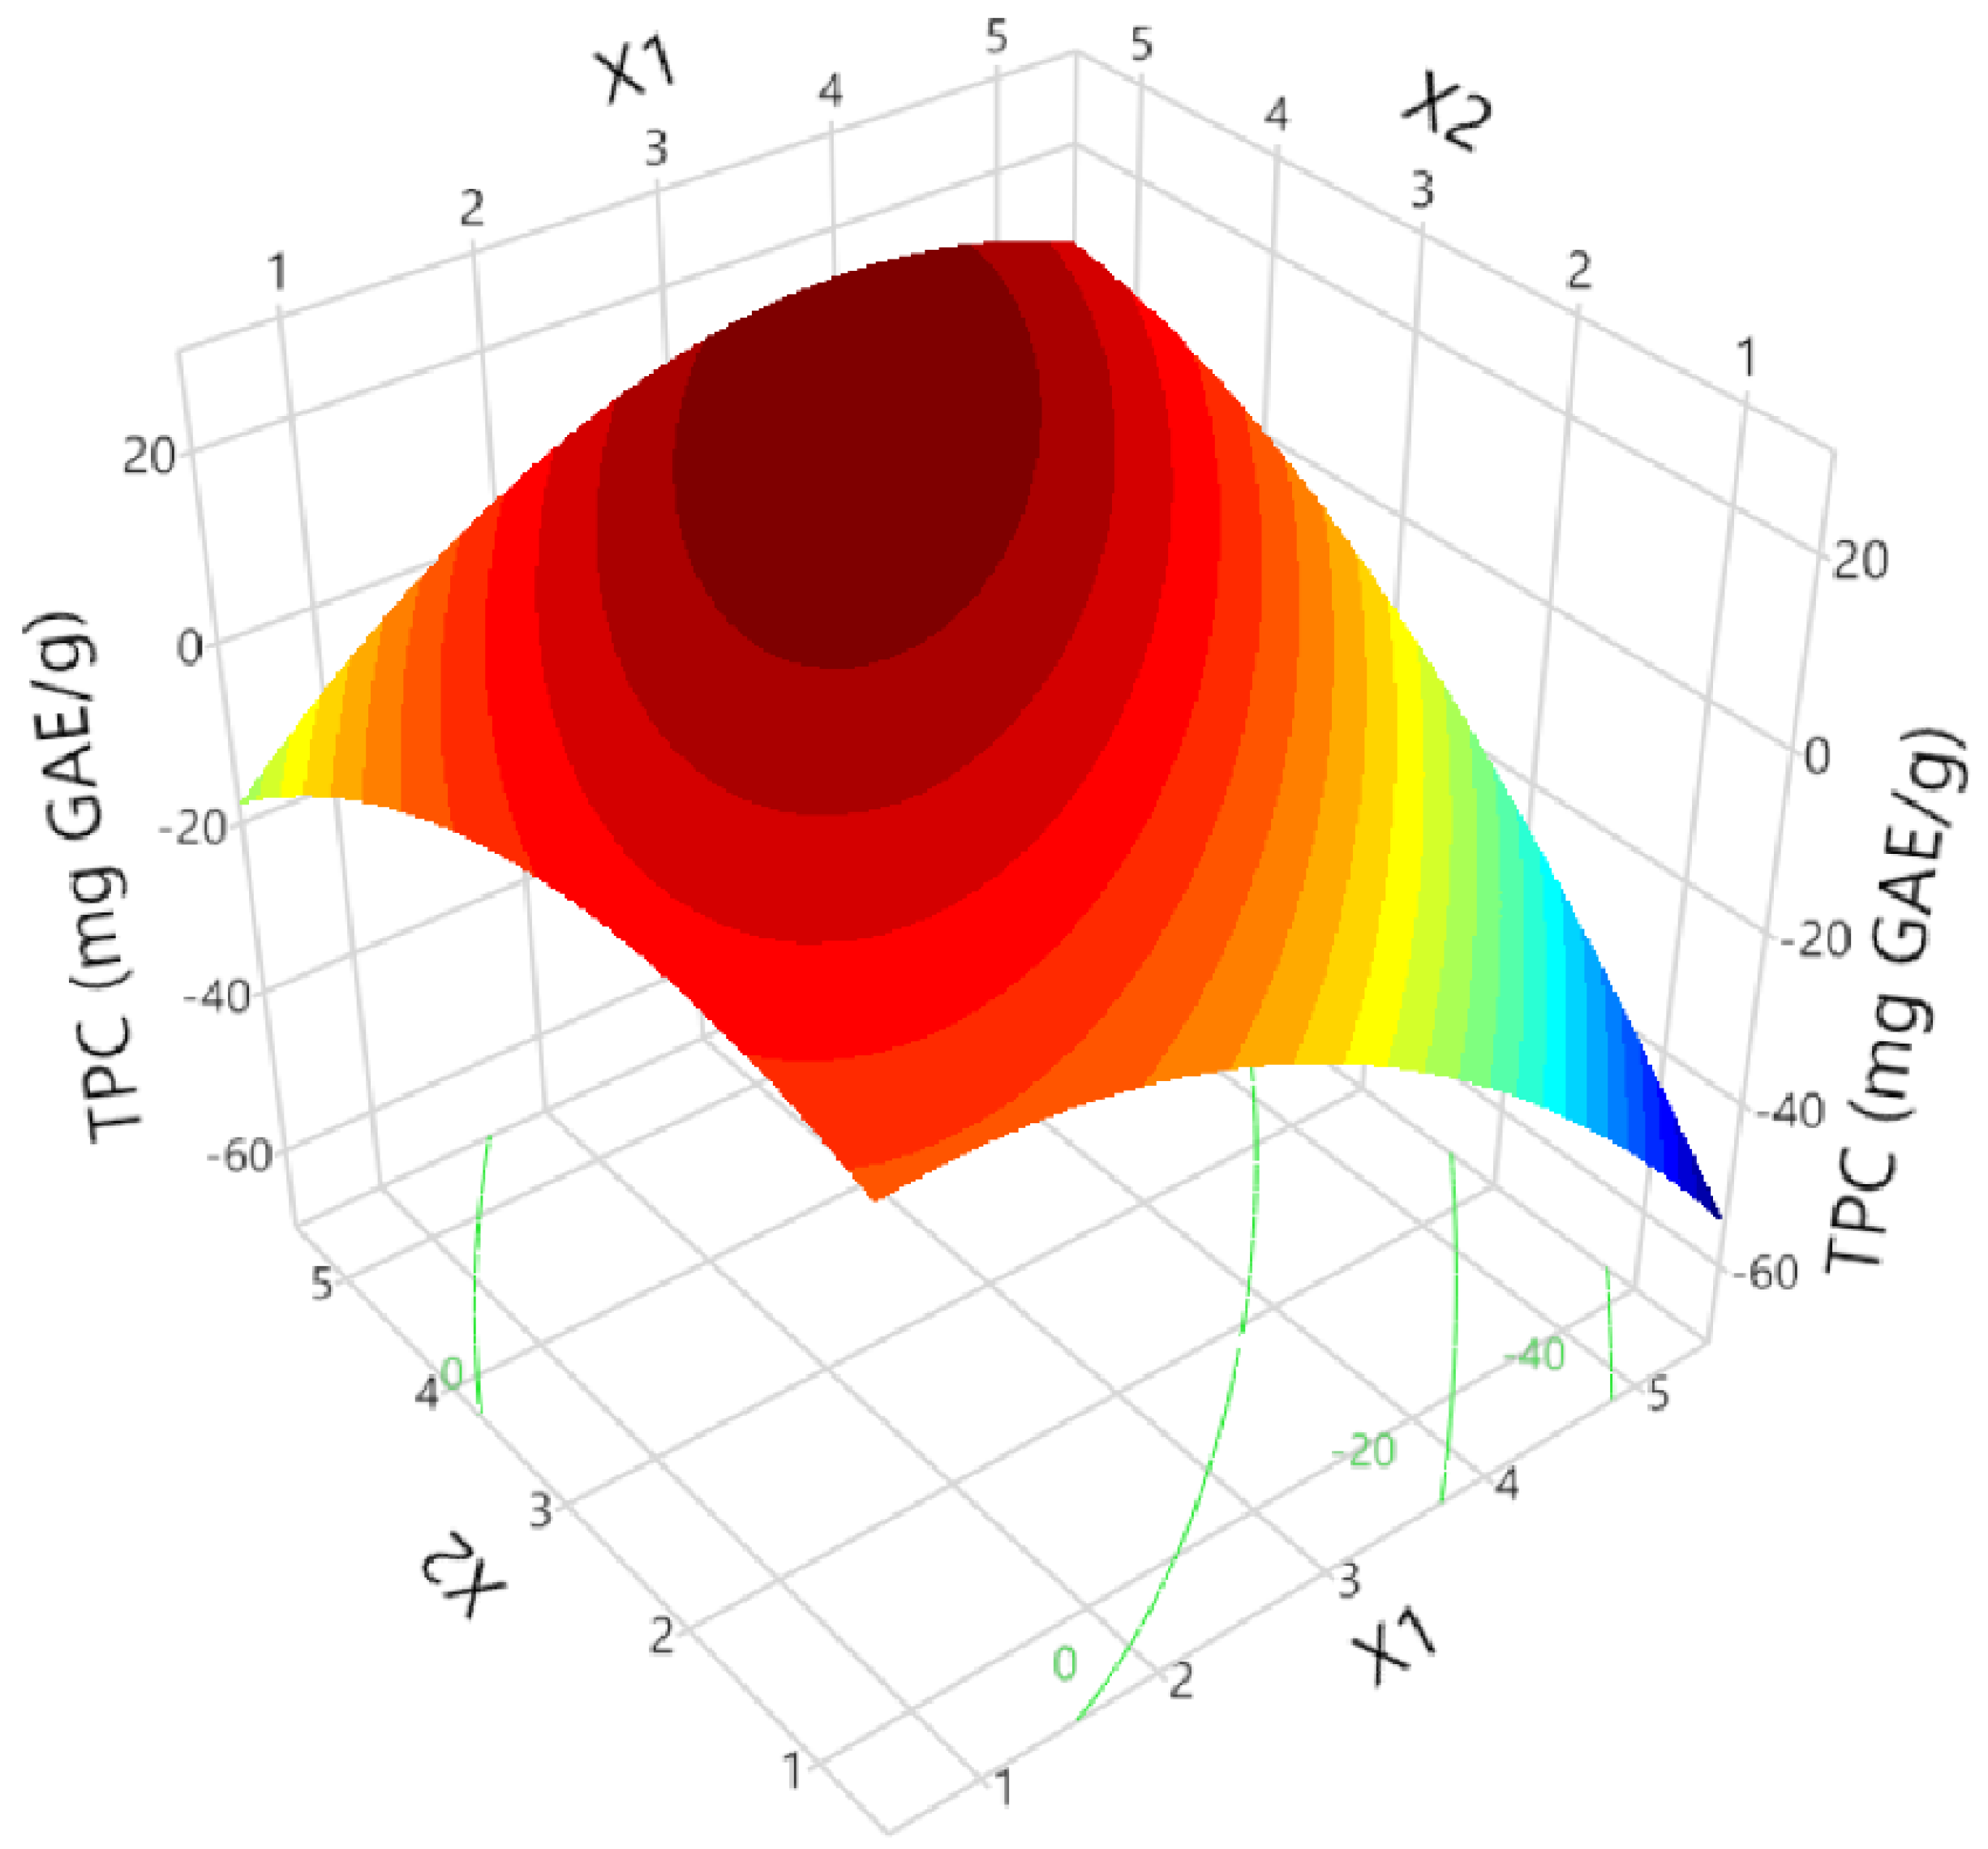
3.1. Determination of the Appropriate Solvent Concentration and Liquid-to-Solid Ratio

The initial aim of this research was to find the optimal solvent concentration and the optimal liquid-to-solid ratio. Various combinations of the two were conducted, which are illustrated in Table 2. The mixtures were then subjected to PEF treatment at an electric field strength of 0.8 kV/cm for 20 min, with a pulse duration of 55 μs and a pulse period of 550 μs. Then, the mixtures were centrifuged at 10,000× g and their TPC values were measured to acquire the optimal results. In Figure 1, a comparison between the observed and predicted response (TPC, mg GAE/g dw) for the optimization of the extraction process of C. sativa is depicted. As shown in plot A, the predicted value has a positive correlation with the actual one, while the p-value is 0.0091 and the R2 has a value of 0.9533, which enhances the validity of this result. As for the desirability function (plot B) for the optimization of the extraction process, it is apparent that there exists a positive correlation between the X1 (solvent concentration) and X2 (liquid-to-solid ratio) parameters with TPC, as an increase in both, particularly X2, results in an increase in TPC. These findings are also supported by the three-dimensional graphs in Figure 2. The desirability function (with a value of 0.9598) revealed that the optimal conditions for the maximum TPC recovery were 50% v/v solvent concentration and a liquid-to-solid ratio of 40.

3.2. Optimization of PEF Conditions

Once the optimal solvent concentration and liquid-to-solid ratios were assessed, the next goal was to optimize the PEF treatment conditions. In Table 3, the independent (electric field strength, X1; pulse duration, X2; pulse period, X3; extraction duration, X4) and the coded variables utilized to optimize the PEF extraction are presented. Table 4 lists the different combinations of X1, X2, X3, and X4 performed during the experimental procedure and the TPC, FRAP, and DPPH values measured, along with the predicted ones. The TPC values ranged from 10.29 to 15.82 mg GAE/g dw, which implies that an electric field strength of 1 kV/cm might be needed to achieve the highest polyphenol recovery possible. The FRAP and DPPH values ranged from 54.38 to 88.82 and from 8.29 to 25.41 μmol AAE/g dw, respectively. According to Table 4, these results indicate that an intermediate electric field strength of 0.8 kV/cm is required to achieve the high antioxidant activity of the extracts.
In Table 5, the influence of the independent variables (X1X4) on the recovery of the polyphenols identified through HPLC-DAD is illustrated. Neochlorogenic acid ranged from 0.01 to 0.04 mg/L, pelargonin from 0.92 to 1.45 mg/L, catechin from 0.04 to 0.30 mg/L, chlorogenic acid had a range of 0.19–0.21 mg/L, eriocitrin 0.11–0.52 mg/L, rutin 0.33–0.62 mg/L, apigenin-7-O-glucoside 0.04–0.64 mg/L, and ursolic acid 1.20–5.90 mg/L. Neochlorogenic acid was found to be present in small quantities, and even undetected in some extraction design points. Its maximum quantity seemed to be achieved when an electric field strength of 0.8 kV/cm was applied, combined with a pulse duration of 55 μs. The same conditions were implied to also maximize the pelargonin, catechin, and ursolic acid extraction. Eriocitrin and apigenin-7-O-glucoside extraction appeared to be enhanced when 0.8 kV/cm and 10 μs pulse duration were applied. In Figure 3, a representative chromatograph of the polyphenols identified and quantified via HPLC-DAD is presented.
In Table 6, the statistical parameters, second-order polynomial equations (models), and coefficients (coefficients > 0.95) found for each model are given. These results indicate that the proposed models fit well. Figures S1–S3 display the plots of the observed response compared to the expected response for each parameter analyzed, as well as the desirability functions. Figures S4–S6 display three-dimensional response plots for TPC, FRAP, and DPPH responses. In Table 7, the maximum predicted responses and the optimal PEF conditions leading to them are presented.

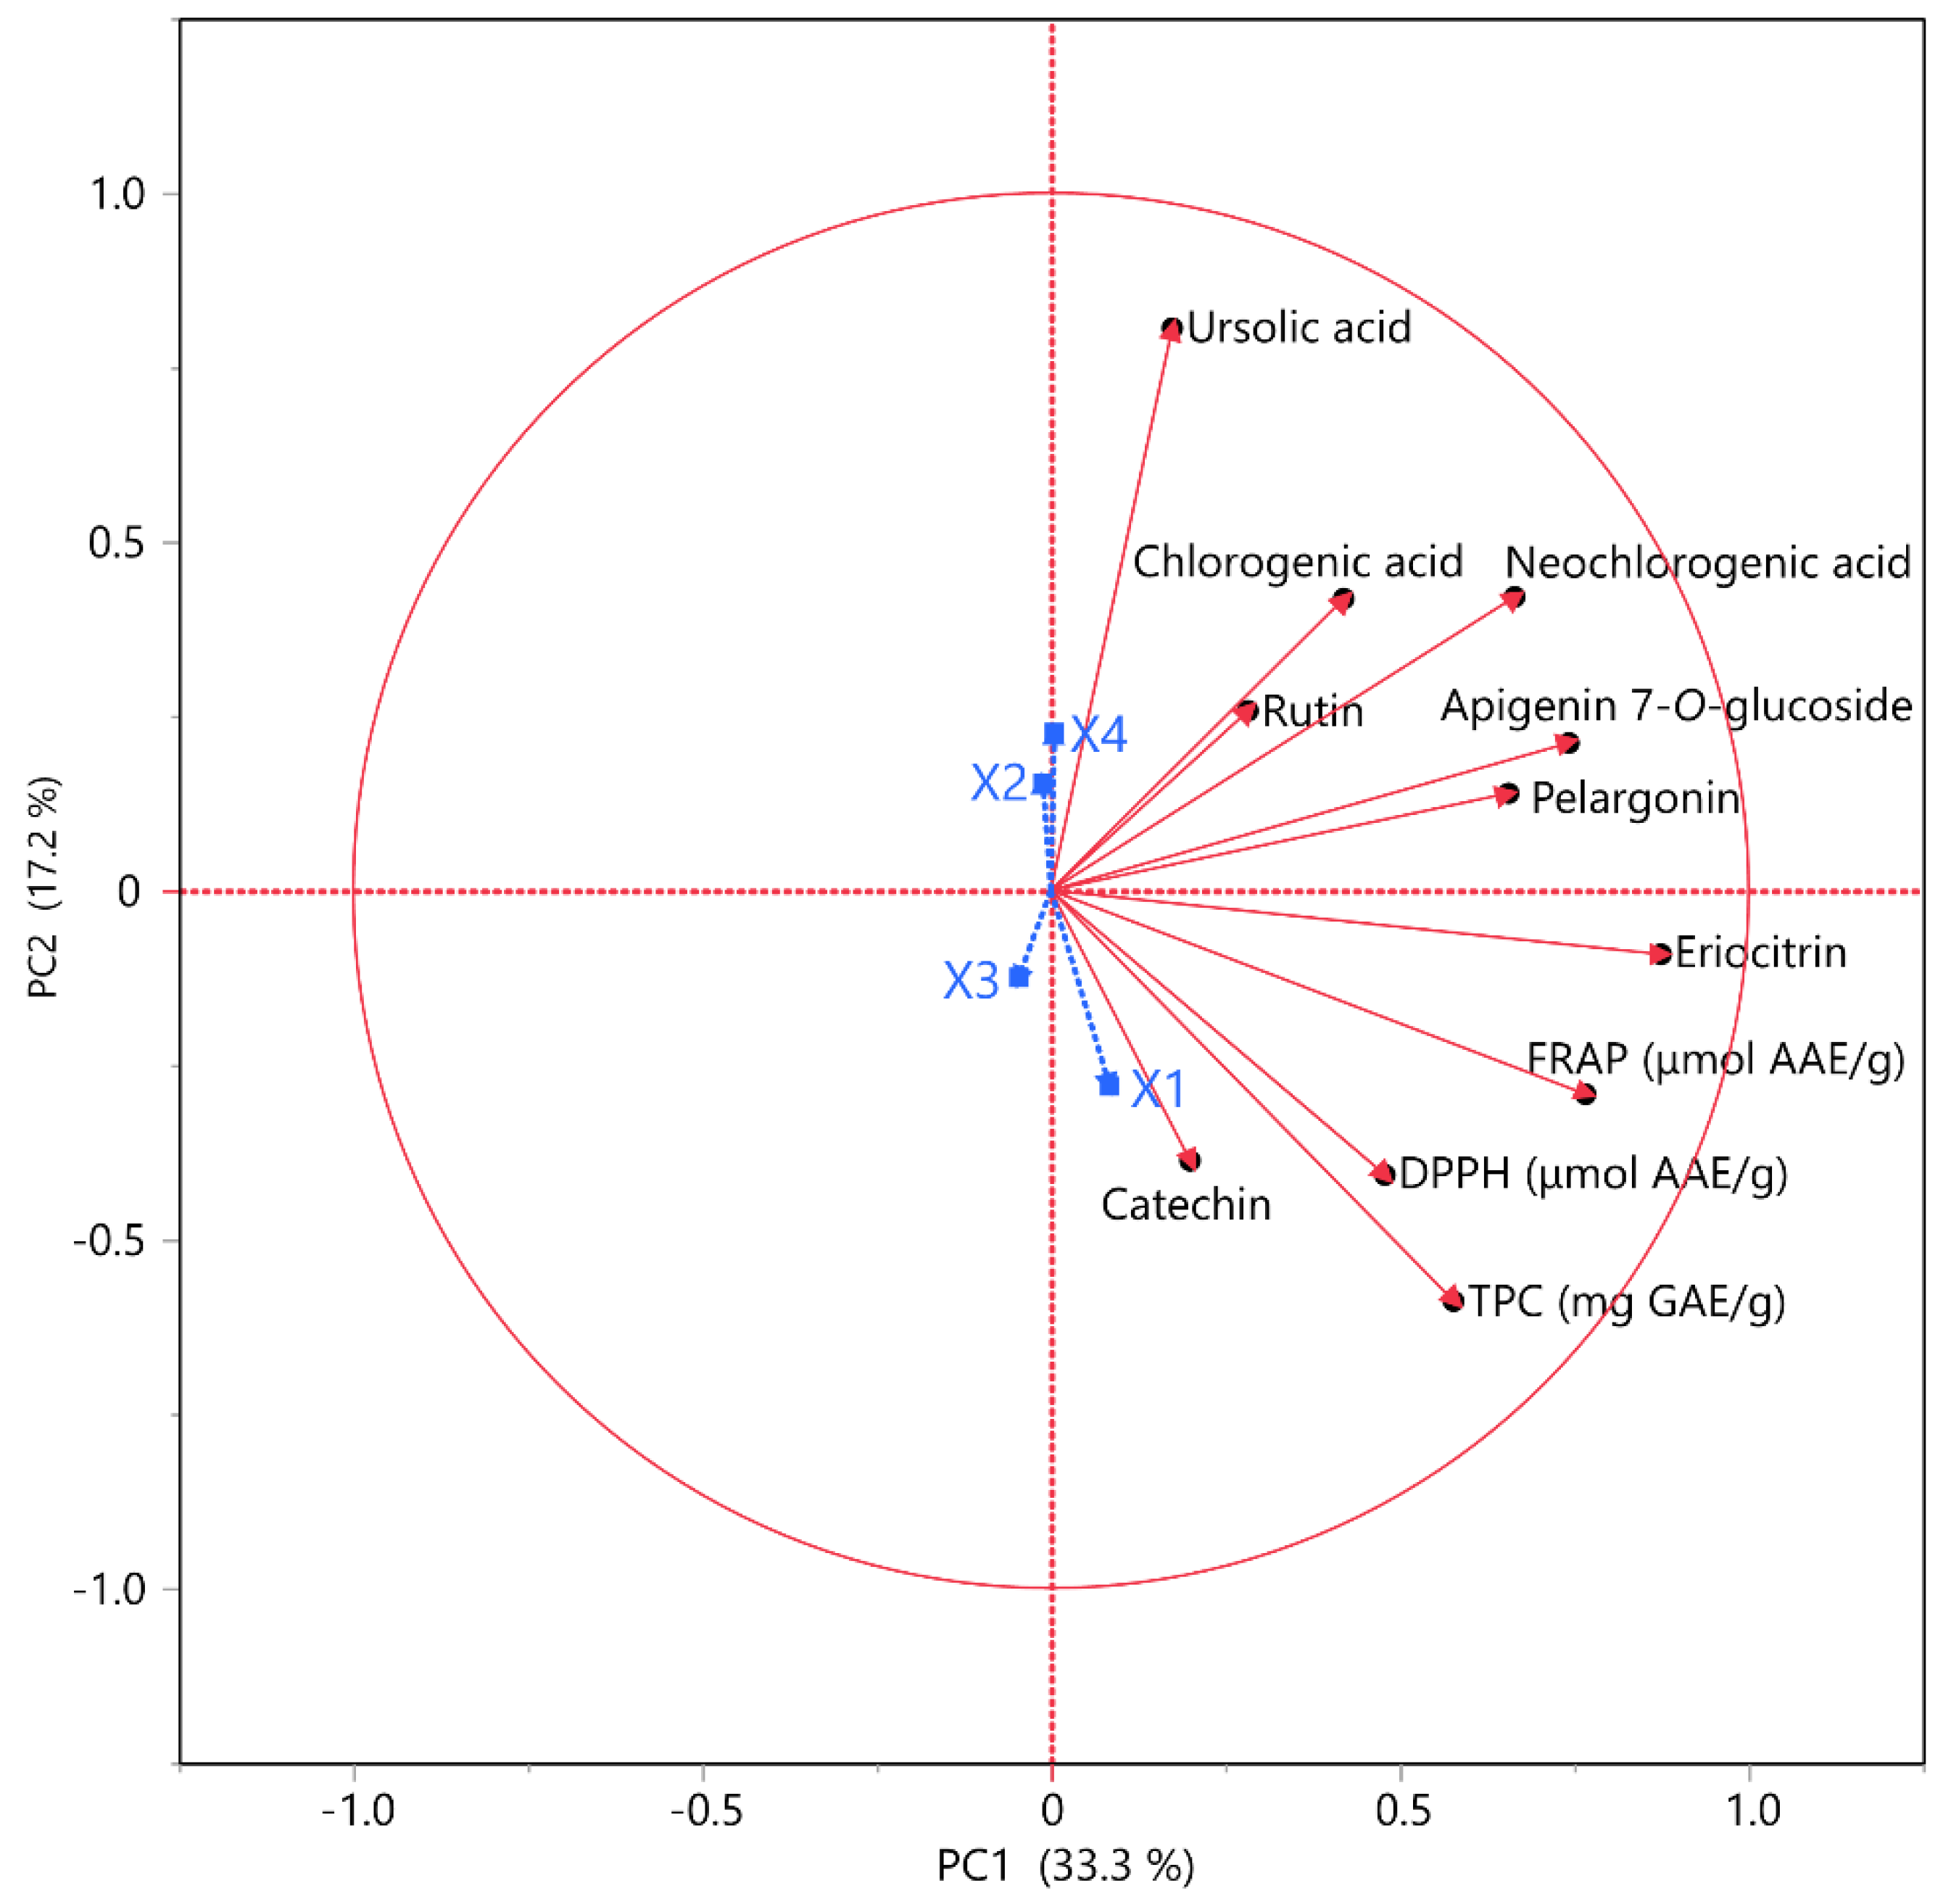
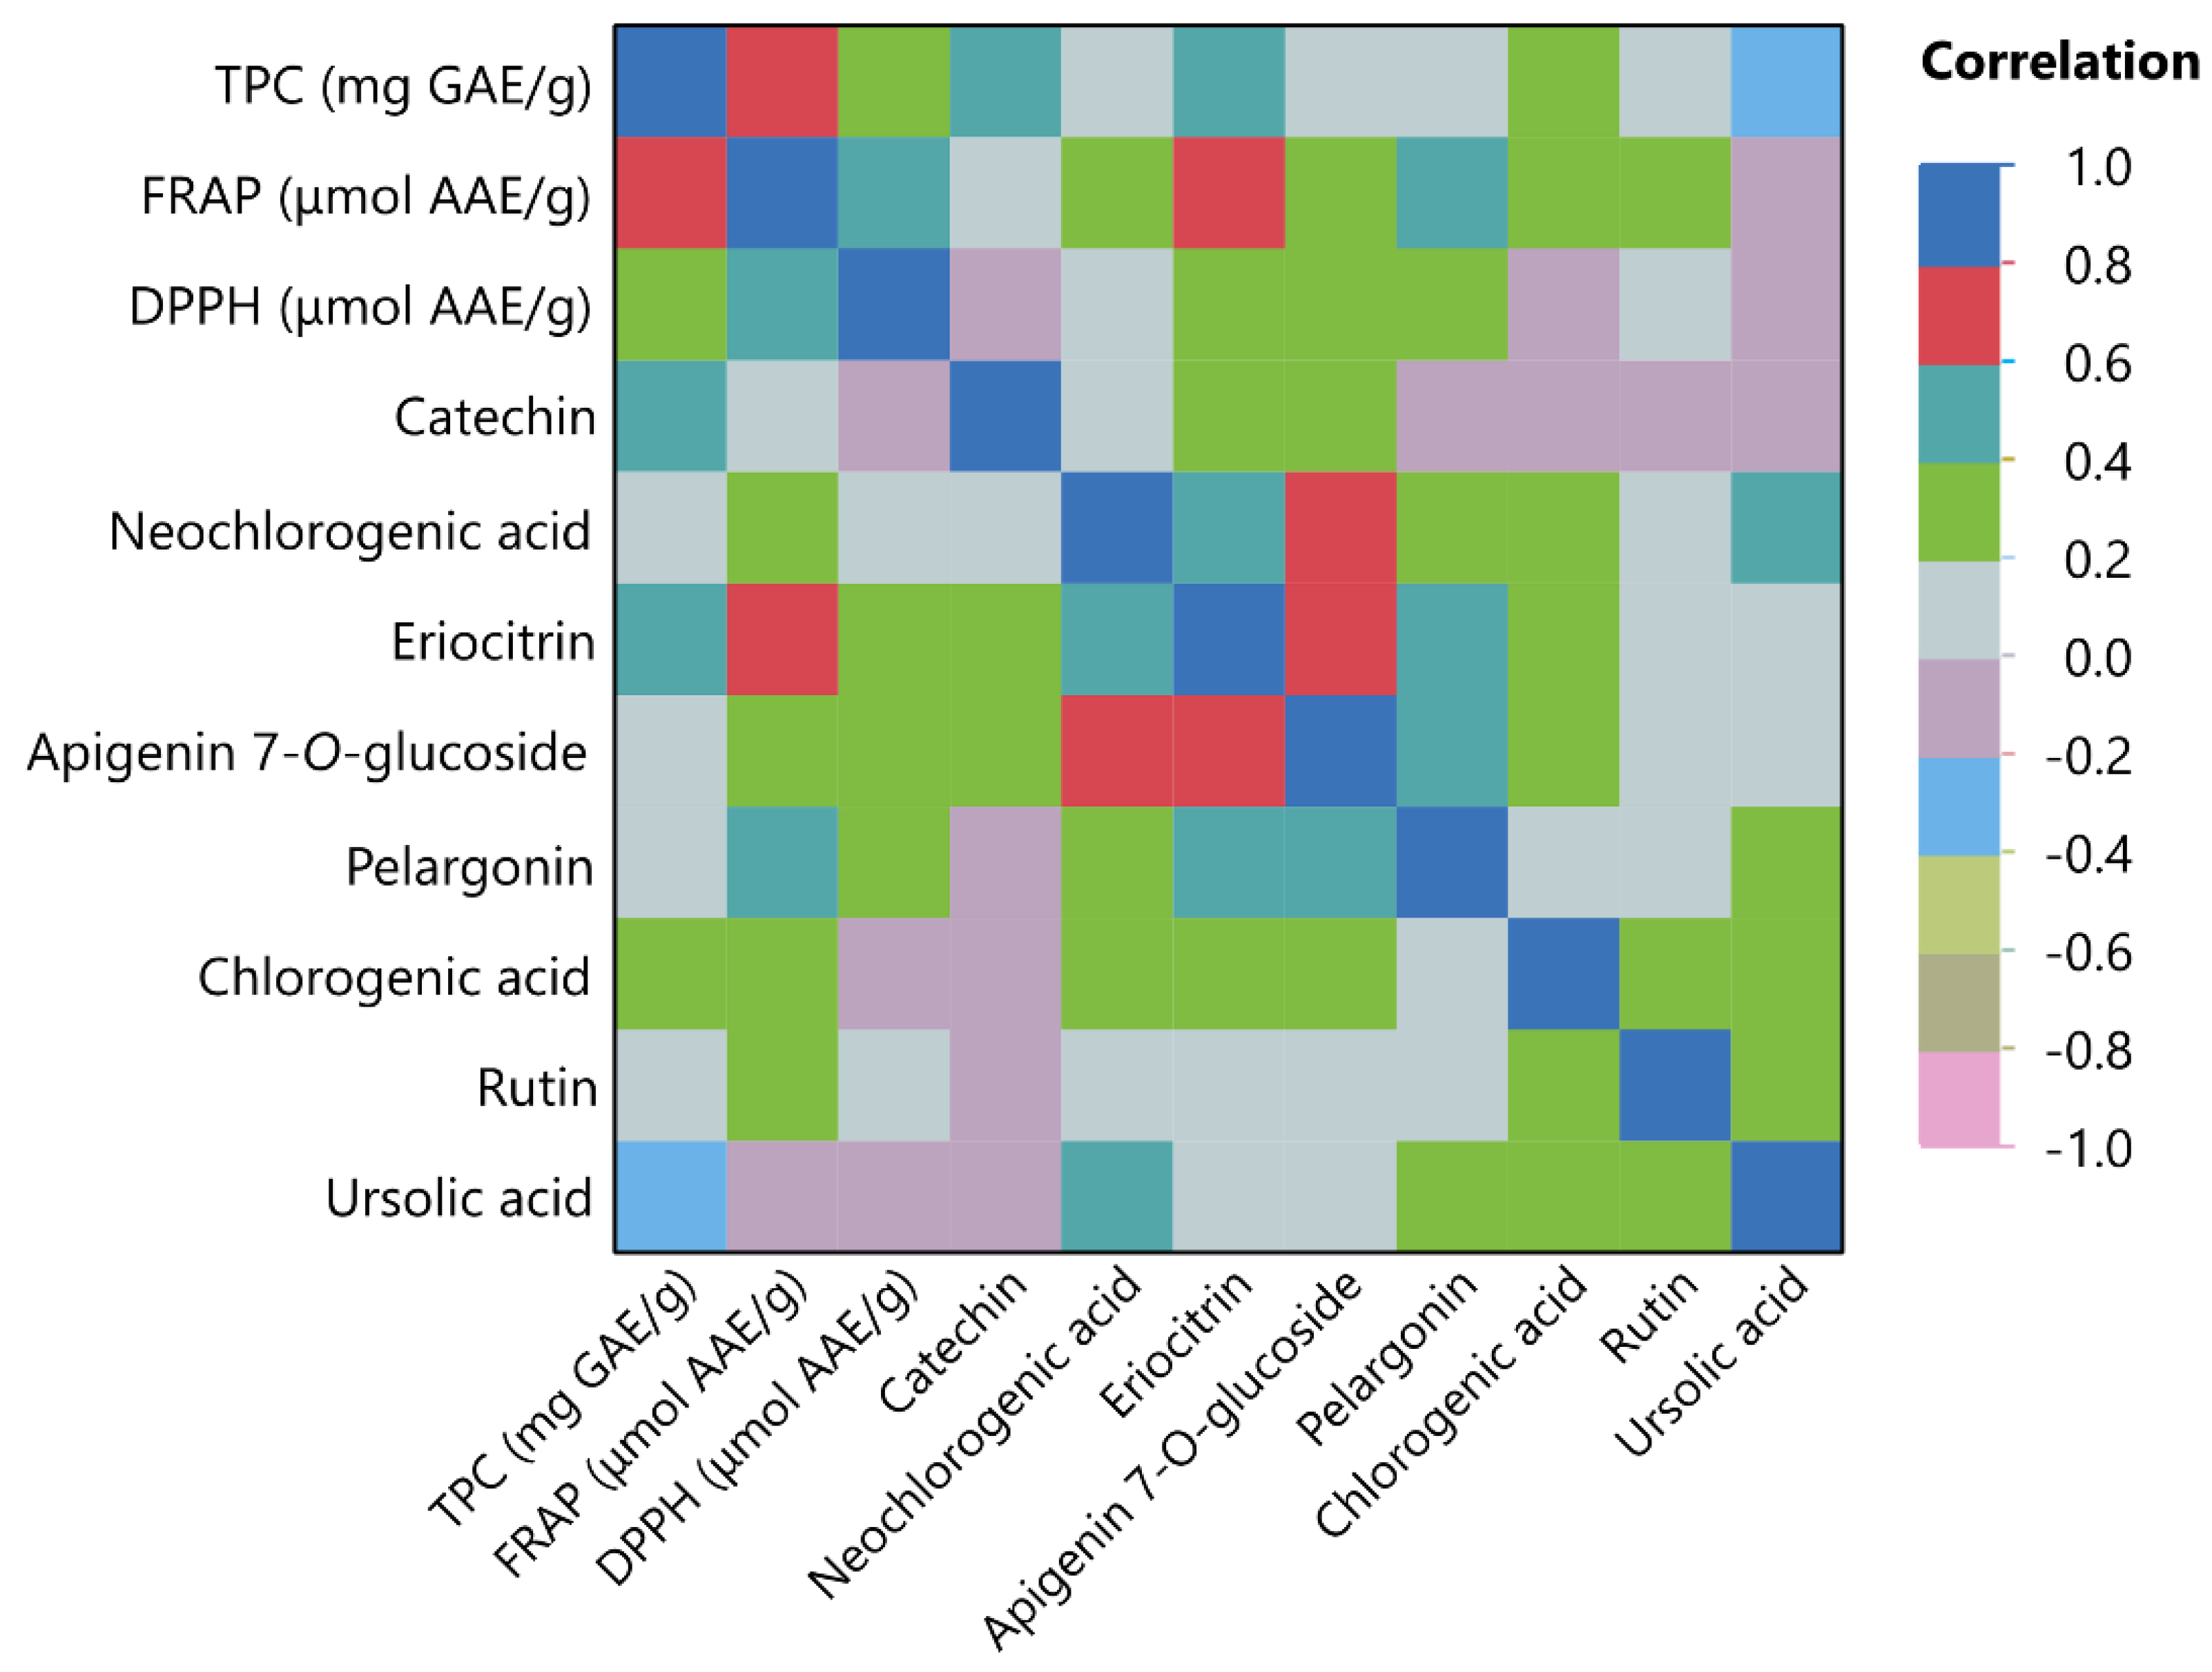
3.3. Principal Component Analysis (PCA) and Multivariate Correlation Analysis (MCA)

Principal component analysis (PCA) was implemented to acquire additional insights from the variables and perform a comprehensive data analysis. The objective of this analysis was to determine if there was a correlation between TPC and antioxidant assays, namely FRAP and DPPH. Additionally, this study aimed to analyze the relationship between the individual polyphenols detected in the extracts and PEF conditions (i.e., electric field strength, pulse duration, pulse period, and extraction time). The two primary components depicted in Figure 4 were selected based on their eigenvalues exceeding 1. The combination of these components contributed to a total variance of 50.50%. The results determined whether the parameters displayed a positive or negative correlation. For instance, the polyphenols identified in the extracts possess a direct relationship with TPC and antioxidant assays, as one would anticipate. Notably, the pulse period exhibits a negative correlation with the polyphenols in C. sativa extracts.
Furthermore, MCA was conducted to provide additional detail on the connection between the variables under investigation. The primary advantage of this approach, in comparison to the preceding one, lies in its ability to quantitatively measure the extent of positive or negative correlation between variables. The color map employed in this context incorporates a color scale that represents correlation values spanning from −1 to 1, as mentioned in the subsequent caption. In Figure 5, the MCA results are depicted. Catechin appears to have a negative correlation (<0.8) with DPPH assay and pelargonin, chlorogenic acid, rutin, and ursolic acid. A possible explanation for this negative correlation may be the solvent composition, which may not be favorable for maximizing the extraction of this particular polyphenol. Catechin is a molecule with high polarity, and therefore employing organic solvents like methanol or ethanol increases the extraction yield. Thus, in the case where a 50% aqueous ethanol solution is utilized, it is logical that the efficiency of catechin extraction is not favored [34]. On the contrary, all the other polyphenols possess a positive correlation (>0.0) with one another. TPC has no correlation (=0.0) with neochlorogenic acid, eriocitrin, luteolin 7-O-glucoside, and rutin. FRAP has a positive correlation (>0.2) with every variable under investigation, except for catechin and ursolic acid, where there is no correlation (=0.0) and a negative correlation (<1.0), respectively. DPPH has a negative correlation (<1.0) with catechin, chlorogenic acid, and ursolic acid, and no correlation at all (=0.0) with neochlorogenic acid and rutin.

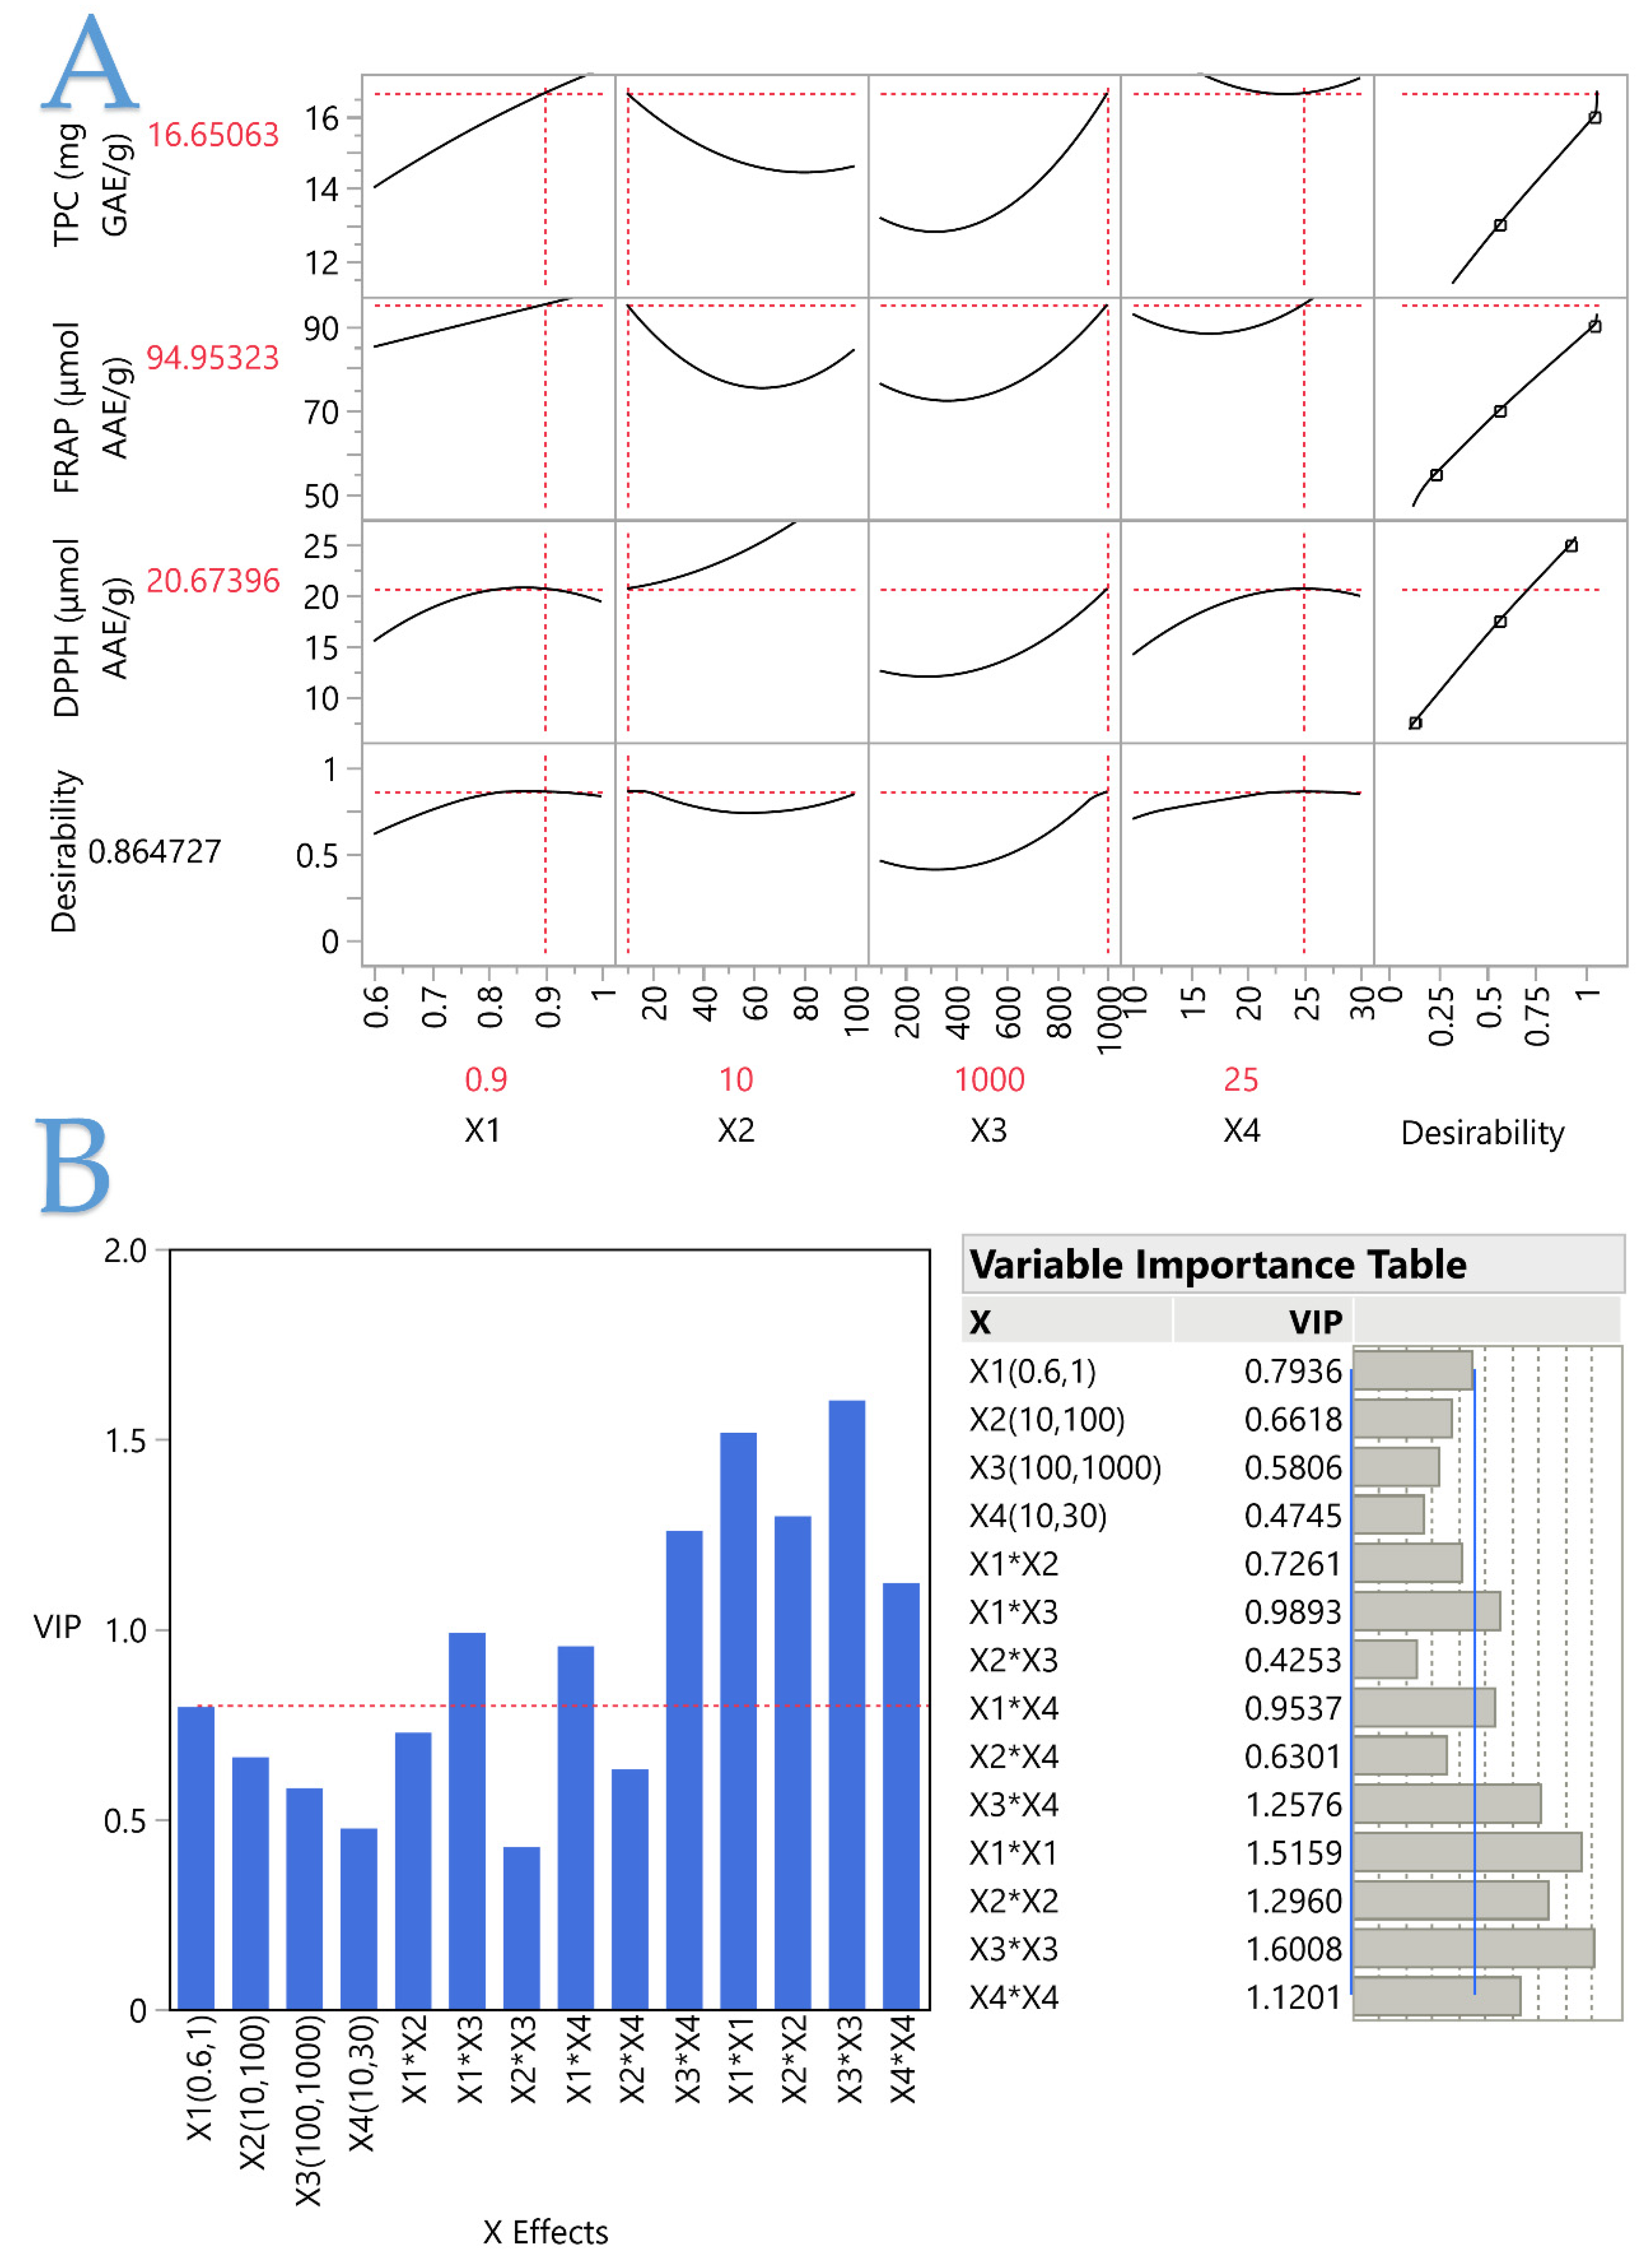
3.4. Partial Least Squares (PLS) Analysis and Variable Importance Plot (VIP) Coefficient

In order to ascertain the most crucial extraction parameters (X1, X2, X3, and X4), a PLS analysis was performed. PLS analysis was used to produce a correlation loading plot which visually represents the extraction conditions of C. sativa. When the significance value of the projection (VIP) factor is equal to or greater than 0.8, it implies that this variable has a more substantial impact. According to the results presented in Figure 6, the variables themselves do not contribute significantly to the extraction of bioactive compounds, but the combinations X1 × X3, X1 × X4, X3 × X4, X1 × X1, X2 × X2, X3 × X3, and X4 × X4 were proven to be the most important factors in the maximization of bioactive compound yield.
The correlation between the values predicted by the PLS model and those acquired through experimental analysis was determined to be 0.9978; furthermore, there were no significant deviations observed, as indicated by the p-value of 0.0299. The optimal conditions of C. sativa extraction through PEF were assessed as 0.9 kV/cm electric field strength, 10 μs pulse duration, 1000 pulse period, and 25 min extraction duration. The experimental and PLS-predicted values for the TPC and antioxidant assays, in which the optimal parameters were identified, are provided in Table 8, while in Table 9 the yields of polyphenolic compounds under the optimal conditions are listed. Moreover, the same assays were conducted on a control extract, which was processed the same way but was not subjected to PEF treatment.
After optimization, there was a ~75% increase in TPC in relation to the control extract, a ~74% increase in FRAP assay, and ~71% in DPPH assay. Furthermore, ursolic acid and neochlorogenic acid exhibited the highest increase in their extraction yields among the polyphenols when compared to the control. It is noteworthy that all the values obtained through PEF treatment exhibit statistically significant differences compared to the control ones, as this implies that PEF favors the isolation of bioactive compounds from C. sativa. This observation can be also supported by the comparison of our results with other studies in the existing literature. More specifically, André et al. [35] assessed the TPC on various C. sativa cultivars with different sowing conditions. They extracted polyphenols via sonication, using a 7:3 methanol:water solvent at a solid-to-liquid ratio of 0.8:1. Their TPC values were ~7 to ~114% lower than the one obtained in our study. Moreover, Izzo et al. [36] also utilized sonication to isolate polyphenols from C. sativa plants, with methanol solvent and a 2:3 solid-to-liquid ratio. Their yield on the leaves of the plant was ~2898% lower than the one presented in our study. Aazza et al. [37] measured the antioxidant activity of C. sativa waste utilizing the FRAP assay, and the value reported was 122.98 μmol AAE/g, slightly higher (~29%) than the one reported in this study. Moreover, Agarwal et al. [38] reported a FRAP value of C. sativa which was ~408% lower than the one reported in our study. Babiker et al. [39] determined some polyphenolic compounds in C. sativa extracts through HPLC. The extracts were prepared in a water rinsing bath, employing ethanol:water 8:2 solvent in a 1:10 solid-to-liquid ratio. The rutin content in their study was ~32% lower than ours, while apigenin 7-O-glucocide was ~42% lower. The most abundant polyphenol identified through HPLC-DAD was ursolic acid. Ursolic acid has also been found in a variety of sources, most notably leaves and flowers [40,41]. Owing to their diverse range of activities and minimal toxicity, they have received significant attention in recent years, inspiring numerous publications. Several advantageous benefits, including antioxidative, antimicrobial, anti-inflammatory, anticancer, anti-hyperlipidemic, analgesic, hepatoprotective, gastroprotective, anti-ulcer, anti-HIV, cardiovascular, antiatherosclerotic, and immunomodulatory properties, have been documented [42,43]. Multiple studies suggest that ursolic acid has the ability to promote muscle growth, decrease fat accumulation, and improve the recovery of the skin protective barrier. As a result, it has been recommended as a potential treatment for skin conditions [44] and could be incorporated into sports supplements [45,46], cosmetics [47], and health products [48].

4. Conclusions

The aim of this work was to establish the optimal conditions for the extraction of bioactive compounds from C. sativa leaves by PEFs. Initially, the proper solvent and liquid-to-solid ratio were investigated and determined to be 50% aqueous ethanol solution and 20:1 v/v, respectively. Then, optimization of the PEF parameters was sought. The maximum bioactive compound yield was obtained under the optimum conditions, which were 0.9 kV/cm electric field strength, 10 µs pulse width, 1000 µs pulse period, and 25 min. More specifically, the polyphenol recovery was 16.79 mg GAE/g dw, while the antioxidant capacity of the extract was measured to be 94.95 μmol AAE/g dw in FRAP assay and 20.67 μmol AAE/g dw in terms of DPPH radical scavenging activity. Ursolic acid was found to be the most abundant polyphenol identified through HPLC-DAD, which possesses various health-improving properties. PEF extracts derived from C. sativa leaves have the potential to provide pharmaceutical and food industries with bioactive compounds of natural origin that enhance health. Further investigation is required to deeply comprehend the utilization of PEFs, which have the potential to yield more effective extracts suitable for enriching foods, medicinal herbal teas, traditional beverages, and even alcoholic beverages.

Supplementary Materials

The following supporting information can be downloaded at: https://www.mdpi.com/article/10.3390/analytica5010006/s1, Figure S1: Plots A and B display the actual response versus the predicted response (Total polyphenol content − TPC, mg GAE/g) for the optimization of C. sativa leaf extracts carried out with hydroethanolic solution, different extraction PEF parameters, and the desirability function. Asterisks and colored values denote statistically significant values, while inset tables include statistics relevant to the evaluation of the resulting model; Figure S2: Plots A and B display the actual response versus the predicted response (FRAP, μmol AAE/g) for the optimization of C. sativa leaf extracts carried out with hydroethanolic solution, different extraction PEF parameters, and the desirability function. Asterisks and colored values denote statistically significant values, while inset tables include statistics relevant to the evaluation of the resulting model; Figure S3: Plots A and B display the actual response versus the predicted response (DPPH, μmol AAE/g) for the optimization of C. sativa leaf extracts carried out with hydroethanolic solution, different extraction PEF parameters, and the desirability function. Asterisks and colored values denote statistically significant values, while inset tables include statistics relevant to the evaluation of the resulting model; Figure S4: The optimal extraction of C. sativa leaf extracts is shown in 3D graphs that show the impact of the process variables considered in the response (Total polyphenol content − TPC, mg GAE/g). Plot (A), covariation of X1 and X2; plot (B), covariation of X1 and X3; plot (C), covariation of X1 and X4; plot (D), covariation of X2 and X3; plot (E), covariation of X2 and X4; plot (F), covariation of X3 and X4; Figure S5: The optimal extraction of C. sativa leaf extracts is shown in 3D graphs that show the impact of the process variables considered in the response (FRAP, μmol AAE/g). Plot (A), covariation of X1 and X2; plot (B), covariation of X1 and X3; plot (C), covariation of X1 and X4; plot (D), covariation of X2 and X3; plot (E), covariation of X2 and X4; plot (F), covariation of X3 and X4; Figure S6: The optimal extraction of C. sativa leaf extracts is shown in 3D graphs that show the impact of the process variables considered in the response (DPPH, μmol AAE/g). Plot (A), covariation of X1 and X2; plot (B), covariation of X1 and X3; plot (C), covariation of X1 and X4; plot (D), covariation of X2 and X3; plot (E), covariation of X2 and X4; plot (F), covariation of X3 and X4.

Author Contributions

Conceptualization, V.A., T.C. and S.I.L.; methodology, V.A. and T.C.; software, V.A.; validation, V.A. and T.C.; formal analysis, D.M., M.M., V.A., E.B. and T.C.; investigation, D.M., M.M., V.A. and T.C.; resources, S.I.L.; data curation, V.A. and T.C.; writing—original draft preparation, D.M. and M.M.; writing—review and editing, D.M., V.A., T.C., M.M., E.B. and S.I.L.; visualization, V.A.; supervision, S.I.L.; project administration, V.A., T.C. and S.I.L.; funding acquisition, S.I.L. All authors have read and agreed to the published version of the manuscript.

Funding

This research received no external funding.

Data Availability Statement

All related data and methods are presented in this paper. Additional inquiries should be addressed to the corresponding author.

Acknowledgments

The authors would like to thank the CBD Extraction Ι.Κ.Ε. (Farsala, Greece) for donating hemp (Cannabis sativa var. Futura 75) leaf material.

Conflicts of Interest

The authors declare no conflict of interest.

References

  1. Ranjha, M.M.A.N.; Kanwal, R.; Shafique, B.; Arshad, R.N.; Irfan, S.; Kieliszek, M.; Kowalczewski, P.Ł.; Irfan, M.; Khalid, M.Z.; Roobab, U.; et al. A Critical Review on Pulsed Electric Field: A Novel Technology for the Extraction of Phytoconstituents. Molecules 2021, 26, 4893. [Google Scholar] [CrossRef]
  2. Mohamad, A.; Shah, N.N.A.K.; Sulaiman, A.; Mohd Adzahan, N.; Aadil, R.M. Impact of the Pulsed Electric Field on Physicochemical Properties, Fatty Acid Profiling, and Metal Migration of Goat Milk. J. Food Process. Preserv. 2020, 44, e14940. [Google Scholar] [CrossRef]
  3. Lakka, A.; Bozinou, E.; Makris, D.P.; Lalas, S.I. Evaluation of Pulsed Electric Field Polyphenol Extraction from Vitis vinifera, Sideritis scardica and Crocus sativus. ChemEngineering 2021, 5, 25. [Google Scholar] [CrossRef]
  4. Bansal, V.; Sharma, A.; Ghanshyam, C.; Singla, M.L.; Kim, K.-H. Influence of Pulsed Electric Field and Heat Treatment on Emblica officinalis Juice Inoculated with Zygosaccharomyces bailii. Food Bioprod. Process. 2015, 95, 146–154. [Google Scholar] [CrossRef]
  5. Chatzimitakos, T.; Athanasiadis, V.; Kalompatsios, D.; Mantiniotou, M.; Bozinou, E.; Lalas, S.I. Pulsed Electric Field Applications for the Extraction of Bioactive Compounds from Food Waste and By-Products: A Critical Review. Biomass 2023, 3, 367–401. [Google Scholar] [CrossRef]
  6. Martí-Quijal, F.J.; Ramon-Mascarell, F.; Pallarés, N.; Ferrer, E.; Berrada, H.; Phimolsiripol, Y.; Barba, F.J. Extraction of Antioxidant Compounds and Pigments from Spirulina (Arthrospira platensis) Assisted by Pulsed Electric Fields and the Binary Mixture of Organic Solvents and Water. Appl. Sci. 2021, 11, 7629. [Google Scholar] [CrossRef]
  7. Tzima, K.; Brunton, N.P.; Lyng, J.G.; Frontuto, D.; Rai, D.K. The Effect of Pulsed Electric Field as a Pre-Treatment Step in Ultrasound Assisted Extraction of Phenolic Compounds from Fresh Rosemary and Thyme by-Products. Innov. Food Sci. Emerg. Technol. 2021, 69, 102644. [Google Scholar] [CrossRef]
  8. Bozinou, E.; Karageorgou, I.; Batra, G.; Dourtoglou, V.G.; Lalas, I.S. Pulsed Electric Field Extraction and Antioxidant Activity Determination of Moringa oleifera Dry Leaves: A Comparative Study with Other Extraction Techniques. Beverages 2019, 5, 8. [Google Scholar] [CrossRef]
  9. Chemat, F.; Rombaut, N.; Meullemiestre, A.; Turk, M.; Perino, S.; Fabiano-Tixier, A.-S.; Abert-Vian, M. Review of Green Food Processing Techniques. Preservation, Transformation, and Extraction. Innov. Food Sci. Emerg. Technol. 2017, 41, 357–377. [Google Scholar] [CrossRef]
  10. Jha, A.K.; Sit, N. Extraction of Bioactive Compounds from Plant Materials Using Combination of Various Novel Methods: A Review. Trends Food Sci. Technol. 2022, 119, 579–591. [Google Scholar] [CrossRef]
  11. Baiano, A. Recovery of Biomolecules from Food Wastes—A Review. Molecules 2014, 19, 14821–14842. [Google Scholar] [CrossRef]
  12. Arshad, R.N.; Abdul-Malek, Z.; Roobab, U.; Qureshi, M.I.; Khan, N.; Ahmad, M.H.; Liu, Z.-W.; Aadil, R.M. Effective Valorization of Food Wastes and By-Products through Pulsed Electric Field: A Systematic Review. J. Food Process Eng. 2021, 44, e13629. [Google Scholar] [CrossRef]
  13. Kempkes, M.A. Industrial Pulsed Electric Field Systems. In Handbook of Electroporation; Miklavcic, D., Ed.; Springer International Publishing: Cham, Switzerland, 2017; pp. 1–21. ISBN 978-3-319-26779-1. [Google Scholar]
  14. Sarraf, M.; Beig-babaei, A.; Naji-Tabasi, S. Optimizing Extraction of Berberine and Antioxidant Compounds from Barberry by Maceration and Pulsed Electric Field-Assisted Methods. JBR 2021, 11, 133–149. [Google Scholar] [CrossRef]
  15. Ziagova, M.G.; Mavromatidou, C.; Samiotis, G.; Amanatidou, E. Total Phenolic Content and Antioxidant Capacity of Greek Medicinal and Aromatic Plant Extracts Using Pulsed Electric Field Followed by Ultrasounds Extraction Process. Food Process. Preserv. 2022, 46, e16639. [Google Scholar] [CrossRef]
  16. Mahalleh, A.A.; Sharayei, P.; Mortazavi, S.A.; Azarpazhooh, E.; Niazmand, R. Optimization of the Pulsed Electric Field -Assisted Extraction of Functional Compounds from Nepeta binaludensis. Agric. Eng. Int. CIGR J. 2019, 21, 184–194. [Google Scholar]
  17. Sadasivam, P.; Varadarajan, G.; Sundararajan, R. Effect of Pulsed Electric Field on Alkaloids of Vinca rosea Root. Arch. Diabetes Endocr. Syst. 2018, 1, 4–8. [Google Scholar] [CrossRef]
  18. Barba, F.J.; Parniakov, O.; Pereira, S.A.; Wiktor, A.; Grimi, N.; Boussetta, N.; Saraiva, J.A.; Raso, J.; Martin-Belloso, O.; Witrowa-Rajchert, D.; et al. Current Applications and New Opportunities for the Use of Pulsed Electric Fields in Food Science and Industry. Food Res. Int. 2015, 77, 773–798. [Google Scholar] [CrossRef]
  19. Poojary, M.M.; Lund, M.N.; Barba, F.J. Pulsed Elextric Field (PEF) Is an Efficient Technology for Food Additives and Nutraceuticals Development. In Pulsed Electric Fields to Obtain Healthier and Sustainable Food for Tomorrow; Academic Press: Cambridge, MA, USA, 2020; pp. 65–99. ISBN 978-0-12-817264-3. [Google Scholar]
  20. Russo, E.B.; Jiang, H.-E.; Li, X.; Sutton, A.; Carboni, A.; del Bianco, F.; Mandolino, G.; Potter, D.J.; Zhao, Y.-X.; Bera, S.; et al. History of Cannabis and Its Preparations in Saga, Science, and Sobriquet. Chem. Biodivers. 2007, 4, 1614–1648. [Google Scholar] [CrossRef]
  21. Bonini, S.A.; Premoli, M.; Tambaro, S.; Kumar, A.; Maccarinelli, G.; Memo, M.; Mastinu, A. Cannabis sativa: A Comprehensive Ethnopharmacological Review of a Medicinal Plant with a Long History. J. Ethnopharmacol. 2018, 227, 300–315. [Google Scholar] [CrossRef] [PubMed]
  22. Russo, E.B.; Jiang, H.-E.; Li, X.; Sutton, A.; Carboni, A.; del Bianco, F.; Mandolino, G.; Potter, D.J.; Zhao, Y.-X.; Bera, S.; et al. Phytochemical and Genetic Analyses of Ancient Cannabis from Central Asia. J. Exp. Bot. 2008, 59, 4171–4182. [Google Scholar] [CrossRef]
  23. Andre, C.M.; Hausman, J.-F.; Guerriero, G. Cannabis sativa: The Plant of the Thousand and One Molecules. Front. Plant Sci. 2016, 7, 19. [Google Scholar] [CrossRef]
  24. Bernstein, N.; Gorelick, J.; Koch, S. Interplay between Chemistry and Morphology in Medical Cannabis (Cannabis sativa L.). Ind. Crops Prod. 2019, 129, 185–194. [Google Scholar] [CrossRef]
  25. Malabadi, R.B.; Kolkar, K.P.; Chalannavar, R.K. Δ9-Tetrahydrocannabinol (THC): The Major Psychoactive Component Is of Botanical Origin. Int. J. Innov. Sci. Res. Rev. 2023, 5, 4177–4184. [Google Scholar]
  26. Mechoulam, R.; Peters, M.; Murillo-Rodriguez, E.; Hanuš, L.O. Cannabidiol—Recent Advances. Chem. Biodivers. 2007, 4, 1678–1692. [Google Scholar] [CrossRef] [PubMed]
  27. Liu, X.; Xue, F.; Adhikari, B. Production of Hemp Protein Isolate-Polyphenol Conjugates through Ultrasound and Alkali Treatment Methods and Their Characterization. Future Foods 2023, 7, 100210. [Google Scholar] [CrossRef]
  28. Pannico, A.; Kyriacou, M.C.; El-Nakhel, C.; Graziani, G.; Carillo, P.; Corrado, G.; Ritieni, A.; Rouphael, Y.; De Pascale, S. Hemp Microgreens as an Innovative Functional Food: Variation in the Organic Acids, Amino Acids, Polyphenols, and Cannabinoids Composition of Six Hemp Cultivars. Food Res. Int. 2022, 161, 111863. [Google Scholar] [CrossRef] [PubMed]
  29. Mourtzinos, I.; Menexis, N.; Iakovidis, D.; Makris, D.P.; Goula, A. A Green Extraction Process to Recover Polyphenols from Byproducts of Hemp Oil Processing. Recycling 2018, 3, 15. [Google Scholar] [CrossRef]
  30. Kubilienė, A.; Marksa, M.; Baranauskaitė, J.; Ragažinskienė, O.; Ivanauskas, L. Comparative Evaluation of Antioxidant Activity of Cannabis sativa L. Using FRAP and CUPRAP Assays. Chemija 2020, 31, 156–161. [Google Scholar] [CrossRef]
  31. Smeriglio, A.; Galati, E.M.; Monforte, M.T.; Lanuzza, F.; D’Angelo, V.; Circosta, C. Polyphenolic Compounds and Antioxidant Activity of Cold-Pressed Seed Oil from Finola Cultivar of Cannabis sativa L. Phytother. Res. 2016, 30, 1298–1307. [Google Scholar] [CrossRef] [PubMed]
  32. Chatzimitakos, T.; Athanasiadis, V.; Makrygiannis, I.; Kalompatsios, D.; Bozinou, E.; Lalas, S.I. An Investigation into Crithmum maritimum L. Leaves as a Source of Antioxidant Polyphenols. Compounds 2023, 3, 532–551. [Google Scholar] [CrossRef]
  33. Shehata, E.; Grigorakis, S.; Loupassaki, S.; Makris, D.P. Extraction Optimisation Using Water/Glycerol for the Efficient Recovery of Polyphenolic Antioxidants from Two Artemisia Species. Sep. Purif. Technol. 2015, 149, 462–469. [Google Scholar] [CrossRef]
  34. Tsai, Y.-J.; Chen, B.-H. Preparation of Catechin Extracts and Nanoemulsions from Green Tea Leaf Waste and Their Inhibition Effect on Prostate Cancer Cell PC-3. Int. J. Nanomed. 2016, 11, 1907–1926. [Google Scholar] [CrossRef]
  35. André, A.; Leupin, M.; Kneubühl, M.; Pedan, V.; Chetschik, I. Evolution of the Polyphenol and Terpene Content, Antioxidant Activity and Plant Morphology of Eight Different Fiber-Type Cultivars of Cannabis sativa L. Cultivated at Three Sowing Densities. Plants 2020, 9, 1740. [Google Scholar] [CrossRef] [PubMed]
  36. Izzo, L.; Castaldo, L.; Narváez, A.; Graziani, G.; Gaspari, A.; Rodríguez-Carrasco, Y.; Ritieni, A. Analysis of Phenolic Compounds in Commercial Cannabis sativa L. Inflorescences Using UHPLC-Q-Orbitrap HRMS. Molecules 2020, 25, 631. [Google Scholar] [CrossRef] [PubMed]
  37. Aazza, S. Application of Multivariate Optimization for Phenolic Compounds and Antioxidants Extraction from Moroccan Cannabis sativa Waste. J. Chem. 2021, 2021, e9738656. [Google Scholar] [CrossRef]
  38. Agarwal, C.; Máthé, K.; Hofmann, T.; Csóka, L. Ultrasound-Assisted Extraction of Cannabinoids from Cannabis sativa L. Optimized by Response Surface Methodology. J. Food Sci. 2018, 83, 700–710. [Google Scholar] [CrossRef] [PubMed]
  39. Babiker, E.E.; Uslu, N.; Al Juhaimi, F.; Mohamed Ahmed, I.A.; Ghafoor, K.; Özcan, M.M.; Almusallam, I.A. Effect of Roasting on Antioxidative Properties, Polyphenol Profile and Fatty Acids Composition of Hemp (Cannabis sativa L.) Seeds. LWT 2021, 139, 110537. [Google Scholar] [CrossRef]
  40. Han, S.K.; Kim, Y.G.; Kang, H.C.; Huh, J.R.; Kim, J.Y.; Baek, N.-I.; Lee, D.-K.; Lee, D.-G. Oleanolic Acid from Fragaria ananassa Calyx Leads to Inhibition of α-MSH-Induced Melanogenesis in B16-F10 Melanoma Cells. J. Korean Soc. Appl. Biol. Chem. 2014, 57, 735–742. [Google Scholar] [CrossRef]
  41. Kowalski, R. Studies of Selected Plant Raw Materials as Alternative Sources of Triterpenes of Oleanolic and Ursolic Acid Types. J. Agric. Food Chem. 2007, 55, 656–662. [Google Scholar] [CrossRef]
  42. Kashyap, D.; Tuli, H.S.; Sharma, A.K. Ursolic Acid (UA): A Metabolite with Promising Therapeutic Potential. Life Sci. 2016, 146, 201–213. [Google Scholar] [CrossRef]
  43. Wójciak-Kosior, M.; Sowa, I.; Kocjan, R.; Nowak, R. Effect of Different Extraction Techniques on Quantification of Oleanolic and Ursolic Acid in Lamii Albi Flos. Ind. Crops Prod. 2013, 44, 373–377. [Google Scholar] [CrossRef]
  44. Kunkel, S.D.; Elmore, C.J.; Bongers, K.S.; Ebert, S.M.; Fox, D.K.; Dyle, M.C.; Bullard, S.A.; Adams, C.M. Ursolic Acid Increases Skeletal Muscle and Brown Fat and Decreases Diet-Induced Obesity, Glucose Intolerance and Fatty Liver Disease. PLoS ONE 2012, 7, e39332. [Google Scholar] [CrossRef]
  45. Close, G.L.; Hamilton, D.L.; Philp, A.; Burke, L.M.; Morton, J.P. New Strategies in Sport Nutrition to Increase Exercise Performance. Free Radic. Biol. Med. 2016, 98, 144–158. [Google Scholar] [CrossRef] [PubMed]
  46. Deane, C.S.; Wilkinson, D.J.; Phillips, B.E.; Smith, K.; Etheridge, T.; Atherton, P.J. “Nutraceuticals” in Relation to Human Skeletal Muscle and Exercise. Am. J. Physiol.-Endocrinol. Metab. 2017, 312, E282–E299. [Google Scholar] [CrossRef] [PubMed]
  47. de Almeida, M.M.; Bou-Chacra, N.A.; de Castro Lima, C.R.R.; do Rosário Matos, J.; Filho, E.M.; Mercuri, L.P.; Baby, A.R.; Kaneko, T.M.; Velasco, M.V.R. Characterization and Evaluation of Free and Nanostructured Ursolic Acid Incorporated in Cosmetic Formulation Using Thermal Analysis. J. Therm. Anal. Calorim. 2014, 115, 2401–2406. [Google Scholar] [CrossRef]
  48. Navina, R.; Lee, Y.G.; Kim, S.M. Molecular Biological Roles of Ursolic Acid in the Treatment of Human Diseases. Curr. Bioact. Compd. 2017, 13, 177–185. [Google Scholar] [CrossRef]
Figure 1. (Plot A) displays the actual versus the predicted response (TPC, mg GAE/g dw) for the optimization of extraction of C. sativa leaves performed with hydroethanolic solutions. The inset tables provide statistics related to the evaluation of the resulting model. Values with color and asterisk are statistically significant. The desirability function for the optimization of extraction of C. sativa performed with hydroethanolic solutions is displayed in (Plot B).
Analytica 05 00006 g001
Figure 2. Three-dimensional graph depicting the covariation of X1 (C %, v/v) and X2 (R, mL/g) and the effect of the process variables considered on the response (TPC, mg GAE/g dw) for the optimization of extraction of C. sativa performed in hydroethanolic solutions.
Analytica 05 00006 g002
Figure 3. Representative HPLC chromatogram at 280, 320, and 360 nm of C. sativa leaf extract, demonstrating polyphenolic compounds that were identified. 1: neochlorogenic acid; 2: pelargonin; 3: catechin; 4: chlorogenic acid; 5: eriocitrin; 6: rutin; 7: apigenin 7-O-glucoside; 8: ursolic acid.
Analytica 05 00006 g003
Figure 4. Principal component analysis (PCA) for the measured variables. Each X variable is presented with a blue color.
Analytica 05 00006 g004
Figure 5. Multivariate correlation analysis of measured variables.
Analytica 05 00006 g005
Figure 6. For the optimization of C. sativa leaf extracts, (plot A) shows the partial least squares (PLS) prediction profiler of each variable and desirability function with extrapolation control, while (Plot B) shows the Variable Importance Plot (VIP) option graph with the VIP values for each X variable. The VIP scores are displayed in the Variable Importance Table.
Analytica 05 00006 g006
Table 1. Actual and coded values of the independent variables that were used to optimize the extraction process using the screening design.
Independent VariablesCode UnitsCoded Variable Level
12345
Solvent concentration (C %, v/v)X10255075100
Liquid-to-solid ratio (R, mL/g)X21020304050
Table 2. Experimental findings for the two independent variables under investigation and the dependent variable’s response to total polyphenol content (TPC).
Design PointIndependent VariablesResponse TPC (mg GAE/g)
X1 (C %, v/v)X2 (R, mL/g)ActualPredicted
11 (0)2 (20)9.458.45
22 (25)2 (20)10.3310.17
33 (50)3 (30)12.8513.16
44 (75)4 (40)14.0013.49
55 (100)4 (40)6.196.04
61 (0)1 (10)2.954.54
72 (25)1 (10)4.202.96
83 (50)5 (50)13.8814.21
94 (75)3 (30)6.617.67
105 (100)5 (50)11.3911.16
Table 3. The actual and coded levels of the independent variables were used to optimize the process of PEF extraction using the Box–Behnken design.
Independent VariablesCode UnitsCoded Variable Level
−101
Electric field strength (E, kV/cm)X10.60.81.0
Pulse duration (tpulse, μs)X21055100
Pulse period (T, μs)X31005501000
Extraction duration (t, min)X4102030
Table 4. Experimental findings for the four independent variables under investigation and the dependent variable’s responses.
Design PointIndependent VariablesResponses
TPC
(mg GAE/g dw)
FRAP
(μmol AAE/g)
DPPH
(μmol AAE/g)
X1 (E, kV/cm)X2 (tpulse, μs)X3 (T, μs)X4 (t, min)ActualPredictedActualPredictedActualPredicted
1−1 (0.6)−1 (10)0 (550)0 (20)11.5811.6069.4767.7816.4516.89
2−1 (0.6)1 (100)0 (550)0 (20)11.9011.5269.1768.3111.2911.58
31 (1.0)−1 (10)0 (550)0 (20)13.3914.1175.7174.2611.4811.40
41 (1.0)1 (100)0 (550)0 (20)11.7212.0467.1066.4920.1219.89
50 (0.8)0 (55)−1 (100)−1 (10)14.5714.8188.8286.6920.5520.78
60 (0.8)0 (55)−1 (100)1 (30)12.4812.7669.3766.4611.4511.04
70 (0.8)0 (55)1 (1000)−1 (10)14.6114.6769.3869.9811.1211.74
80 (0.8)0 (55)1 (1000)1 (30)14.9815.0884.9184.7322.8722.85
9−1 (0.6)0 (55)0 (550)−1 (10)10.2910.5567.5867.6010.6210.51
10−1 (0.6)0 (55)0 (550)1 (30)12.4812.8259.8960.878.298.30
111 (1.0)0 (55)0 (550)−1 (10)15.8215.1665.8165.9410.639.03
121 (1.0)0 (55)0 (550)1 (30)11.8311.2466.0967.1914.0812.61
130 (0.8)−1 (10)−1 (100)0 (20)13.7613.9075.0378.8521.4821.17
140 (0.8)−1 (10)1 (1000)0 (20)15.5915.5887.5386.3321.4720.09
150 (0.8)1 (100)−1 (100)0 (20)13.7313.4179.6281.9320.5020.30
160 (0.8)1 (100)1 (1000)0 (20)14.3813.9178.7276.0125.4124.14
17−1 (0.6)0 (55)−1 (100)0 (20)13.2512.9668.0467.6719.7219.07
18−1 (0.6)0 (55)1 (1000)0 (20)11.6711.7161.7163.6312.4712.50
191 (1.0)0 (55)−1 (100)0 (20)12.1912.1365.9065.1711.1812.53
201 (1.0)0 (55)1 (1000)0 (20)15.2915.5669.2270.7819.8321.86
210 (0.8)−1 (10)0 (550)−1 (10)15.0314.6584.0284.3716.8717.28
220 (0.8)−1 (10)0 (550)1 (30)14.0513.5577.8277.9910.3011.23
230 (0.8)1 (100)0 (550)−1 (10)12.8113.2976.0877.1111.6912.14
240 (0.8)1 (100)0 (550)1 (30)12.3812.7477.1778.0118.5919.56
250 (0.8)0 (55)0 (550)0 (20)11.5611.6154.3855.3215.9316.06
260 (0.8)0 (55)0 (550)0 (20)11.7611.6155.9055.3216.0216.06
270 (0.8)0 (55)0 (550)0 (20)11.5211.6155.6855.3216.2216.06
Table 5. Coded values of the four independent variables under investigation and the actual concentration of polyphenolic compounds, represented in mg/g dw.
Design PointIndependent VariablesResponses
X1 (E, kV/cm)X2 (tpulse, μs)X3 (T, μs)X4 (t, min)NCAPELCACGAERCRTA7GULA
1−1 (0.6)−1 (10)0 (550)0 (20)0.021.050.080.200.220.400.394.96
2−1 (0.6)1 (100)0 (550)0 (20)0.031.290.060.210.360.390.504.66
31 (1.0)−1 (10)0 (550)0 (20)0.011.120.080.210.200.620.384.58
41 (1.0)1 (100)0 (550)0 (20)0.021.210.060.200.210.390.405.28
50 (0.8)0 (55)−1 (100)−1 (10)0.041.420.060.210.390.420.604.46
60 (0.8)0 (55)−1 (100)1 (30)0.031.450.060.210.420.410.574.80
70 (0.8)0 (55)1 (1000)−1 (10)0.031.270.300.200.260.370.404.72
80 (0.8)0 (55)1 (1000)1 (30)0.041.310.050.210.420.400.535.90
9−1 (0.6)0 (55)0 (550)−1 (10)0.021.220.050.210.280.390.435.79
10−1 (0.6)0 (55)0 (550)1 (30)0.021.070.070.200.180.370.355.73
111 (1.0)0 (55)0 (550)−1 (10)0.010.920.240.210.330.330.451.20
121 (1.0)0 (55)0 (550)1 (30)0.031.170.080.200.310.400.434.19
130 (0.8)−1 (10)−1 (100)0 (20)0.031.370.180.190.520.430.642.34
140 (0.8)−1 (10)1 (1000)0 (20)0.031.230.100.210.360.410.552.79
150 (0.8)1 (100)−1 (100)0 (20)0.031.270.060.200.330.410.462.58
160 (0.8)1 (100)1 (1000)0 (20)0.031.190.140.210.440.420.563.03
17−1 (0.6)0 (55)−1 (100)0 (20)nd *1.260.080.200.240.390.442.41
18−1 (0.6)0 (55)1 (1000)0 (20)0.021.080.080.200.110.370.302.37
191 (1.0)0 (55)−1 (100)0 (20)0.021.190.050.200.230.390.352.73
201 (1.0)0 (55)1 (1000)0 (20)nd1.200.110.200.240.370.332.72
210 (0.8)−1 (10)0 (550)−1 (10)nd1.220.040.200.310.390.042.74
220 (0.8)−1 (10)0 (550)1 (30)nd1.290.040.200.310.390.462.80
230 (0.8)1 (100)0 (550)−1 (10)0.031.200.040.200.240.400.382.57
240 (0.8)1 (100)0 (550)1 (30)nd1.230.050.200.240.380.382.68
250 (0.8)0 (55)0 (550)0 (20)nd1.280.040.200.200.370.342.98
260 (0.8)0 (55)0 (550)0 (20)0.021.170.060.200.170.380.363.53
270 (0.8)0 (55)0 (550)0 (20)nd1.000.050.200.180.390.362.76
* nd: not detected. NCA: neochlorogenic acid; PEL: pelargonin; CA: catechin; CGA: chlorogenic acid; ERC: eriocitrin; RT: rutin; A7G: apigenin 7-O-glucoside; ULA: ursolic acid.
Table 6. Mathematical models created using RSM were used to optimize the extraction of C. sativa leaves. The models contained only significant terms.
ResponsesSecond-Order Polynomial Equations (Models)R2pEquation
TPCY = 6.47 + 23.3X1 − 0.02X2 − 0.02X3 + 0.07X4 − 5.11X12 + 0.0004X22 + 0.00001X32 + 0.01X42 − 0.06X1X2 − 0.01X1X3 − 0.77X1X4 − 0.00001X2X3 + 0.0003X2X4 + 0.0001X3X40.9466<0.0001(6)
FRAPY = 171.43 − 14.6X1 − 0.6X2 − 0.11X3 − 6.27X4 − 0.97X12 + 0.007X22 + 0.0001X32 + 0.1X42 − 0.23X1X2 + 0.03X1X3 + 0.99X1X4 − 0.0002X2X3 + 0.004X2X4 + 0.002X3X40.9739<0.0001(7)
DPPHY = 29.32 + 64.81X1 − 0.58X2 − 0.08X3 − 0.43X4 − 75.69X12 + 0.001X22 + 0.00001X32 − 0.03X42 + 0.38X1X2 + 0.04X1X3 + 0.72X1X4 + 0.0001X2X3 + 0.008X2X4 + 0.001X3X40.9693<0.0001(8)
Table 7. Maximum predicted responses and optimum extraction conditions for the dependent variables.
ResponsesOptimal Conditions
Maximum Predicted ResponseE, kV/cm
(X1)
tpulse, μs
(X2)
T, μs
(X3)
t, min
(X4)
TPC (mg GAE/g)16.22 ± 0.790.930100015
FRAP (μmol AAE/g)91.50 ± 4.220.91095025
DPPH (μmol AAE/g)27.81 ± 1.870.980100025
Table 8. Maximum desirability for all variables using the partial least squares (PLS) prediction profiler under the optimal extraction conditions (X1:0.9, X2:10, X3:1000, and X4:25). There was also a comparison with the control extract, which was without any PEF treatment.
VariablesPLS Model ValuesExperimental Values
(PEF)
Control
(No PEF)
% Increase
TPC (mg GAE/g)16.6516.79 ± 0.34 a9.62 ± 0.30 b74.5
FRAP (μmol AAE/g)94.9595.41 ± 6.68 a54.97 ± 1.15 b73.6
DPPH (μmol AAE/g)20.6724.78 ± 0.72 a14.51 ± 0.93 b70.9
Within each row, statistically significant differences (p < 0.05) are denoted with lowercase letters (e.g., a,b).
Table 9. Polyphenolic compounds analysis under optimal extraction conditions. There was also a comparison with the control extract, which was without any PEF treatment.
Polyphenolic Compounds (mg/g)Optimal Extract
(PEF)
Control
(No PEF)
% Increase
Neochlorogenic acid0.10 ± 0.01 a0.03 ± 0 b289.1
Pelargonin1.32 ± 0.06 a0.94 ± 0.07 b41.1
Catechin0.20 ± 0.01 a0.16 ± 0 b23.5
Chlorogenic acid0.26 ± 0.01 a0.21 ± 0.01 b23.8
Eriocitrin0.61 ± 0.03 a0.22 ± 0 b180.9
Rutin0.45 ± 0.03 a0.32 ± 0.01 b41.3
Apigenin 7-O-glucoside0.51 ± 0.03 a0.26 ± 0.01 b99.2
Ursolic acid3.52 ± 0.21 a0.88 ± 0.03 b300.5
Total identified6.98 ± 0.38 a3.01 ± 0.14 b131.9
Within each row, statistically significant differences (p < 0.05) are denoted with lowercase letters (e.g., a,b).
Disclaimer/Publisher’s Note: The statements, opinions and data contained in all publications are solely those of the individual author(s) and contributor(s) and not of MDPI and/or the editor(s). MDPI and/or the editor(s) disclaim responsibility for any injury to people or property resulting from any ideas, methods, instructions or products referred to in the content.

