1. Introduction
The development of conductive inks has been gaining prominence due to the growing scientific interest in flexible printed electronics [
1,
2,
3,
4,
5]. Printing techniques are employed to transfer ink onto a substrate. Printing technology helps in generating customized patterns of electrical properties on different substrates such as polymers, ceramic materials, textiles, and paper [
6].
In this sense, the possibility of using conductive inks in the development of electrochemical sensors printed on flexible substrates is especially attractive, as it allows for the creation of uniform sensors [
7,
8,
9,
10]. Printed electrodes are an alternative to the use of conventional electrodes in electroanalysis, presenting the advantage of offering simpler systems, with a more compact electrode arrangement, suitable for the development of portable sensors. However, the advanced state of electrochemical sensor development requires that sensing platforms not only exhibit notable analytical figures of merit but also have characteristics appropriate for a commercially printed sensor, such as robustness [
1,
11]. The device cannot be influenced by small variations in its analytical parameters and must provide a stable signal throughout its use. Therefore, the production of conductive inks is directly related to the efficiency of the electrochemical sensor.
Conductive inks are suspensions of conductive material/composite in an appropriate solvent or solvent mixtures containing binding agents, surfactants, or polymers that act as stabilizers. In addition to high electrical conductivity, conductive inks must have good stability and adhesion to various types of substrates in order to maintain their electrical conductivity and chemical inertness after printing and post-printing processing and must dry densely on the substrate, resulting in a film adherent and uniform conductor [
12]. Commercial conductive inks meet most of these requirements. However, the biggest limitation of their use in the production of electrochemical sensors is their high cost. This limitation encouraged researchers to search for new inks with different conductive materials [
13].
Regarding conductive materials, the most commonly used are carbon materials, such as graphite, carbon black, graphene, and carbon nanotube [
14,
15,
16]. Metal-based conductive inks generally have better electrical conductivity. However, they are more expensive and less biocompatible compared to carbon-based conductive inks. Furthermore, metal-based conductive inks are less stable, as metallic nanoparticles are more susceptible to oxidation and aggregation [
12].
Graphite is formed by layers of sp
2 hybridized carbons in the form of trigonally linked planar hexagonal rings. These layers, also known as graphene sheets, are joined by σ-type covalent bonding. The conductivity of graphite is similar to metallic conductors because its structure contains sp
2 hybridized carbon with delocalized π- electrons. Each carbon atom is covalently bonded to three of its neighboring atoms. The fourth electron in each atom is free to move, making graphite a good conductor of electricity and extremely useful in the manufacture of conductive inks [
17].
Carbon black (CB) is a generic term used to identify a wide variety of carbonaceous materials in the form of spherical particles with sizes in the range of 10–100 nm, produced through the controlled thermal decomposition of aromatic hydrocarbons [
11]. CB is a category of carbon nanomaterial that has a high surface area and improves electrode charge transport. CB-modified electrodes exhibit unique electrochemical and electronic properties and are widely used in electrochemical sensing applications due to their good conductivity, low toxicity, biocompatibility, and being a low-cost nanomaterial [
18].
In this context, Freitas and collaborators report the development of a flexible electrochemical sensor printed on an Ecoflex™ (Macungie, PA, USA) substrate with a conductive ink composed of craft glue, graphite, acetone, ethyl acetate, and glycerin. After optimizing the conditions, using square wave voltammetry, the sensor showed a linear response range for paracetamol from 7.0 to 100 μmol L
−1 and for dopamine from 3.0 to 100 μmol L
−1, with detection limits of 1.4 μmol L
−1 and 78 nmol L
−1, respectively. The sensor was applied successfully for the detection of paracetamol and dopamine in artificial sweat with excellent recovery (from 90 to 110%) [
19].
In the work carried out by dos Santos and collaborators, printed electrodes were developed, via screen printing, with carbon black and cellulose acetate to determine ascorbic acid by chronoamperometry and cadmium and lead ions using anodic redissolution voltammetry. Detection limits of 3.1 × 10
−5 mol L
−1, 5.8 × 10
−7 mol L
−1, and 6.8 × 10
−7 mol L
−1 were found for the determination of ascorbic acid, cadmium ions (II), and lead (II), respectively [
11].
Carvalho et al. developed a conductive ink composed of glass varnish and carbon nanotubes for the construction of an electrochemical sensor printed on polyethylene terephthalate (PET) sheets. The sensor was applied to determine 3-nitro-L-tyrosine (3-NLT), an amino acid present in biological fluids that can be used as an indicator of oxidative stress, by square wave voltammetry (SWV). Under optimized conditions, the sensor presented a linear response range of 0.70 to 100.0 μmol L
−1 and a limit of detection (LOD) of 0.53 μmol L
−1. The sensor was applied to the analysis of 3-NLT in synthetic urine, with excellent recovery values (from 95.2 to 106.0%) [
20].
Although the literature describes various sensors printed with different conductive inks, there is a challenge in producing commercial devices for real applications. Much of this challenge is associated with the unsatisfactory performance of the sensors and limitations regarding large-scale production at reduced cost [
21,
22,
23,
24].
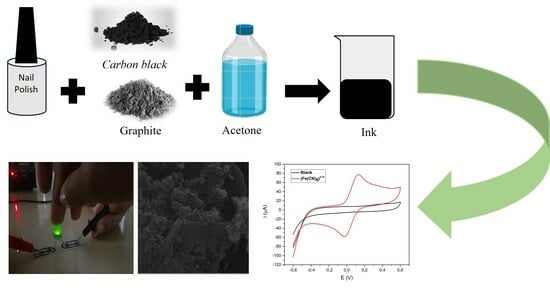
Therefore, the objective of the present work was to develop an easy-to-prepare conductive ink composed of graphite and carbon black as conductive materials and nail polish as a binder, dispersed in acetone as a solvent. The ink was produced with easily accessible materials, with consideration that the production of the electrochemical sensors would be produced by screen printing. In our research of the literature, the proposal of a conductive ink with this composition was not found.
2. Materials and Methods
2.1. Reagents
Acetone, pure powdered graphite (98% purity), bibasic sodium phosphate heptahydrate (Na2HPO4.7H2O), and monobasic sodium phosphate monohydrate (NaH2PO4.H2O) were all purchased from Synth® (Diadema, SP, Brazil). Nail polish was purchased from Cora (São Paulo, SP, Brazil), and potassium ferrocyanide (K4[Fe(CN)6]) was purchased from Dinâmica Química (Diadema, SP, Brazil). Carbon black powder was purchased from Cabot (Mauá, SP, Brazil). All chemical reagents used were of analytical grade. The solutions were all prepared in purified water by Millipore® (Burlington, MA, USA) Milli-Q system.
2.2. Preparation of the Conductive Ink and Printing of Electrodes
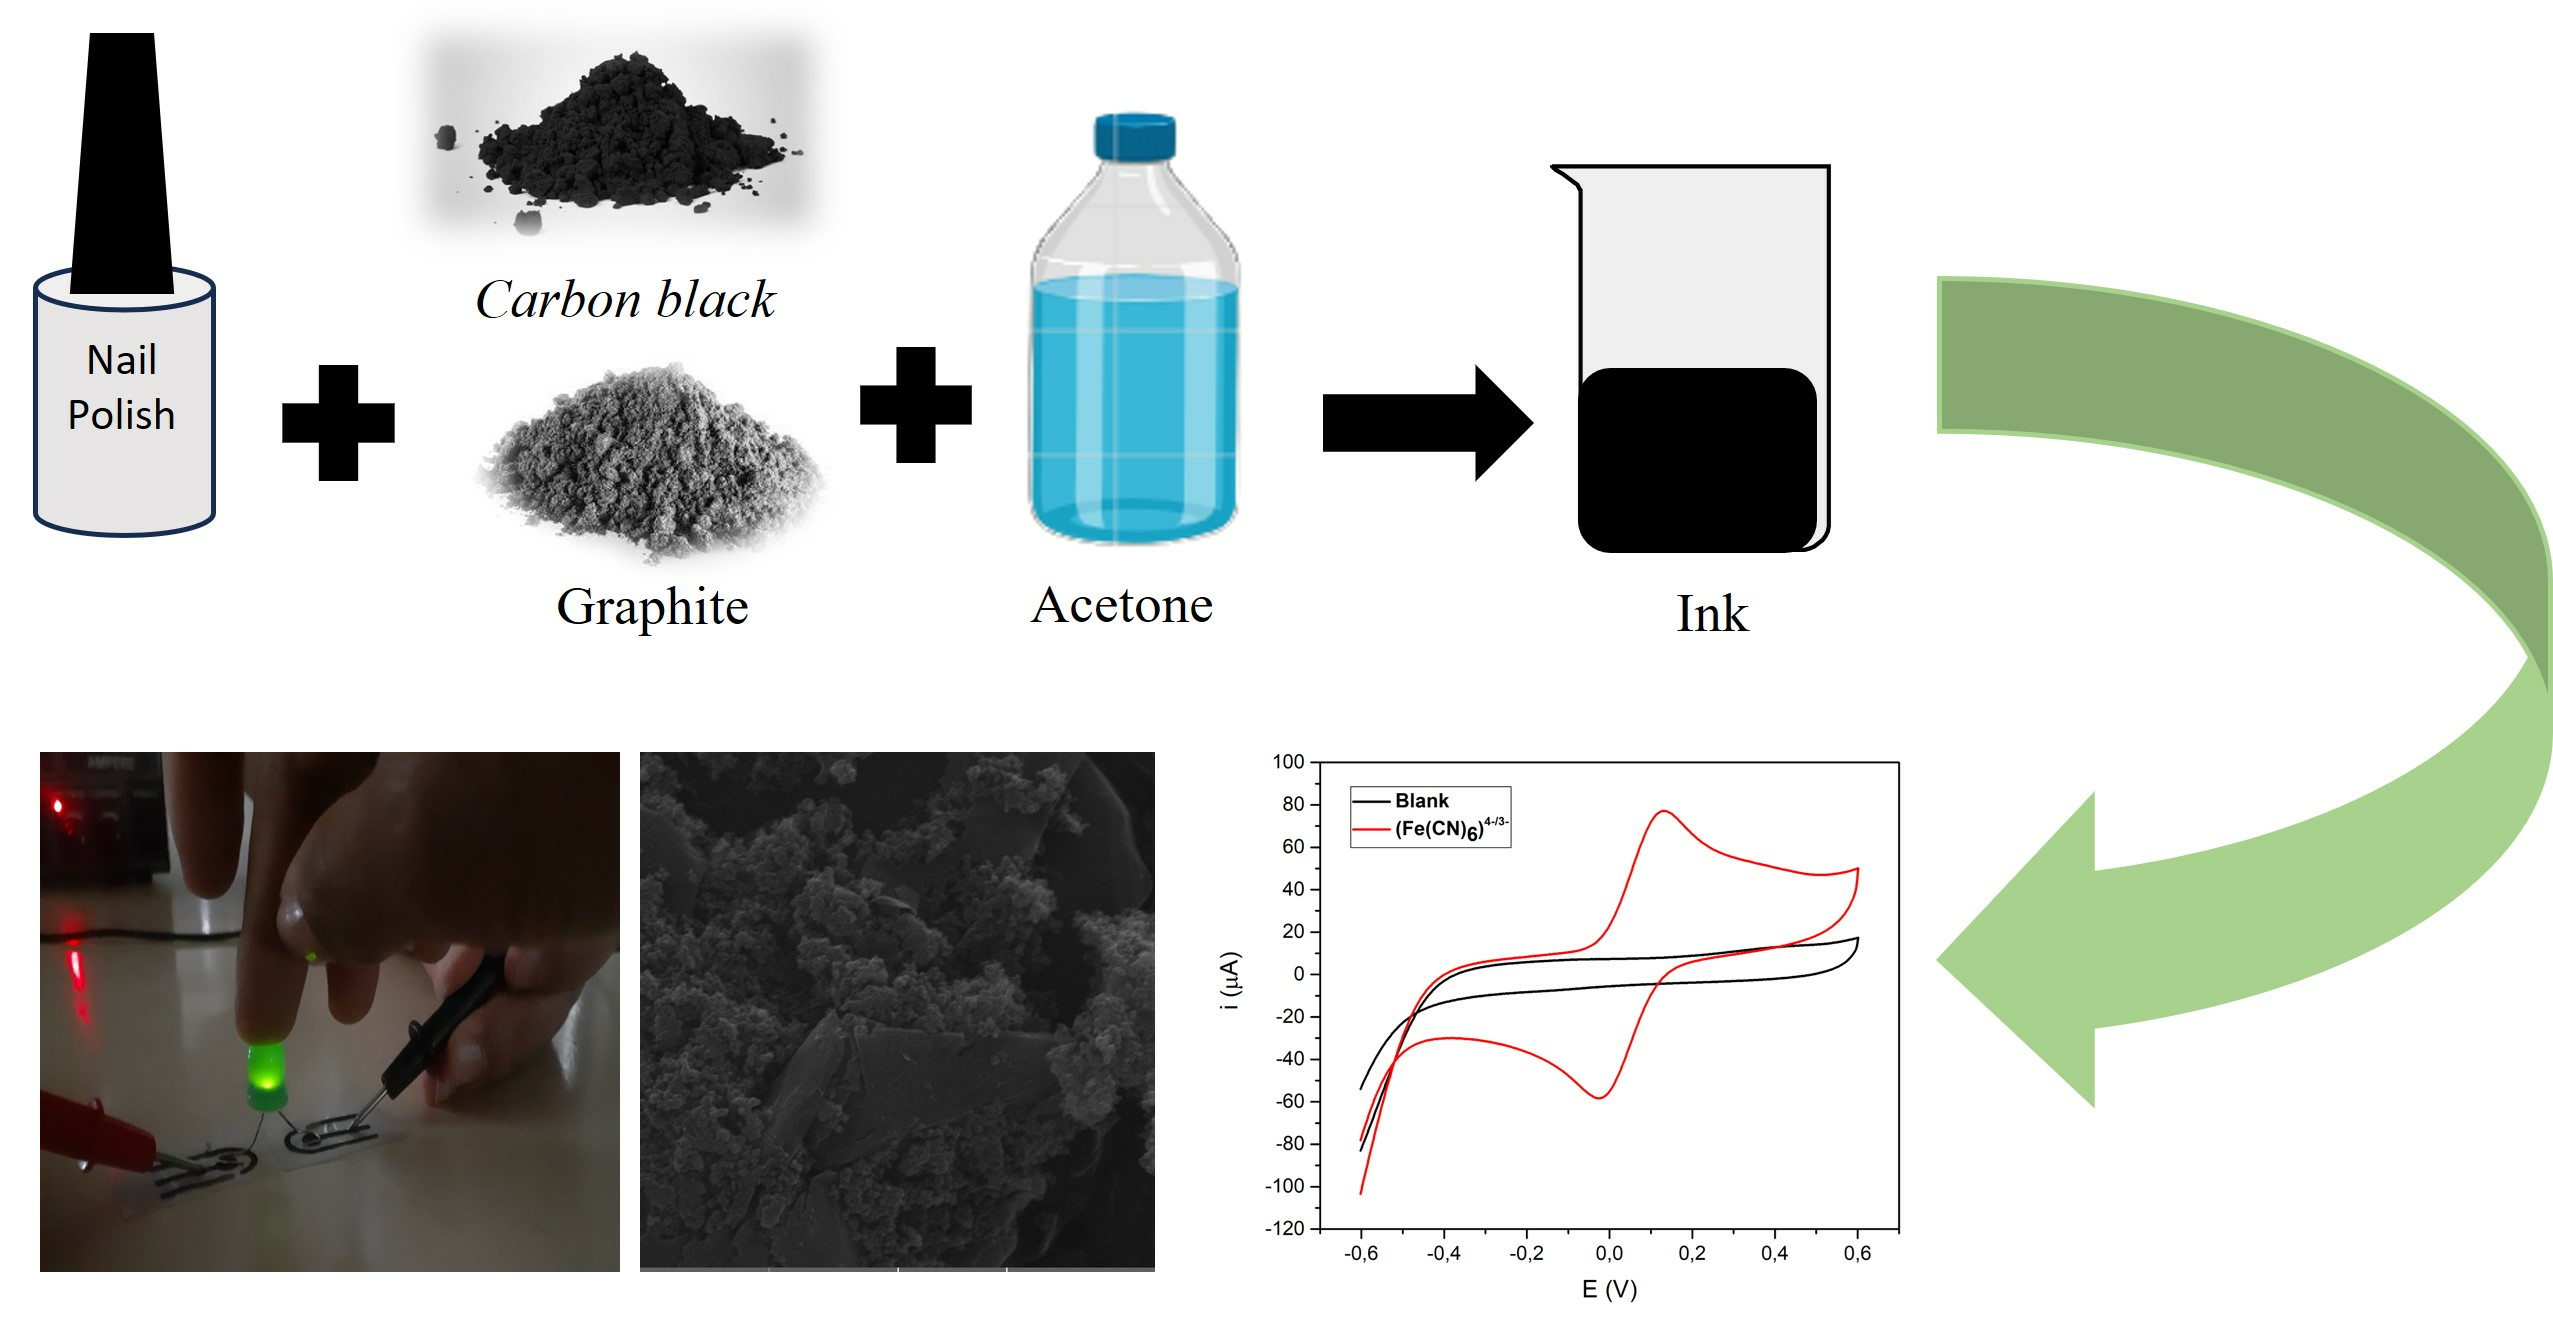
The conductive ink was prepared by mixing 1.500 g of graphite (GR), 0.500 g of carbon black (CB), and 2.250 g of nail polish (NP) and was mixed manually using a glass stick. Then, 5 mL of acetone was added and mixed until the ink was completely homogenized. The ink obtained was called GR:CB and was used immediately in order to avoid drying out.
Figure 1 shows the steps for manufacturing the conductive ink. The proportions of graphite, carbon black, and nail polish were previously optimized.
The electrodes were printed on commercial polyethylene terephthalate (PET) sheets, previously cleaned and sanded. The adhesive vinyl mold was cut by a cutter plotter. The mold was designed with the aid of CorelDraw X6 software. After cutting, the inner part of the mold was removed and then glued onto the surface of the PET sheet. A quantity of ink was deposited on the mold and then spread over the design with the aid of a spatula. Subsequently, the mold was removed before the ink was completely dry. The geometric area was delimited by applying a layer of nail polish between the contact that will be inserted in the sample and the electrical contacts connected to the power source, to prevent the sample solution from traveling to the electrical contacts. Electrochemical and morphological characterizations were performed after total drying of the device.
2.3. Characterization Techniques
Samples of GR, CB, NP, and conductive ink were characterized using different techniques. The FTIR spectra were recorded in the Perkin-Elmer (São Paulo, SP, Brazil) model Spectrum GX FTIR-8300 series on KBr pallets. For scanning electron microscopy (SEM), the samples were fixed in a stub using a double-sided conductive carbon tape from TEDPELLA. Then, the set was coated with gold in a plasma metallizer: Sputter Q150R ES metallizer from Quorum Technologies (Puslinch, ON, Canada). After metallization, the images were obtained using a TESCAN (São Bernardo do Campo, SP, Brazil) VEGA3 LMH scanning electron microscope, using an acceleration voltage of 30 kV.
Raman spectra were obtained on a Senterra Raman spectrometer Bruker (Atibaia, SP, Brazil) equipped with a CCD detector. The sample was excited with a laser at a wavelength of 633 nm and power of 2 mW, and the focusing of the laser beam and collection of back-scattered light were obtained using an optical microscope (OLYMPUS BX51) coupled to the spectrometer.
The techniques used for the electrochemical studies were cyclic voltammetry (CV) and electrochemical impedance spectroscopy (EIS). All measurements were performed using a Metron Autolab (Herisau, Switzerland) model PGSTAT204 potentiostat with NOVA 2.1.6 software. For the measurements, an electrochemical cell was employed, using an electrode printed with the obtained ink, which contained the auxiliary, work, and quasi-reference electrodes. The electrochemical behavior was performed using 0.1 M phosphate buffer (pH 7.0) and 2.0 mM of K4[Fe(CN)6], and 0.1 M KCl and 5.0 mM of K4[Fe(CN)6]3−/4− equimolar were used for the impedance.
3. Results
3.1. Conductivity Evaluation
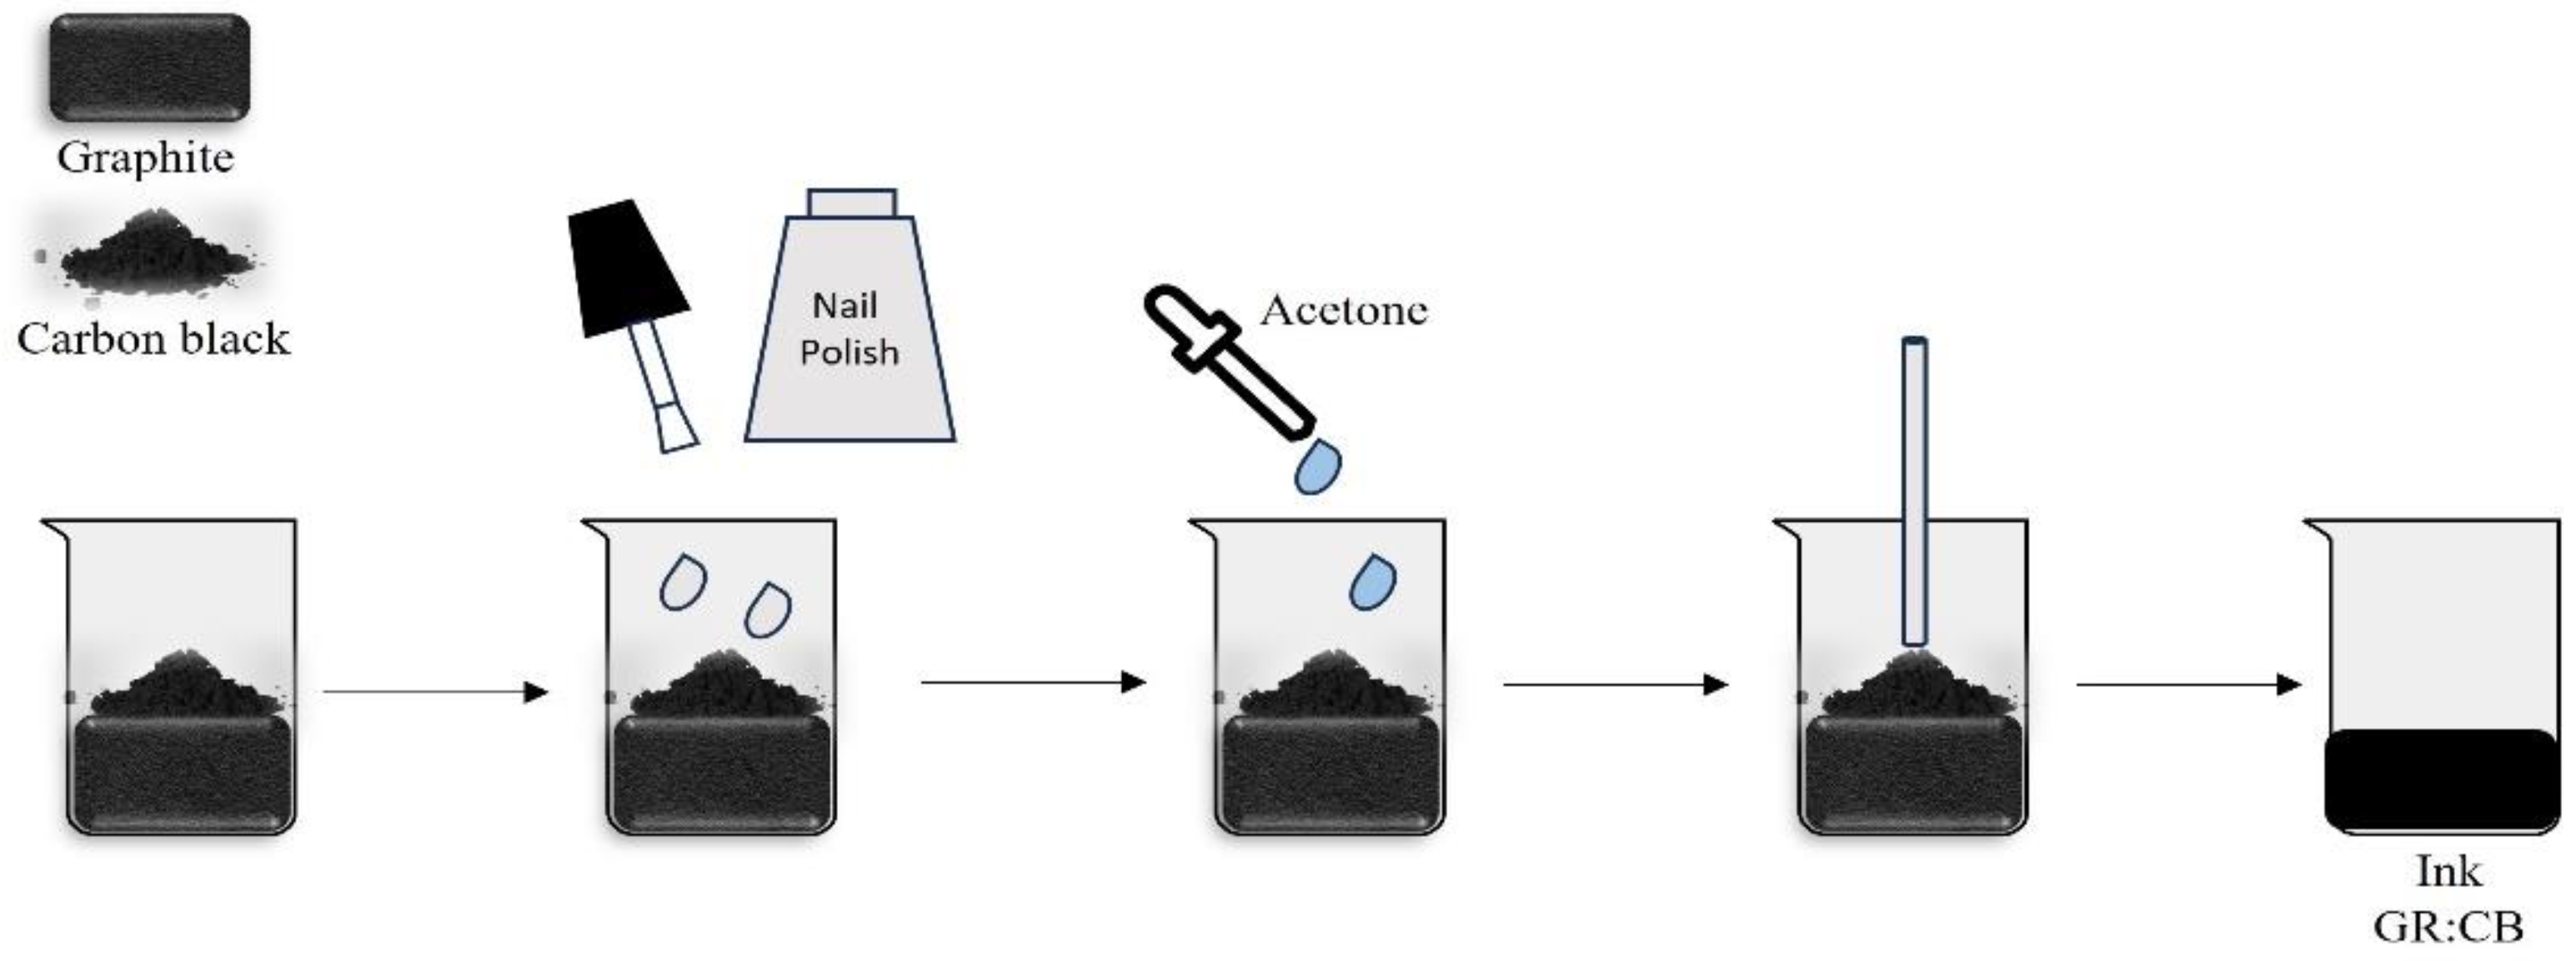
Simple experiments were carried out to demonstrate the conductivity of the developed ink. An electrode printed with ink deposited on a PET support was used. The first experiment used the device as a conductive path to light a light-emitting diode (LED), as shown in
Figure 2A. The ink produced was conductive when lighting the LED connected to a battery. When an electric current passes through a conductive material, it creates a magnetic field around it. Thus, in the second experiment, it was possible to observe that the needle of a compass deflected from its equilibrium position due to the conductive ink, through which an electric current passed next to it (
Figure 2B). The experiments made it possible to investigate the electrical nature of the conductive ink, through observations of electron transfer. The experiments carried out, although simple, showed perspectives on the use of the ink developed for electrode printing. Voltammetric studies were subsequently carried out using electrodes produced with conductive ink.
3.2. Flexibility of the Ink on the Substrate
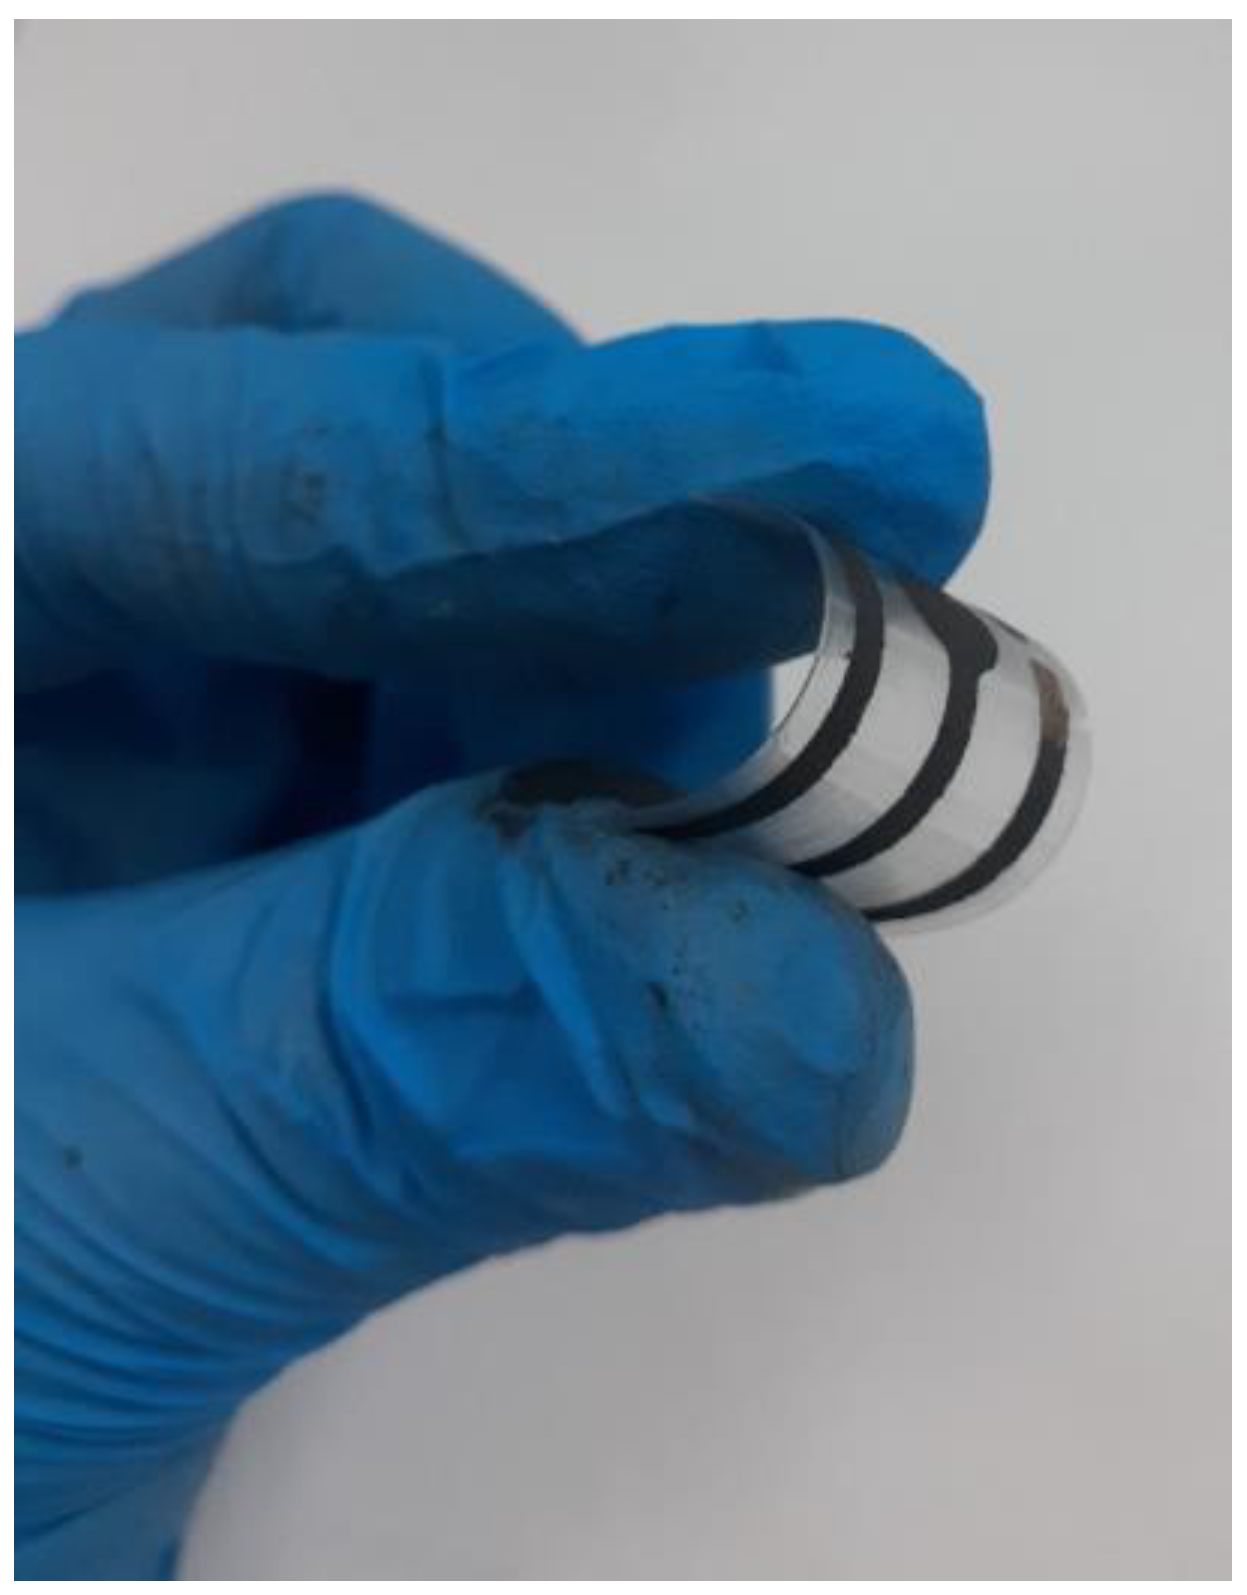
The resistance of the ink to mechanical forces after application to the support for the development of the printed sensor is of utmost importance (
Figure 3). Thus, the devices were subjected to folding, and it was observed that the printed ink adhered well to the surface, without the presence of cracks. These results indicate that ink can be applied for electrode printing, resulting in a flexible and homogeneous electrode.
3.3. Development and Electrochemical Characterization of Conductive Ink
The conductive ink consists of a composite of graphite powder, carbon black, and nail polish. The solvent used was acetone, which gives the nail polish excellent solubility, giving the ink good homogeneity and suitability to the desired printing process.
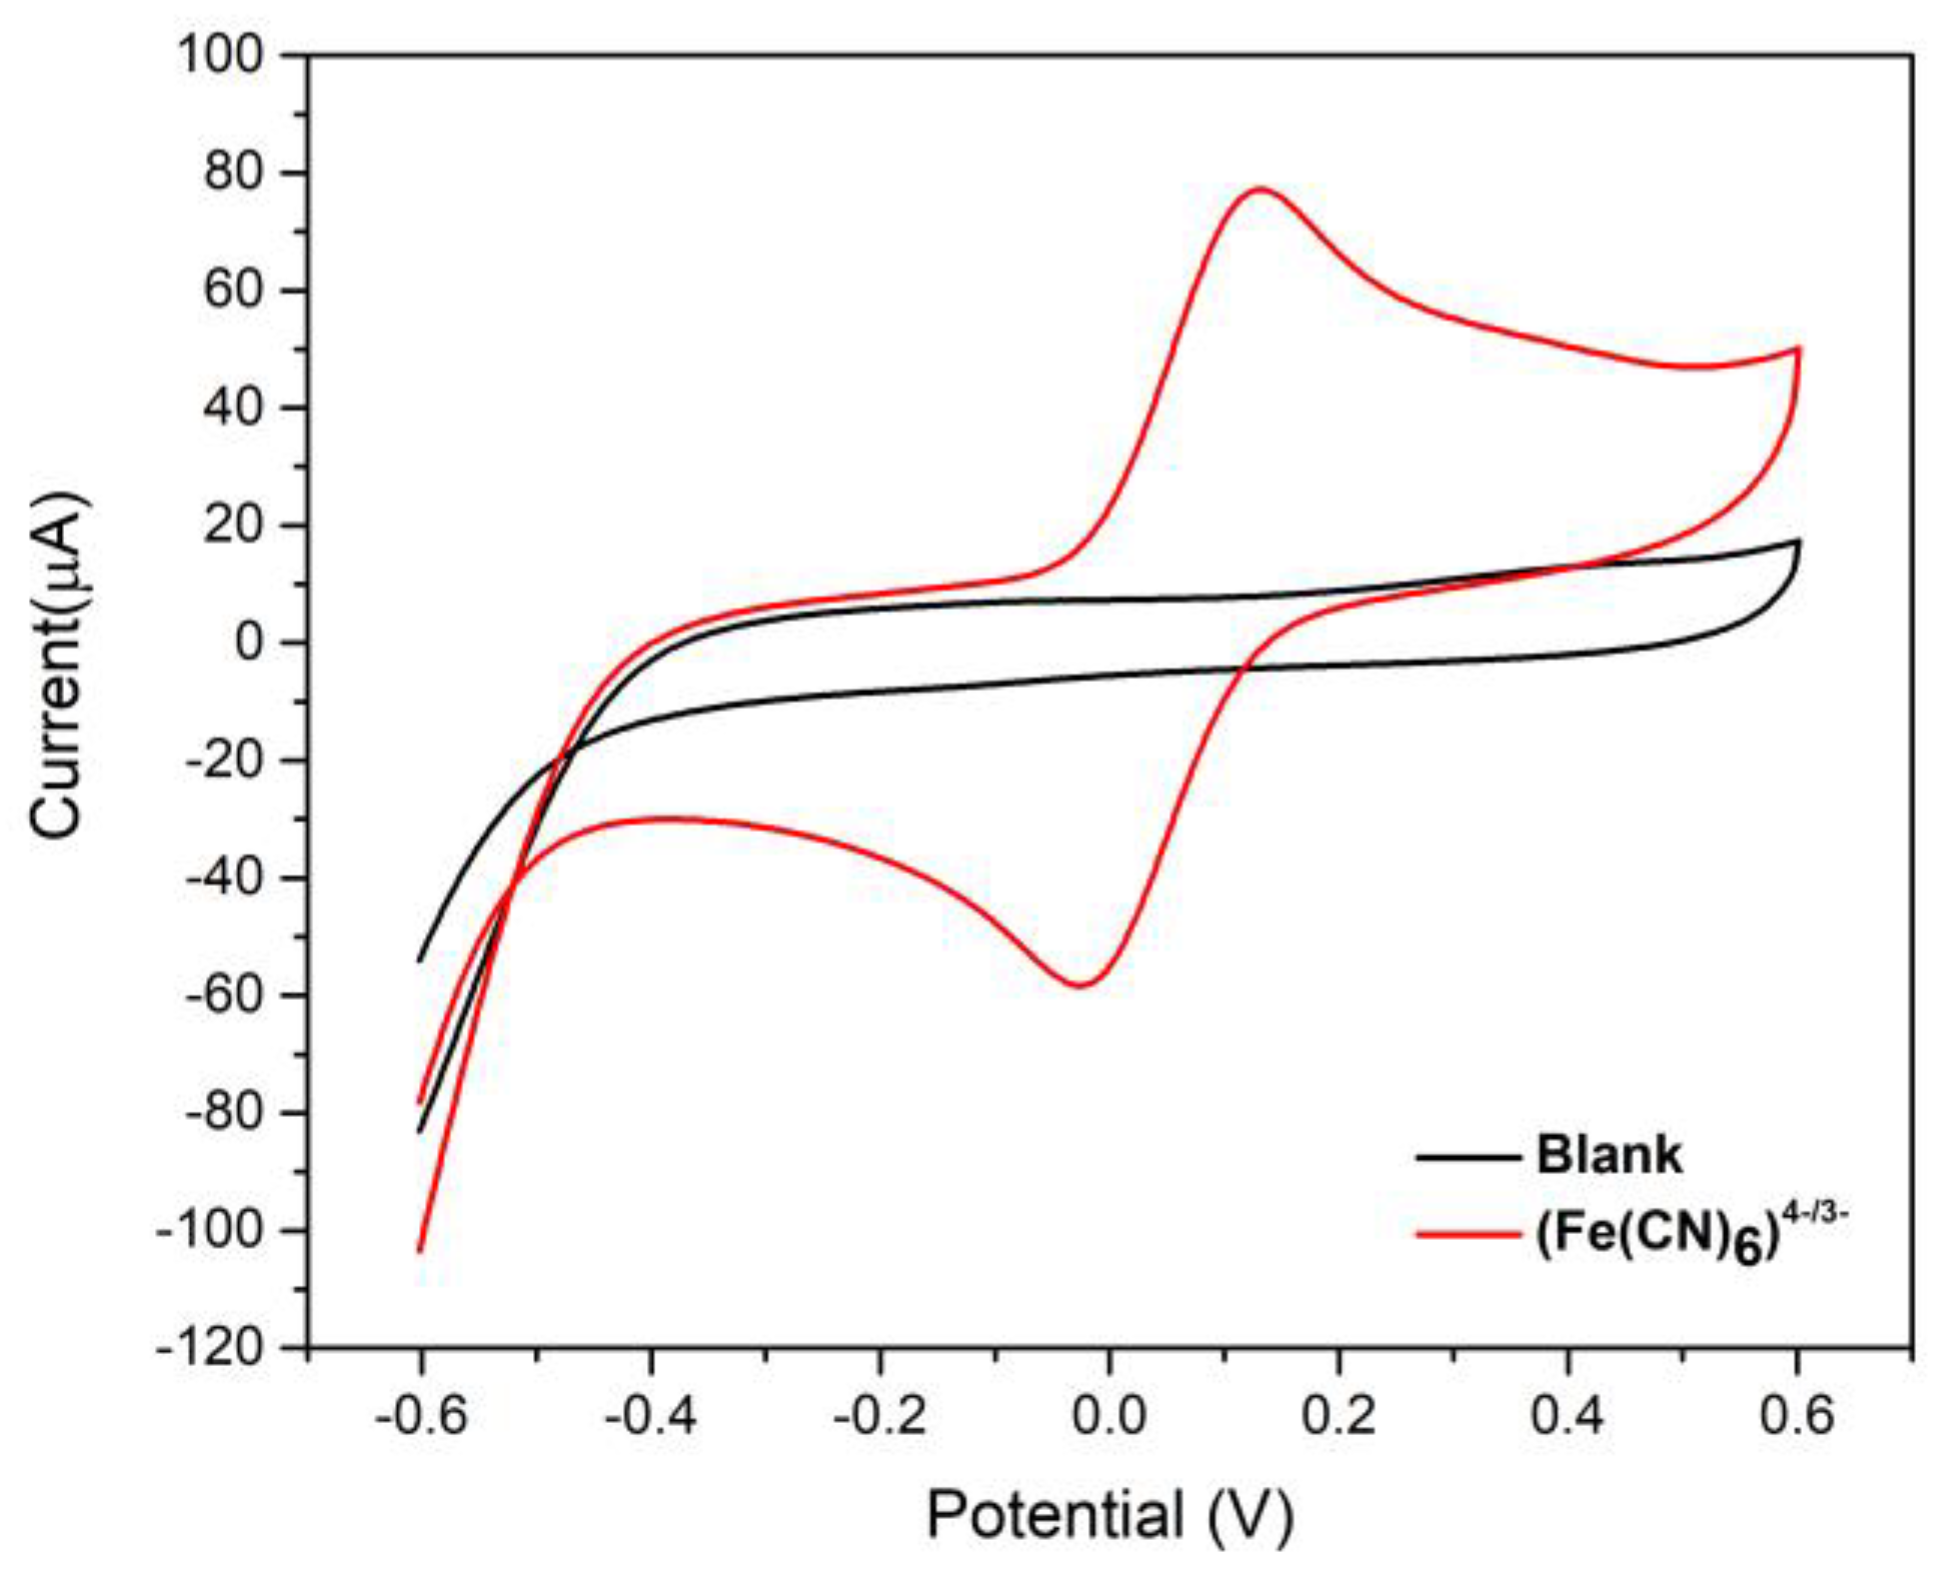
The ink obtained was used to print an electrode containing three electrodes: auxiliary, work, and reference. From this, the electrochemical performance was evaluated using cyclic voltammetry (CV) in the absence and presence of the probe [Fe(CN)
6]
−4. It can be observed in the voltammograms (
Figure 4) that in the absence of the probe, there are no evident peaks and a low background current, indicating that the ink does not present electroactive characteristics in the range of applied potential. Therefore, in the presence of the probe, it is possible to observe well-defined redox peaks characteristic of [Fe(CN)
6]
−4, showing the suitability of the conductive ink.
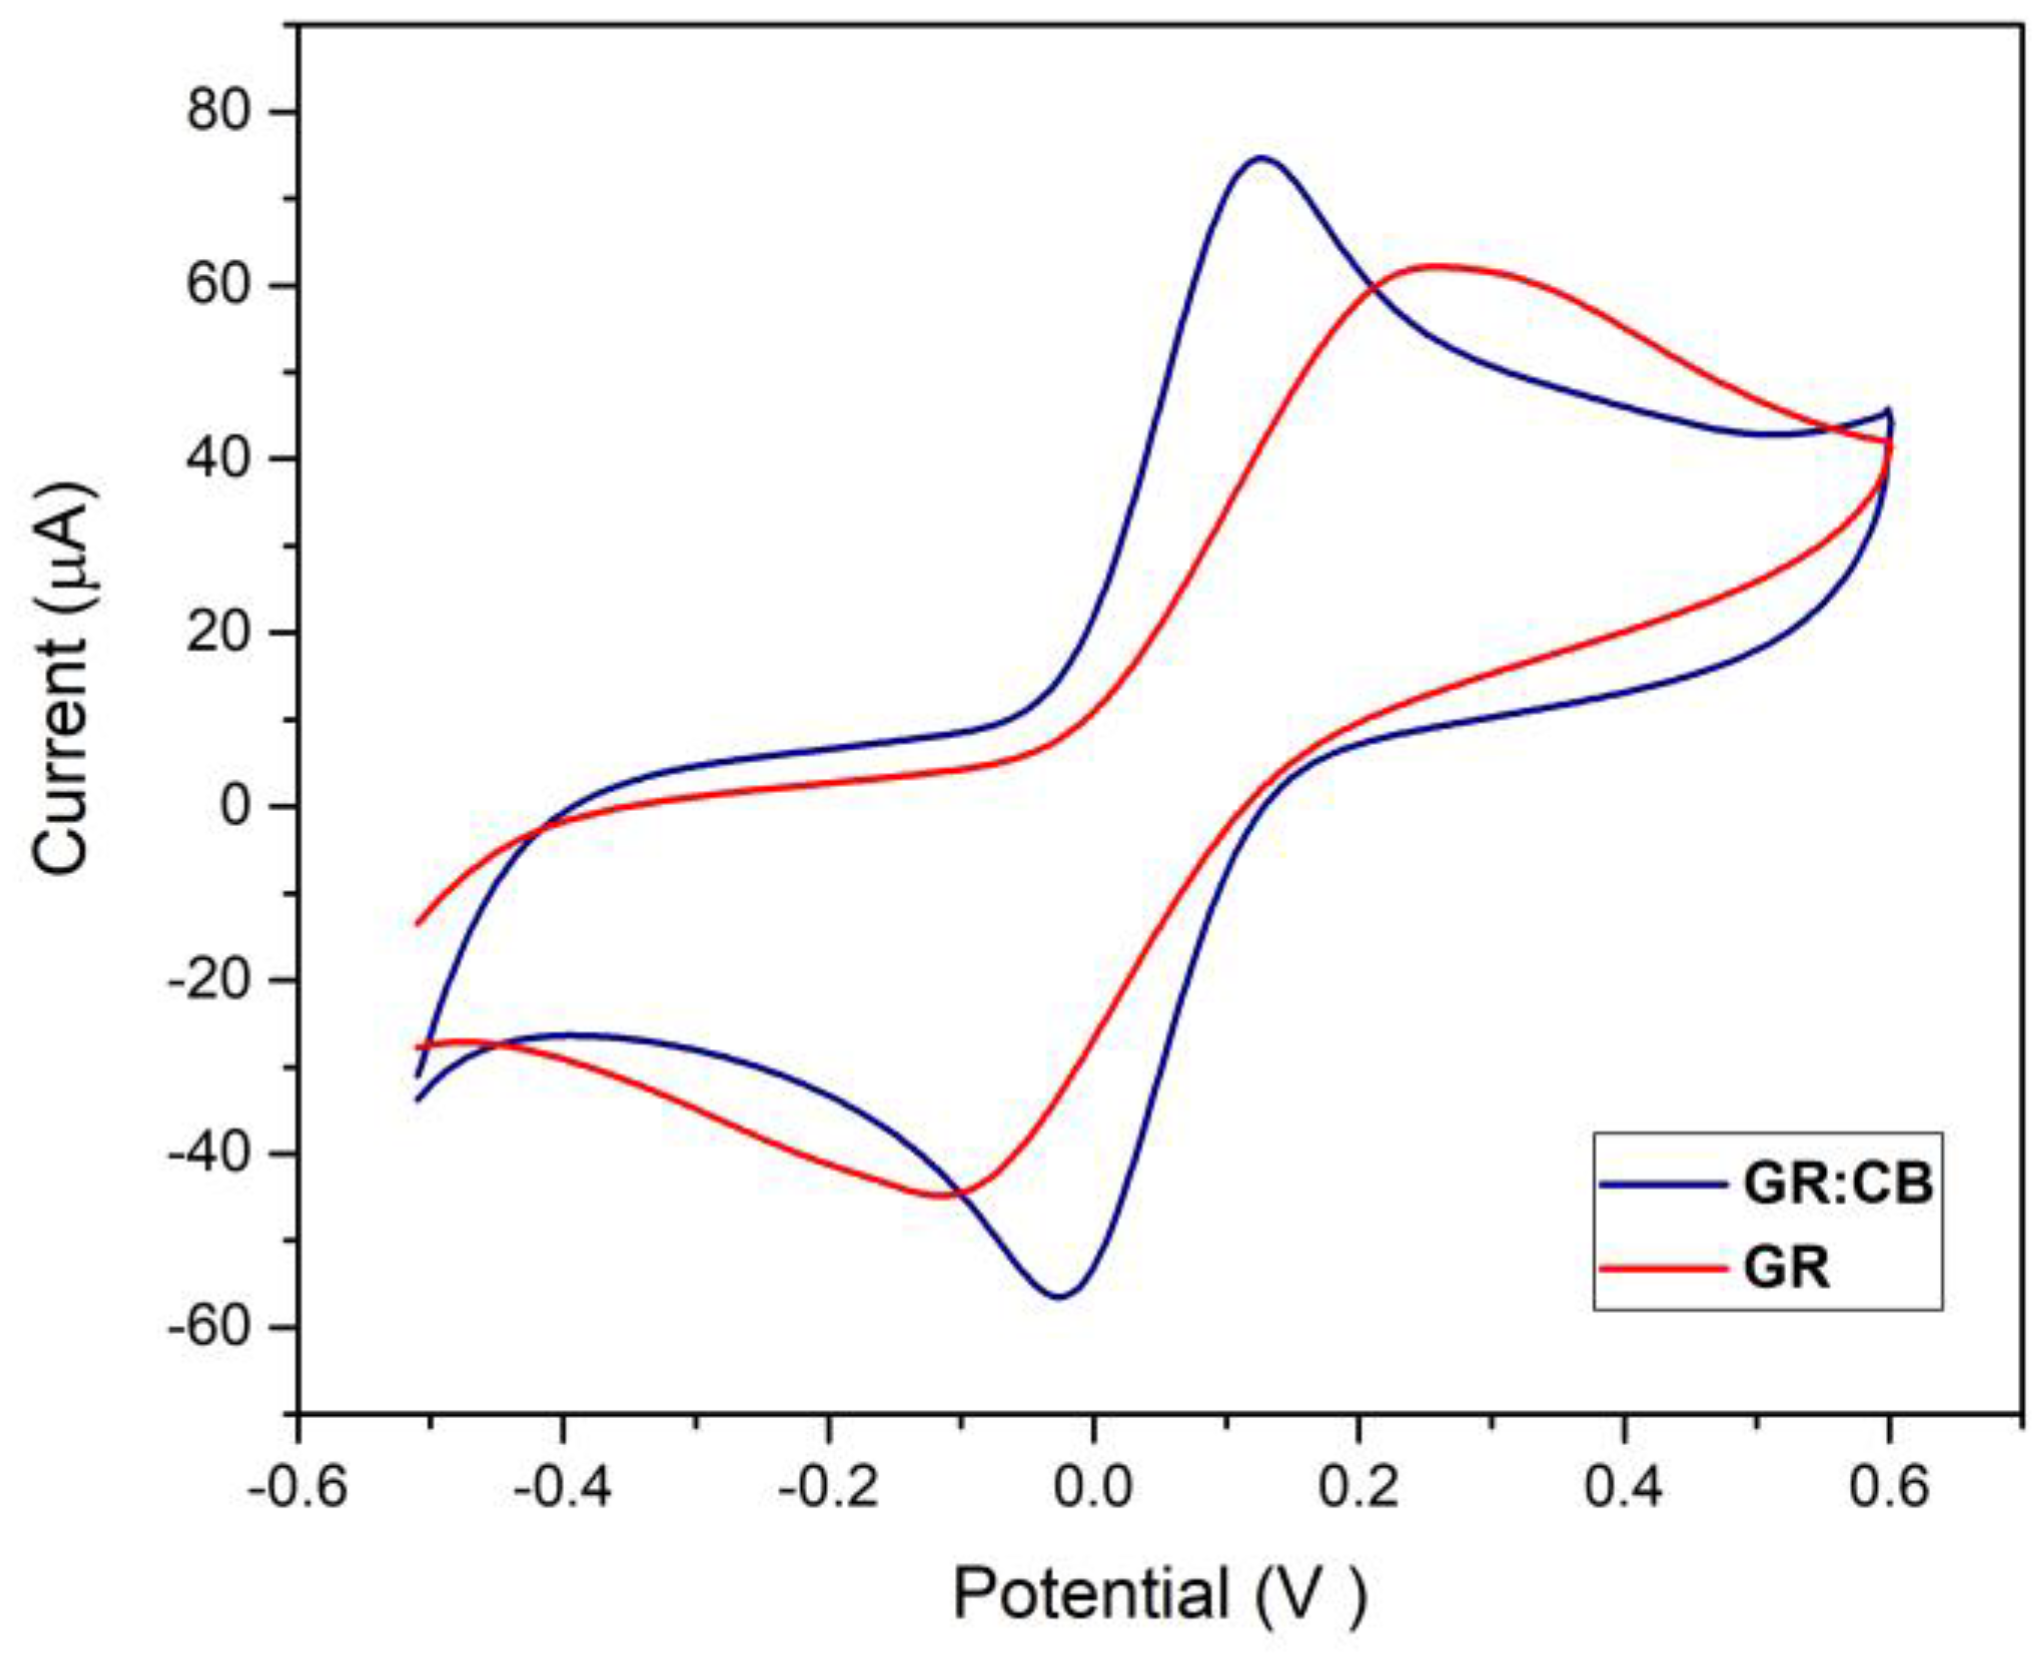
The behavior of a conductive ink composed of only graphite, nail polish, and acetone was also evaluated, as described in the literature [
17]. A comparative study was carried out to verify the influence of carbon black for application in the development of conductive inks (
Figure 5). The prepared ink with CB showed a better voltammetric profile in the faradaic processes related to the oxidation and reduction of the ferrocyanide/ferricyanide pair and a smaller difference between the anodic and cathodic peak potentials (reversibility) [
7,
11].
Carbon black is a conductive material that provides the ink with better electrical conductivity, thus improving the transfer of electrons at the electrode-solution interface [
25]. Thus, the results presented indicate that GR:CB ink has great potential for the manufacture of electrochemical sensors.
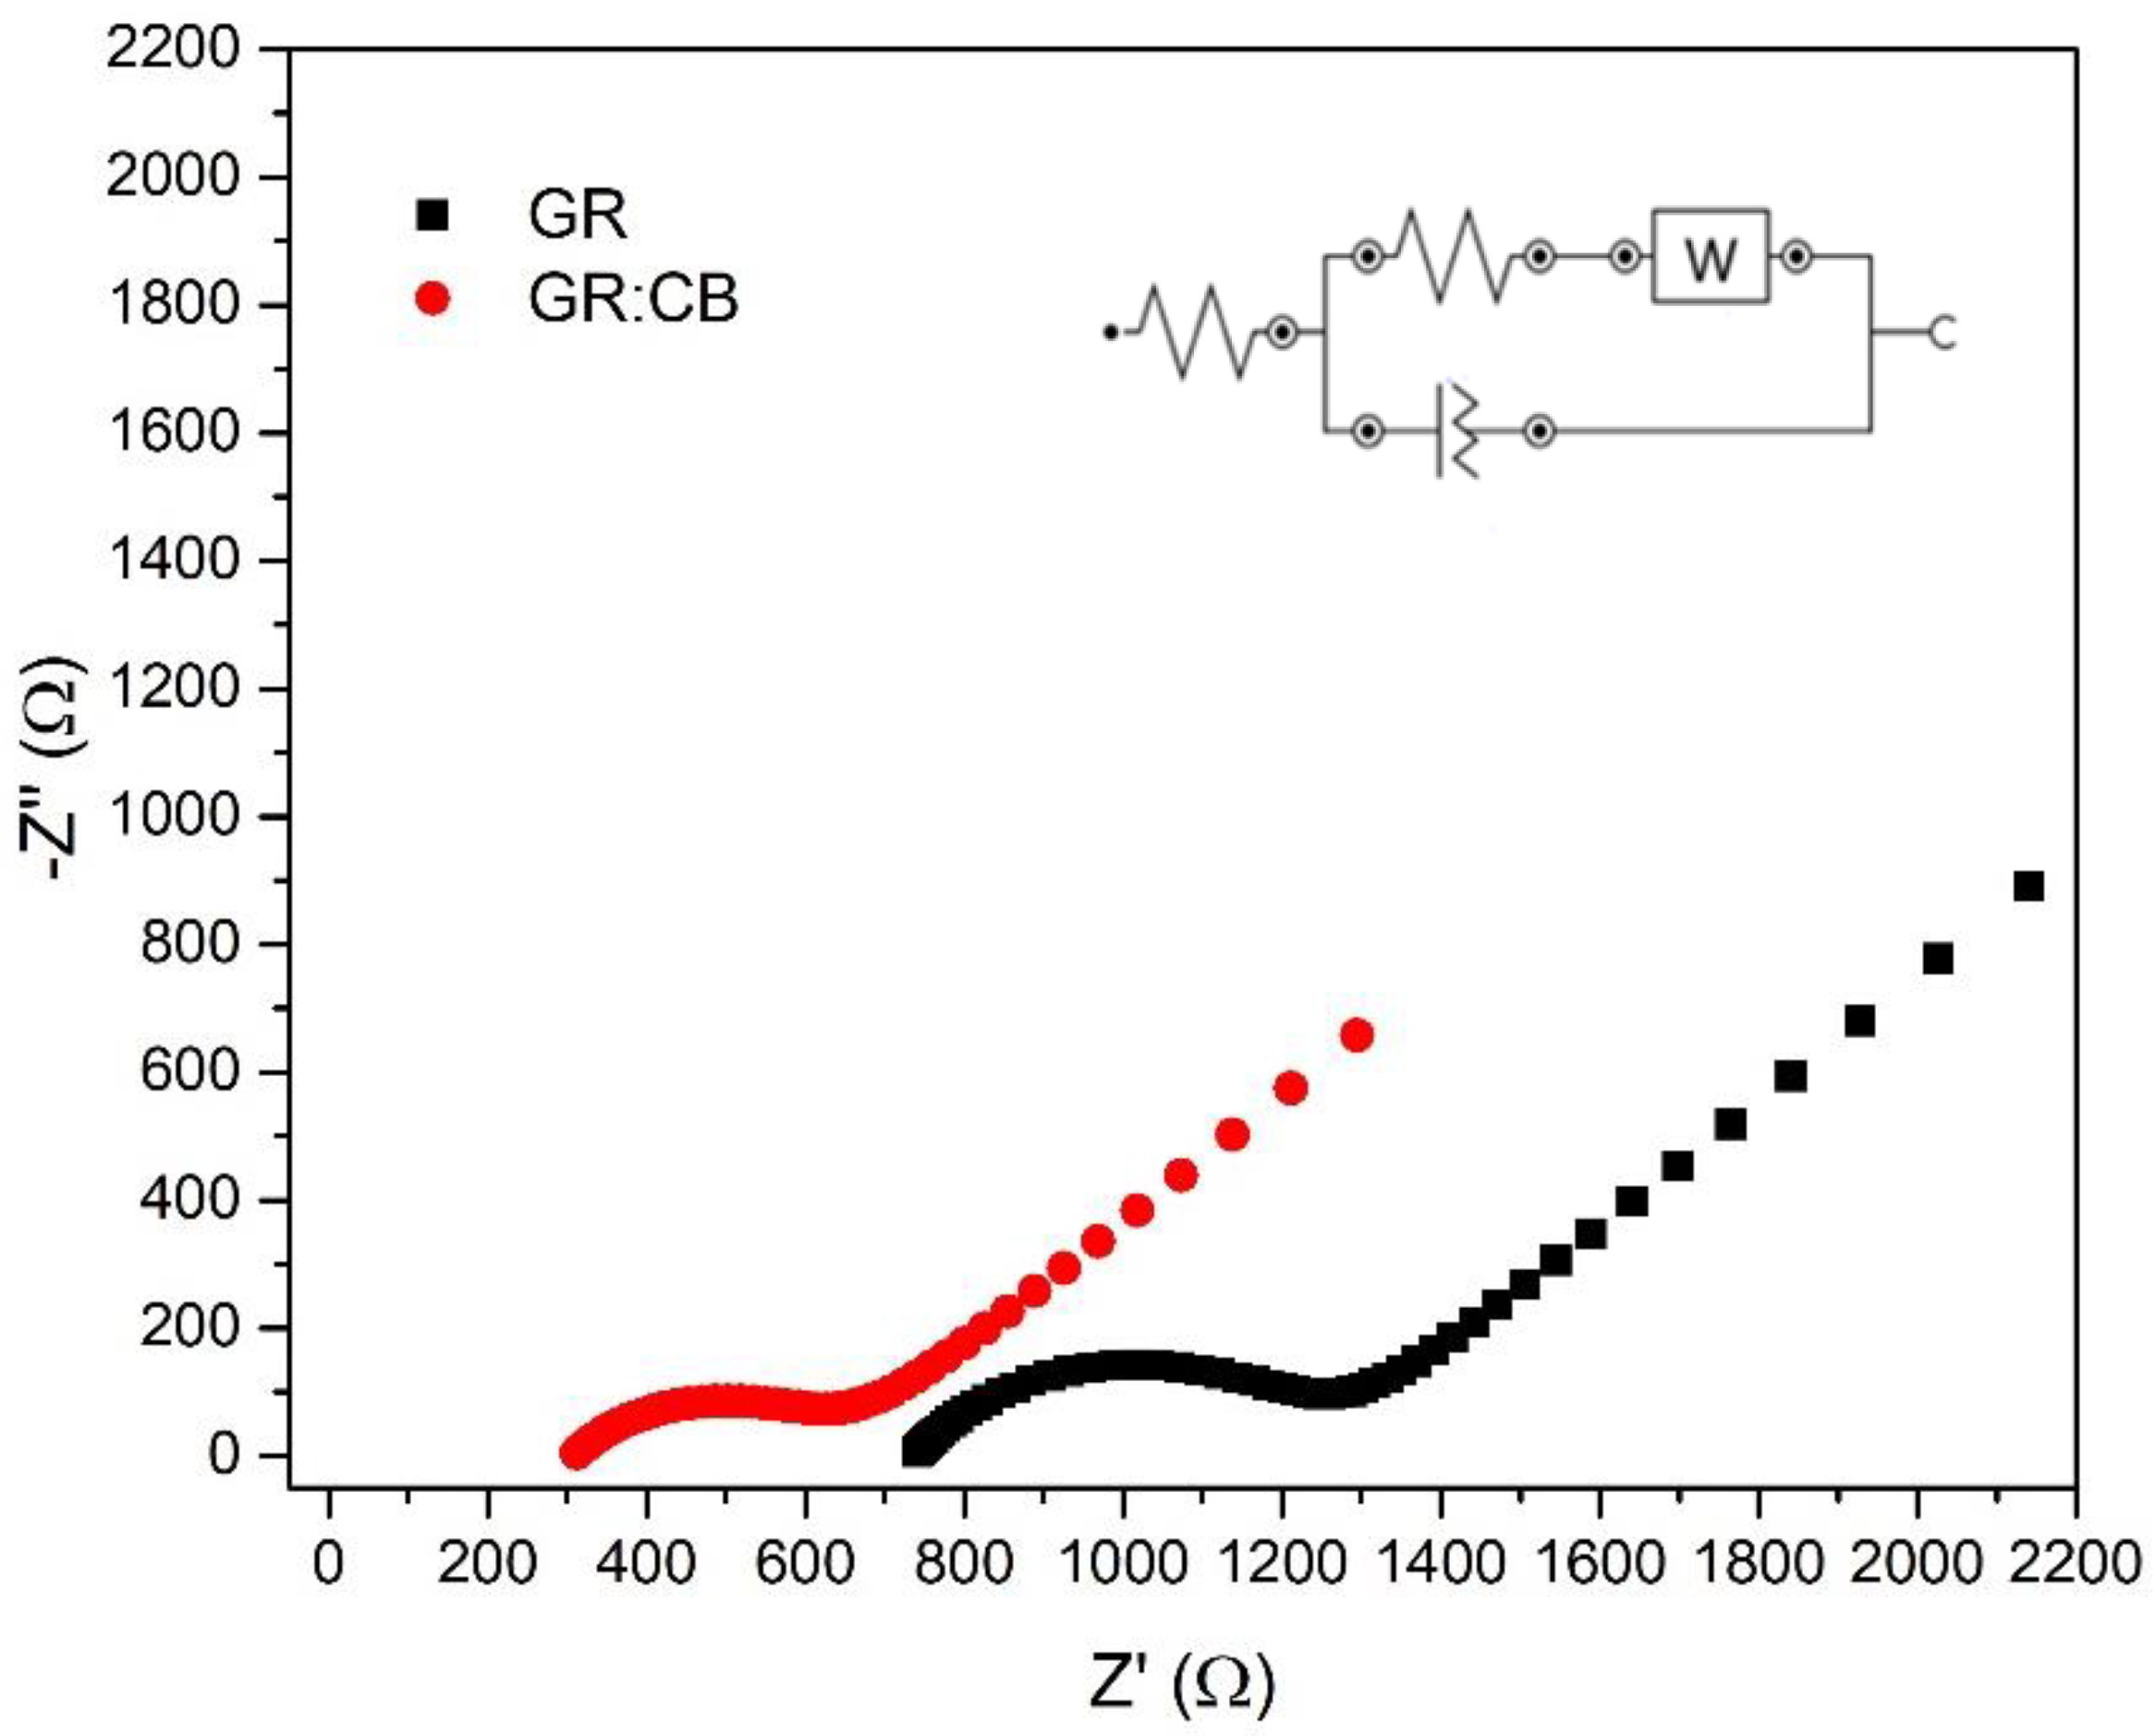
The resistance to electronic transfer of the inks was also evaluated by electrochemical impedance spectroscopy (EIS). Studies using EIS were conducted in 0.1 M KCl containing 5.0 mM of [Fe(CN)
6]
−4. The Nyquist diagram and the equivalent Randles circuit are shown in
Figure 6. The ideal diagram described by Nyquist presents a semicircle in the high-frequency region and a linear relationship in the mid-frequency and low-frequency range, with the diameter of the semicircle related to the resistance to load transfer (R
ct) [
26,
27]. The Rct for the graphite ink (0.527 kΩ) was higher than for ink containing carbon black (0.348 kΩ). Thus, the Rct values presented for the inks corroborate the results obtained from the cyclic voltammetry.
3.4. FT-IR Characterization
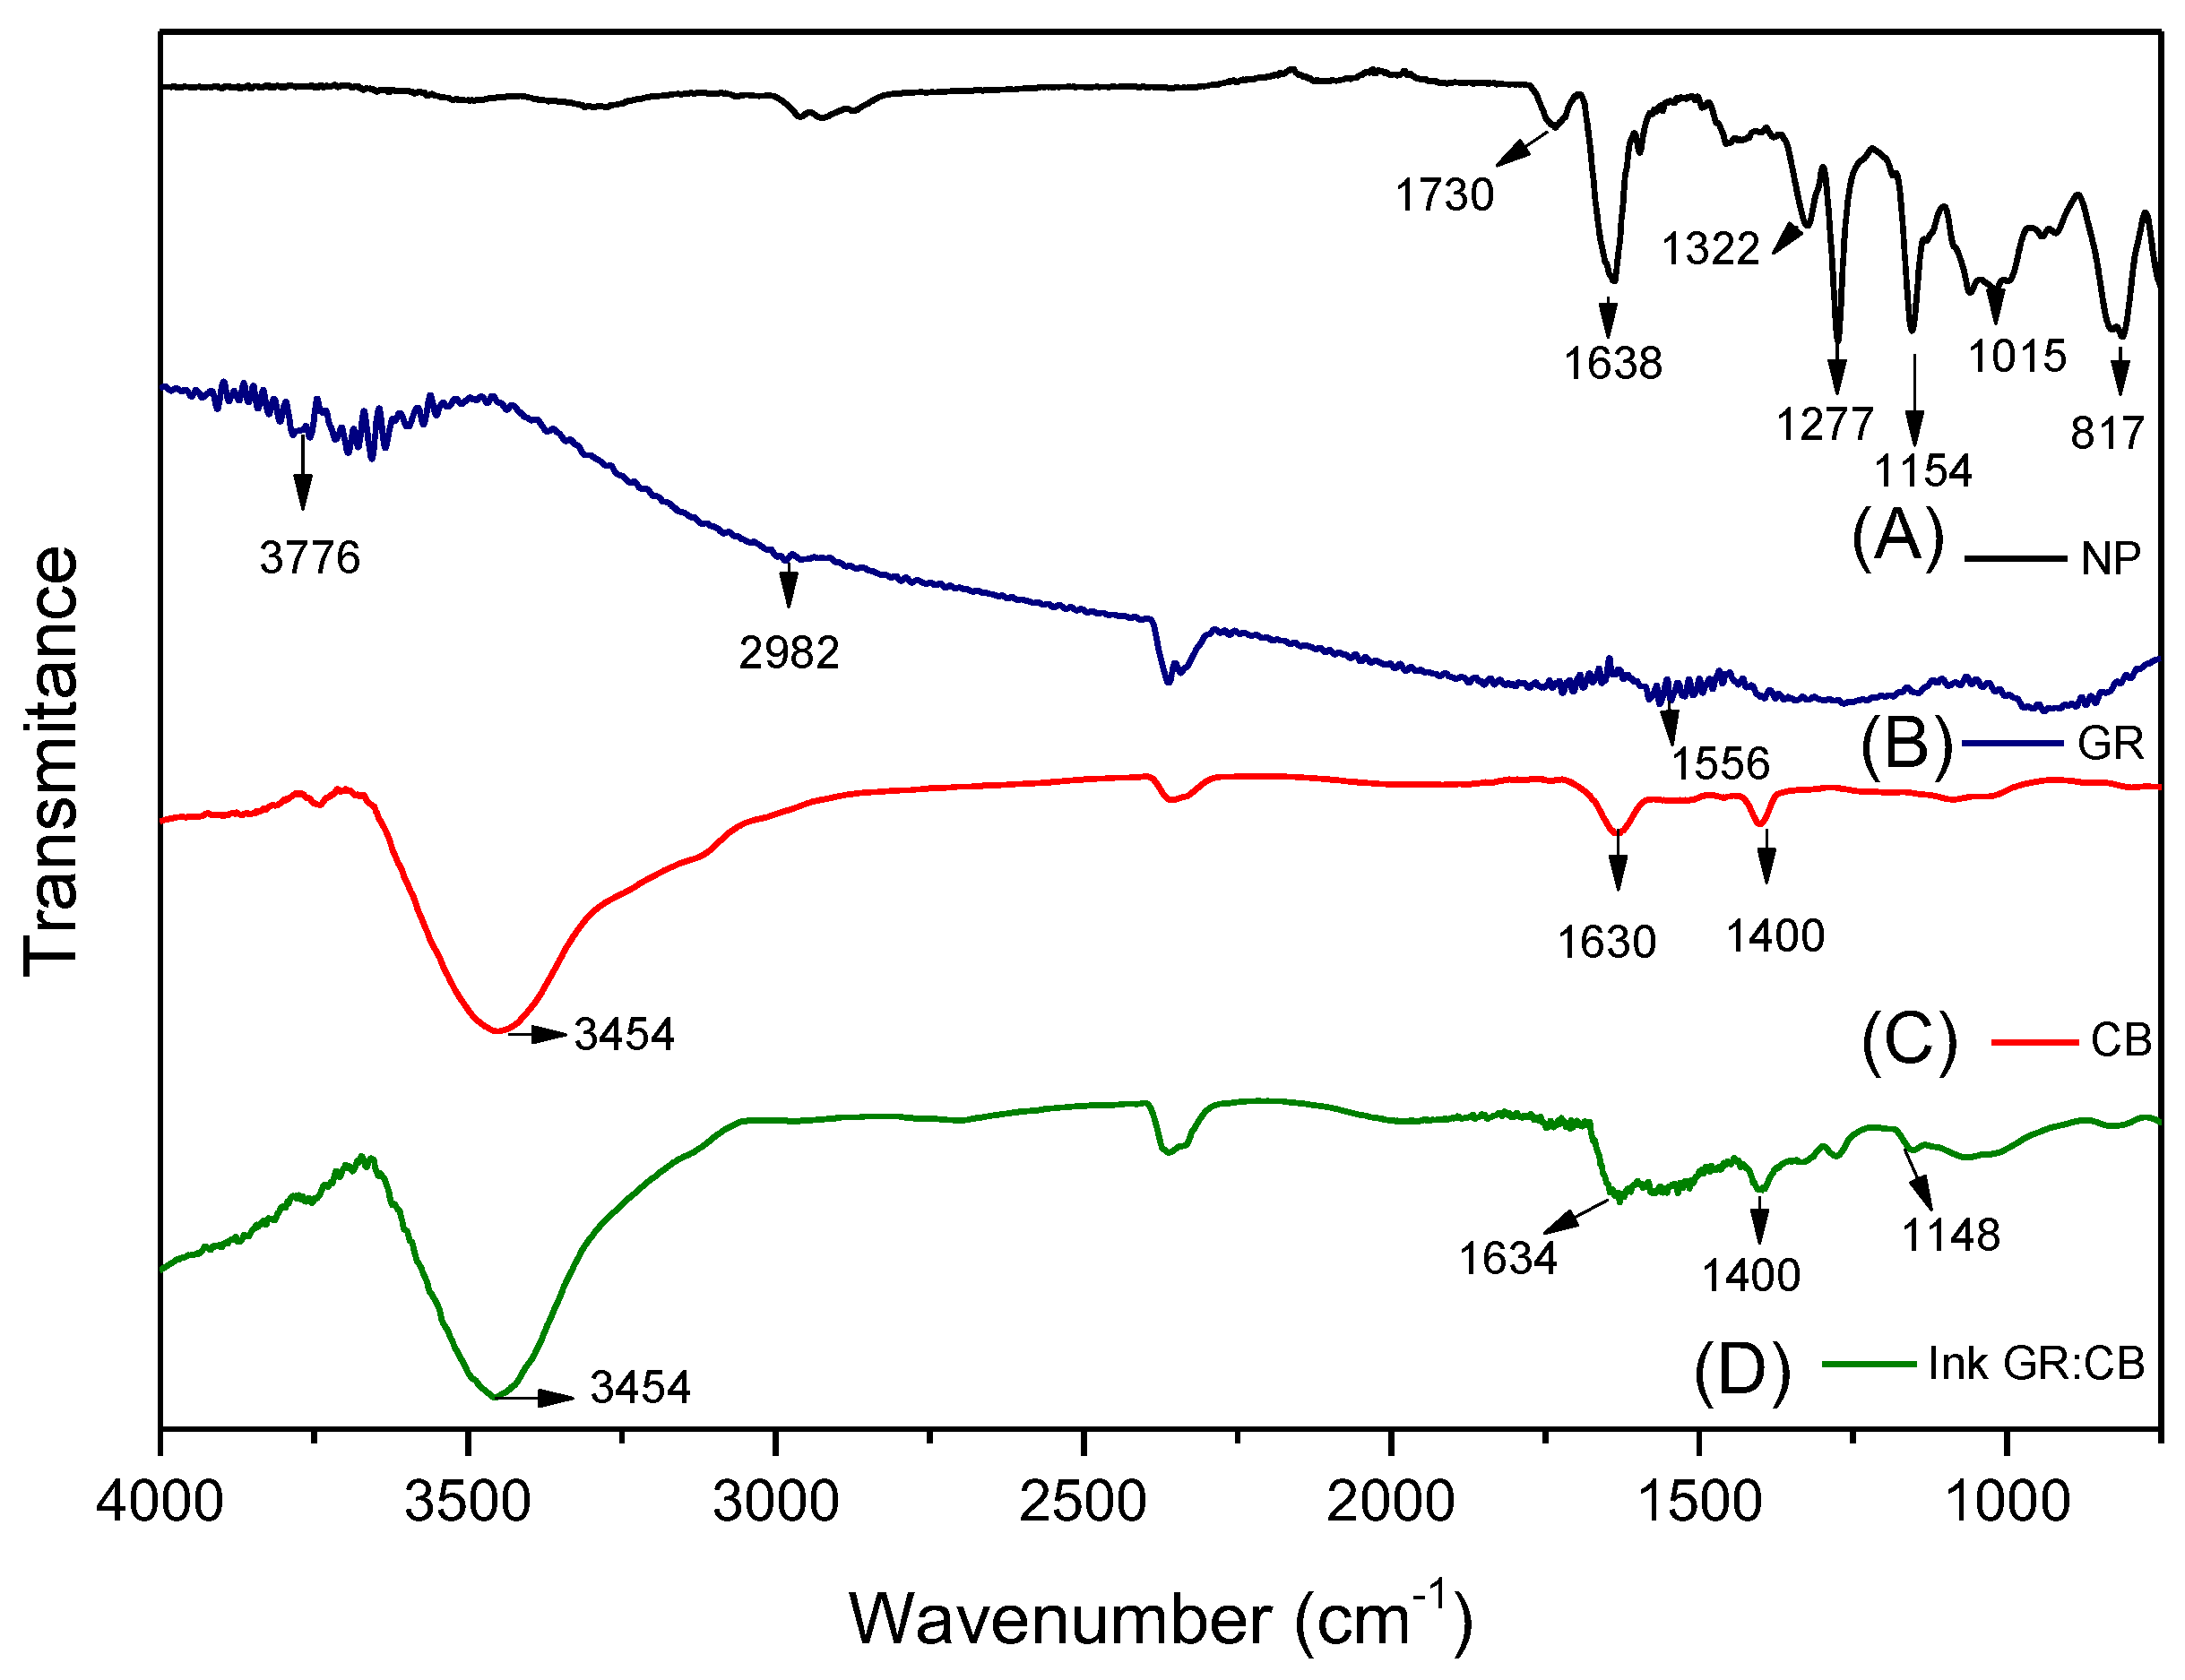
Figure 7 shows FT-IR spectra recorded for nail polish, graphite, carbon black, and ink. The spectrum of the nail polish (
Figure 7A) shows an intense band at 1730 cm
−1 of the stretching of the C=O bond, characteristic of ester carbonyls, and at 1638 cm
−1 of stretch, corresponding to the C=C bonds from aromatic rings. The band at 1448 cm
−1 is characteristic of primary amine N-H folding. The band at 1322 cm
−1 is due to the C-O stretches from saturated alcohols, and the band at 1277 cm
−1 is probably due to the C-N stretch of amine groups. Two peaks were also observed between 1136 cm
−1 and 1055 cm
−1, characteristic of stretching of carbonyl groups. The band at 817 cm
−1 that characterizes the =C-H bonds probably originates from the benzene rings. These bands are characteristic of the components in nail polish, such as nitrocellulose, resins, and toluene present in their composition [
17,
28].
The FT-IR spectrum of graphite, the band at 3776 cm
−1, attributed to the stretch OH groups, probably due to the presence of water in the material. The band, characteristic of carbonaceous materials, was observed at 2982 cm
−1, and can be assigned to the C-H stretches. The band at 1556 cm
−1 is characteristic of the -C=C- stretches [
29].
The FT-IR spectrum of carbon black is shown in
Figure 7B. The band at 3445 cm
−1 corresponds to the –OH stretching vibration from the absorption of water or hydroxyl groups present in the material. The band at 2344 cm
−1 is probably due to atmospheric CO
2. The band at 1612 cm
−1 is attributed to the C=C stretching vibration present in the material. The band at 1428 cm
−1 is attributed to carbonyl groups [
17,
29]. The FT-IR results show that CB has a structure with oxygenated functional groups. Functional groups allow modification of the electrode surface in order to improve sensitivity. The spectrum obtained for the ink presents coherence, showing the same bands as the materials analyzed.
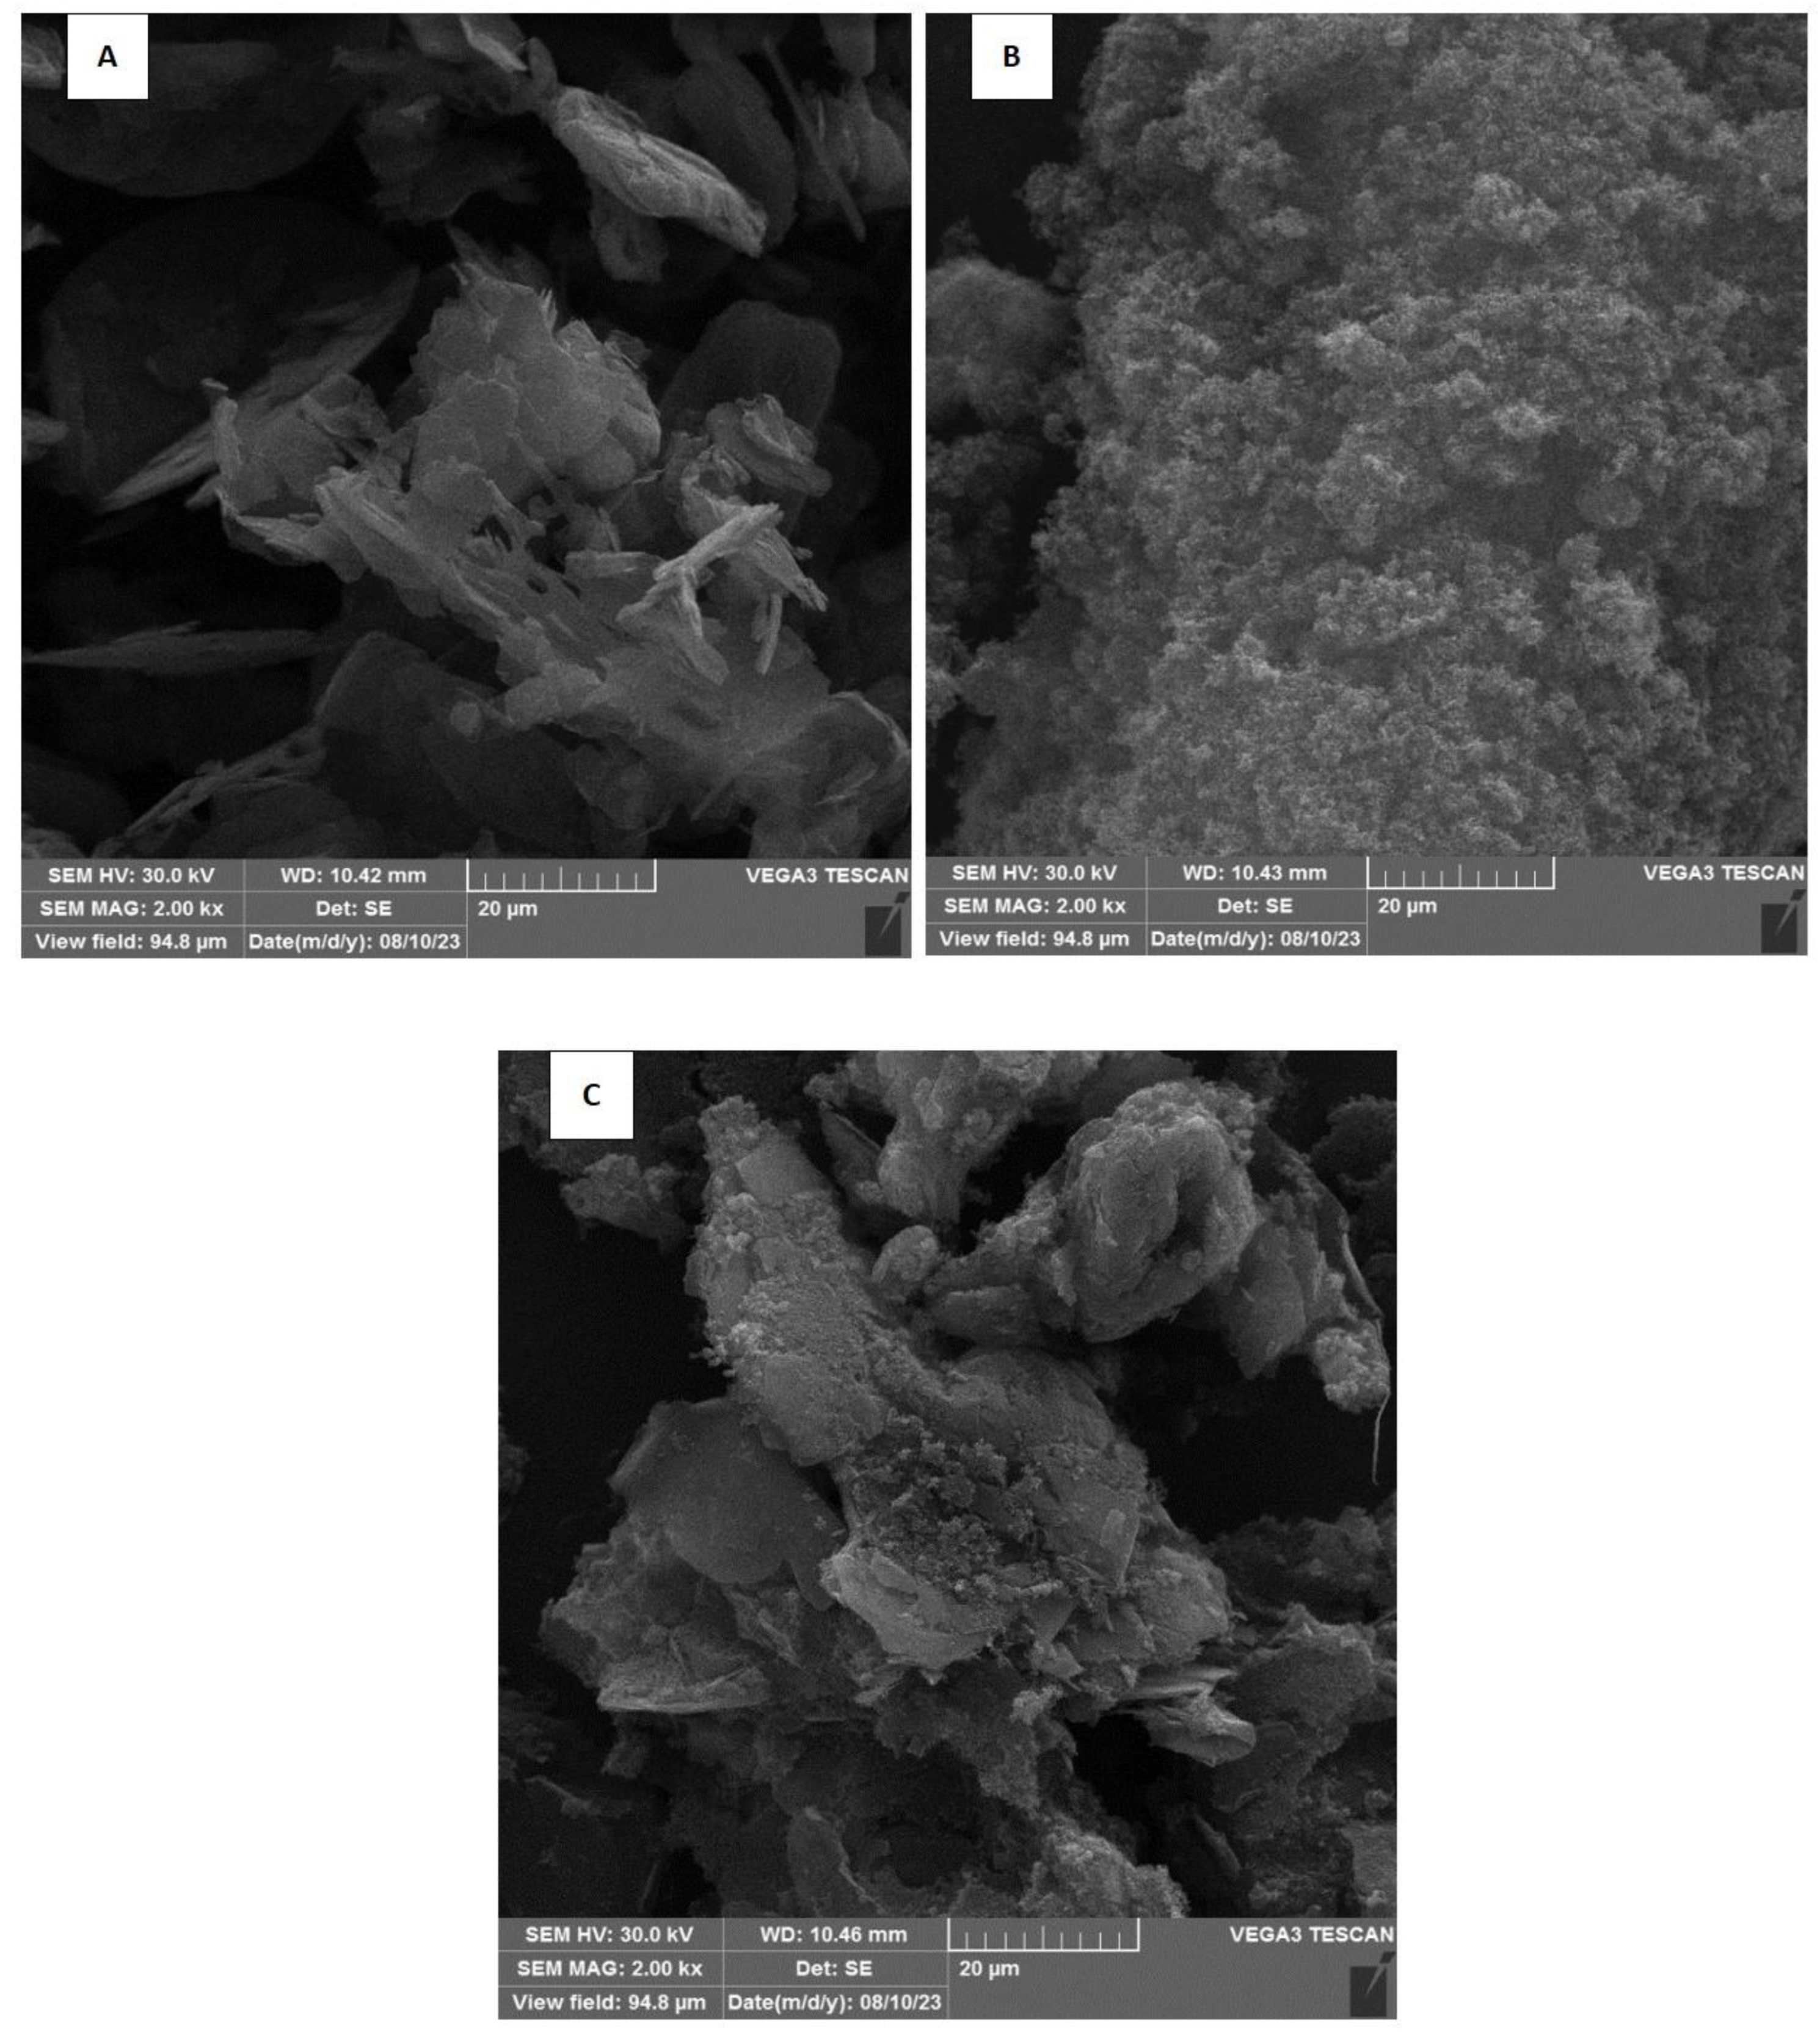
3.5. MEV Characterization
SEM characterized the morphologies of the materials. The graphite image (
Figure 8A) indicates a characteristic lamellar structure, without homogeneous formation [
30]. The SEM image of CB presents spherical particles (
Figure 8B). It shows the aggregation of these particles, probably due to interactions such as hydrogen interaction, attributed to the hydroxyl, carbonyl, and carboxyl functional groups on the surface (evidenced in FT-IR characterization) [
29]. The image of the ink obtained shows the materials used are distributed and adjacent to each other, showing the formation of a granular morphology of the conductive ink, which tends to provide the largest electroactive area and stimulate faster electron transfer (
Figure 8C).
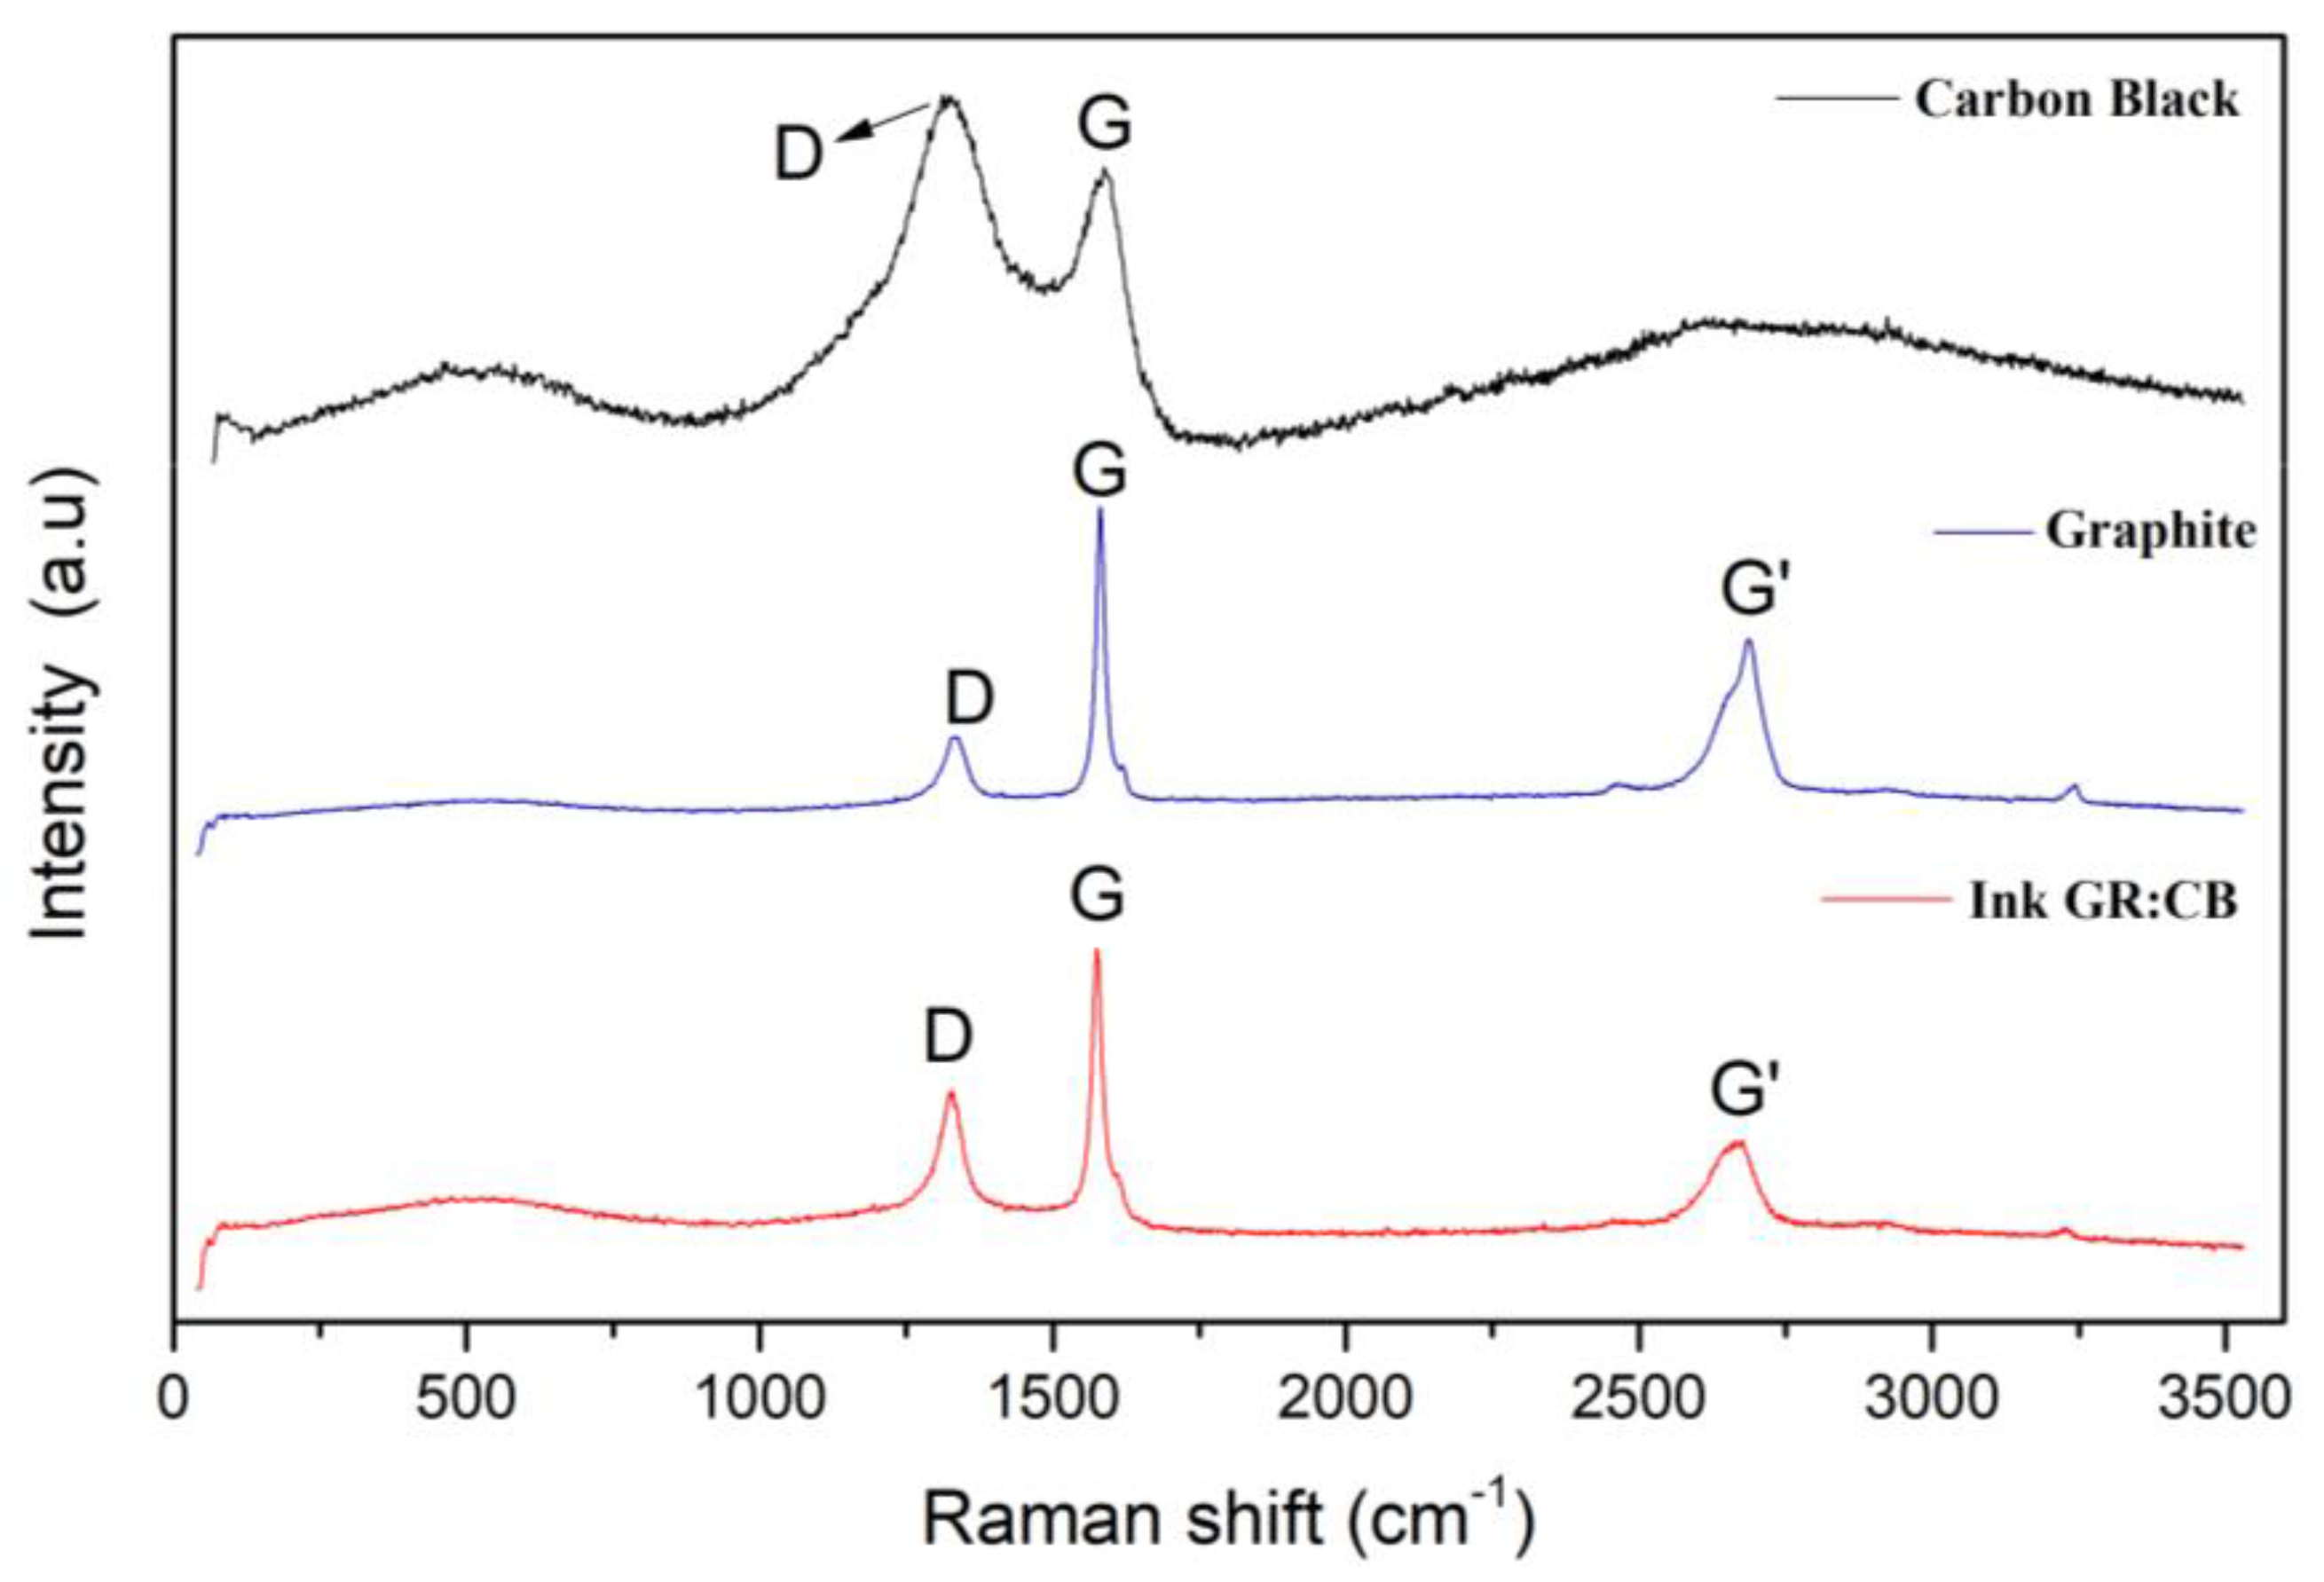
3.6. Raman Characterization
The materials and conductive ink were also analyzed by Raman spectroscopy. From the Raman spectra (
Figure 9), it is possible to observe the fingerprints of carbon allotropes due to the presence of the bands D (disorder), G (graphitic), and G’ (second-order modes of the D band), with a high degree of organization [
31]. The G band, located at approximately 1330 cm
−1, present in all spectra, indicates the presence of sp
2 carbon in the plane. The D band around 1570 cm
−1 is characteristic of sp
3 hybridized carbons and defects in the structure of the material. The G band present at approximately 2690 cm
−1 is characterized as a D band overtone and does not necessarily indicate the presence of defects. The Raman spectrum for the CB sample presents a band around 1320 cm
−1, attributed to the D band, which is characteristic of a structure with defects, which may be justified by the presence of oxygenated groups in this material. The G band around 1583 cm
−1 may be related to the C=C vibrations that are present in carbonaceous materials [
32]. For the GR sample, the D band located at 1328 cm
−1 is less intense when compared to the G band at 1578 cm
−1, characterizing a material with a high degree of crystallinity. The difference in the intensity of the band and the mid-height of the D and G bands may be related to the structural disorganization of the material. For the GR:CB ink sample, it is possible to observe a behavior similar to that of the GR sample, which indicates a material with a more organized structure. To characterize the degree of defects in the graphitic structure, its value is quantified through the ratio of the intensities of the D and G bands (ID/IG): the lower the value of the ratio (ID/IG), the lower the number of defects in the carbon structure. The results obtained for the ID/IG ratio were 1.28 CB, 0.37 GR, and 0.62 GR:CB ink. The values presented indicate that the CB presents a higher degree of disorder in the structure. The ink presented an intermediate ratio of the precursor materials (GR and CB), which can be justified by the presence of CB, altering the graphitic structure, and presenting a higher degree of defect when compared to the value of the ratio for the graphite sample. Therefore, the results indicated that the final composition of the ink has the presence of precursor materials used in the synthesis [
33,
34].
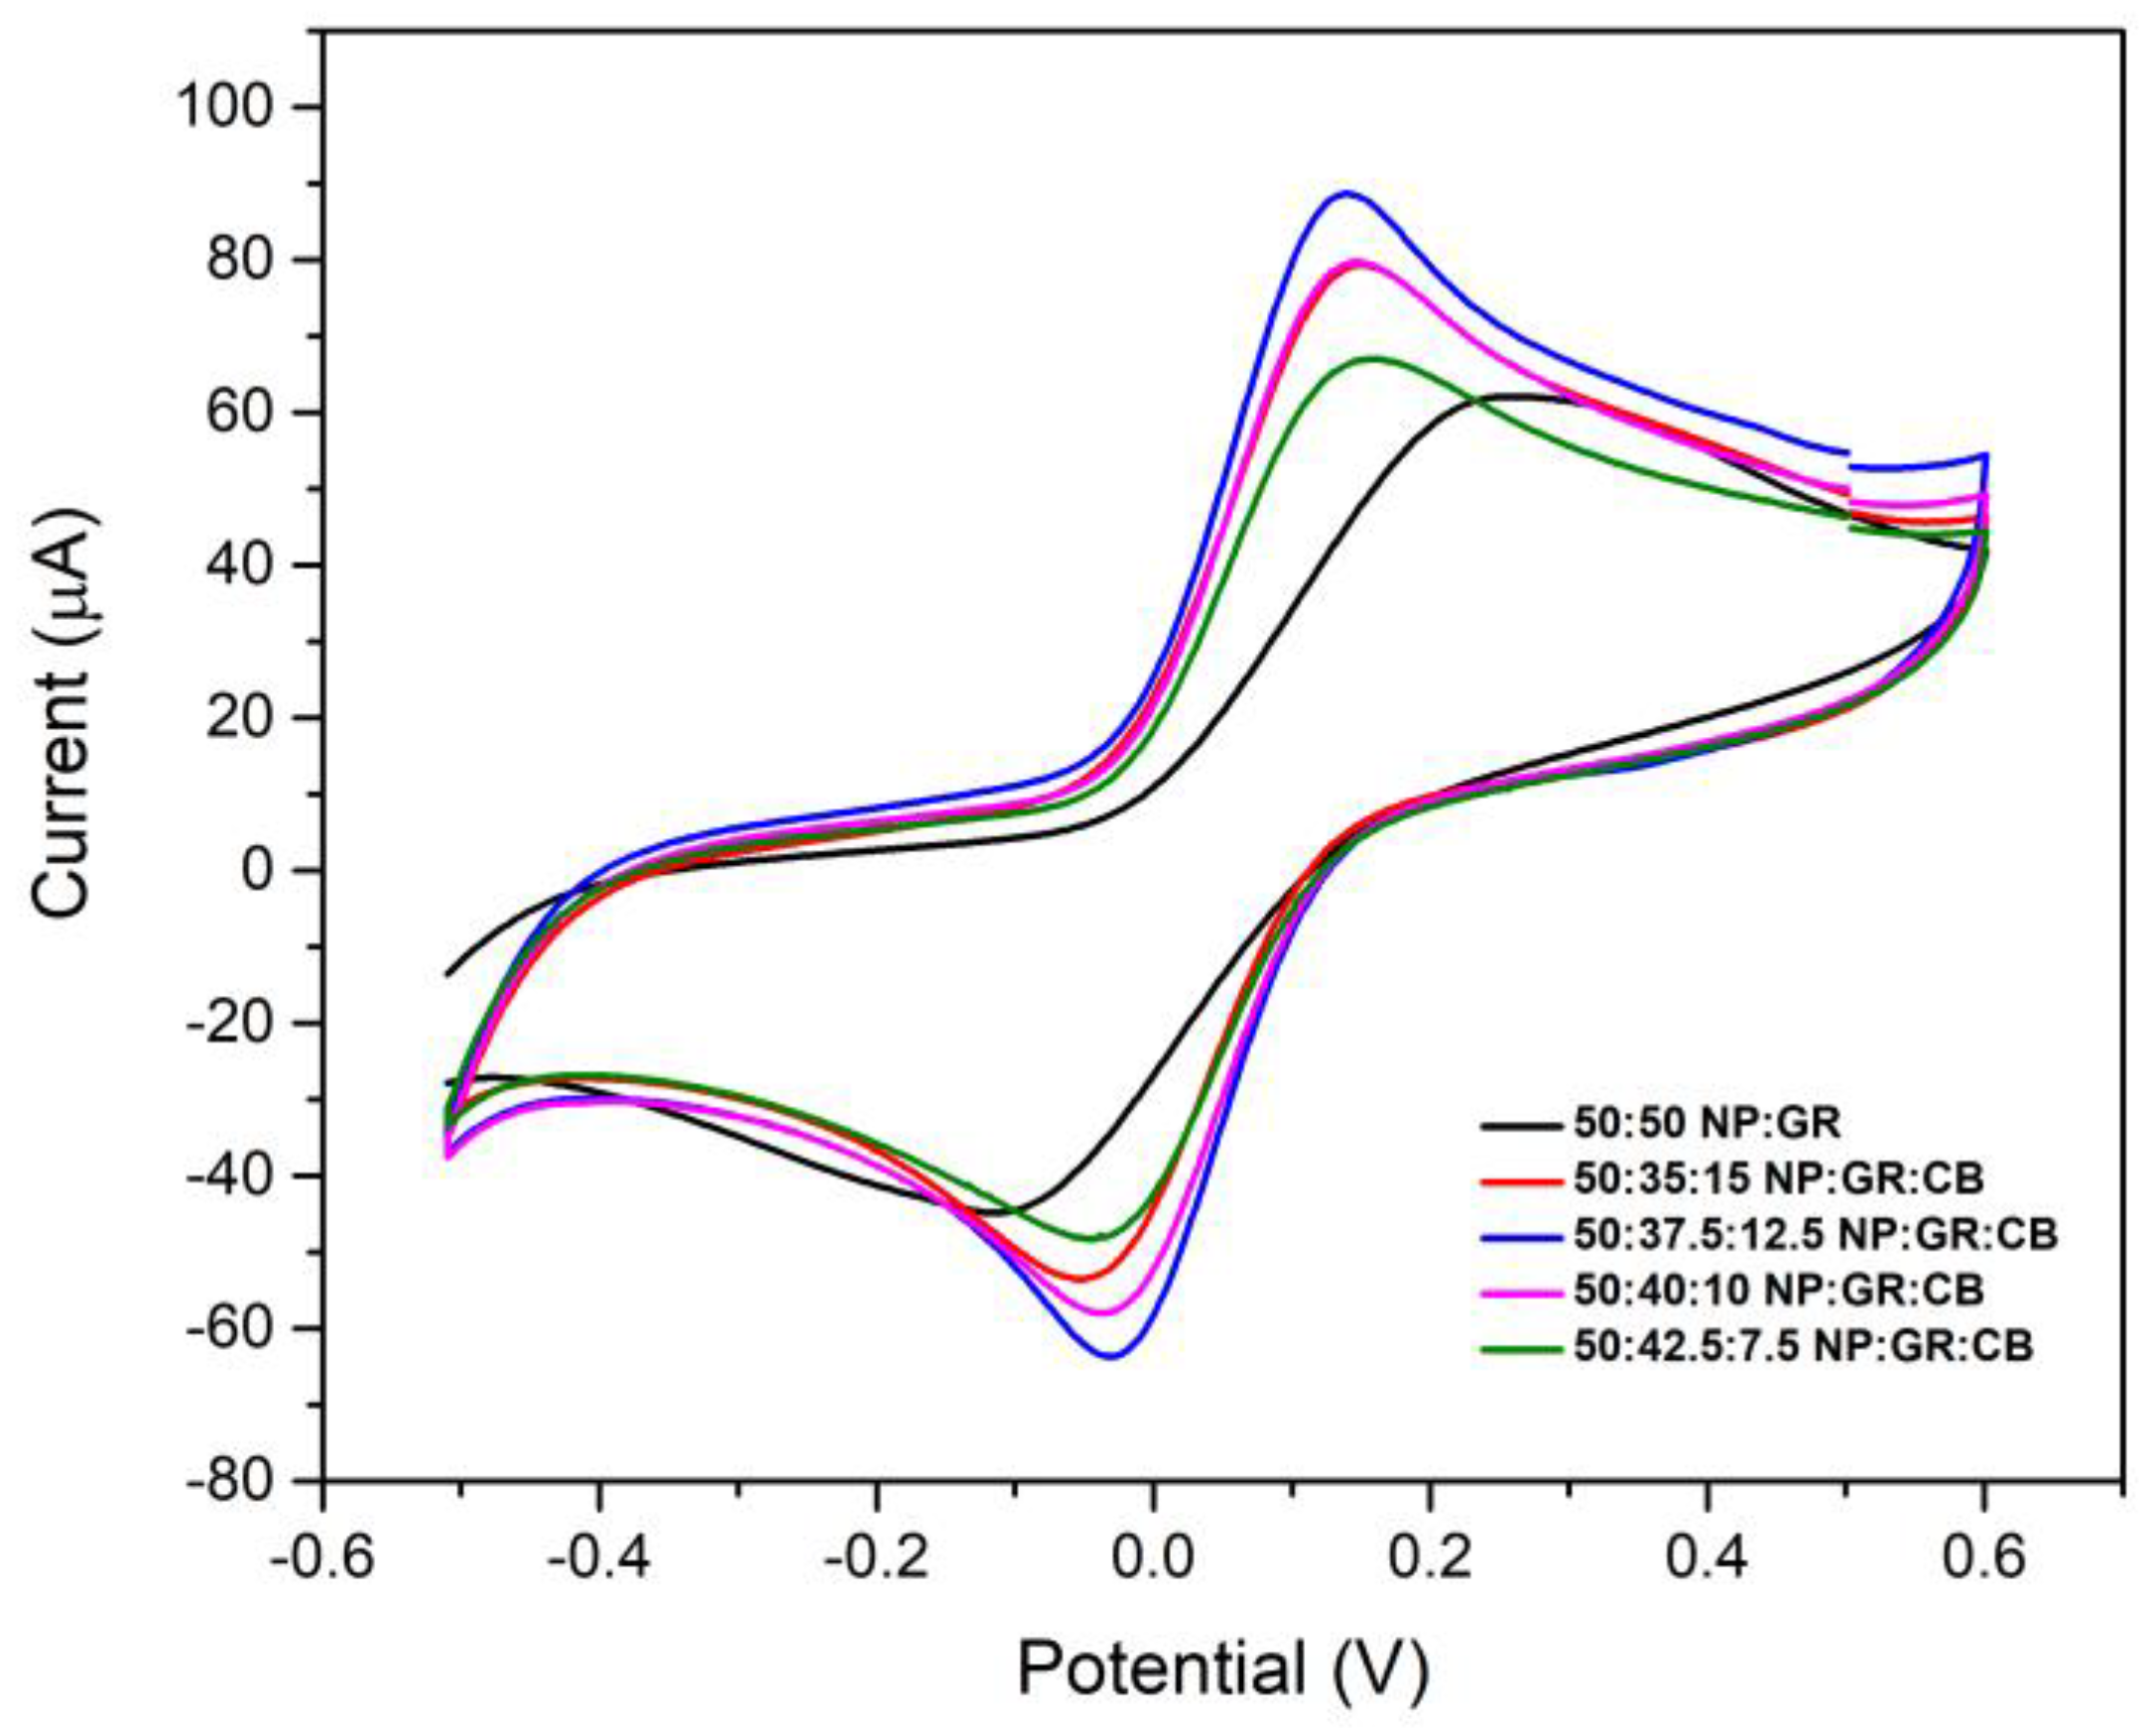
3.7. Conductive Ink Optimization
The main factor that can affect the electrochemical performance of conductive ink is the proportion of materials used, such as conductive materials and binders. In this way, some inks were prepared by varying the proportions of GR, CB, and NP to obtain the best composition for the final ink. Optimization was performed using cyclic voltammetry (CV). The voltammograms are shown in
Figure 10 and were obtained in the presence of 2 mM [Fe(CN)
6]
−4 and 0.1 M phosphate buffer (pH 7.0). Initially, the electrochemical behavior of the ink was evaluated by varying the proportion of conductive material, fixing the amount of nail polish at 50% of the total composition.
According to the electrochemical profile shown in
Figure 10, in the sample containing 37.5 GR and 12.5% CB, the ink showed good electrochemical performance, with an increase in current, in addition to excellent adhesion to the PET support. For the ink with the proportions of 35% GR and 15% CB, a lower electrochemical performance was observed, and the ink did not fix well on the surface of the support when printed. This fact may be related to the increase in the amount of CB compared to the previous proportions since the increase of this material can hinder the adhesion of the ink because it is more voluminous than graphite. Inks in the 40:10% and 42.5:7.5% GR:CB ratios have a lower performance, with lower reversibility and less defined anodic peaks. The lower conductive performance of these may be associated with the small amount of CB present in its composition, since it is used in the production of inks to improve the conductive characteristics and increase the surface area, thus improving the electronic transfer process. Thus, we opted for the ink composed of 37.5% GR and 12.5% CB, and then the parameters for optimizing the proportion of NP were evaluated.
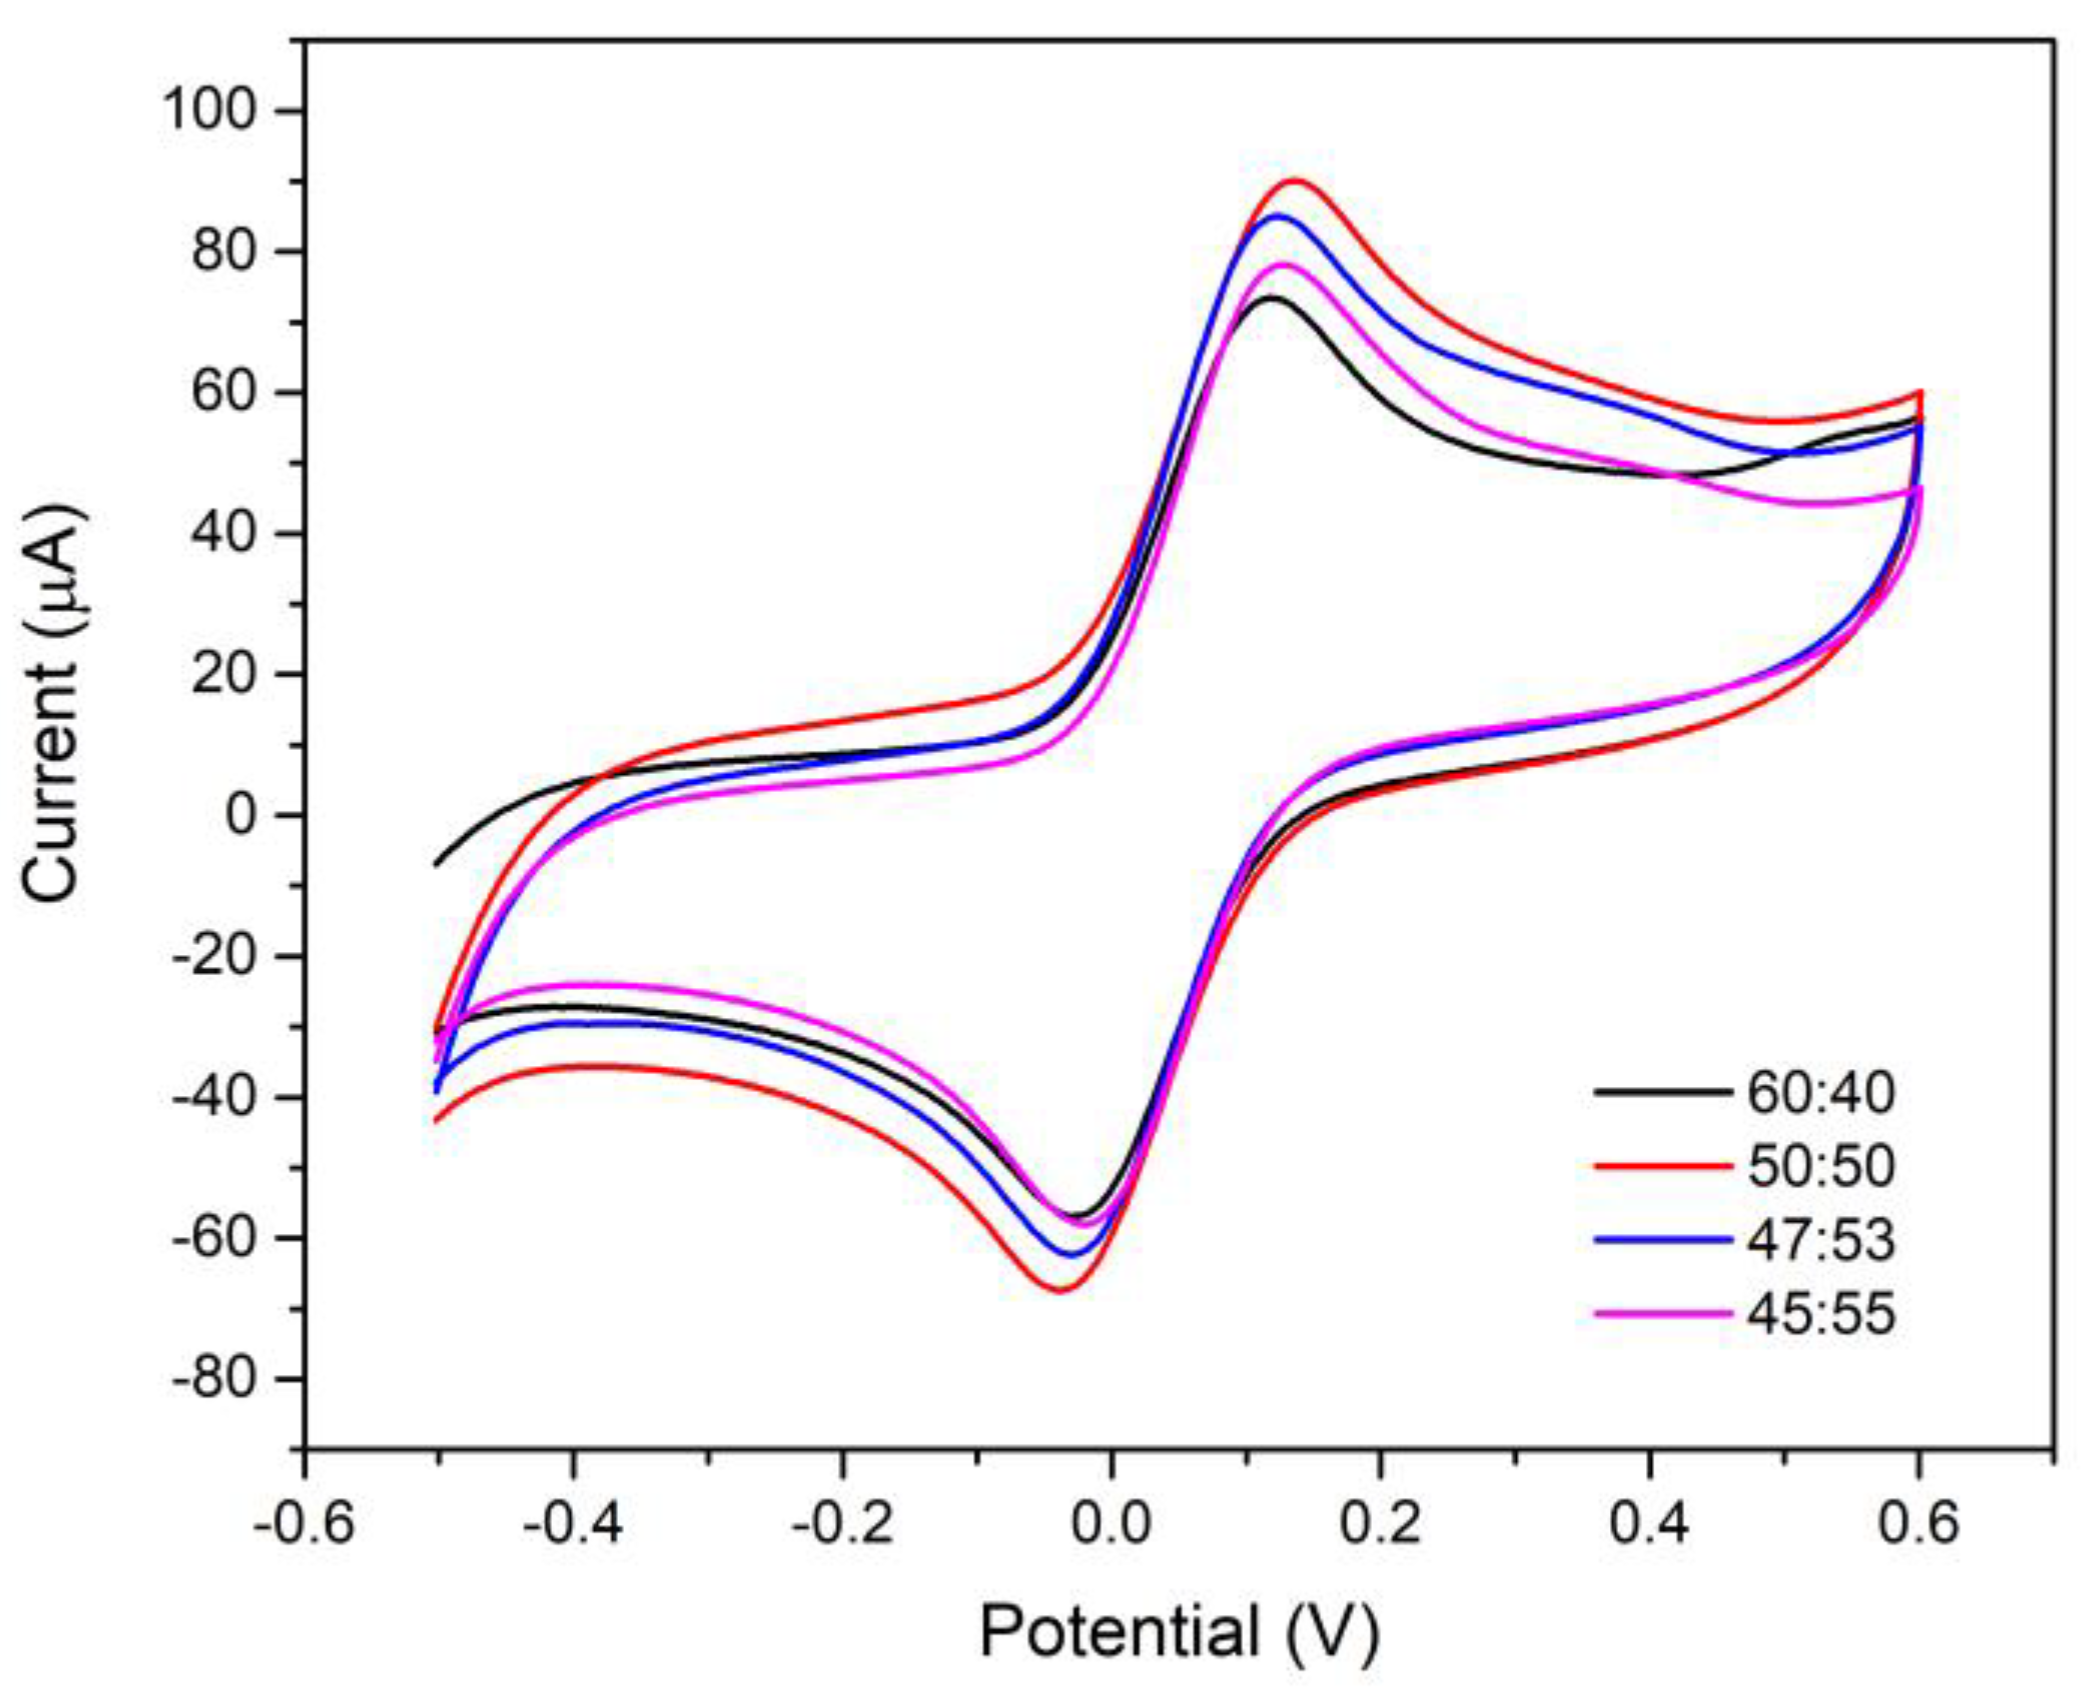
The amount of carbonaceous material (GR:CB) used was equivalent to the amount optimized in the previous study, varying only the amount of nail polish (
Figure 11). The ink resulting from the 60:40 ratio (carbonaceous material and nail polish), when printed, did not present good adhesion to the PET sheet, in addition to presenting high viscosity, hindering the printing process via the screen-printing technique. The 50:50 ratio showed good electrochemical performance, but the CB detached from the PET surface, making the applied printing process unfeasible. Furthermore, the capacitive current was higher when compared to other compositions, which may be correlated to the detachment of CB in the solution. For the 47:53 ratio, better homogeneity with lower viscosity was observed, as well as better suitability for the screen-printing process. In addition, it presented the best voltammetric profile, with more defined peaks and greater reversibility. Finally, the ink was analyzed in the 45:55 ratio where it showed a good homogeneity, but the electrochemical profile showed a decrease in current due to the excess of nail polish, which has insulating characteristics, hindering the process of transferring charges. Therefore, the optimal proportion chosen for the printing of the electrodes was the ink composed of 47% carbonaceous material and 53% nail polish.
3.8. Electroanalytical Performance of the Sensor Printed with the Developed Ink
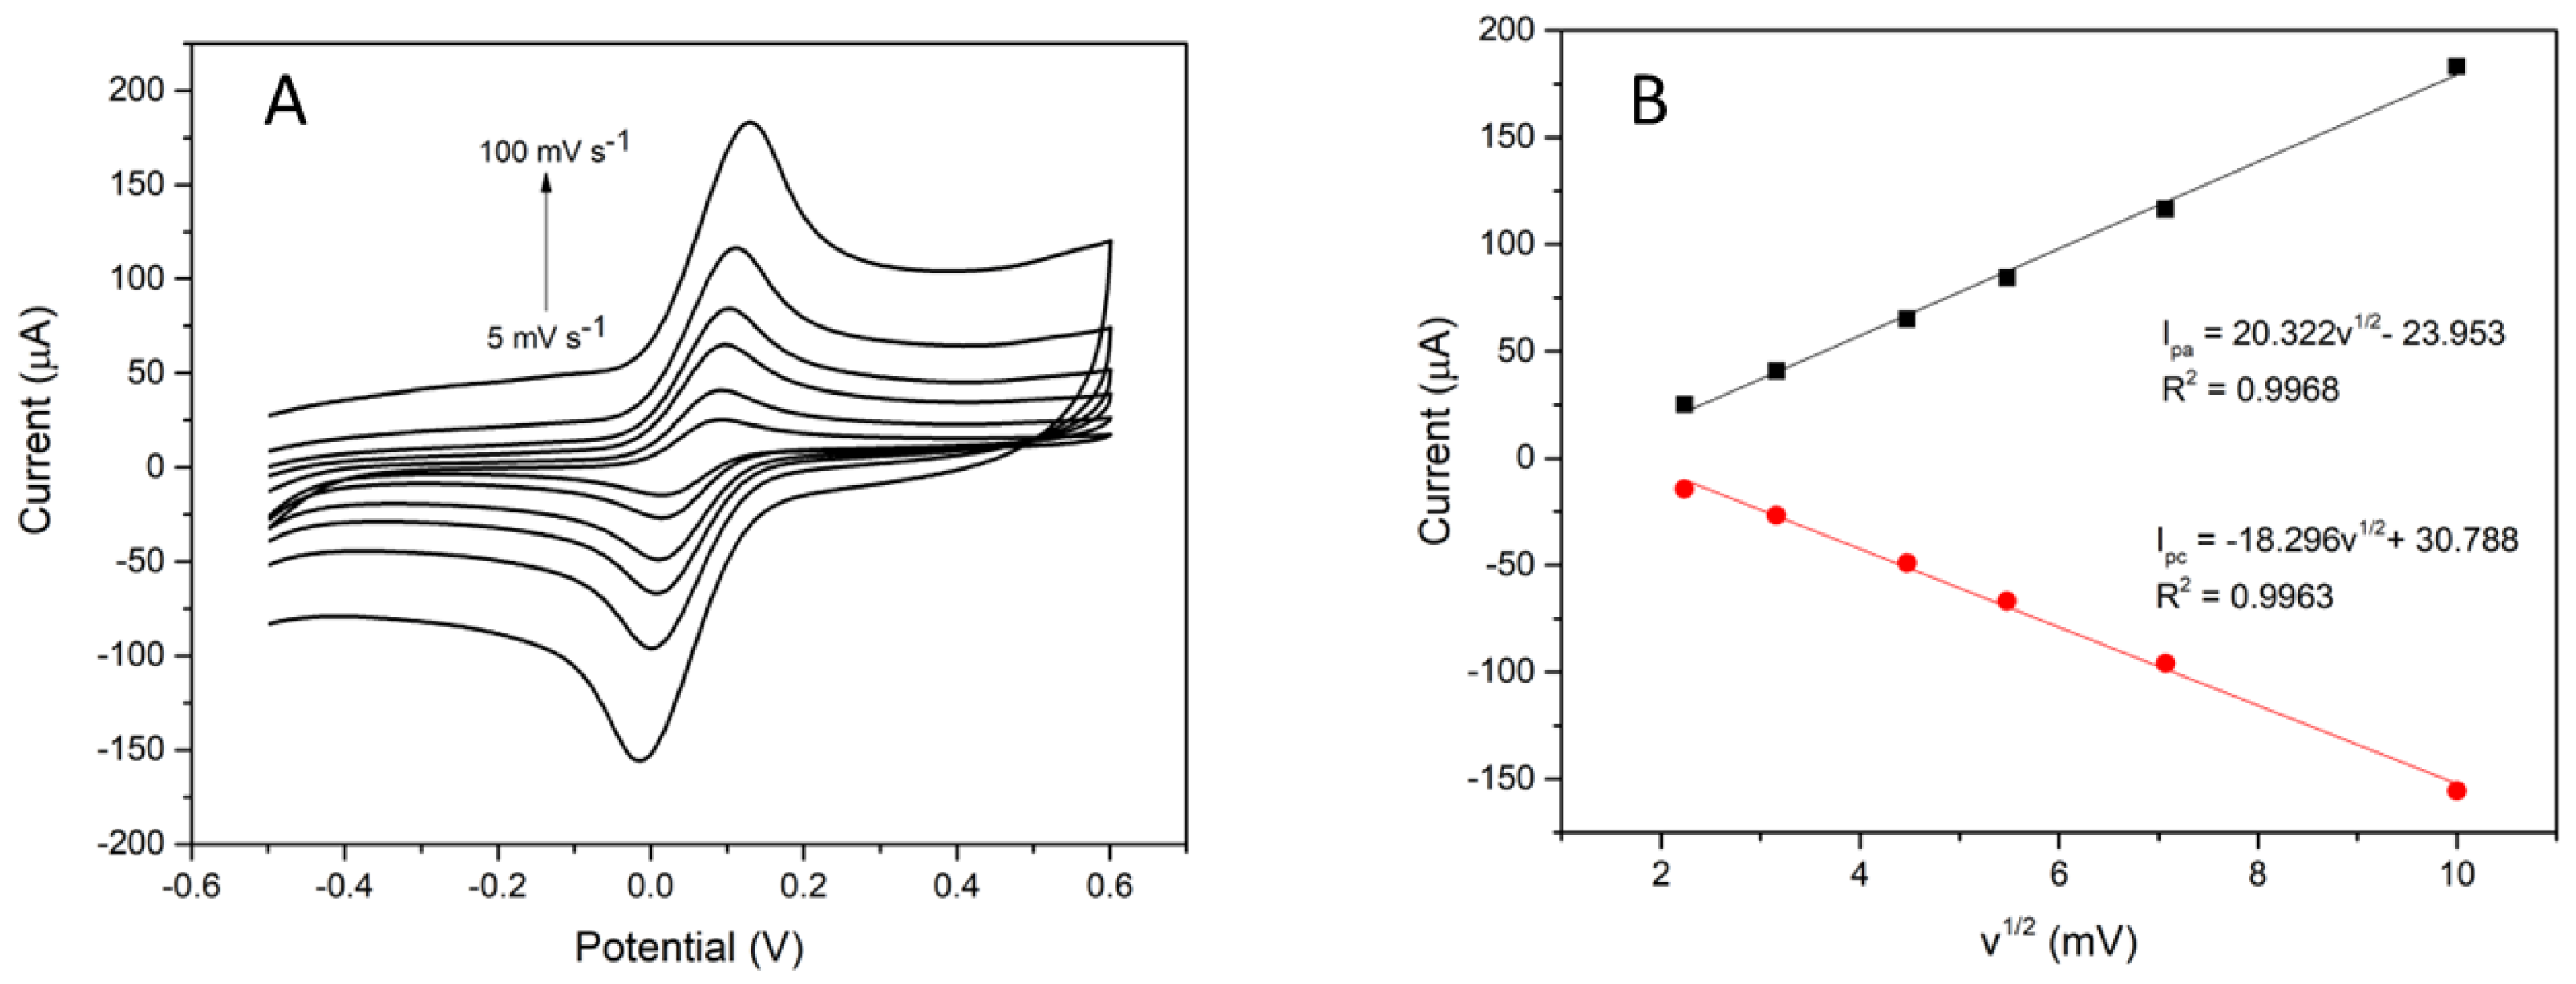
The electroactive surface area for the electrode printed with graphite-based ink and carbon black was obtained from cyclic voltammetry analyses for 2.0 mM of K
4[Fe(CN)
6] in 0.1 M of phosphate buffer at different scan rates. The results are shown in
Figure 12. These results show that with the increase in the scan rate, there is an increase in the current intensity. The electroactive area was calculated according to the Randles-Sevcik equation [
35]. By rearranging the equation and isolating the area, it is possible to obtain information about the electroactive area of the electrode. The first term of the equation refers to the slope of the lines obtained, and the other variables are as follows: n is the number of electrons (n = 1); A is the electroactive surface area of the electrode (cm
2); C is the concentration of K
4[Fe(CN)
6] (C = 2 × 10
−6 mol cm
3); and D is the diffusion coefficient (cm
2 s
−1) (D = 7.6 × 10
−6 cm
2 s
−1, for [Fe(CN)
6]
4- at 25 °C). Solving the equation shows that the electroactive area for the electrode is 13.7 cm
2.
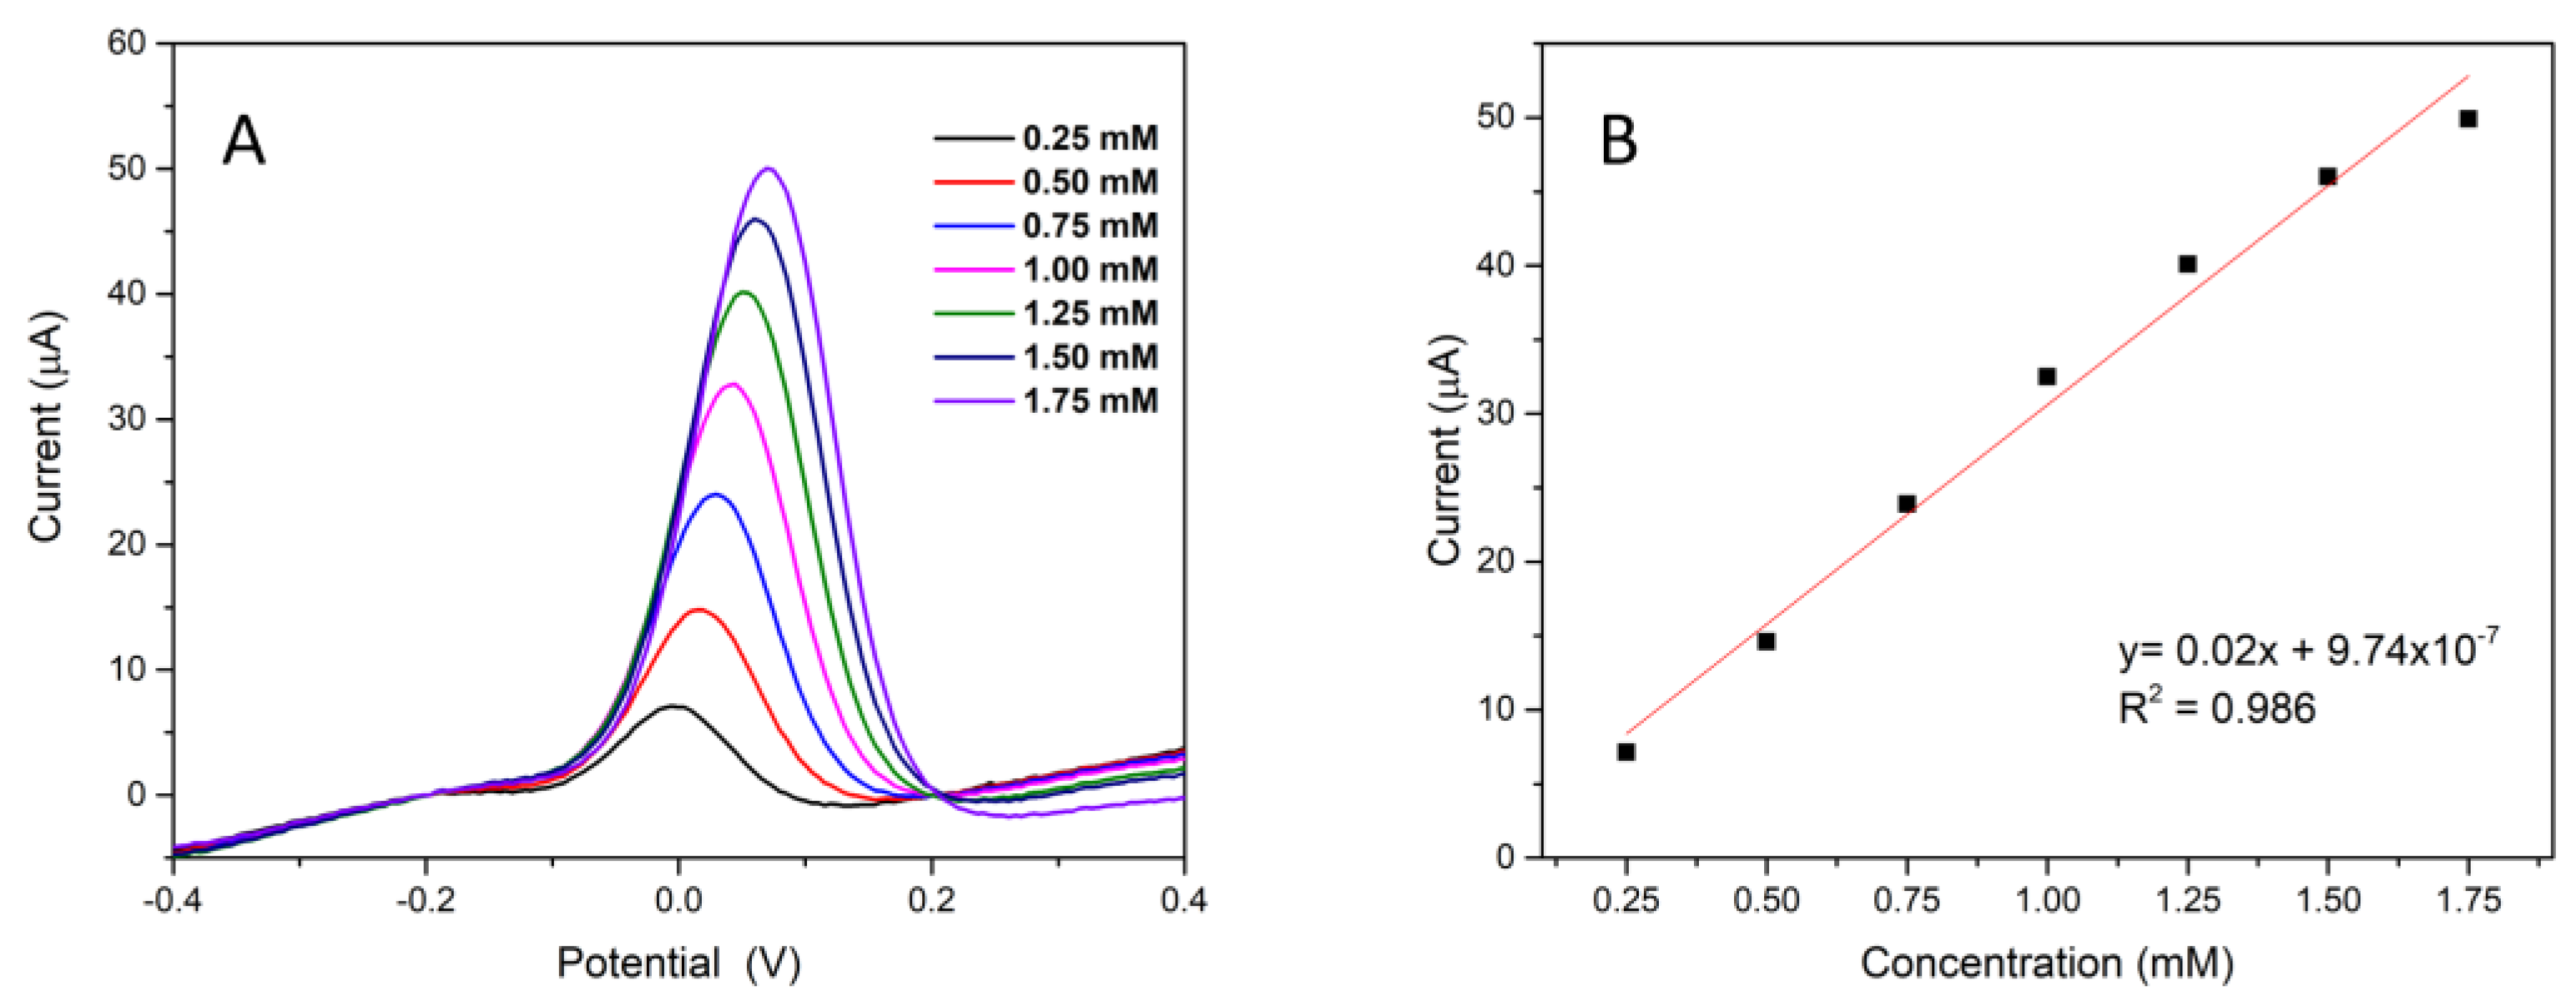
The printed electrode obtained with the developed ink was used to investigate the analytical applicability at different concentrations of potassium ferrocyanide. The measurements were performed using the differential pulse voltammetry (DPV) technique in 0.1 M phosphate buffer and pH 7.0.
Figure 13 shows the differential pulse voltammogram and the calibration curve. The peaks in the voltammogram show the increase in the intensity of the current with the gradual increase in the concentration of the probe. The analytical curve (peak current vs. concentration) was also obtained, and the results showed an excellent sensor response as a function of ferrocyanide concentration. The analytical curve was linear from 0.25 to 1.75 mM, according to the equation: Ip (μA) = 0.02 × (µ A L mmol
−1) + 9.74 10
-7. This study illustrates that the graphite and carbon black-based sensor has the potential to be applied as an electrochemical sensor.
Another important factor to be highlighted is the stability of the sensor’s analysis cycles during measurements. For this, 25 consecutive cyclic voltammograms were performed for the printed electrode at a scanning speed of 50 mV s−1 in 0.1 M phosphate buffer and 2.0 mM potassium ferrocyanide. The anodic peak response value for the first cycle was 69.8 μA, and in the last cycle, the value was 63.5 μA, representing a loss of signal intensity of approximately 9% after 25 cycles. Therefore, these results demonstrated good stability of the sensor, which can be used for several consecutive cycles without losing efficiency.
Reproducibility was assessed with 10 electrodes constructed in the same way, and one measurement was performed with each electrode (n = 10). The results obtained showed an RSD of 1.34%. These results were considered adequate (RSD < 10%), especially considering that the production process of the sensors is manual.
Another relevant factor in the production process of conductive inks for electrode printing is cost. There are many commercial carbon inks for this purpose with different values and compositions. The ink proposed in this study had a cost of US $0.09 mL−1, which is well below that of the commercial ink available. In addition to the low cost, the materials used (nail polish, graphite, and carbon black) are easily accessible, which is a positive point for the development of conductive inks.
Comparing the obtained results of resistance to electron transfer, from the sensor printed with the developed ink, with published works (
Table 1), the proposed ink showed lower resistance to electron transfer. This result can be associated with the composition of the ink with carbonaceous nanomaterial, providing a larger electroactive area.


