Article

Evaluation of Solvent Compatibilities for Headspace-SIFT-MS Analysis of Pharmaceutical Products

by
Mark J. Perkins
1,
Leslie P. Silva
2 and
Vaughan S. Langford
3,*
1
Element Materials Technology, Girton, Cambridge CB3 0NA, UK
2
Syft Technologies Inc., Los Angeles, CA 92801, USA
3
Syft Technologies Limited, Christchurch 8011, New Zealand
*
Author to whom correspondence should be addressed.
Analytica 2023, 4(3), 313-335; https://doi.org/10.3390/analytica4030024
Submission received: 30 June 2023 / Revised: 7 July 2023 / Accepted: 7 July 2023 / Published: 12 July 2023

Abstract

:
Procedures for determination of the residual solvent and volatile impurity content in pharmaceutical products usually rely on dissolution in a solvent, followed by headspace-gas chromatography (HS-GC) analysis. Whereas chromatographic systems can utilize a wide variety of solvents, direct-injection mass spectrometry (DIMS) techniques have fewer solvent options, because elimination of the chromatographic column means that the instrument is more susceptible to saturation. Since water has the lowest impact, it has almost always been the default solvent for DIMS. In this study, selected ion flow tube mass spectrometry (SIFT-MS)—a DIMS technique—was applied to the systematic evaluation of the proportion of solvent that can be utilized (with aqueous diluent) without causing instrument saturation and while maintaining satisfactory analytical performance. The solvents evaluated were N,N-dimethylacetamide (DMAC), N,N-dimethylformamide (DMF), 1,3-dimethyl-2-imidazolidinone (DMI), dimethyl sulfoxide (DMSO), methanol, and triacetin. All solvents are compatible with headspace-SIFT-MS analysis at 5% (min) in water, while DMI, DMAC, and DMSO can be used at higher concentrations (50, 100, and 25%, respectively), though suffering substantial diminution of the limit of quantitation for non-polar analytes at higher proportions of non-aqueous solvent. Analytical performance was also evaluated using linearity, repeatability, and recovery measurements. This work demonstrates that organic solvents diluted in water can be utilized with headspace-SIFT-MS and provide an approach for evaluation of additional diluent solvents.

Graphical Abstract

1. Introduction

Conventional analysis of volatile organic compounds in the pharmaceutical industry (VOCs)—whether as residual solvents [1,2,3], byproducts of synthesis, mutagenic impurities formed during synthesis, migrants from packaging, etc. [4,5,6]—utilizes gas chromatography (GC)- or liquid chromatography (LC)-based approaches. Typically, VOCs are analyzed using a headspace approach with GC; for ease of quantitation, this involves dissolution of the product/article in solvent. The great advantage of chromatography techniques is that they offer tremendous flexibility in terms of solvent compatibility; through judicious column selection and temperature ramping, the solvent can be temporally separated from the analytes, protecting the system from overloading. However, chromatographic separation often becomes the rate-limiting step.
To address this throughput challenge, and the related long time needed to report analytical results, direct-injection mass spectrometry (DIMS) approaches may be considered. DIMS methods, such as selected ion flow tube mass spectrometry (SIFT-MS) and proton transfer reaction mass spectrometry (PTR-MS), use chemical ionization to directly ionize VOCs in air and mass spectrometry to differentiate the resulting product ions [7,8], removing the necessity for chromatographic separation. Most organic solvents are readily ionized by the SIFT-MS reagent ions, due to their low ionization energies and/or high proton affinities [9]. It should be noted, however, that these techniques only analyze VOCs from the gas phase; they cannot analyze samples from liquid injections.
Of these DIMS techniques, SIFT-MS is the one currently being introduced into pharmaceutical industry VOC analysis workflows, with an alternative procedure to USP <467> described recently, together with a side-by-side comparison with the incumbent GC-flame ionization detection (GC-FID) [10,11]. These studies, however, are characteristic of the broader headspace-SIFT-MS literature, in which the solution systems investigated are aqueous based [12]. Recent examples include the headspace of water [13,14] and blood [15]. To the best of our knowledge, use of non-aqueous solvents with headspace-SIFT-MS has not been described in the literature, except for a brief case study describing methanolic extraction of benzene and related aromatics from soil [16,17].
This gap is explicable because, in SIFT-MS, an unseparated sample is introduced continuously into the ionization chamber (flow tube) [12]. When high levels of organic solvent are present in the sample, these consume the reagent ion signal, potentially disrupting quantitation and reducing selectivity. Quantitation is perturbed because the concentration is determined from the ratio of product ion signal to the unreacted reagent ion signal [18]. Hence, if the reagent ion signal is significantly depleted, then overreporting of concentrations occurs (Figure 1) and the instrument operates outside of its dynamic range. It should be noted, however, that utilization of calibration [16] for quantitation rather than a first-principles concentration calculation [18] provides improved performance when reagent ion depletion occurs in the 10−50% range. Selectivity can be affected by more complex (secondary) reactions occurring at higher concentrations (dependent on the solvent properties) and isotopologues such as 13C and 18O being significantly more abundant. If these issues can be mitigated through appropriate diluent solvent selection, then it is technically feasible to use solvents other than water.
Clearly, broader application of SIFT-MS in the pharmaceutical industry must address this limitation, because a significant proportion of test articles are insoluble in water [2,19]. This study provides the first systematic, empirical investigation of the compatibility of non-aqueous solvents, determining the range of dilutions in water that appear practically usable through evaluation of the linearity and repeatability performance for a 14-component VOC mix. Six potentially compatible solvents were identified (Table 1), each with a combination of these desirable properties: miscible with water to some extent, have low volatility and/or poor headspace partitioning when mixed with water, and/or exhibit poor sensitivity with the SIFT-MS reagent ions. N,N-Dimethylformamide (DMF) and dimethyl sulfoxide (DMSO) were evaluated because they are widely used by the pharmaceutical industry, including for dissolution of water insoluble products in the United States Pharmacopeia’s (USP) Residual Solvents procedure, monograph chapter <467> (USP<467>) [2]. N,N-Dimethylacetamide (DMAC) is favored as a popular alternative procedure to USP<467> [19]. Triacetin and 1,3-dimethyl-2-imidazolidinone (DMI), although currently not as widely utilized, were appraised due to their relatively low vapor pressures; a physicochemical property of solvents that means they may accommodate less aqueous dilution and/or higher incubation temperatures than more volatile solvents can. Finally, methanol was trialed based on earlier success in soil analysis [16,17]. Since DMI was observed to be compatible with headspace-SIFT-MS over the widest dilution range, it was utilized to evaluate the limit of quantitation (LOQ) and recovery performance for an aspirin pharmaceutical product. This study expands the applicability of SIFT-MS in pharma by (1) determining the range of concentrations over which the selected solvents can be used, and (2) providing a workflow for evaluating compatibility.

2. Materials and Methods

2.1. Automated SIFT-MS Analysis

The SIFT-MS technique has been described in detail elsewhere [12,18,20]. Briefly, SIFT-MS is a DIMS technique that analyzes air and headspace continuously using ultra-soft chemical ionization, which efficiently ionizes a very broad range of VOCs but does not ionize the bulk constituents of air. A microwave discharge in air is used to generate reagent ions, with eight available (H3O+, NO+, O2+•, O−•, OH, O2−•, NO2, and NO3) on the SIFT-MS instrument used in this study (Voice200ultra; Syft Technologies Limited, Christchurch, New Zealand) [21]. Rapid switching of reagent ions provides high specificity, because the multiple reaction mechanisms give independent measurements of each analyte, while the absence of chromatographic separation means that it is straightforward to analyze VOCs with diverse chemical functionalities in a single procedure [22,23]. Instrument detection limits in the part-per-trillion by volume (pptV) range are typically achieved for 1 s ion dwell times for direct analysis of air, with no preconcentration or drying required [24,25].
The SIFT-MS instrument was coupled with a GERSTEL multipurpose (MPS) autosampler (Robotic Pro; Mülheim, Germany). Samples were incubated in a virtual twelve-place GERSTEL agitator (comprised of two physical six-place agitators). Headspace was sampled using a 2.5 mL headspace syringe (heated to 150 °C; GERSTEL) and subsequently injected at a flow rate of 50 μL s−1 into the SIFT-MS instrument’s autosampler inlet (heated to 150 °C) via a self-sealing GERSTEL septum-less sampling head. Since the nominal sample flow into the SIFT-MS instrument is 420 µL s−1, a make-up gas flow (ultra-high purity nitrogen) was also introduced through the sampling head. The analysis time for each sample was 120 s. Reported concentrations are the mean of the values obtained during injection (i.e., between about 50 and 80 s in Figure 2). Note that the presence of solvent can result in a spike in analyte concentration at the beginning of the injection for DMF and DMSO, even at 5% dilution, while for DMAC and DMI, it is observed at higher proportions in water. This spike was not included in the averaging window. Note that no internal standard was utilized [16].

2.2. SIFT-MS Analytical Method

Table 2 summarizes the reagent ion–primary product ions pairs for the diluent solvents with the positively charged SIFT-MS reagent ions. Generally, these are to be avoided in method development, due to the background signal that they may introduce, though in practice the degree to which the solvent partitions the headspace and the concentration at which the target compound needs to be quantified should also be considered. When a solvent is present in the headspace at appreciable concentrations, potential interference from secondary product ions and 13C, 18O, and 34S isotopologues may need to be evaluated.
The target compound list for this study comprised acetone, acetonitrile, benzene, 1-butanol, chloroform, isooctane, isopropyl alcohol (IPA), methanol, methyl ethyl ketone (MEK), nitromethane, propanal, tetrahydrofuran (THF), toluene, and trichloroethylene (TCE). The naming convention used follows USP<467> [2], where relevant. Clearly, if one of these solvents is identified during drug product development as a solvent likely to be present (LTBP [2]), it cannot also be used as a diluent solvent in instrumental analysis. Methanol is used in both ways in this proof-of-concept study, but this is not a typical use case. Table S1 summarizes the SIFT-MS quantitation ions utilized in this study [29,31,32,33,34,35,36,37]; i.e., not all product ions are listed for a given analyte. The SIFT-MS reagent ions are rapidly switchable, so all positively charged ions were collected during a single headspace injection (i.e., replicate injections for individual reagent ions were not required).
In this study, results for individual quantitation ions are reported. Data were not calibrated, but used library quantitation parameters, and are hence reported as responses rather than concentrations in solution. It must be noted, however, that these responses were normalized per the usual concentration calculation [20].

2.3. Sample Preparation and Analysis

All chemicals (diluent solvents and analytes) were supplied by Sigma-Aldrich (Gillingham, UK). Aspirin for the LOQ and recovery studies was obtained from a local supermarket (Tesco Stores Ltd., Welwyn Garden, UK).
Two stock mixtures, with very different relative concentrations of analytes, were used in this work. “Mix 1” had relative solution concentrations of analyte optimized to give aqueous headspace concentrations within approximately one order of magnitude across diverse analyte polarities. Hence, analytes with high affinity for the aqueous phase (e.g., methanol) were at significantly higher concentrations than non-polar analytes (Table 3). To simplify reporting of the solution concentrations, “solution levels” (or, more succinctly, “levels”; left-hand column of Table 3) are utilized here and in the Supplementary Materials. The concentration (using part-per-million (ppm) units [2]) of a given analyte at each level is shown in the middle portion of the table. For “Mix 2”, all analytes were at the same concentration in the stock solution (i.e., removing the bias to aqueous headspace partitioning in composition of Mix 1; Table 3). Although this simplified reporting against the solution concentration, the ”level” approach was retained for consistency with Mix 1. Most results presented below utilized Mix 1 in the high concentration range (levels 20–500) in Table 3. Both mixes were used for additional performance evaluations with DMI diluent. These included use of samples in a lower concentration (the “low range” of Table 3) for linearity and LOQ. Note that although “low” and “high” concentration ranges were created from the same stock standard, and different predilution steps meant that linearity was not evaluated across a combined range.
The LOQ was evaluated using low-range solutions (Table 3) of levels 1, 2, and 5 (in triplicate). For 100% DMI spiked with Mix 1, levels 10 and 20 were also added.
Recovery was assessed using aspirin dissolved in DMI (250 mg/10 mL). This solution was subsequently diluted with water to achieve the desired DMI proportion in water. The 100% spike used in the recovery exercise corresponds to level 500 in Table 3, with 25 and 50% dilutions thereof. Level 250 (Table 3) was used for calibration of the recovery data (the middle of the three recovery levels).
In most cases, 10 mL of sample was added to 20 mL sample vials. However, it was observed that the partitioning at 50, 75, and 100% DMI was essentially independent of sample volume for most analytes (see Figure A1 of Appendix A), presumably due to a high partition coefficient K in these matrices [38] (pp. 27−30). Hence, for the higher proportions of DMI, 2 mL of DMI was diluted with an appropriate amount of water (e.g., for 50%, 2 mL DMI + 2 mL water). This reduced solvent usage and hence had cost benefits and reduced the environmental impact.

3. Results

This section presents, in three phases, the results obtained from the evaluation of six diluent solvents that have probable compatibility with headspace-SIFT-MS. First, the feasibility of application to SIFT-MS was assessed by measurement of the relative analyte sensitivity as a function of the proportion of non-aqueous solvent. Next, the linearity and repeatability were evaluated on standard solutions. Finally, the limit of quantitation (LOQ) and recovery performance were assessed using DMI and aqueous dilutions thereof.

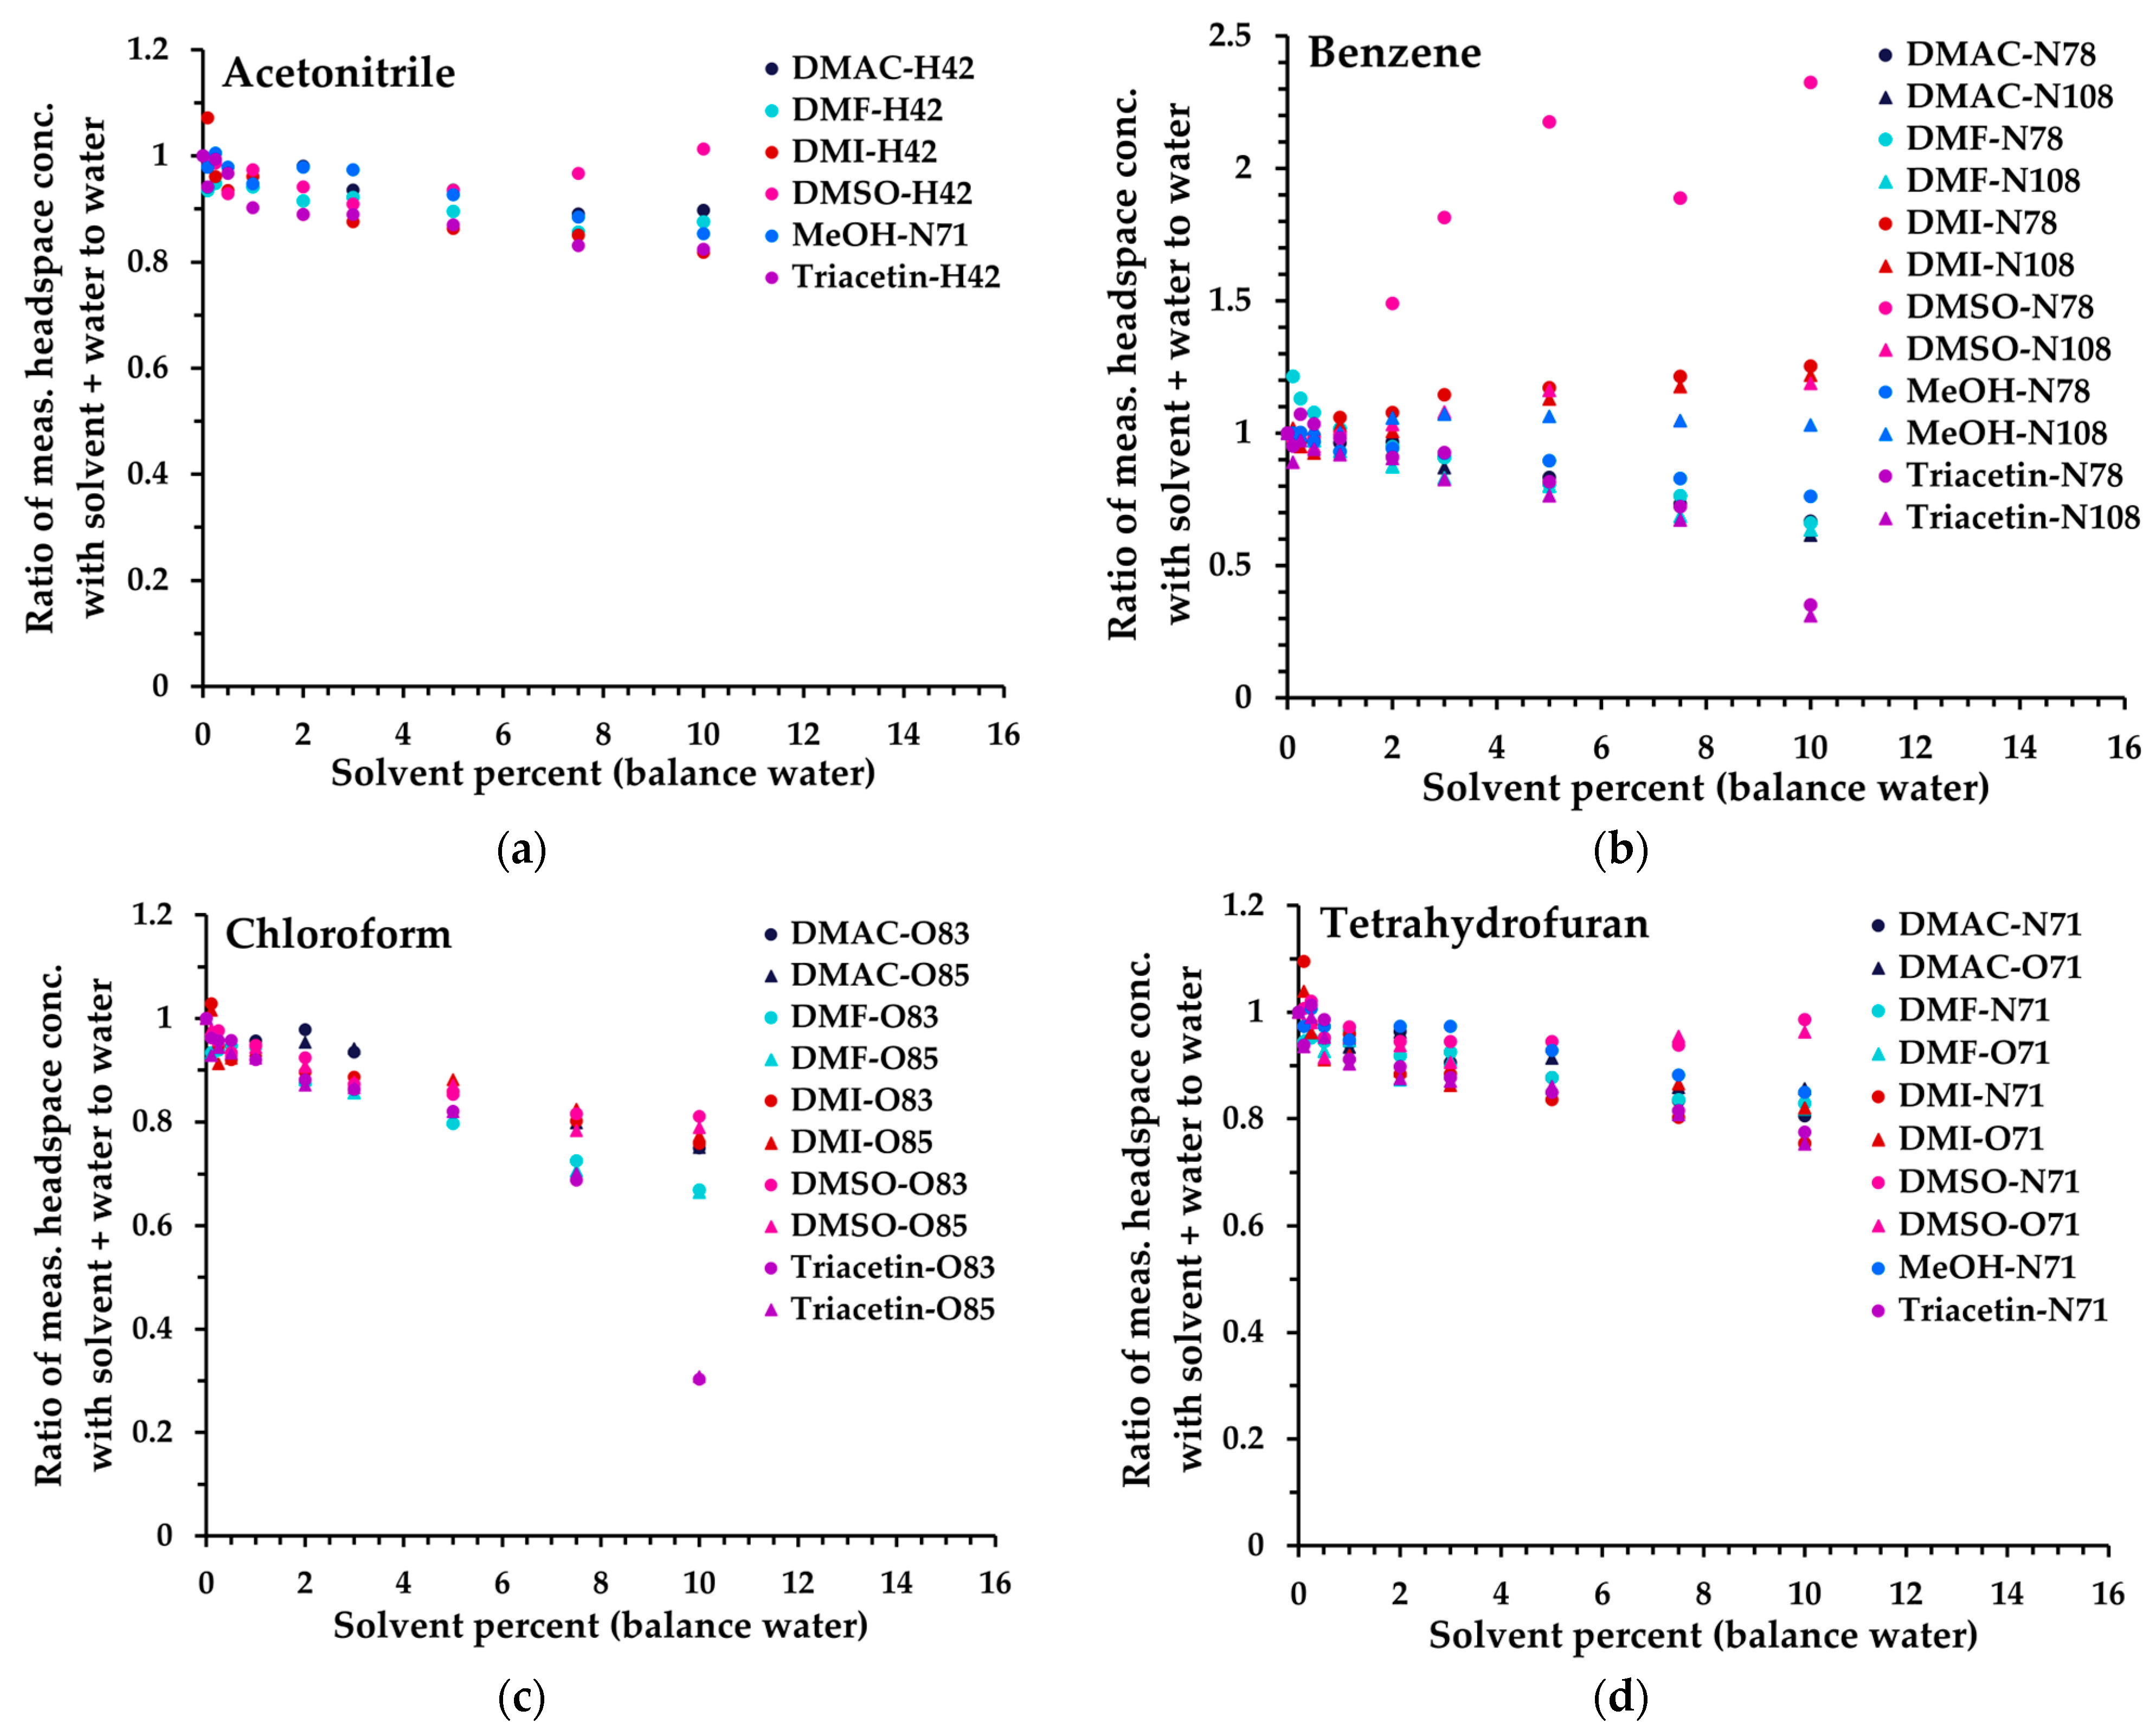
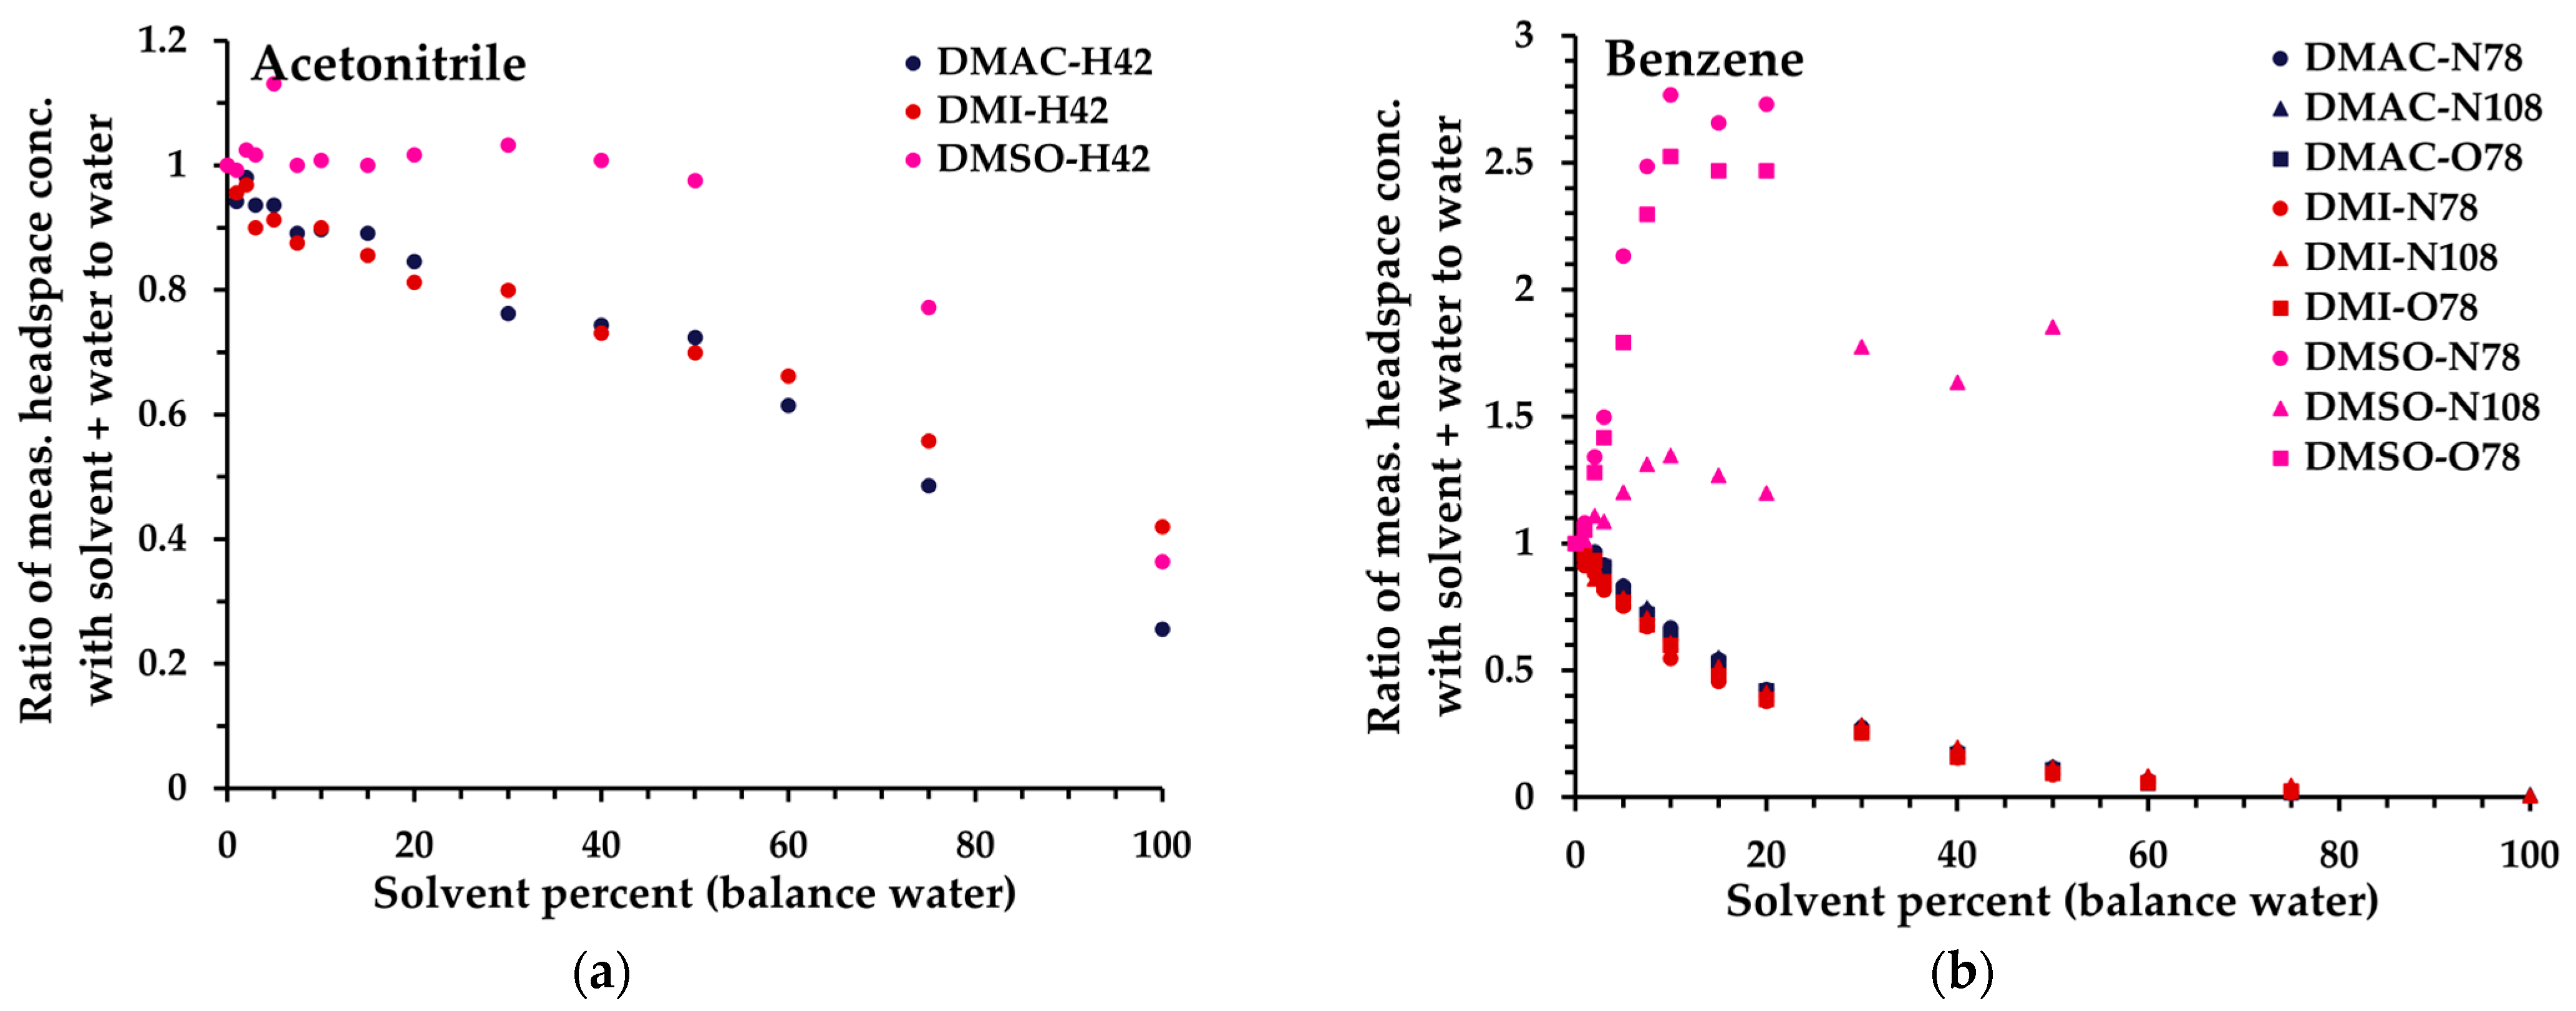
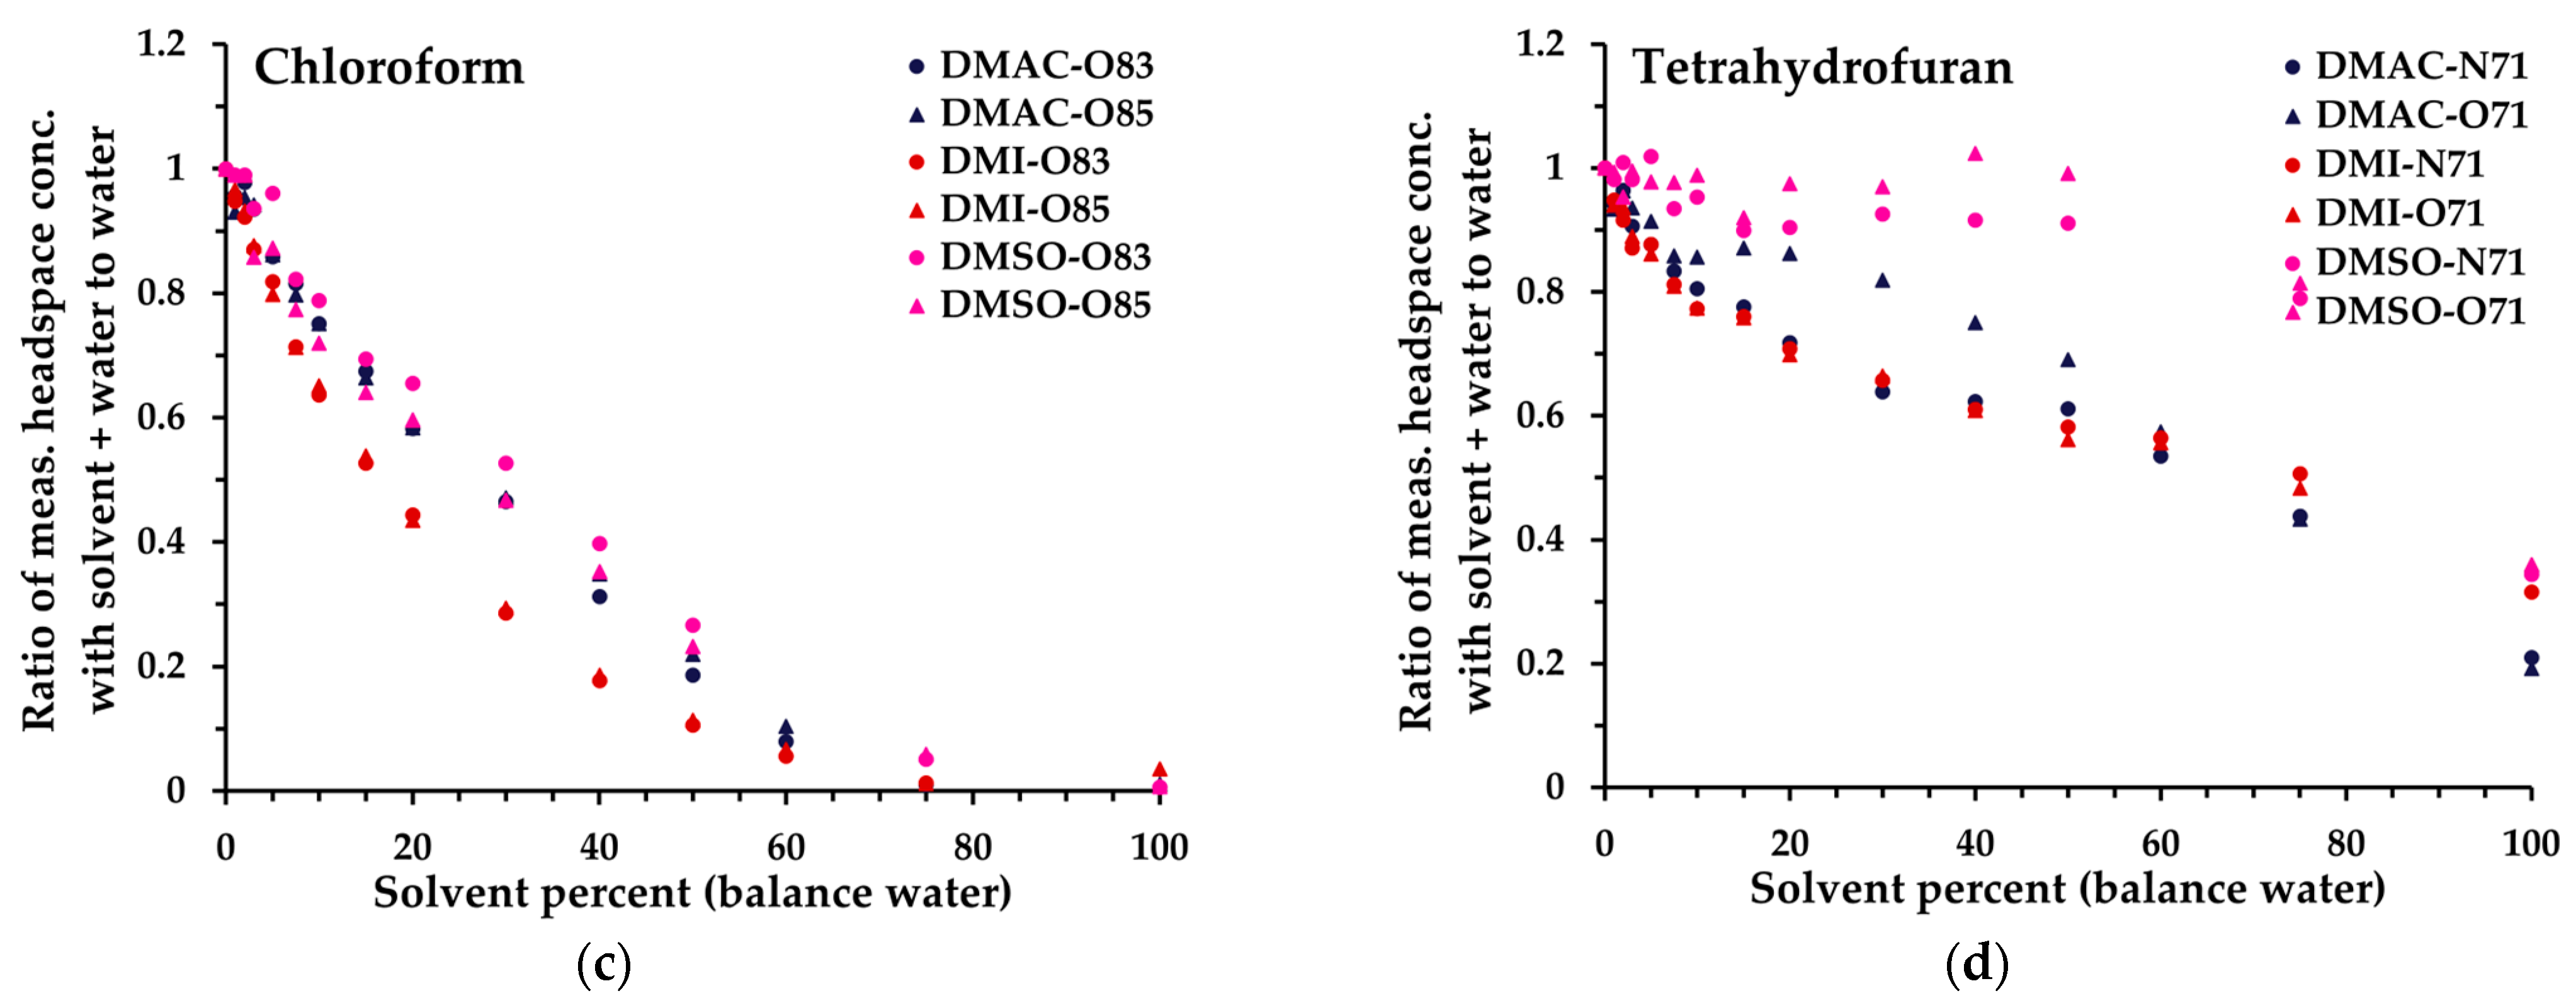
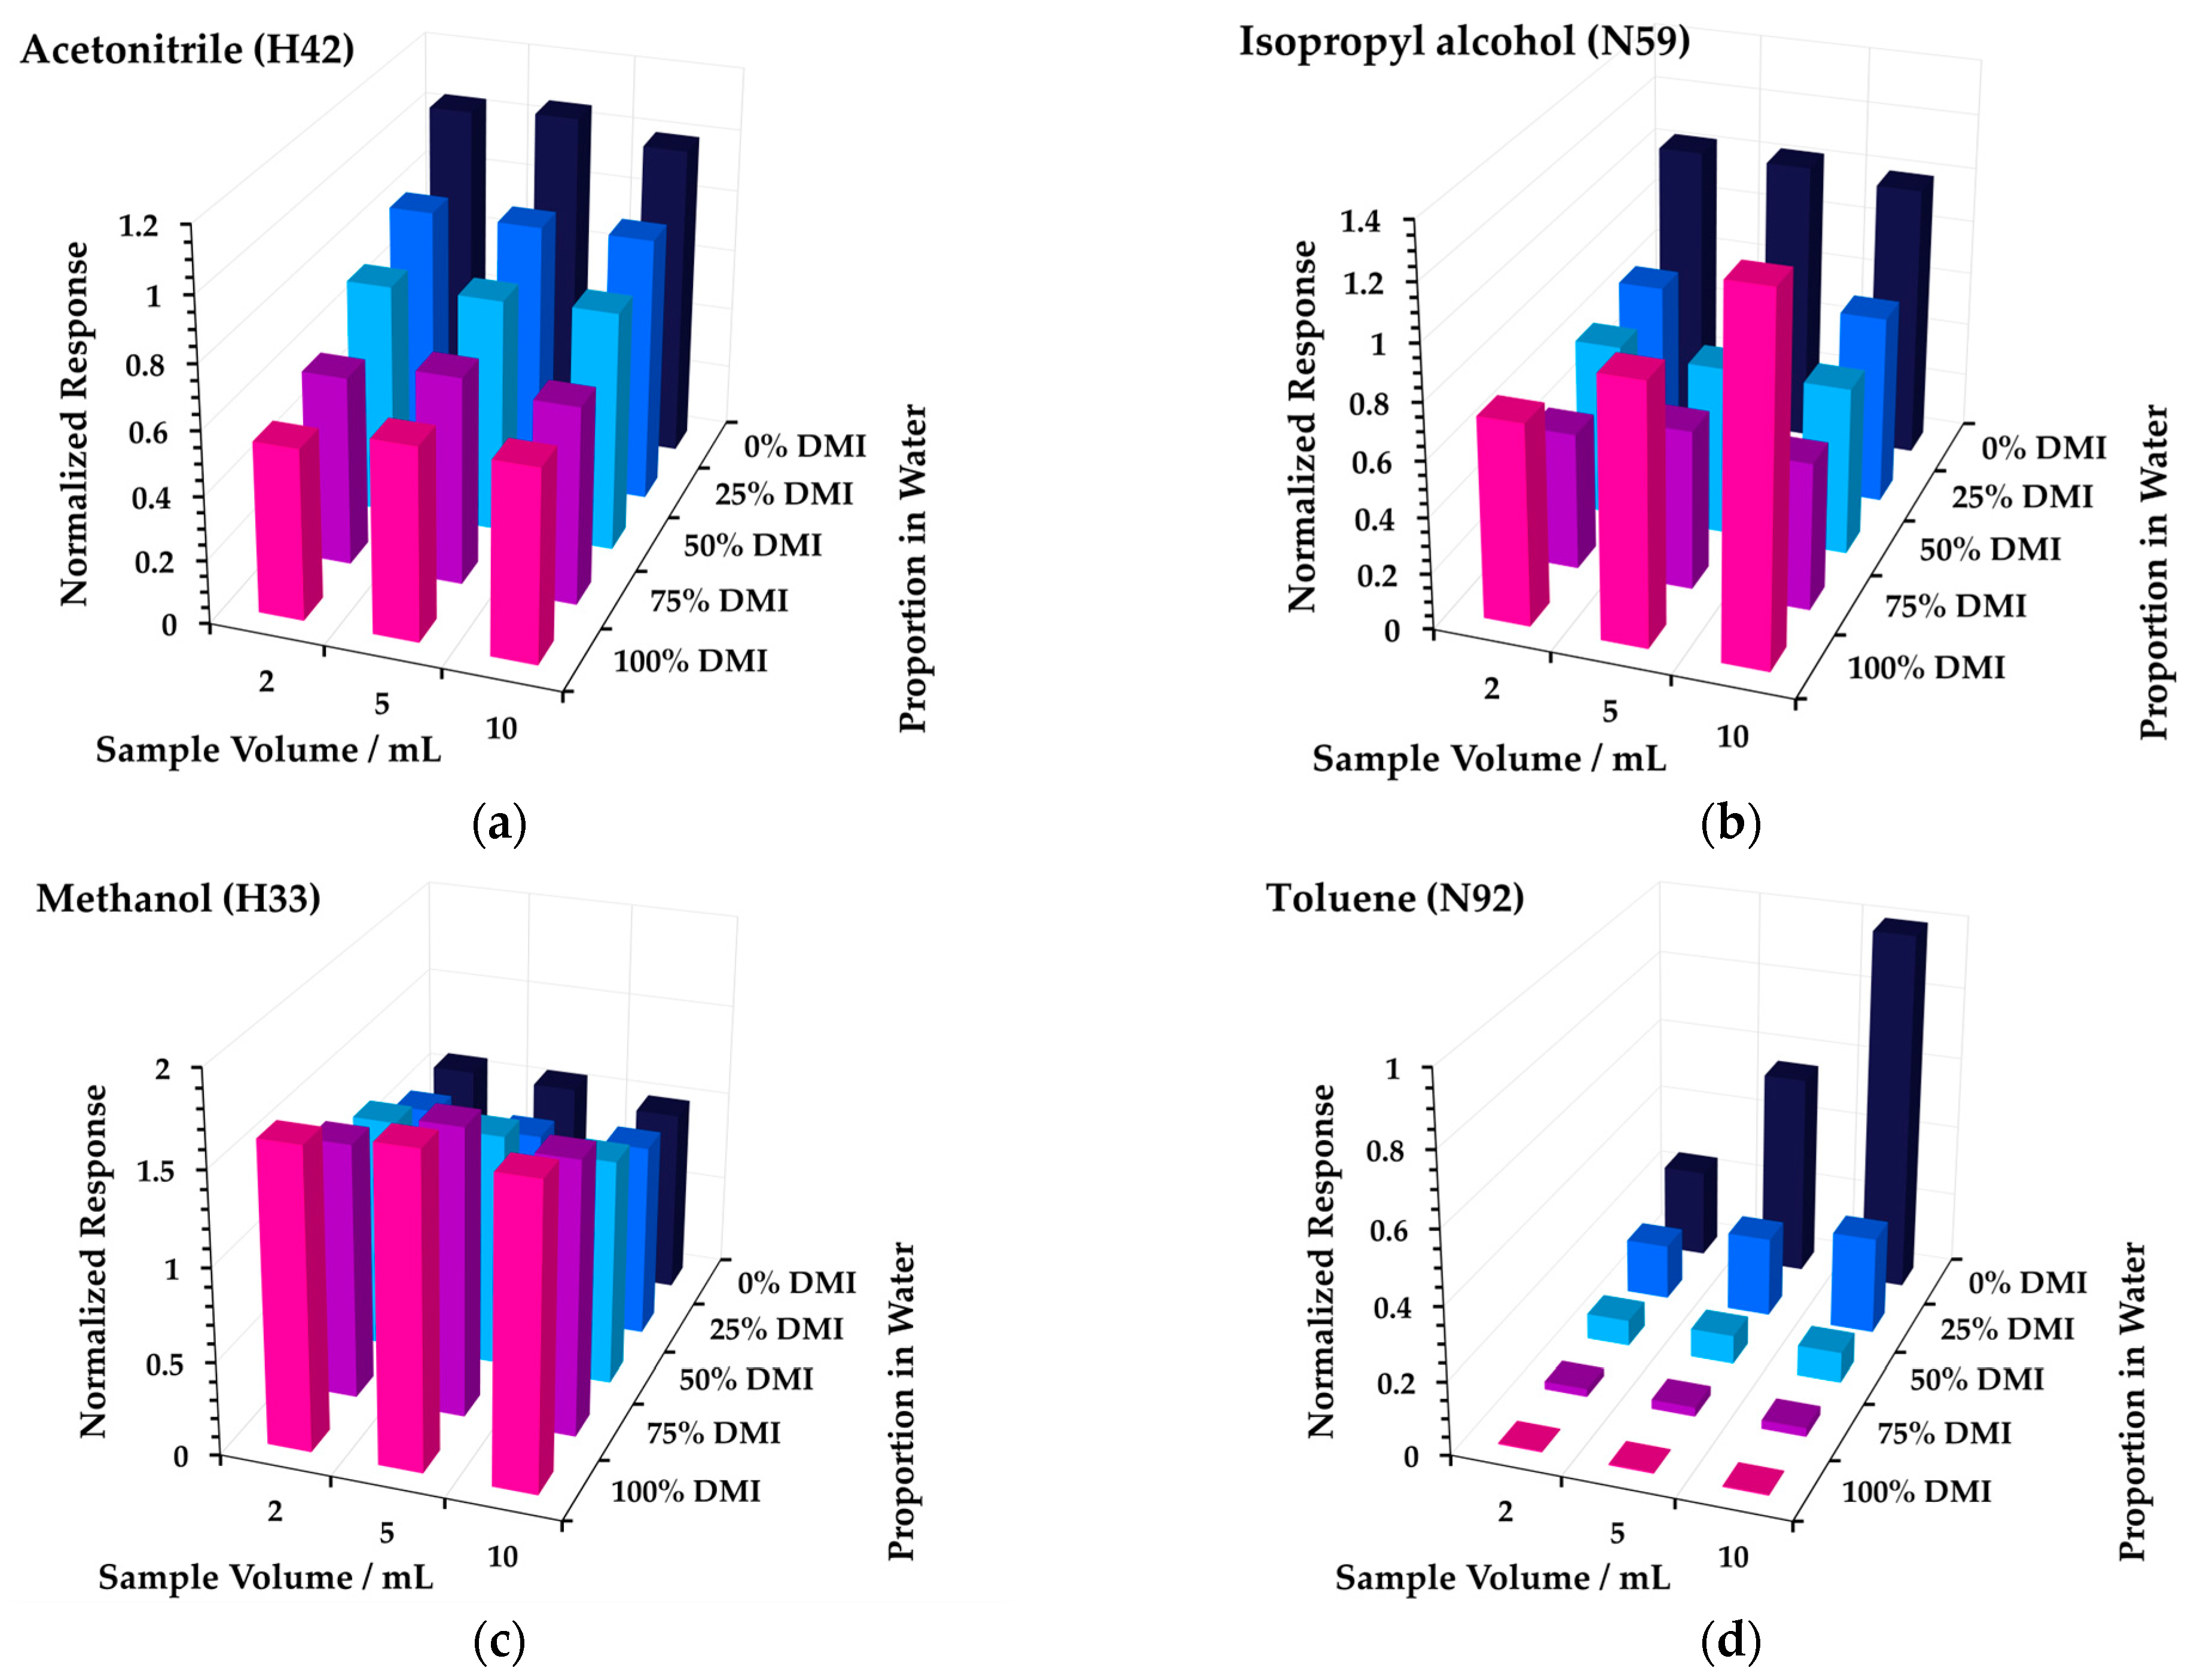
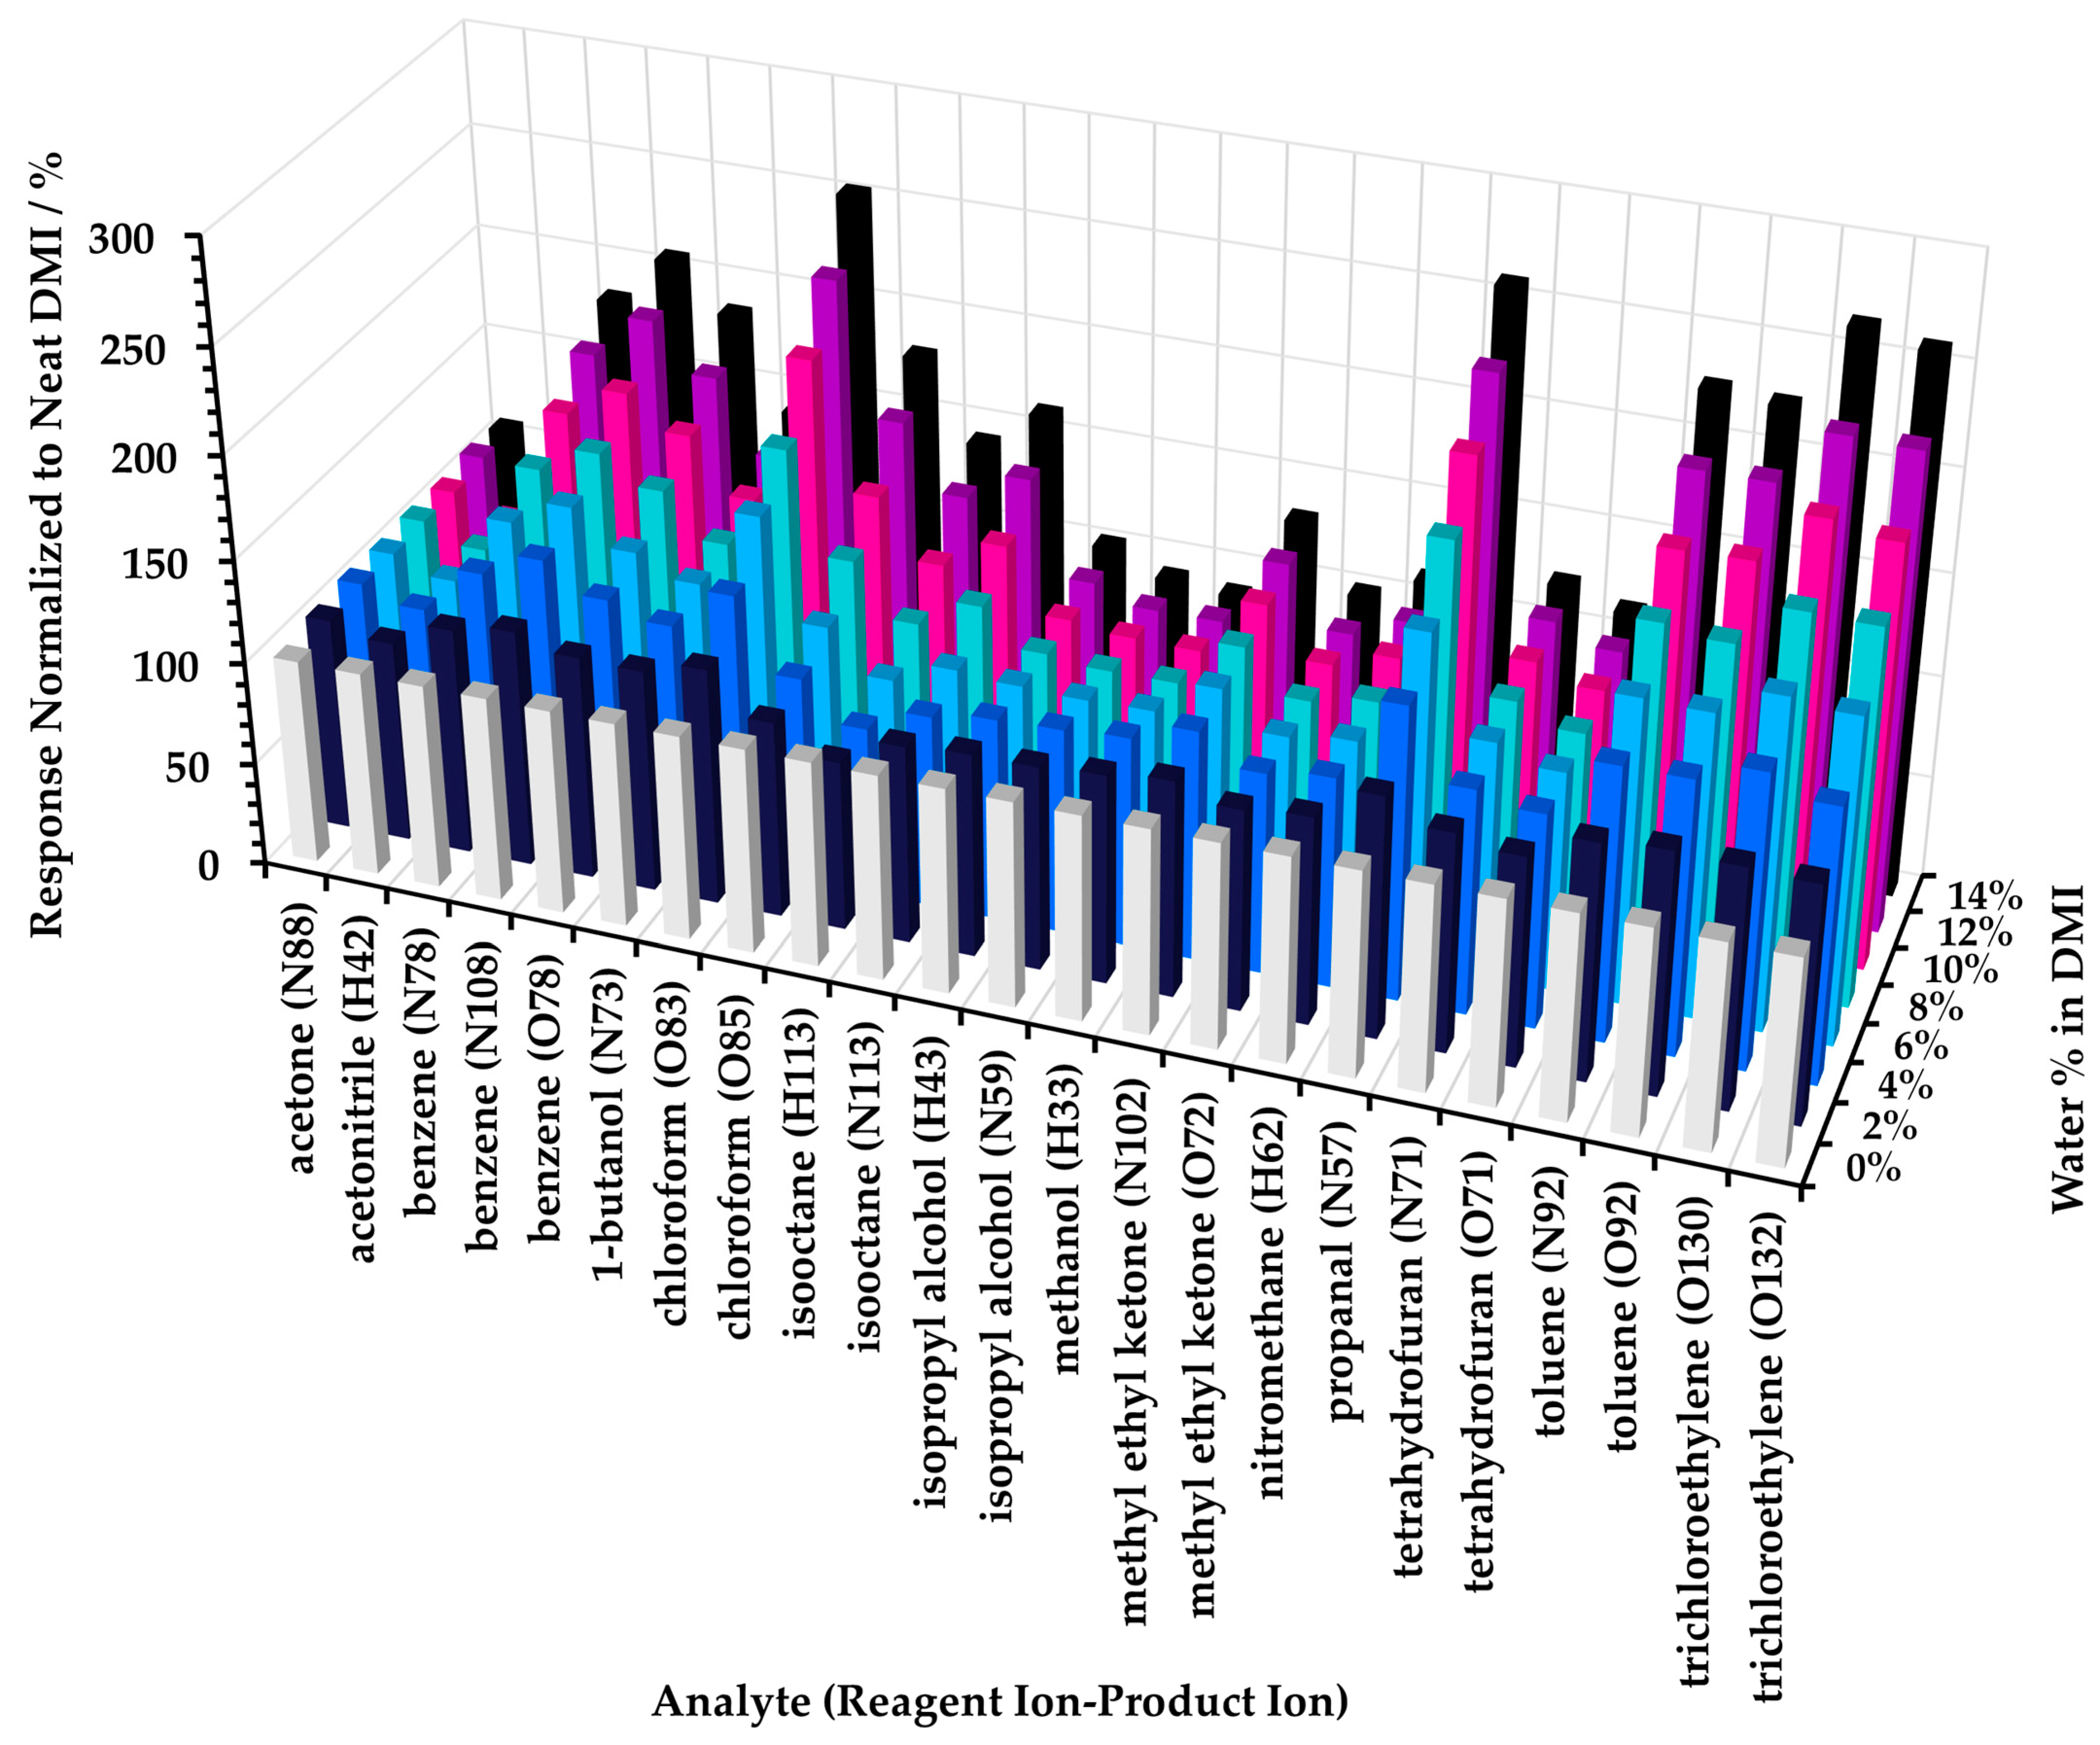
3.1. Analyte Sensitivity as a Function of Diluent Solvent Proportion in Water

The first step in appraising non-aqueous solvents for compatibility with SIFT-MS was to determine the dilution level in water that the SIFT-MS instrument can accommodate without saturation (Figure 1), while preferably retaining sufficient sensitivity for a given analyte. This evaluation was conducted using Mix 1 at one analyte level (level 250 in Table 3). The results obtained are summarized in Figure 3 for four analytes (by individual primary product ion, Table S1) from 0 to 10% solvent diluted in water. Note that, because only NO+ can be utilized in the SIFT-MS method when methanol is used as the solvent, different product ions were used for acetonitrile and nitromethane in this matrix (Table S1). In addition, due to a very low sensitivity with NO+, trichloroethylene (TCE) could not be analyzed effectively in methanol. The analytes in Figure 3 represent the trends observed across all 14 solvents evaluated (except for variations arising from interference), grouped as follows (data for all compounds are given in Figure S1):
  • Acetonitrile (and methanol, nitromethane): minimal change in sensitivity up to 10%.
  • Tetrahydrofuran (THF) (and acetone, methyl ethyl ketone, propanal, isopropyl alcohol (IPA), 1-butanol): a small loss of sensitivity for each analyte compared to (1).
  • Chloroform (and toluene, TCE): generally, further loss compared to (2), and significant drop in sensitivity when triacetin is no longer miscible in water (>6.1%).
  • Benzene (and isooctane): very solvent-dependent behavior (higher signal in more polar solvents) plus similar behavior to (3) with triacetin. For benzene specifically, DMSO is not ideal as a solvent, due to DMSO interference [13] (see also Figure 4).
Based on these data, and especially the 6.1% miscibility limit for triacetin in water [39], a solvent dilution level of 5% in water was standardized across all solvents, to facilitate direct comparability of linearity and repeatability performance (Section 3.2). It is evident, however, that for several solvents significantly higher proportions in water are feasible, especially DMAC, DMI, and DMSO. For these, Figure 4 illustrates the behaviors of the 14 analytes up to 100% organic solvent (for all analytes, see Figure S2). Generally, the non-polar analytes exhibit enhanced retention in solution compared to polar analytes as the solvent proportion increases. At lower dilution levels, the impact is relatively small because they are usually detected with high sensitivity. However, it is evident that at higher proportions of solvent, non-polar analytes may be retained very effectively in the solvent phase. Hence, for a given test article, method development needs to balance the level of dilution in solvent with the headspace partitioning of individual analytes and the SIFT-MS sensitivity (Section 3.3 and Section 4). Nevertheless, at 5% solvent dilution, for most analytes, the sensitivity of SIFT-MS remains similar to that of the corresponding aqueous system.

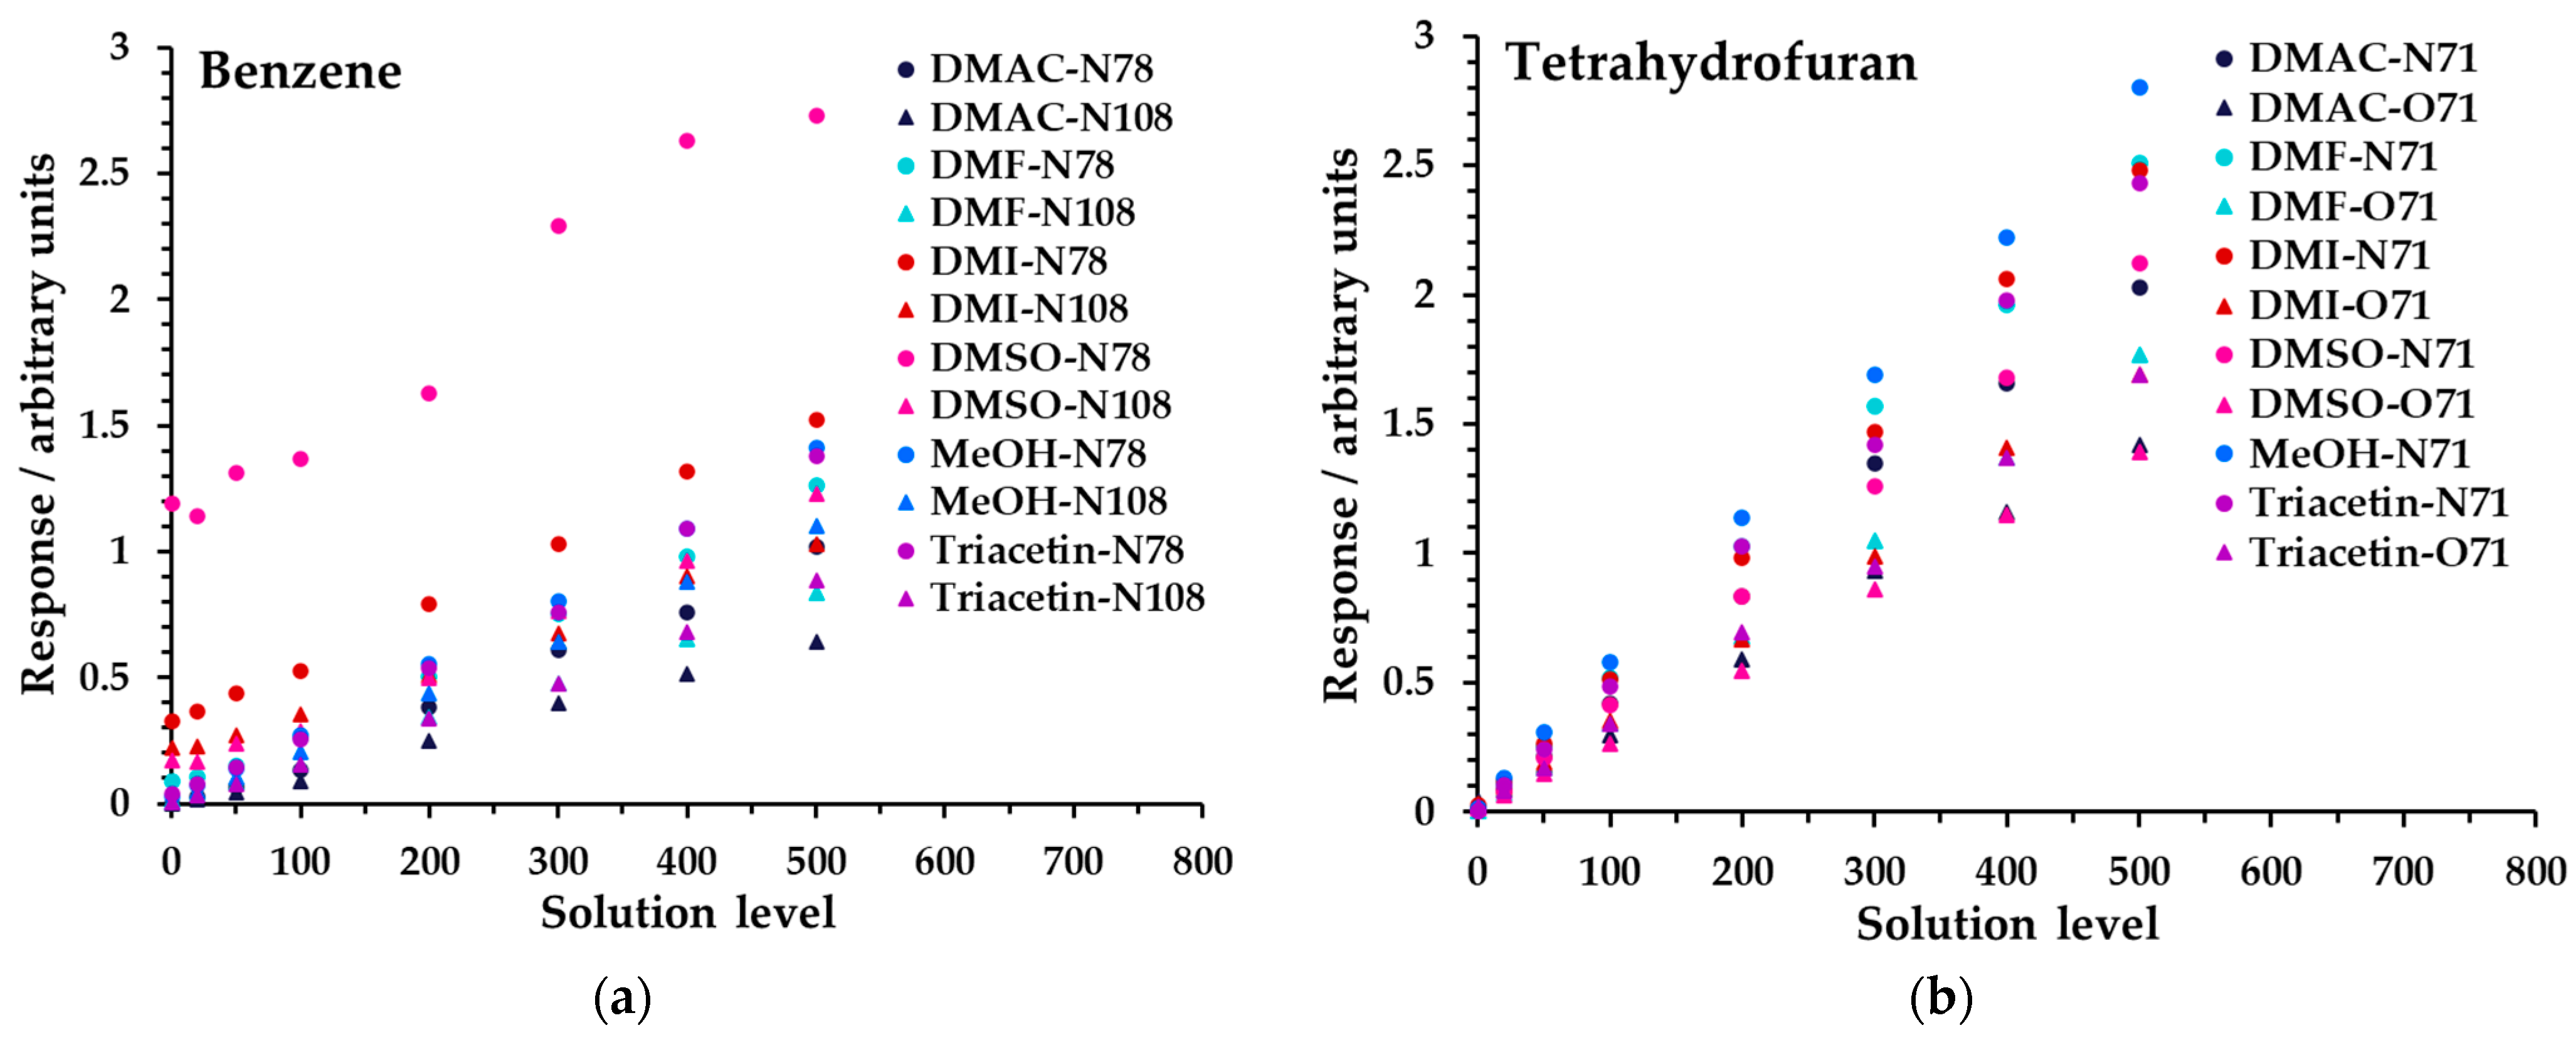
3.2. Analytical Performance I: Linearity and Repeatability for Six Diluent Solvents

For all solvents, the linearity and repeatability performance was evaluated on standard solutions for the 14 analytes (using Mix 1) in a 5% diluent solvent to 95% water mixture. Higher proportions of DMAC, DMI, and DMSO diluent in water were also evaluated with Mix 1. Selected comparative tests were also made with Mix 2 with DMI.
Linearity was investigated for all diluent solvents at 5% in water across the high concentration range (Table 3). Figure 5 shows the results obtained for benzene and tetrahydrofuran; for all analytes, see Figure S3 and Tables S4a, S5, S6a, S8a, S9, and S10. Data have not had the blank subtracted, because the offset from zero response provides an insight into background signals arising from the diluent solvent and impurities; see the Discussion. Linearity performance was assessed using the regression coefficient, R2, obtained from simple linear regression analysis. The linearity at 5% dilution was excellent overall, including for the low concentration range; see Tables S2 and S6a,b, as summarized in Table 4 (>0.991 for all ions except benzene in DMSO), calculated across all levels including the blank (zero). This indicated that for this proportion of diluent solvent, the instrument operated within its linear range. For a given product ion, the relative differences in slope between analytes were due to variations in headspace partitioning.
Figure 6 shows linearity measurements for benzene and THF from Mix 1 across both concentration ranges at various proportions of DMI in water (full data are given in Figure S5 and Tables S2 and S6a). Analogous data for DMAC and DMSO, albeit over narrower dilution ranges (Table 4), are given in Table S4a−d/Figure S4 and Table S8a/Figure S7, respectively. Regression coefficients for these data are also summarized in Table 4 and generally indicate that larger proportions of solvent are feasible, primarily for polar analytes, though it should be noted that the solution concentrations of non-polar analytes were substantially lower in Mix 1 (Table 3), due to very effective partitioning from water. To better evaluate performance for non-polar compounds at higher proportions of diluent solvent, Mix 2 (Table 3) was prepared and tested on a limited subset of samples: water (low concentration range; Table S3), 10% DMI (low range; Table S7a), and 100% DMI (high range; Table S7b). These results are summarized in the footnotes to Table 4 and demonstrated good linearity at higher proportions of DMI for most non-polar species when the concentrations were higher. Method development must take these behaviors into account when the relative diluent solvent–aqueous mix is optimized (see the Section 4).
Repeatability for all diluent solvents was evaluated at 5% dilution in water using Mix 1. Six replicates at three levels in the high concentration range (50, 250, and 500; Table 3) were utilized for calculation of the relative standard deviation (RSD, as a percentage) and the results are summarized in Table 5. DMAC, DMI, and DMSO results at higher diluent proportions (up to 25, 100, and 50%, respectively) are also given in Table 5. Full data using Mix 1 are provided in Tables S11–S14 and S16–S18. With limited footnoted exceptions, these results met the general acceptance criteria (not more than 20%) for residual solvent analysis [3]. Most repeatability challenges arise due to poor headspace partitioning and hence low response, primarily due to the non-polar compounds partitioning poorly to headspace at high proportions of DMI. Hence, the repeatability for Mix 2 was evaluated (in the high concentration range) for 100% DMI, with good results (footnote 6 of Table 5). The second most common issue is a high blank signal relative to analyte signal (e.g., due to interference arising from the solvent or impurities); see the Discussion.

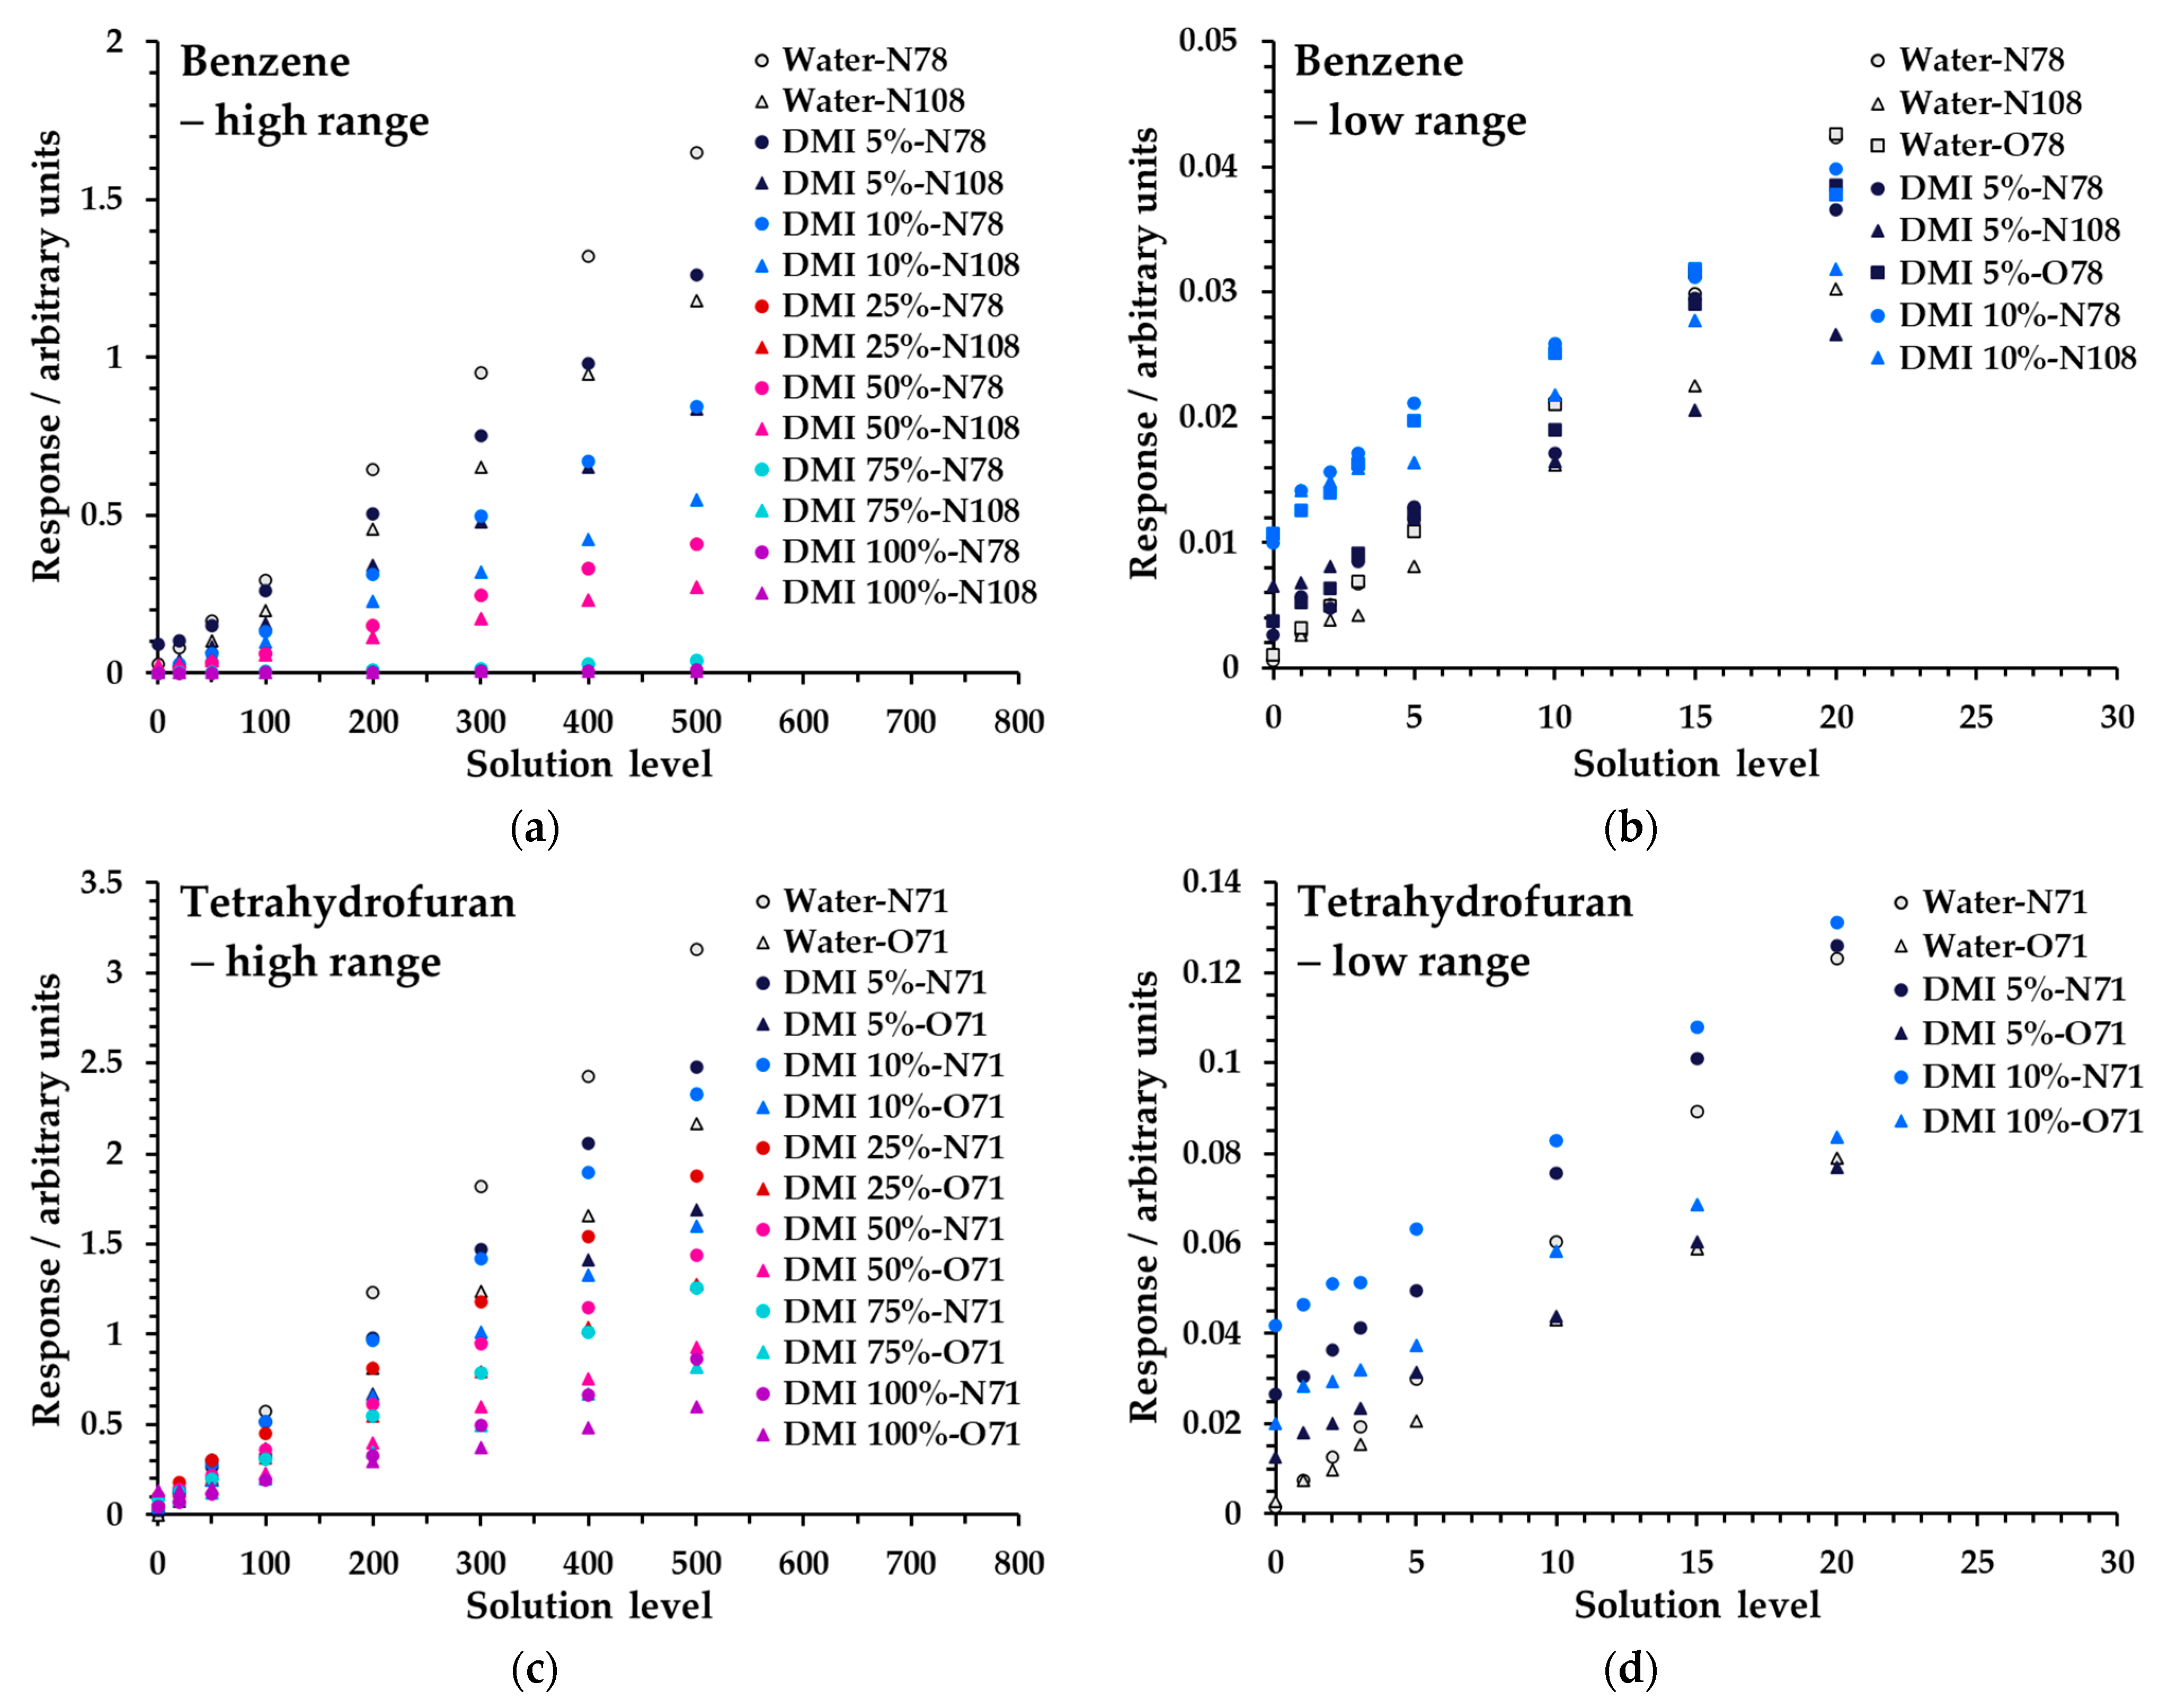
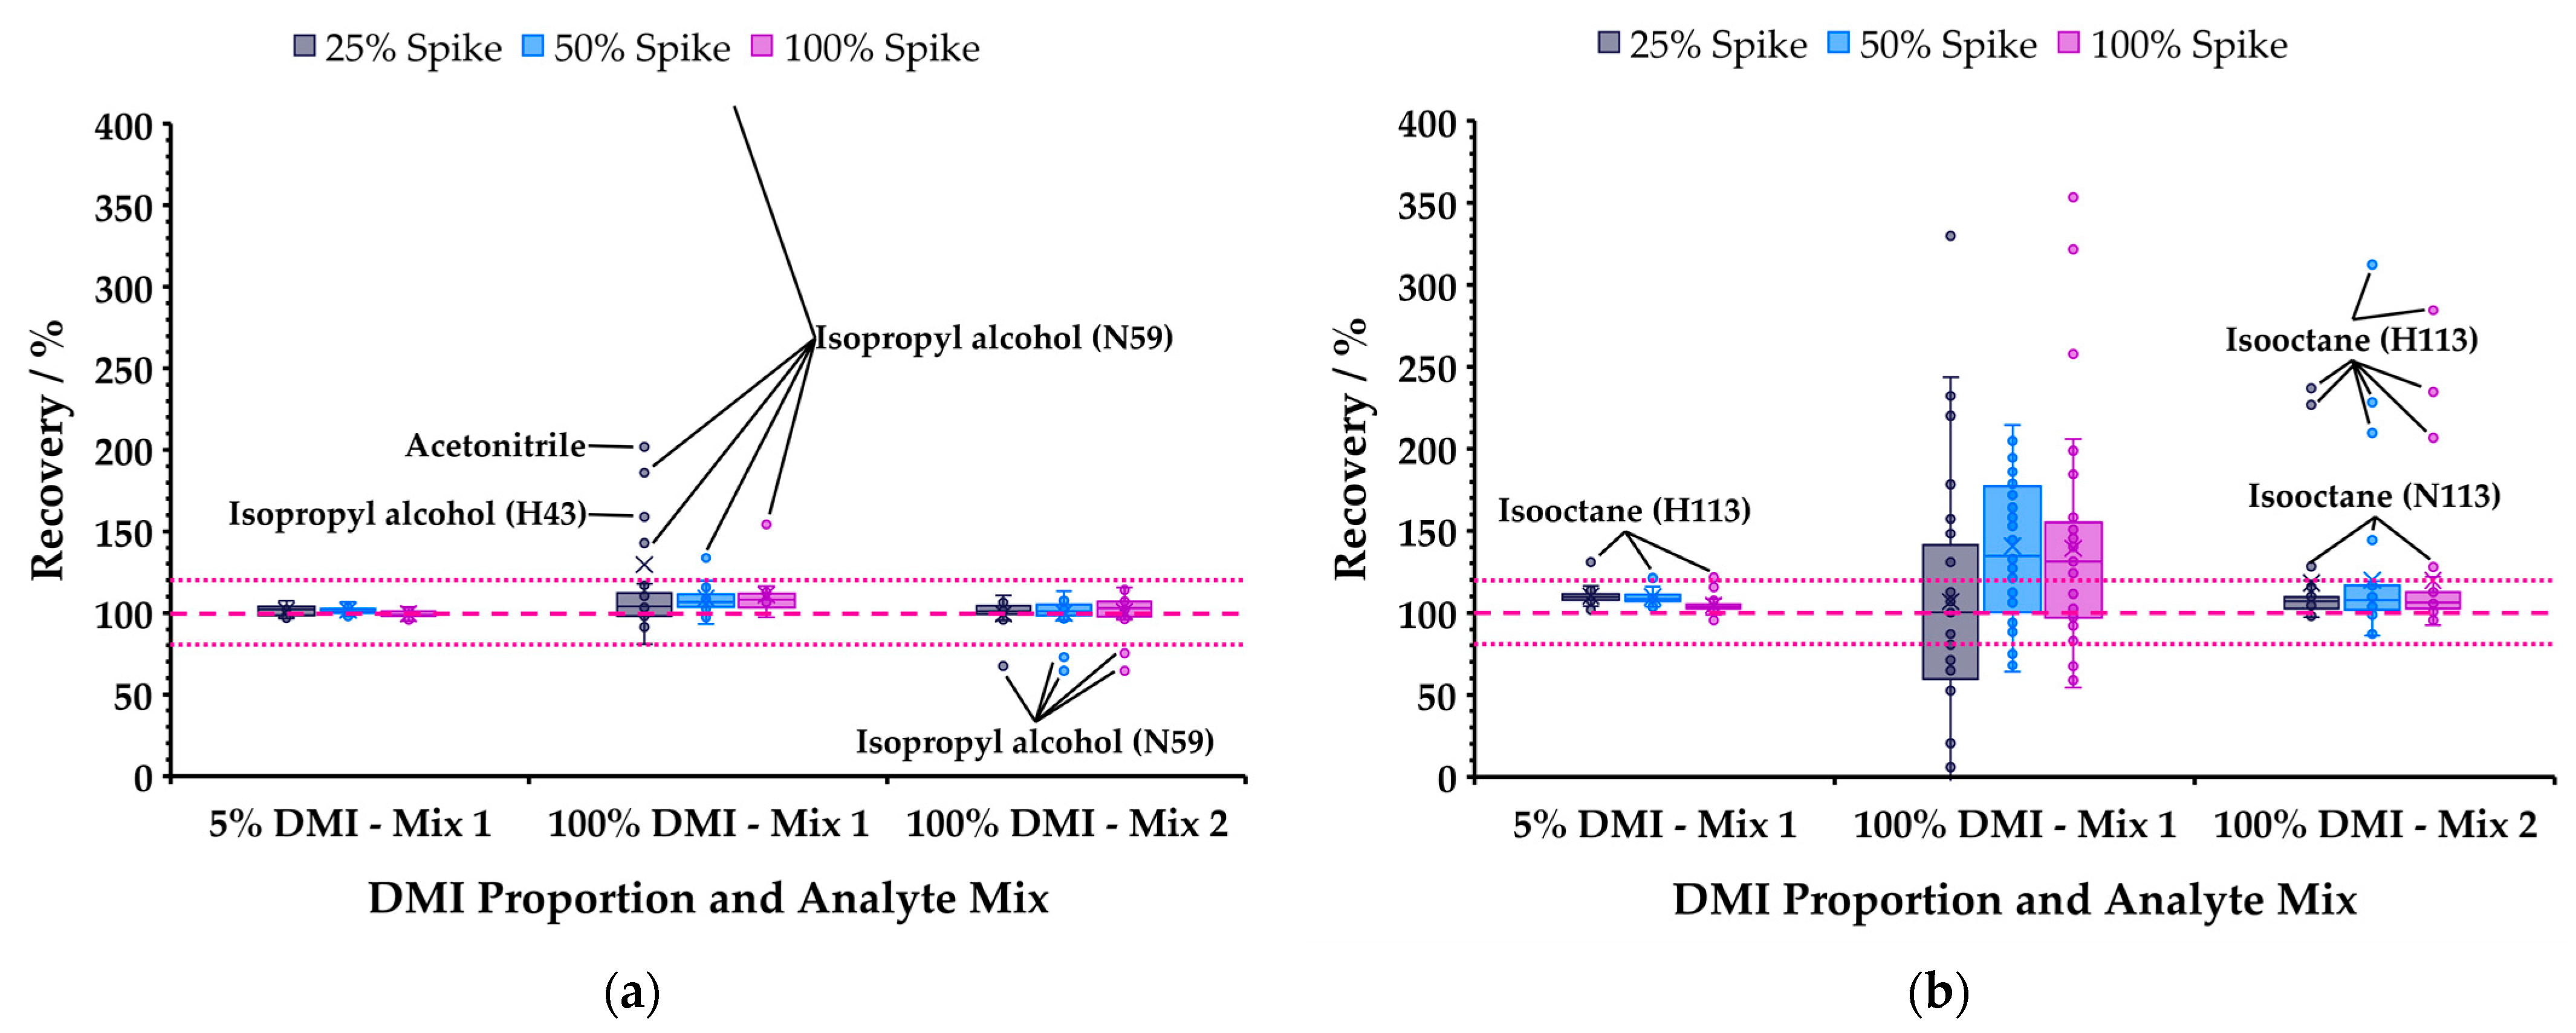
3.3. Analytical Performance II: LOQ and Recovery from DMI and DMI-Aqueous Systems

Having broadly evaluated the six diluent solvents for compatibility with SIFT-MS using linearity and repeatability, LOQ and recovery performance was assessed for DMI-aqueous systems. DMI was selected because it offers the widest diluent range with SIFT-MS (from 0−100% in water), enabling the impact of analyte polarity on partitioning to be investigated using a limited number of DMI-aqueous dilutions spiked with analyte mixes 1 and 2.
Limit of quantitation (LOQ). The LOQ approach for SIFT-MS was modified compared to chromatographic methods, because there was no baseline noise from which to calculate signal-to-noise ratios [13]. Hence, the LOQ was determined empirically based on %RSDs of low-concentration standards [40,41]. The LOQ was estimated to lie within levels 1−5 (Table 3). Triplicate measurements were made at three concentrations across this range (Tables S19–S21). For 100% DMI spiked with Mix 1, additional levels of 10 and 20 (Table S20c) were added, due to very poor headspace partitioning of the non-polar analytes. The results are summarized in Table 6, with exceptions indicating specific product ions that still failed at the stated level (or were the only ones to pass, in the case of toluene in 100% DMI with Mix 1). The implications of these results will be revisited in the Discussion.
Recovery was evaluated for tableted aspirin dissolved in 5% DMI in water (spiked with Mix 1) and 100% DMI (Mixes 1 and 2). Spike concentrations were 25, 50, and 100% of level 500 (Table 3) and measurements were made in triplicate. Full recovery data are provided in Tables S22 and S23 calculated using the approach described in Ref. [11]. Figure 7 summarizes the results for polar (acetone, acetonitrile, 1-butanol, IPA, methanol, MEK, nitromethane, propanal, THF) and non-polar (benzene, chloroform, isooctane, toluene, trichloroethylene) analytes in separate box and whisker plots. Most polar species were recovered within the normally accepted range (80−120%) for all matrices and both mixes. The poor performance of IPA, and to a lesser extent acetonitrile, recoveries (Figure 7a) was attributed to the adsorption by DMI of these solvents from laboratory air, causing elevated signals in blanks and samples, since this did not occur in newly opened bottles from the supplier. Figure 7b powerfully illustrates the challenges faced in high-sensitivity headspace analysis of non-polar species in neat DMI: Mix 1 analytes were essentially non-recoverable, whereas at higher concentration (Mix 2) the results for all analytes except isooctane were within the accepted range.

4. Discussion

This section discusses the experimental results in terms of their practical significance for headspace-SIFT-MS analysis of water-insoluble drug products or other products that contain impurities that partition poorly from water. Potential impacts of diluent solvents on specificity and sensitivity are discussed. Finally, a workflow is proposed that emphasizes the recommended background work prior to undertaking the experimental evaluation of a diluent solvent. This is intended to help analysts avoid embarking on studies that from first principles have poor compatibility with SIFT-MS.

4.1. Expanded Applicability of Headspace-SIFT-MS

This study demonstrated that six non-aqueous solvents are compatible with headspace-SIFT-MS analysis; it is no longer limited to aqueous headspace analysis. It should be noted, however, that other solvents will likely be compatible, and this is not an exhaustive study.
The diluent solvents tested here varied in their maximum usable proportions for several reasons, including limited miscibility (triacetin), significant headspace partitioning (DMF, methanol), and interferences with analytes (DMI, DMAC, and DMSO). Table 7 summarizes the usable reagent ions and concentration ranges over which the diluent solvents can be used under normal headspace-SIFT-MS operating conditions (see Ref. [13]). It also provides some solvent-specific comments. Note that testing for DMF and methanol was not extended to the limits shown; these levels were estimated from prior experience with these solvents and the performance observed for DMI, DMAC, and DMSO at higher proportions.

4.2. Impact of Diluent on Specificity

The analyst’s task with new diluent solvents is not complete upon determination of the upper limit at which the solvent can be used (in water) for headspace-SIFT-MS analysis. The impact of the diluent on specificity must be assessed. Although this can be determined to some extent based on reaction chemistry contained in the SIFT-MS library [42] (see the workflow in Section 4.4), experimental verification of specificity is essential for several reasons:
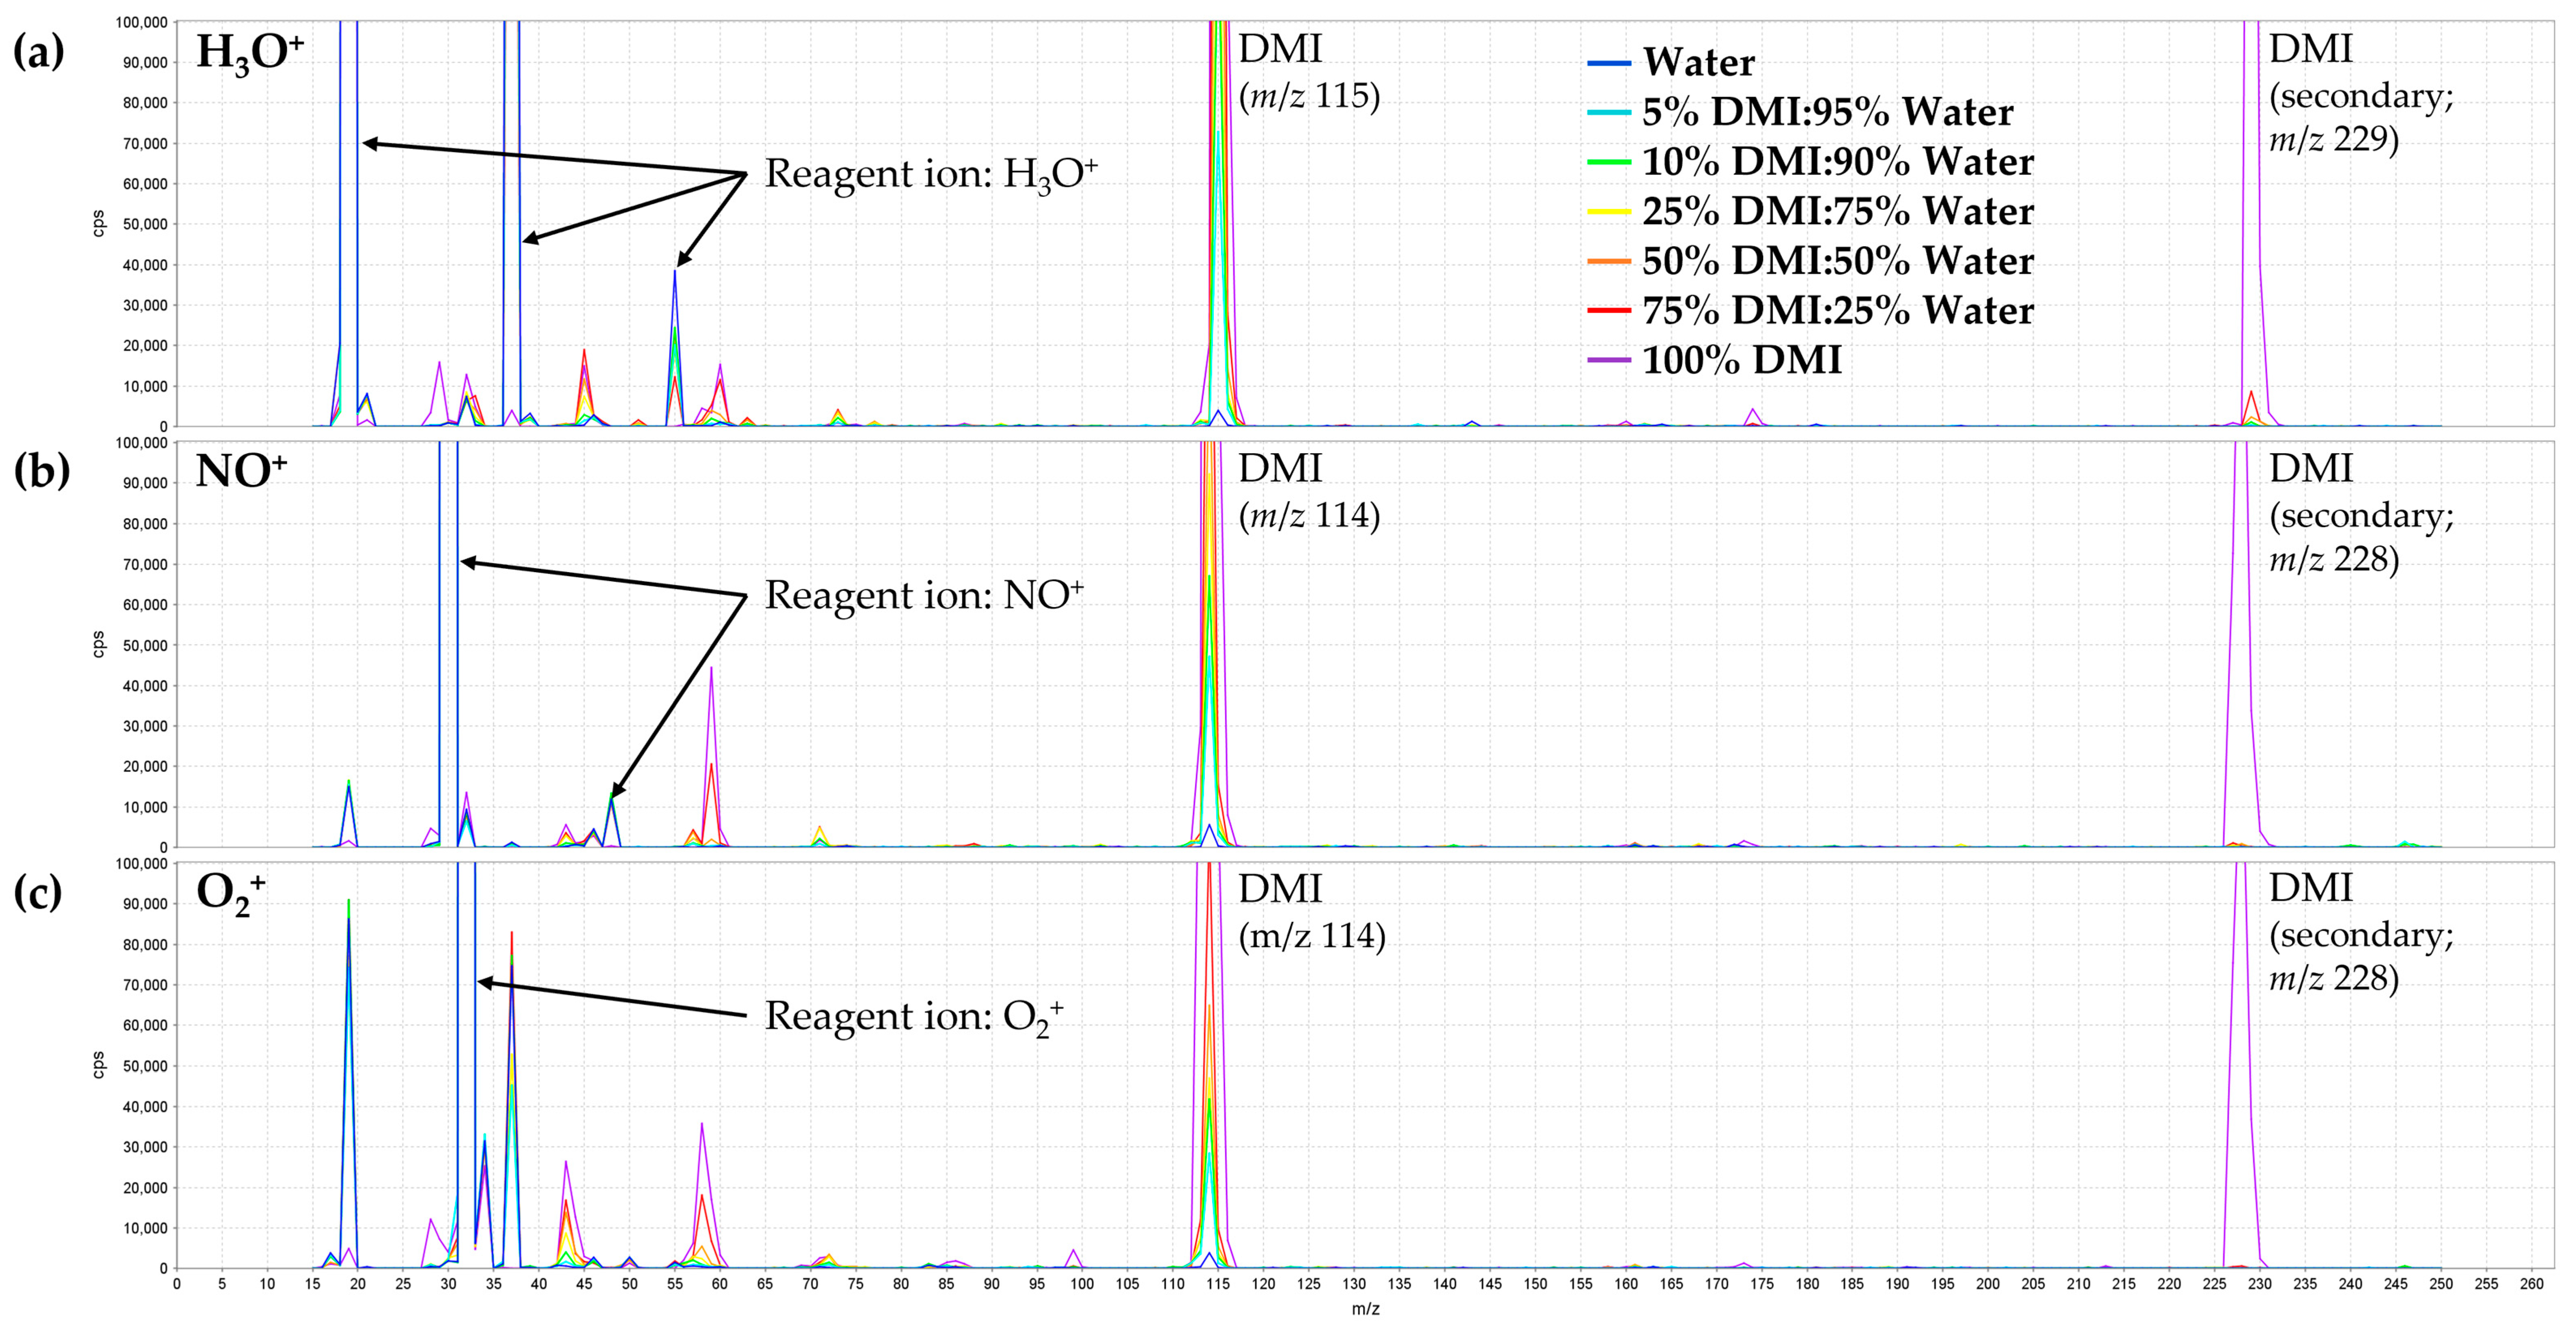
  • The SIFT-MS library records for diluent solvents describe their reaction chemistry for trace analysis and not that for solvent used as a bulk diluent. Hence, solvent product ions that are ordinarily inconsequential (e.g., product ion branching ratios of very low abundance—a few percent), can become significant.
  • Isotopologue peaks, such as those arising from 13C and 18O, can be significant from bulk solvent and these are not usually recorded in the library.
  • High-purity solvents can contain volatile impurities that may interfere with analytes.
In this study, the linearity data (Section 3.2, Figure 5 and Figure 6), which did not have matrix blanks subtracted, revealed interferences on analytes via offsets from baseline responses in the matrix blanks compared to the aqueous blanks. Generally, the interference effects were minor here but several occurred and serve as prototypical examples.
  • Benzene analysis with DMSO as diluent (Figure 5a): the solvent and analyte have identical product ions at unit mass resolution [16]. The two NO+ product ions for these compounds (Table 2 and Table S1) have different relative abundances and hence illustrate a general principle: interference will usually affect an analyte’s product ions differently. The ability to reliably quantify benzene in DMSO will depend on the benzene concentration and the proportion of DMSO diluent used;
  • 1-Butanol analysis with diluent DMF (Table S5a and Figure S3): the 13C isotopologue of DMF interferes with the 1-butanol product ion. This isotopologue was previously observed to interfere with N-nitrosodimethylamine (NDMA) and the effect was mitigated through simple subtraction [43];
  • Isooctane analysis is challenging in DMSO, triacetin, and DMI (Table 4), due to unidentified volatile impurities in these solvents. It is beyond the scope of this study to identify and mitigate these interferences (although for DMI, this might be a case of very low branching ratio product ion at MW–1). However, this step should be conducted as part of the evaluation workflow (Section 4.4), typically using full scan analyses of the solvent diluted in water.
Interestingly, at higher ratios of diluent to water, these effects diminish if the interferent is non-polar; it is retained in the condensed phase, providing a benefit for analysis if the interfered analyte is polar.
Repeatability data (Section 3.2, Table 5) can also provide an insight into specificity issues, though the more common cause of poor repeatability is poor headspace partitioning, leading to low instrument response for the analyte. Nevertheless, high RSDs also arise when blank signals are large relative to the analyte signal and somewhat variable (e.g., due to fluctuations in solvent levels in the laboratory during sample preparation). The most vivid illustration of this effect is in replicate recovery data for IPA and acetonitrile (Tables S22b and S23; the scatter is evident in Figure 7a).
In summary, method development should carefully investigate potential interfering ions arising from the solvent and impurities therein, because they may differ significantly from analysis in water. Identification of features arising from the solvent should be made from full-scan mass spectra, ideally prior to embarking on lab-based evaluation of analytes in solvent–aqueous mixtures. Example annotated full-scan mass spectra for water-DMI mixtures are given in Figure A2 of Appendix A.

4.3. Impact of Diluent on Sensitivity

High-sensitivity headspace analysis relies in part on effective partitioning of analyte into the headspace from the condensed phase [38] (pp. 18−35). This partitioning is influenced by the relative properties of the analyte and the matrix. For trace analysis of solutions, the matrix approximates the solvent (or solvent mixture). This work evaluated moving from utilization of highly polar aqueous-only systems that favor partitioning of non-polar volatiles into the headspace (and hence their lower concentrations in Mix 1) to systems of lower polarity through use of an organic diluent (with poorer partitioning of non-polar compounds). This behavior is evident in Figure 4, where the drastic reduction in measured benzene and chloroform at moderate to high proportions of DMI prompted the creation of Mix 2—with higher concentrations of non-polar analytes—to better evaluate method performance under these conditions. Interestingly, more polar analytes did not show the opposite behavior; for several, there was a modest increase in headspace response (methanol, in particular), but in most cases there was a small decline.
In practical terms, these results suggest that when LOQ is an important consideration for the method, then it is likely better to conduct the headspace analysis at low proportions of diluent; generally 10% or less. Hence, it is recommended that the initial dissolution of the test article in diluent solvent is prepared as concentrated as possible. Where sensitive analysis of non-polar analytes is not a requirement, then higher proportions of diluent could be considered. Note, however, that adding a small proportion of water (here, up to 14%) to neat DMI increases the sensitivity for some non-polar compounds by over 200% (see Figure A3 of Appendix A).
In summary, given the complexity of partitioning in mixed-solvent systems, it is recommended that an empirical investigation is performed for the full target compound list across a range of diluent solvent–water mixtures. When simultaneous headspace analysis of both very polar and non-polar analytes is required, a compromise diluent solvent–water mix should be used. If LOQs or other performance criteria for all analytes cannot be achieved, due to compromised headspace partitioning, then the separate preparation of samples for polar and non-polar analysis is recommended. This is economically feasible for headspace-SIFT-MS, due to the rapid analysis times compared to GC [11].

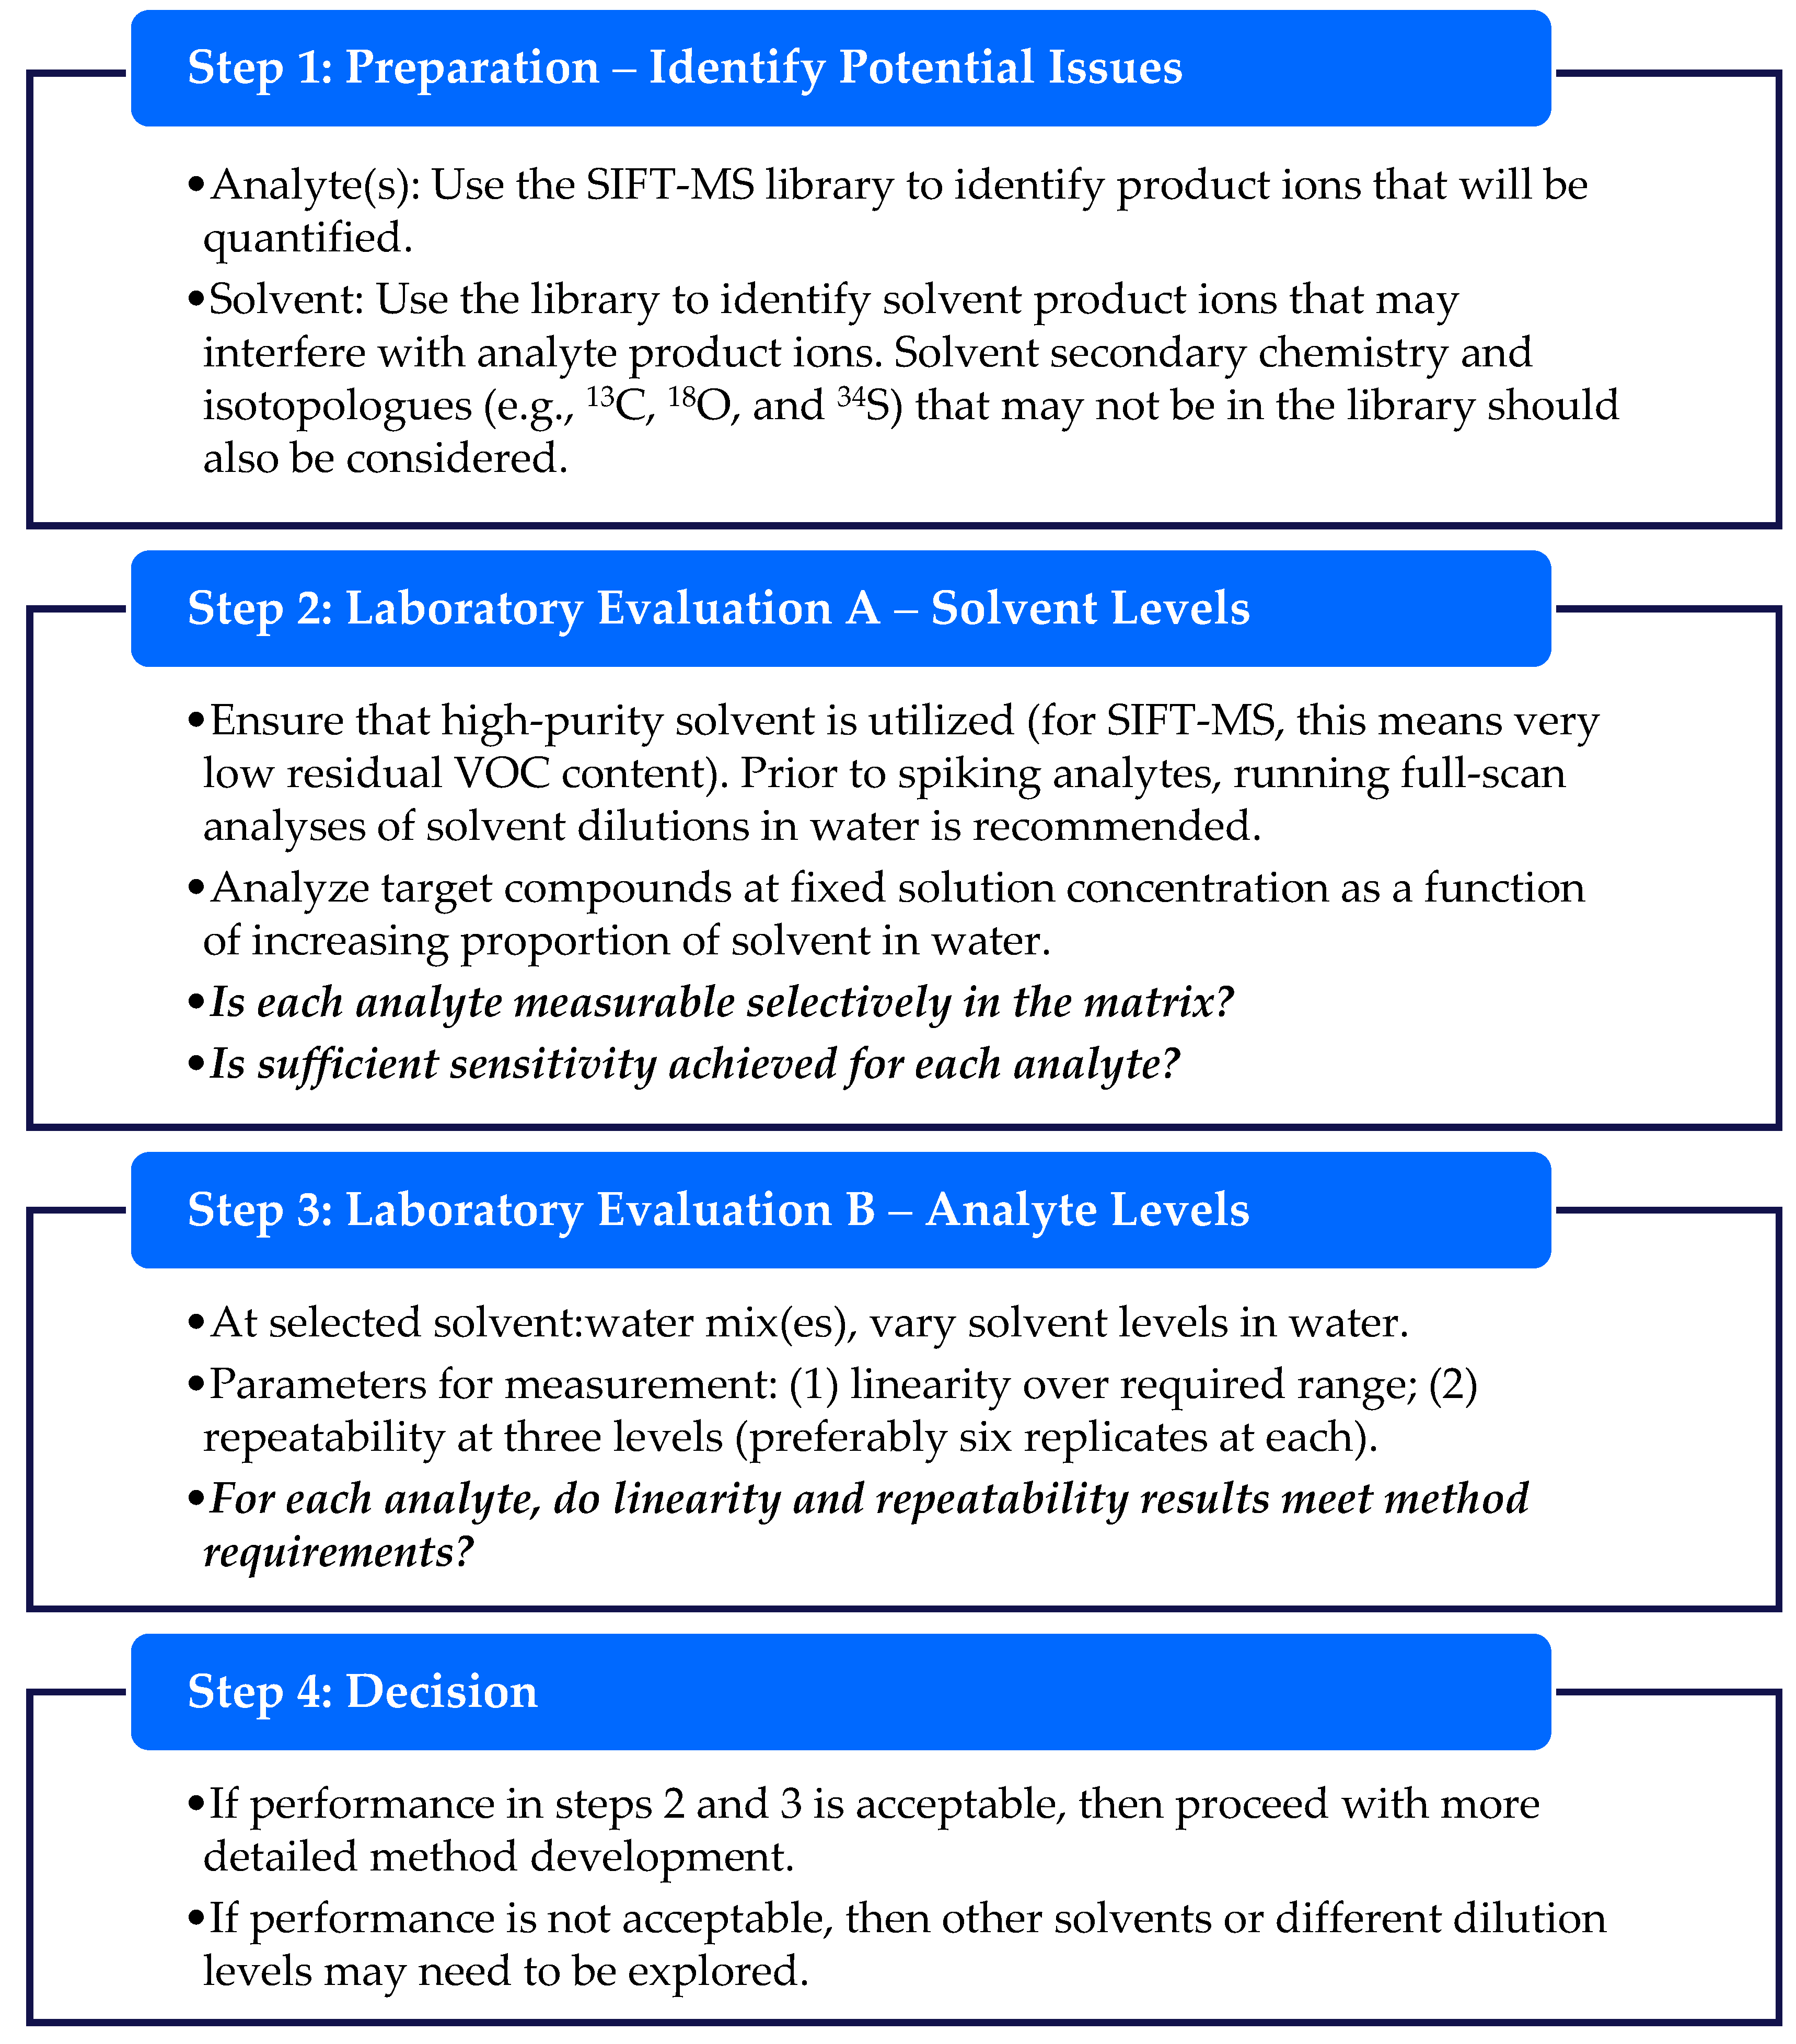
4.4. A Workflow for Identifying and Evaluating Alternative Diluent Solvents

The results reported in this study enable some practical guidelines to be developed for the identification and utilization of non-aqueous diluent solvents with headspace-SIFT-MS analysis. The approach taken will usually involve dissolving the article in a compatible solvent, then diluting the solution in water to prevent the solvent from consuming the SIFT-MS reagent ions (Figure 1). This maintains the ability of the SIFT-MS instrument to quantify the analytes in the presence of the solvent (Figure 1). Typically, no more than 20% of the reagent ion signal should be consumed. Dilution in water may also be beneficial for analysis of non-polar analytes such as benzene and chloroform (Figure 4).
Prior to commencing experimental work, various properties of the proposed diluent should be assessed against the suitability criteria listed in Table 8. These criteria are primarily concerned with not overloading the SIFT-MS instrument, while ensuring the solvent purity supports selectivity, LOQ, and recovery performance. The positive, neutral, and negative properties of the six diluents evaluated in this study are shown in Table 8 for these criteria. Most compatible solvents do not fulfil all criteria listed, but meeting several criteria is usually sufficient for their application. In contrast, solvents such as acetone and diethyl ether are unsuitable diluents, because they partition significantly to headspace and react rapidly with the SIFT-MS reagent ions. Note that additional considerations may be involved in the decision-making process, including the cost of high-purity solvent and environmental/workplace safety. Once a potentially compatible diluent has been identified, the general workflow for evaluating the solvent and specific analytes is summarized in Figure 8. This workflow also applies to previously utilized diluents with new target compound lists.
The workflow presented in Figure 8 facilitates efficient proof-of-concept evaluation for a new method. Full method development and method validation will be required when the data review in Step 4 deems that performance of the diluent is acceptable.

5. Conclusions

The results obtained in this study demonstrate that headspace-SIFT-MS can be utilized to analyze volatile impurities in water-insoluble articles, by first dissolving the article in a compatible solvent, then diluting it in water (Table 7). Dilution in water is usually necessary, because it prevents the diluent solvent from consuming the SIFT-MS reagent ions and hence maintains the ability to quantify the analytes in the presence of the solvent (Figure 1). Typically, no more than 20% of the reagent ion signal should be consumed. DMI can be used neat but dilution in water is beneficial for analysis of non-polar analytes (such as benzene and chloroform; Figure 4) that otherwise suffer significant degradation of LOQ. Hence, method development should determine the optimal diluent solvent:water ratio for the target compound list.
Additional interferents may be significant when utilizing non-aqueous diluents with SIFT-MS compared to conventional aqueous headspace analysis. In the first instance, these can be investigated using the SIFT-MS library, but experimental verification is essential, with both full scan analysis of the solvent mix and linearity analysis of each target compound in the solvent mix being the recommended minimum investigation.
This study provides a platform upon which broader headspace-SIFT-MS applications can be developed for water-insoluble drug articles, both in residual solvent analysis and more broadly for volatile impurity analysis. It may also be applied to analysis of packaging, food, and consumer products, as well as environmental matrices. Examples of use cases include the measurement of mineral oil hydrocarbons from recycled packaging, odor analysis of wastewater samples, analysis of volatile pollutants in soil, and the measurement of impurities in consumer goods, including benzene in dry shampoo and sunscreen products.

Supplementary Materials

The following supporting information can be downloaded at: https://www.mdpi.com/article/10.3390/analytica4030024/s1, Figures S1–S7; Tables S1–S23. These comprise most of the dataset for this article.

Author Contributions

Conceptualization, M.J.P., L.P.S. and V.S.L.; methodology, M.J.P.; formal analysis, M.J.P.; investigation, M.J.P.; data curation, M.J.P. and V.S.L.; writing—original draft preparation, V.S.L.; writing—review and editing, M.J.P., L.P.S. and V.S.L.; visualization, V.S.L. All authors have read and agreed to the published version of the manuscript.

Funding

This research received no external funding.

Data Availability Statement

The data that support the findings of this study are available primarily in the Supplementary Materials. Additional data are available upon reasonable request from the authors.

Acknowledgments

We thank the reviewers for helpful comments that have improved the article.

Conflicts of Interest

M.J.P. is an employee of Element Materials Technology (formerly Anatune) in Cambridge, United Kingdom, a distributor of commercial SIFT-MS instruments in the United Kingdom and the Republic of Ireland. L.P.S. and V.S.L. are employees of Syft Technologies entities in the United States of America and New Zealand, respectively. Syft Technologies is a manufacturer of commercial SIFT-MS instruments.

Glossary

DIMSdirect-injection mass spectrometry
DMACN,N-dimethylacetamide
DMFN,N-dimethylformamide
DMI1,3-dimethyl-2-imidazolidinone
DMSOdimethyl sulfoxide
GCgas chromatography
GC-FIDgas chromatography-flame ionization detection
HS-GCheadspace-gas chromatography
IPAisopropyl alcohol
LCliquid chromatography
LOQlimit of quantitation
MEKmethyl ethyl ketone
PTR-MSproton transfer reaction mass spectrometry
RSDrelative standard deviation
SIFT-MSselected ion flow tube mass spectrometry
TCEtrichloroethylene
THFtetrahydrofuran
USPUnited States Pharmacopeia
VOCvolatile organic compound

Appendix A. Additional Figures

Figure A1. Blank-subtracted responses (normalized to the 10 mL aqueous solution measurement) for headspace-SIFT-MS analysis of (a) acetonitrile, (b) isopropyl alcohol, (c) methanol, and (d) toluene in five DMI–water mixtures as a function of sample volume. The reagent ion–product ion pair for a given analyte is indicated in parentheses (first letter and product ion m/z, respectively).
Analytica 04 00024 g0a1
Figure A2. Full-scan SIFT-MS spectra of various water–DMI mixtures obtained from 15−250 m/z using the (a) H3O+, (b) NO+, and (c) O2+• reagent ions (approx. 30−50-fold zoom from reagent ion signals). Reagent ion and DMI features are annotated (with secondary peaks only problematic at very high proportions of DMI). Other spectral features greater than 40 m/z are from impurities in the solvent and could potentially interfere with analyte product ions in trace headspace analysis.
Analytica 04 00024 g0a2
Figure A3. Addition of a small amount of water to DMI significantly enhances the response of non-polar analytes.
Analytica 04 00024 g0a3

References

  1. International Council for Harmonization of Technical Requirements for Pharmaceuticals for Human Use (ICH). Impurities: Guideline for Residual Solvents Q3C(R8). 2021. Available online: https://database.ich.org/sites/default/files/ICH_Q3C-R8_Guideline_Step4_2021_0422_1.pdf (accessed on 23 March 2023).
  2. United States Pharmacopeia. Residual Solvents 〈467〉; United States Pharmacopeia: Rockville, MD, USA, 2007. [Google Scholar]
  3. United States Pharmacopeia. Residual Solvents—Verification of Compendial Procedures and Validation of Alternative Procedures 〈1467〉; United States Pharmacopeia: Rockville, MD, USA, 2019. [Google Scholar]
  4. International Council for Harmonization of Technical Requirements for Pharmaceuticals for Human Use (ICH). ICH Guideline M7(R1) on Assessment and Control of DNA Reactive (Mutagenic) Impurities in Pharmaceuticals to Limit Potential Carcinogenic Risk. 2017. Available online: https://www.ema.europa.eu/en/documents/scientific-guideline/ich-guideline-m7r1-assessment-control-dna-reactive-mutagenic-impurities-pharmaceuticals-limit_en.pdf (accessed on 28 September 2022).
  5. European Medicines Agency. Questions and Answers for Marketing Authorisation Holders/Applicants on the CHMP Opinion for the Article 5(3) of Regulation (EC) No 726/2004 Referral on Nitrosamine Impurities in Human Medicinal Products, EMA/409815/2020. Available online: https://www.ema.europa.eu/en/documents/referral/nitrosamines-emea-h-a53-1490-questions-answers-marketing-authorisation-holders/applicants-chmp-opinion-article-53-regulation-ec-no-726/2004-referral-nitrosamine-impurities-human-medicinal-products_en.pdf (accessed on 15 September 2022).
  6. United States Food and Drug Administration. Guidance for Industry. Control of Nitrosamine Impurities in Human Drugs. 2021. Available online: https://www.fda.gov/media/141720/download (accessed on 15 September 2022).
  7. McEwan, M.J. Direct analysis mass spectrometry. In Ion Molecule Attachment Reactions: Mass Spectrometry; Fujii, T., Ed.; Springer: New York, NY, USA, 2015; pp. 263–317. [Google Scholar]
  8. Taylor, A.J.; Beauchamp, J.D.; Langford, V.S. Non-destructive and high-throughput—APCI-MS, PTR-MS and SIFT-MS as methods of choice for exploring flavor release. In Dynamic Flavor: Capturing Aroma Release Using Real-Time Mass Spectrometry; Beauchamp, J.D., Ed.; American Chemical Society: Washington DC, USA, 2021; pp. 1–16. [Google Scholar] [CrossRef]
  9. Smith, D.; McEwan, M.J.; Španěl, P. Understanding gas phase ion chemistry is the key to reliable selected ion flow tube-mass spectrometry analyses. Anal. Chem. 2020, 92, 12750–12762. [Google Scholar] [CrossRef] [PubMed]
  10. Biba, E.; Perkins, M.J.; Langford, V.S. Stimuli to the Revision Process: High-Throughput Residual Solvent Analysis Using Selected Ion Flow Tube Mass Spectrometry (SIFT-MS). U. S. Pharmacopeia. Pharm. Forum. 2021, 47, 1. Available online: https://online.usppf.com/usppf/document/GUID-2EE1BF6B-C82B-4F11-8E0B-C5520A4E8C3D_10101_en-US (accessed on 15 January 2023).
  11. Perkins, M.J.; Hastie, C.; Whitlock, S.E.; Langford, V.S. Pharmaceutical residual solvent analysis: A comparison of GC-FID and SIFT-MS performance. AppliedChem 2023, 3, 18. [Google Scholar] [CrossRef]
  12. Smith, D.; Španěl, P.; Demarais, N.; Langford, V.S.; McEwan, M.J. Recent developments and applications of selected ion flow tube mass spectrometry (SIFT-MS). Mass Spec. Rev. 2023, e21835. [Google Scholar] [CrossRef]
  13. Perkins, M.J.; Langford, V.S. Standard validation protocol for selected ion flow tube mass spectrometry methods applied to direct headspace analysis of aqueous volatile organic compounds. Anal Chem. 2021, 93, 8386–8392. [Google Scholar] [CrossRef] [PubMed]
  14. Perkins, M.J.; Langford, V.S. Application of headspace-SIFT-MS to direct analysis of hazardous volatiles in drinking water. Environments 2022, 9, 124. [Google Scholar] [CrossRef]
  15. Hastie, C.; Thompson, A.; Perkins, M.J.; Langford, V.S.; Eddleston, M.; Homer, N. Selected ion flow tube-mass spectrometry (SIFT-MS) as an alternative to gas chromatography/mass spectrometry (GC/MS) for the analysis of cyclohexanone and cyclohexanol in plasma. ACS Omega 2021, 6, 32818–32822. [Google Scholar] [CrossRef]
  16. Perkins, M.J.; Langford, V.S. Application of routine analysis procedures to a direct mass spectrometry technique: Selected ion flow tube mass spectrometry (SIFT-MS). Rev. Sep. Sci. 2021, 3, e21003. [Google Scholar] [CrossRef]
  17. Perkins, M.J. Methanolic Extraction of Soils by Automated Selected ion Flow Tube Mass Spectrometry (SIFT-MS). Anatune Application Note. Available online: http://bit.ly/3XeCaSI (accessed on 14 January 2023).
  18. Smith, D.; Španěl, P. Selected ion flow tube mass spectrometry (SIFT-MS) for on-line trace gas analysis. Mass Spec. Rev. 2005, 24, 661–700. [Google Scholar] [CrossRef]
  19. Dai, L.; Quiroga, A.C.; Zhang, K.; Runes, H.B.; Yazzie, D.T.; Mistry, K.; Chetwyn, N.P.; Dong, M.W. A generic headspace GC method for residual solvents in pharmaceuticals: Benefits, rationale, and adaptations for new chemical entities. LCGC North Am. 2010, 28, 54–66. Available online: https://www.researchgate.net/publication/281259692 (accessed on 23 March 2023).
  20. Langford, V.S. SIFT-MS: Quantifying the volatiles you smell … and the toxics you don’t. Chemosensors 2023, 11, 111. [Google Scholar] [CrossRef]
  21. Hera, D.; Langford, V.S.; McEwan, M.J.; McKellar, T.I.; Milligan, D.B. Negative reagent ions for real time detection using SIFT-MS. Environments 2017, 4, 16. [Google Scholar] [CrossRef] [Green Version]
  22. Langford, V.S.; Billiau, C.; McEwan, M.J. Evaluation of the efficacy of SIFT-MS for speciation of wastewater treatment plant odors in parallel with human sensory analysis. Environments 2020, 7, 90. [Google Scholar] [CrossRef]
  23. Langford, V.S.; Du Bruyn, C.; Padayachee, D. An evaluation of selected ion flow tube mass spectrometry for rapid instrumental determination of paper type, origin and sensory attributes. Packag. Technol. Sci. 2021, 34, 245–260. [Google Scholar] [CrossRef]
  24. Prince, B.J.; Milligan, D.B.; McEwan, M.J. Application of selected ion flow tube mass spectrometry to real-time atmospheric monitoring. Rapid Commun. Mass Spectrom. 2010, 24, 1763–1769. [Google Scholar] [CrossRef]
  25. Wagner, R.L.; Farren, N.J.; Davison, J.; Young, S.; Hopkins, J.R.; Lewis, A.C.; Carslaw, D.C.; Shaw, M.D. Application of a mobile laboratory using a selected-ion flow-tube mass spectrometer (SIFT-MS) for characterisation of volatile organic compounds and atmospheric trace gases. Atmos. Meas. Tech. 2021, 14, 6083–6100. [Google Scholar] [CrossRef]
  26. Syft Technologies Limited. SIFT-MS Compound Library; Syft Technologies Limited: Christchurch, New Zealand, 2006. [Google Scholar]
  27. Syft Technologies Limited. SIFT-MS Compound Library; Syft Technologies Limited: Christchurch, New Zealand, 2014. [Google Scholar]
  28. Perkins, M.J. Unpublished Kinetic Data for 1,3-Dimethyl-2-imidazolidinone; Element Materials Technology: Cambridge, UK, 2023; Data available on request. [Google Scholar]
  29. Španěl, P.; Smith, D. SIFT studies of the reactions of H3O+, NO+, and O2+• with a series of alcohols. Int. J. Mass Spectrom. Ion Proc. 1997, 167/168, 375–388. [Google Scholar] [CrossRef]
  30. Perkins, M.J. Unpublished Kinetic Data for Triacetin; Element Materials Technology: Cambridge, UK, 2023; Data available on request. [Google Scholar]
  31. Španěl, P.; Ji, Y.; Smith, D. SIFT studies of the reactions of H3O+, NO+, and O2+• with a series of aldehydes and ketones. Int. J. Mass Spectrom. Ion Proc. 1997, 165/166, 25–37. [Google Scholar] [CrossRef]
  32. Španěl, P.; Smith, D. Selected ion flow tube studies of the reactions of H3O+, NO+, and O2+• with several amines and some other nitrogen-containing molecules. Int. J. Mass Spectrom. 1998, 176, 203–211. [Google Scholar] [CrossRef]
  33. Španěl, P.; Smith, D. SIFT studies of the reactions of H3O+, NO+ and O2+• with several aromatic and aliphatic hydrocarbons. Int. J. Mass Spectrom. 1998, 181, 1–10. [Google Scholar] [CrossRef]
  34. Španěl, P.; Smith, D. Selected ion flow tube studies of the reactions of H3O+, NO+, and O2+• with some chloroalkanes and chloroalkenes. Int. J. Mass Spectrom. 1999, 184, 175–181. [Google Scholar] [CrossRef]
  35. Arnold, S.T.; Viggiano, A.A.; Morris, R.A. Rate constants and product branching fractions for the reactions of H3O+ and NO+ with C2−C12 Alkanes. J. Phys. Chem. A 1998, 102, 8881–8887. [Google Scholar] [CrossRef]
  36. Dryahina, K.; Polasek, M.; Španěl, P. A selected ion flow tube, SIFT, study of the ion chemistry of H3O+, NO+, and O2+• ions with several nitroalkanes in the presence of water vapour. Int. J. Mass Spectrom. 2004, 239, 57–65. [Google Scholar] [CrossRef]
  37. Španěl, P.; Smith, D. SIFT studies of the reactions of H3O+, NO+, and O2+• with several ethers. Int. J. Mass Spectrom Ion Proc. 1998, 172, 239–247. [Google Scholar] [CrossRef]
  38. Kolb, B.; Ettre, L.S. Static Headspace-Gas Chromatography—Theory and Practice; Wiley-VCH: New York, NY, USA, 1997. [Google Scholar]
  39. Lide, D.R. (Ed.) CRC Handbook of Chemistry and Physics, 90th ed.; CRC Press: Boca Raton, FL, USA, 2009; ISBN 978-1-4200-9084-0. [Google Scholar]
  40. International Union of Pure and Applied Chemistry (IUPAC). Compendium of Analytical Nomenclature: Definitive Rules, Section 18.4.3.7. 2002. Available online: http://publications.iupac.org/analytical_compendium/Cha18sec437.pdf (accessed on 13 March 2021).
  41. Armbruster, D.A.; Pry, T. Limit of blank, limit of detection and limit of quantitation. Clin. Biochem. Rev. 2008, 29, S49–S52. [Google Scholar]
  42. LabSyft Software: Compound Library, Syft Technologies Limited: Christchurch, New Zealand, 2019.
  43. Perkins, M.J.; Langford, V.S. Simple, Rapid Analysis of N-Nitrosodimethylamine (NDMA) Impurity in Ranitidine Products Using SIFT-MS. Syft Technologies Application Note. 2022. Available online: http://bit.ly/3GB8wzW (accessed on 12 January 2023).
Figure 1. SIFT-MS, in contrast to chromatographic methods, has no temporal separation and analyzes samples in real time. Care must be taken to ensure that the instrument is not overloaded. Schematic diagram of ion signals for an instrument operating (a) within its dynamic range and (b) outside its dynamic range.
Analytica 04 00024 g001
Figure 2. Example headspace injections from toluene linearity measurements in 5% DMF solution. The blue-shaded box indicates the region over which concentration measurements were averaged (avoiding the initial spike).
Analytica 04 00024 g002
Figure 3. Ratio of measured headspace concentration of (a) acetonitrile, (b) benzene, (c), chloroform, and (d) tetrahydrofuran (see text for the rationale) in the solvent–water mix (0 to 10% solvent) to that obtained in aqueous solution. All measurements have had the blank subtracted. The legend indicates the matrix first, then the reagent ion (first letter), and finally the product ion m/z. For clarity, the benzene O2+• product ion (m/z 78) is not shown.
Analytica 04 00024 g003
Figure 4. Ratio of measured headspace concentration of (a) acetonitrile, (b) benzene, (c), chloroform, and (d) tetrahydrofuran (see text for the rationale) in DMAC-water, DMI-water, or DMSO–water mixtures (0 to 100% solvent) to that obtained in pure aqueous solution. All measurements have had the blank subtracted. The legend indicates the matrix first, then the reagent ion (first letter), and finally the product ion m/z. All product ions are shown.
Analytica 04 00024 g004aAnalytica 04 00024 g004b
Figure 5. Linearity of SIFT-MS response for (a) benzene and (b) tetrahydrofuran at 5% diluent solvent in water for Mix 1 across the high concentration range. Measurements have not had the blank subtracted. The legend indicates the matrix first, then the reagent ion (first letter), and finally the product ion m/z. For clarity, the benzene O2+• product ion (m/z 78) is not shown.
Analytica 04 00024 g005
Figure 6. Linearity of SIFT-MS response for (a) benzene in the high range, (b) benzene in the low range, (c) tetrahydrofuran in the high range, and (d) tetrahydrofuran in the low range at higher proportions of DMI in water for Mix 1 (Table 3). Measurements have not had the blank subtracted. The legend indicates the solvent and its proportion in water first, then the reagent ion (first letter), and finally the product ion m/z.
Analytica 04 00024 g006
Figure 7. Box and whisker plots summarizing recovery of (a) polar and (b) non-polar analytes (see text) for various combinations of DMI proportion in water and spike levels of standard mixes. Dotted pink lines show general acceptance criteria (±20%); ions that fall outside criteria are annotated, except for non-polar compounds from Mix 1 in 100% DMI (the very low partitioning precludes practical recovery).
Analytica 04 00024 g007
Figure 8. A summary workflow for evaluating diluent solvent–analyte compatibility with SIFT-MS. Untested diluents should be assessed using the criteria in Table 8 before starting this workflow.
Analytica 04 00024 g008
Table 1. Solvents evaluated in this study for compatibility with automated headspace-SIFT-MS.
Solvent NameAcronymMolecular FormulaMolecular Weight (MR)/g mol−1CAS
Number
N,N-DimethylacetamideDMACC3H7NO87.12127-19-5
N,N-DimethylformamideDMFC4H9NO73.0968-12-2
Dimethyl sulfoxideDMSOC2H6OS78.1367-68-5
1,3-Dimethyl-2-imidazolidinoneDMIC5H10N2O114.1580-73-9
MethanolCH4O32.0467-56-1
TriacetinC9H14O6218.20102-76-1
Table 2. Reagent ions, primary product ion mass-to-charge ratios (m/z), and branching ratio (in parentheses, %) for the diluent solvents. This table indicates the dominant product ion m/z, to avoid in method development.
SolventReagent Ions and Product Ion m/z (Ion Signal Ratio)Reference
H3O+NO+O2+•
N,N-Dimethylacetamide88 (100%)87 (85%)
117 (15%)
43 (30%)
87 (70%)
[26]
N,N-Dimethylformamide29 (5%)
74 (95%)
72 (45%)
73 (45%)
103 (10%)
43 (5%)
73 (95%)
[26]
Dimethyl sulfoxide79 (100%)78 (95%)
108 (5%)
79 (100%)[27]
1,3-Dimethyl-2-imidazolidinone115 (100%)114 (100%)113 (8%)
114 (92%)
[28]
Methanol33 (100%)62 (100%)31 (50%)
32 (50%)
[29]
Triacetin45 (20%)
59 (20%)
159 (60%)
159 (33%)
248 (67%)
103 (17%)
115 (16%)
116 (17%)
145 (50%)
[30]
Table 3. Generic “solution levels” (or “levels”) for Mix 1 and Mix 2 in two separate ranges (high and low, where low was used only with DMI) and the relationship with solution concentration for various analyte groups (see the text).
Level Used HereMix 1 Solution Concentration/ppmMix 2 Solution Concentration
(All Analytes)/ppm
Benzene, Toluene,
TCE
Chloroform, Isooctane, PropanalTHF, MEKAcetone, Acetonitrile, IPA, Nitromethane1-Butanol, Methanol
Low Range
10.00050.0020.020.050.10.05
20.0010.0040.040.10.20.1
30.00150.0060.060.150.30.15
50.00250.010.10.250.50.25
100.0050.020.20.51.00.5
150.00750.030.30.751.50.75
200.010.040.4121
High Range
200.010.040.4121
500.0250.112.552.5
1000.050.225105
2000.10.44102010
2500.1250.5512.52512.5
3000.150.66153015
4000.20.88204020
5000.25110255025
Table 4. Linearity (evaluated using the regression coefficient, R2) for the high range of Mix 1 (Table 3) for all product ions. For DMI at 50, 75, and 100%, results of polar and non-polar analytes are separated (emphasized using italics). Where applicable, results for the low range of Mix 1 and for Mix 2 are given in parentheses and footnotes, respectively.
SolventDilution Level in WaterRange of R2 Observed for High Range (Low Range)Exceptions
Water 10.9978–0.9999
(0.9928–0.9996)
(Isooctane (H113 ion): 0.8150)
DMAC5%0.9911–0.9981
10%0.9921–0.9992
25%0.9950–0.9999Isooctane (H113 ion): 0.9861
50%Polar: 0.9982–0.9998
Non-polar: 0.9399–0.9725
Propanal: 0.9679
Benzene: 0.3622–0.9222;
Isooctane (H113 ion): 0.8288
DMF5%0.9970–0.99991-Butanol: 0.9899
DMI 45%0.9955–0.9998
(0.9909–0.9996)2
10%0.9939–0.9998Isooctane (H113 ion): 0.9713
(0.9901–0.9996)3
25%0.9953–0.9998Isooctane (H113 ion): 0.9857
50%Polar: 0.9984–0.9999Propanal: 0.9791
Non-polar: 0.9807–0.9982Benzene: 0.9660–0.9870
75%Polar: 0.9980–0.9998Propanal: 0.9298
Non-polar: 0.9021–0.9791Isooctane: 0.6488 and 0.8483
100%Polar: 0.9947–0.9999Propanal: 0.8844
Non-polar: 0.8459–0.9948Isooctane: 0.7414 and 0.8715
DMSO5%0.9937–0.9999Benzene: 0.9685–0.9917
10%0.9929–0.9998Benzene: 0.9593–0.9943
25%0.9919–0.9993Benzene: 0.0024–0.2291;
Isooctane (H113 ion): 0.9865
Methanol5%0.9987–0.9999
Triacetin5%0.9961–0.9997
1 For water spiked with Mix 2 (low concentration range): R2 range was 0.9971–0.9998. 2 Acetonitrile: 0.9733; benzene (N78 ion): 0.9859; isooctane (H113 ion): 0.5185. 3 Benzene (N78 ion): 0.9813; benzene (O78 ion): 0.9862; isooctane (H113 ion): 0.7055. 4 For DMI spiked with Mix 2: (i) at 10% (low concentration range), R2 range was 0.9940–0.9998 (exceptions isooctane (H113 ion): 0.9836; methanol: 0.9800), and (ii) at 100% (high range), R2 range was 0.9912–0.9999 (exceptions chloroform (O85 ion): 0.8495, isooctane (H113 ion): 0.6504; isooctane (N113 ion): 0.3596).
Table 5. Repeatability performance (shown as range of %RSD) across all product ions (with footnoted exceptions) for Mix 1. For 100% DMI with Mix 2 6.
SolventDilution Level in Water Analyte Level
50250500
Water1.2—2.6%2.1–6.9%0.93–2.7%
DMAC 15%2.1–7.6%1.3–6.3%1.2–4.5%
10%1.7–8.9%4.3–10.0%2.2–8.0%
25%1.1–9.2%1.5–6.6%0.74–3.9%
50%1.1–8.1%2.8–9.1%1.9–7.8%
DMF 25%1.5–6.5%0.66–7.0%0.55–4.6%
DMI 35%1.3–8.0%0.83–4.8%1.4–4.8%
10%1.0–9.8%1.2–3.5%3.5–7.6%
25%2.7–7.7%2.1–4.3%3.5–7.6%
50%0.93–9.7%1.2–9.9%1.3–4.4%
75%1.1–3.8%1.1–4.3%0.77–7.2%
100%0.76–5.3%0.50–3.3%0.70–3.0%
DMSO 45%1.3–6.1%1.6–8.9%1.8–5.6%
10%5.4–8.7%0.55–6.4%0.57–2.9%
25%1.0–6.9%1.0–6.2%1.9–7.7%
Methanol 55%1.2–5.6%1.6–5.0%2.2–17.1%
Triacetin5%1.3–9.6%0.91–5.1%0.63–5.4%
1 DMAC: One isooctane ion (H113) is problematic. At both 5% and 10% dilution, RSD at the 50 level is approx. 37%. At 25%, RSDs at the 50 and 250 levels are 92% and 17%, respectively. At 50%, only polar species are shown in the table. Non-polar species including isooctane fall in the range 19.1% to 66.2%. 2 DMF: At 50 level, (i) 1-butanol has 30%RSD due to interference, and (2) benzene is 7.3–85% due to a significant unidentified background being subtracted for NO+ 78. 3 DMI: At 50% dilution, the TCE ions are 20.7% and 23.6%RSD. At both 75% and 100% dilutions, ranges in italics are for polar species only. For 75% dilution, non-polar species are in the ranges 8.9–38% and 2.7–77% for the 50 and 250 levels, respectively. For 100% dilution, non-polar ranges are 3.0–870%, 3.2–205%, and 5.6–20.6%, respectively for the 50, 250, and 500 levels. 4 DMSO: Interference of DMSO with benzene yields less repeatable measurements at all solvent dilutions (see Table S16). For 5%, 10%, and 25% DMSO, the isooctane H113 product ion has RSDs of 14.6%, 48.4% and 9.6%, respectively, at analyte level 50. 5 Methanol: Replicate 2 at 500 level is marginal and could be eliminated as an outlier. However, it is retained in these calculations. The RSD drops to maximum of 13.3% when this replicate is removed. 6 DMI (100%) spiked with Mix 2 ranges are: 50 level: 1.5–11.1% (with exceptions for chloroform and isooctane). 250 level: 1.2–7.1% (with exceptions for chloroform and isooctane). 500 level: 0.69–4.5% (with exceptions for isooctane).
Table 6. Limits of quantitation (LOQ) summarized for several DMI-aqueous systems with Mixes 1 and 2. Note that LOQs are quoted as levels not as solution concentrations (see Table 3 for the correlation).
Proportion of DMI in WaterMix No.Limit of Quantitation
(Expressed as Levels; Table 3)
Exceptions
0% (Water)12
5%15Isooctane (both ions)
10%15Benzene (N78); isooctane (H113)
10%22
100%1Polar: 5Isopropyl alcohol (N59)
Non-polar: >20Toluene (both ions): level 10
100%25Chloroform (O85); isooctane (both ions); isopropyl alcohol (N59)
Table 7. Solvents compatible with headspace SIFT-MS analysis (with usable reagent ions), upper limit recommended in water, and some practical comments.
SolventPractical Reagent IonsLimit *Comments
DMACH3O+, NO+, O2+•≤50%Impacts analysis of acetone
DMFH3O+, NO+, O2+•≤10%Impacts analysis of 1-butanol, butylamines, etc.
DMSOH3O+, NO+, O2+•≤25%Impacts analysis of benzene and isooctane
DMIH3O+, NO+, O2+•≤100%Watch for impurities in solvent, including adsorption from air
MethanolNO+≤20%Useful if analyte(s) selectively analyzed using NO+
TriacetinH3O+, NO+, O2+•<6%Limited by miscibility in water
* Maximum percentage recommended (diluted in water).
Table 8. Suitability criteria for identification of compatible diluent solvents and their positive (✓), neutral (blank cell), and negative (✕) contributions for the six solvents evaluated in this study.
Desirable Diluent PropertiesSolvent Reagent Ions and Product Ion m/z (Ion Signal Ratio)
DMACDMIDMFDMSOMethanolTriacetin
Low volatility
Miscibility in water
Poor headspace partitioning from water
Low sensitivity of SIFT-MS reagent ion(s) 1
Solvent purity 2
1 This is primarily determined by the reaction rate coefficient (see Refs. [18,20]). It is important that the sensitivity is low when a solvent partitions significantly to headspace (e.g., methanol), due to the absence of chromatography. 2 The purity of the headspace is most significant for SIFT-MS. Susceptibility to absorption of volatile impurities from the atmosphere is also an important consideration.
Disclaimer/Publisher’s Note: The statements, opinions and data contained in all publications are solely those of the individual author(s) and contributor(s) and not of MDPI and/or the editor(s). MDPI and/or the editor(s) disclaim responsibility for any injury to people or property resulting from any ideas, methods, instructions or products referred to in the content.

