Article

Physicochemical Parameters and Terroir Assessment of Mineral Water from Mount Smolikas in Greece: A Two-Year Study

by
Vassilis Athanasiadis
,
Theodoros Chatzimitakos
,
Dimitrios Kalompatsios
,
Eleni Bozinou
,
Dimitris P. Makris
and
Stavros I. Lalas
*
Department of Food Science and Nutrition, University of Thessaly, GR-43100 Karditsa, Greece
*
Author to whom correspondence should be addressed.
Analytica 2023, 4(3), 280-299; https://doi.org/10.3390/analytica4030022
Submission received: 12 May 2023 / Revised: 28 June 2023 / Accepted: 1 July 2023 / Published: 4 July 2023

Abstract

:
Every day, more and more consumers choose to drink bottled water instead of tap water, since they believe that it is superior in quality. One of the criteria used by European consumers to choose bottled water is the geographical region of the spring. The flavor of the water is an additional factor that influences consumers’ choices. As a result, determining the flavor of water is gaining popularity and is thus turning into a prominent field of study. However, studies on the potential environmental factors that affect the sensory characteristics of water (i.e., “terroir” of water) are limited. To this end, we investigated the composition of natural mineral water spring from Mount Smolikas in Greece over a two-year period to find any potential alterations in water composition. The physicochemical parameters (pH, conductivity, turbidity, color, and total hardness) of the water samples were examined, along with their content in metal ions, inorganic salts (cations and anions), and total organic carbon. Additionally, the water samples were analyzed for their content of off-odor volatile compounds (i.e., 2-methylisoborneol and geosmin) that can be naturally found in water. The study also examined the correlation of climate conditions (accumulated rainfall and mean temperature) with the parameters above using a principal component analysis and a multivariate correlation analysis. The results showed that the physicochemical characteristics of water samples complied with European regulations. Metals, anions, and cations were all below the corresponding parametric values established by the European Commission. The off-odor organic compounds, 2-methylisoborneol, and geosmin, had average concentrations of 9.4 and 2.7 ng/L, respectively. Chromium and aluminum elevated concentrations might be attributed to specific ores present near the water source, while pH, conductivity, total hardness, nitrates, and off-odor compounds levels could be fluctuated due to local climate conditions. The study revealed a good positive correlation (>0.7) between the quantity of rainfall and the level of potassium cations. Moreover, a strong negative correlation (>0.9) was observed between magnesium cations and the mean temperature of the local area. The study can be used as a benchmark for future studies to determine the terroir of mineral water.

1. Introduction

Water is commonly recognized as a “universal solvent”, due to its versatile applications in diverse fields such as sterilization, cleaning, cosmetics, and food processing [1,2,3]. Moreover, water is a necessary component for biological and chemical processes, leading to a paramount need for water both for human consumption and for industrial processes [4]. Specifically, water provides humans with metal ions, such as Ca2+, Mg2+, and Na+, which are of paramount importance in physiological processes [5]. Mineral waters can also serve as supplements that decrease the risk of micronutrient deficiencies that are crucial for bone health, including boron, strontium, and fluoride [6]. Most of the drinking water derives from rivers, lakes, springs, aquifers, and rainwater [7]. Water is mainly supplied via a tap, while many companies sell bottled water. Many researchers propose that the rise in bottled water consumption can be attributed to a general inadequacy in the quality of tap water. The assumption is that bottled water has superior health benefits and taste attributes relative to tap water, as a result of bottled water advertisements that presents it as a fashionable and trendy product [8,9,10]. The loss of confidence in the quality of tap water may have stemmed from incidents in which pathogenic microorganisms were detected in water sources, storage facilities, or the distribution system [4,11,12]. The presence of chemical pollutants, such as pesticides, in media reports may potentially lead to a reduction in overall confidence in the purity of water and the health implications associated with consuming tap water [13]. The inadequate sensory attributes of tap water represent a third factor contributing to the deficient level of confidence among consumers [14,15]. Certain studies suggest that consumers perceive bottled water to possess better health and sensory characteristics compared to tap water [15,16]. This evidence is also substantiated by several studies that highlight the superior quality of bottled water in comparison to tap water [17,18,19].
The concept of “terroir” specifies a defined geographical region where a distinct or exceptional form of agriculture yields a particular variety of wine or cuisine [20]. The term “terroir” pertains to the unique characteristics of a specific location, which can be identified through the examination of its soil, vegetation, and topography [21]. It is derived from the French word terre, meaning soil [22]. While the concept of terroir initially emerged for French wine, it has now been adapted to other agricultural products to legally protect them from fraudulent claims [23]. In addition, despite the research on the quality of potable water, consumers tend to evaluate its safety primarily through its sensory qualities, such as taste, odor, mouthfeel, and color [24]. These phenomena led to the assumption that water can also exhibit a terroir, whereby it serves as an indicator of the accessibility and provision of freshwater, from which the water is sourced [25]. Natural mineral water is considered to possess a terroir due to the influence of diverse factors pertaining to its composition, which can impact its aroma and flavor. Water terroir is a term gaining popularity in the food and beverage industry, which refers to the impact that different components of water have on the taste and production of certain food and beverages. Several studies have examined the taste of potable water in correlation with the levels of inorganic compounds. The majority of the current knowledge is derived from research on taste from individual salts that are dissolved in drinking water [26]. Studies pertaining to the major alkaline earth cations, including alkali metals and other metals, have been conducted [27,28,29]. Bitter and salty tastes dominate the salts of divalent cations such as calcium and magnesium, with minor contributions from other basic tastes and metallic, astringent, and irritative sensations [30]. The olfactory sensory profiles characterized by moisture and soil-like aroma are predominantly attributed to the existence of terpenoids, specifically geosmin (trans-1,10-dimethyl-trans-9-decanol) and 2-MIB (2-methylisoborneol) [31]. 2-MIB and geosmin are tertiary alcohols of bacteriogenic origin that exhibit a low resistance to removal via conventional treatment technologies. The presence of these substances imparts a sensory profile characterized by a musty or earthy flavor and aroma to the aqueous medium (frequently associated with the utilization of surface water [32]), with a relatively low detection threshold of approximately 10 ng/L by humans [33].
The present study aimed to examine the physicochemical properties and the terroir of Goura mineral water spring on mount Smolikas (spring source altitude 1650 m), Western Macedonia, Greece in a two-year study. This is the first time that such an analysis has been carried out, to the best of our knowledge. In this study, the physicochemical measurements (pH, conductivity, turbidity, color analysis, and total hardness) as well as the influence of inorganic and organic compounds on the flavor of drinking water were investigated. In addition, essential inorganic compounds (metals, anions, and cations) were also examined. Organic compounds were explored; total organic carbon (TOC) alongside malodorous volatile compounds geosmin and 2-MIB. Finally, a principal component analysis and a multivariate correlation analysis were used to correlate the measured data. Correlation studies between climate conditions (accumulated rainfall and mean temperature of the local area) and the parameters above were utilized to examine the effect in the terroir of water samples.

2. Materials and Methods

2.1. Chemicals and Sampling Protocol

All reagents used were of analytical grade. Hydrochloric acid (37%) was obtained from Panreac (Barcelona, Spain). Geosmin, 2-methylisoborneol, 2-isopropyl-3-methoxypyrazine, sodium chloride, potassium chloroplatinate, potassium phthalate, and cobalt chloride were obtained from Sigma (St. Louis, MO, USA). Metals, anions, and cations calibration standards were bought from Agilent Technologies (Santa Clara, CA, USA). Turbidity and conductivity standards, along with pH buffer solutions, were purchased from HACH (Loveland, CO, USA). Ultrapure water used in the experiments was produced using an ultrapure water generator (Human corporation NEX Power 1000, Seoul, Republic of Korea) with a resistivity of 18.2 MΩ·cm.
The water samples were from the Goura mineral water spring on mount Smolikas (spring source altitude 1650 m), Western Macedonia, Greece. Water sampling was carried out in January, April, July, and October of 2021 and 2022. Sampling was carried out according to APHA methods 1060-A and 1060-B [34]. To ensure that sample containers were free of analytes of interest, glass containers were used. The containers were sterile to avoid contamination, so they were heated at 450 °C. In addition, the containers were amber-colored in order to minimize photodegradation of volatile compounds. The containers were filled with the water sample until no head-space area was existent and, during sampling, the formation of air bubbles was avoided by carrying the sampling at a slow pace. To achieve this, sampling points with excessive turbulence were avoided. Additionally, regarding the measurement of volatile compounds, an appropriate amount of water was added in glass vials (containing sodium chloride) and sealed so as to minimize the loss of volatiles. These vials were then further used for the volatiles assessment study. Concerning metal determination, the sample containers were acidified with nitric acid to avoid metal adsorption and precipitation. After sampling, water samples were kept both during transportation and until further processing in the laboratory refrigerator at 4 °C.
Measurements concerning physicochemical characteristics (pH, conductivity, and total hardness) were initially taken at the sampling point, whereas samples were re-examined in the laboratory. These initial measurements were carried out to capture the immediate conditions of the water samples. Following the sampling, the collected water samples were transported to the laboratory using methods consistent with APHA guidelines, as mentioned earlier. The purpose of transporting the samples to the laboratory was to perform additional measurements under controlled conditions, allowing for further analysis and comparison. During the laboratory analysis, it was found that there were no significant changes in the measured parameters (pH, electrical conductivity, and hardness) compared to the respective initial values obtained at the sampling point. This indicates that the transportation process and subsequent analysis did not introduce any substantial alterations to these water quality parameters.

2.2. pH

The pH of the samples was measured according to the APHA 4500-H+ B method [34]. Measurements were carried out in the sampling point. Moreover, additional measurements were taken in the laboratory. The pH was measured using a digital pH meter (XS Instruments, PC 60 VioLab with XS 201T DHS digital electrode, Carpi, Modena, Italy). The instrument was calibrated with buffer solutions at two points (pH 4.00 and 7.00) at room temperature (25 °C). Afterward, the water samples were thermostated for at least 1 h at room temperature and then the pH was measured. For each sample, at least three measurements were made and the results were expressed as an average of the measurements.

2.3. Conductivity

The conductivity of the samples was measured based on the APHA 2510-B method [34]. Measurements were carried out in the sampling point. Moreover, additional measurements were taken in the laboratory. The water samples were thermostated for at least 1 h at reach room temperature (25 °C) and then conductivity was measured with a conductivity meter (XS Instruments, PC 60 VioLab with conductivity cell 2301T, Carpi, Modena, Italy). The instrument was calibrated with standard solutions at 2 points (147 and 1413 µS/cm) at 25 °C. For each sample, at least three measurements were made, and the results were expressed as an average of the measurements.

2.4. Turbidity

The turbidity of the samples was measured according to the APHA 2130-B method [34]. Using nephelometry (Lovibond TB 211 IR, Tintometer, Dortmund, Germany), the turbidity values of the samples were measured. A reference curve was generated with 0.1, 20, 200, and 800 NTU standards. The limit of detection (LOD) and limit of quantification (LOQ) were calculated. The LOD value was calculated to be 0.04 NTU and the LOQ was 0.14 NTU. Values were measured according to the following equations:
LOD = 3.3 × (standard deviation of the reference curve)/Slope (S)
LOQ = 10 × (standard deviation of reference curve)/Slope (S)

2.5. Color Analysis

For the analysis of the color of the samples, the APHA 2120-B method [34] was chosen. Specifically, the color was determined spectrophotometrically by measuring the absorbance of the sample at 456 nm and the absorbance value was assigned to color units (CU) using a standard reference curve. To construct the standard reference curve, 1.246 g of potassium chloroplatinate and 1.00 g of crystalline cobalt chloride were dissolved in water and 100 mL of concentrated HCl was added. The mixture was filled with distilled water to a final volume of 1000 mL. The absorbance of this solution corresponded to 500 CU. Standards corresponding to 5, 10, 15, 20, 30, 40, 50, and 100 CU were then prepared at dilutions of 1.0, 2.0, 3.0, 4.0, 6.0, 8.0, 10.0, and 20.0 mL of stock solution to a final volume of 100 mL. Based on the calculations, LOD was calculated at 1.2 CU and LOQ at 4.0 CU. All samples were measured at least three times and averaged.

2.6. Total Hardness

The APHA 2340-B method [34] was chosen to measure the total hardness of the samples. Measurements were carried out in the sampling point. Moreover, additional measurements were taken in the laboratory. After calculating the concentration values for calcium and magnesium (see Section 2.7.3), the following formula was used to calculate the total hardness:
mg CaCO3/L = 2.497 [Ca, mg/L] + 4.118 [Mg, mg/L].

2.7. Inorganic Compounds

2.7.1. Metals

The APHA 3030-C and APHA 3125-B [34] methods were used to measure the metal content of the samples. The first method involves the nitric acid treatment for acid-extractable metals, whilst the latter describes the ICP-MS analysis. Before analysis with the inductively coupled plasma coupled to mass spectrometry (ICP-MS), 2% v/v HNO3 was added to the samples. The Agilent 7700 ICP-MS (Agilent Technologies, Santa Clara, CA, USA) instrument was operated under the following conditions: plasma power of 1550 W, plasma gas flow of 15 L/min, auxiliary gas flow of 0.90 L/min, carrier gas flow of 1.03 L/min, and sample uptake rate of 0.2 mL/min. Calibration curves were prepared for the quantification of each metal using five points and including a blank solution. To ensure accuracy, the calibration standard solution was analyzed before and after the analysis of the samples. Additionally, a blank solution was analyzed to ensure that no carryover effects occurred. Data were analyzed using ICP-MS MassHunter Workstation Software (version A.01.02). All samples were measured at least in triplicate and averaged. For this method, LOD and LOQ values were determined (Table 1).

2.7.2. Anions

Ion chromatography with a conductivity detector (IC-CD) based on the international standard ISO 10304-1:2007/Cor 1:2010 [35] was used to measure the anion content of the samples. Initially, a standard solution with a concentration of 1000 ppm of each anion was prepared. For this purpose, NaF, NaCl, NaNO2, NaBr, NaNO3, KH2PO4, Na2SO4 were used to measure the concentration of anions F, Cl, NO2, Br, NO3, PO43−, SO42−, respectively. Then, 1 mL of the above solution was transferred to a 100 mL volumetric flask and was diluted with ultrapure water. From this solution, standard curves for each anion were prepared, with appropriate dilutions.
All samples (25 μL) were introduced into a high-pressure ion chromatograph system (HPIC) (Dionex ICS-3000 Ion Chromatography System, Thermo Fisher Scientific, Waltham, MA, USA), which consisted of Dionex IonPac AG18/AS18-Fast-4 µm (2 × 150 mm) as stationary phase and 2.7 mM Na2CO3 + 1.0 mM NaHCO3 was used as mobile phase. The mobile phase flow was 1.2 mL and after separation, the ions were detected with a CD. For this method, LOD and LOQ were determined and the results are illustrated in Table 1.

2.7.3. Cations

IC-CD Ion Chromatography based on the international standard ISO 14911:1998 [36] was used to measure the cation content of the samples. All samples (25 µL) were introduced into a high-pressure ion chromatograph system (HPIC) (Dionex ICS-3000), which consisted of Shodex IC YS-50 (4.6 mm I.D. × 125 mm) as the stationary phase and 4 mM nitric acid in water with acetonitrile (90:10, v/v) as the mobile phase. The mobile phase flow was 1.0 mL and, after separation, the ions were detected with a CD. Cations measured were Li+, Na+, NH4+, K+, Mg2+, and Ca2+. Table 1 shows the LOD and LOQ values of the current method.

2.8. Total Organic Carbon

Total organic carbon (TOC) was measured using a TOC analyzer (Shimadzu TOC-5000 analyzer, Kyoto, Japan) with a non-dispersive infrared detector (NDIR) for the sensitive detection of carbon dioxide (CO2). Organic substances were completely oxidized to CO2 at a high temperature (680 °C) and platinum (Pt) catalyst. Instrument calibration was performed using potassium phthalate standard solutions with a range of 0.5 to 5 mg/L. Based on the calculations, the LOD was calculated equal to 0.15 mg C/L and the limit of quantification was 0.5 mg C/L.

2.9. Volatile Compounds

For the analysis of the volatile substances (2-methylisoborneol and geosmin), a headspace solid-phase microextraction (HS-SPME) method was employed. Then, 100 mL of water and 30 g of sodium chloride were added to a glass vial and sealed. Next, 20 µL of internal standard (2-isopropyl-3-methoxypyrazine) at a concentration of 0.1 mg/L was added to all samples. The solution was heated to 60 °C for 15 min for equilibration, then the fiber (50/30 μm DVB/CAR/PDMS, Supelco, Bellefonte, PA, USA) was placed through a septum in the headspace and extraction was carried out for 30 min. The fiber was then transferred to a gas chromatography system (Agilent 7890A, Santa Clara, CA, USA) with a coupled mass spectrometry detector, model 5975C, and an Agilent J&W DB-1 capillary column (30 m × 320 μm × 0.25 μm) (Agilent Technologies, Santa Clara, CA, USA). The flow of the carrier gas (He) was set at 1 mL/min and the temperature of the injection system at 250 °C, the temperature of the transport system at 280 °C, and the ion source at 250 °C. The identification and quantification (boldfaced masses) of the samples were performed in selected ion monitoring (SIM) mode (Table 2). Instrument calibration was performed using 2-MIB and geosmin mixture standard solutions with a concentration range of 1 to 100 ng/L.

2.10. Statistical Analysis

The values shown are the average of three measurements. A statistical comparison between means to find significant or non-significant differences was carried out using the ANOVA test. A statistical analysis was performed with SPSS Version 29.0 (SPSS, Inc., Chicago, IL, USA). Additionally, the statistical significance level was calculated in the one-way ANOVA (Analysis of Variance) with a post-hoc Tukey HSD (Honestly Significant Difference) Test Calculator (Tukey HSD used with Tukey–Kramer formula). The principal component analysis (PCA) and multivariate correlation analysis (MCA) were carried out using JMP® Pro 16 software (SAS, Cary, NC, USA).

3. Results and Discussion

Although the quality characteristics of natural mineral water are expected to maintain a consistent composition, they are not immune to all environmental influences. Despite the requirement for constant composition, the existing scientific literature recognizes that minor variations can occur due to various factors, including seasonal changes and meteorological phenomena, parameters acknowledged by the EU legislation [37,38]. The present study aimed to examine whether an association between climate data and the measured parameters in the drinking water samples exists. Therefore, climate data were acquired from Institute of Environmental Research and Sustainable Development, National Observatory of Athens (Annual climatological summary for 2021 and 2022) [39].
In the framework of the preparation of the River Basin Management Plans of Greece (Special Secretariat for Water—Ministry of the Environment and Energy of Greece), a wide range of geospatial data sets have been produced which are freely distributed and can be downloaded from the corresponding geoportal [40]. According to these datasets that have been incorporated and studied in a Geographic Information System, the broader area of Samarina is located in the northern-western part of the Aoos river sub-basin (Figure 1), belonging to the water district of Epirus (GR05).
The water district of Epirus has an area of about 10,000 km2 and is situated in the part of the country with the highest precipitation. From a geotectonic point of view, the area belongs to the Olonos-Pindos zone [41] and shows great sedimentation alternations such as carbonate, siliceous, and clastic formations. Its main characteristic is the Ophiolitic masses mainly consisting of ultramafic rocks such as peridotites and serpentinites and often accompanied by red cherts. Ophiolites are found tectonically displaced on the Tertiary flysch of the Pindos and they constitute a complicated petrological and geological unit which is extended widely in the mountainous area among Metsovo, Panagia, Vovoussa, Avdela, Samarina and Smolikas Mountain [42]. Figure 2 presents the hydrolithological formations in the broader area of the Aoos and Sarantaporos River Basins. Formations encoded as A1 and A3 correspond to the Flysch of Pindos and Ophiolite masses, respectively. Hydrogeologically, they both represent as a whole impermeable medium, with the possibility of forming smaller aquifers and springs within cracked sandstones or carbonate inlays, or on their top and most weathered layer, especially on areas of extended plant growth. C and C1 are the karst formations of the area. In particular, C corresponds to limestones and marbles with extended appearance and medium to high water permeability, while C1 are similar formations with limited appearance and fluctuating water permeability. Lastly, I1 and I3 are porous mediums, with I1 referring to alluvial deposits of fluctuating water permeability and I3 to deposits of molasse (marls, sandstones, and conglomerates) of rather low water permeability. Samarina water is a water originating from precipitation (snow and rain) that infiltrates into ground and gushes at the respective Goura spring. In fact, the dissolution of the ophiolites and relative mafic rock formations that are rich in Mg could justify that the Samarina water is a Mg-HCO3 hydrochemical type, dominated by HCO3 (106 mg/L) and Mg2+ (22.3 mg/L) and less by Ca2+ (2.4 mg/L), originated by the dissolution of carbonate formations. This is also confirmed by the ion ratio Mg2+/Ca2+ = 15.3 [43].

3.1. pH

Table 3 provides a summary of the physicochemical parameters of the samples examined herein, including the pH. The directive (EU) 2020/2184 [44] specifies the parametric value to be ≥6.5 and ≤9.5. It is well known that the precipitation of inorganic carbon can significantly impact the pH level in water. When inorganic carbon dissolves, it undergoes a series of chemical reactions that ultimately affect the protonation state of carbonic acid (H2CO3) and its derivatives [45]. Initially, when carbon dioxide (CO2) dissolves in water, it forms carbonic acid (H2CO3), which is a weak acid. The presence of carbonic acid leads to an increase in the concentration of hydrogen ions (H+) in the water, resulting in a decrease in pH. In low pH waters, carbonic acid (H2CO3) dominates due to the high concentration of hydrogen ions. As the pH of the water increases, the concentration of hydrogen ions decreases, leading to the dominance of bicarbonates (HCO3). Bicarbonates act as a buffer, helping to stabilize the pH within a narrow range around neutrality. The presence of bicarbonates contributes to the buffering capacity of the water, preventing drastic changes in pH due to external factors [45]. At high pH levels, carbonates (CO32−) become the dominant form of inorganic carbon species. The elevated pH suggests the presence of carbonates in the water. Carbonates contribute to the alkalinity of the water and can significantly influence the buffering capacity of the system. In our analysis, we measured the bicarbonate concentration at the sampling point (since at pH values close to 8.5, the bicarbonates form dominates and carbonates consist of <1% of the total inorganic carbon) [46] and it was found to be 103 ± 6 mg/L in all cases, using an acid-base titrimetric method. However, due to the changing equilibrium of bicarbonates, their concentration could fluctuate over time. Therefore, the measurement at the sampling point provides an indication of their presence but may not represent the overall bicarbonate content in the entire system [45]. The taste of drinking water is greatly affected by the pH level of water. To prevent the occurrence of a bitter taste, it is recommended to maintain a pH level within the range of 6.5 to 8.5. Beyond this range, the sensation of a metallic taste might occur at a pH of 6.5, while a slippery soda-like taste may be perceived at a pH of 8.5 and above [47]. Over the course of two years, the sample possessed an average pH value that was measured at 8.34. No statistically significant differences were observed (p > 0.05) between the samples within two years. Our results can be compared to other studies [48,49]. In a three-year span, Kouras et al. [48] investigated a wide variety of physicochemical characteristics of groundwater in Chalkidiki, Greece. They determined that the pH level had an average value of 6.8. Mitrakas et al. [49] studied the physicochemical properties of tap water in several regions of Greece. They measured an average pH level of 8.05 in the Samarina region of Greece.

3.2. Conductivity

The results of the conductivity measurements are summarized in Table 3. The parametric value (Directive (EU) 2020/2184) is specified for a value of 2500 μS/cm at 20 °C [44]. Water samples from January 2021, April 2021, and July 2022 had statistically significantly higher (p < 0.05) conductivity values than the other samples. The average conductivity between the two-year period was measured as 173.25 μS/cm, which is considerably lower than the corresponding parametric value. Several studies measuring conductivity were conducted and the results were fluctuated [48,50,51]. The observed variation could potentially be attributed to a range of environmental factors. Ignatov et al. [50] investigated physicochemical properties from mountain spring water Dolnata cheshma, Teteven, Bulgaria. The measured conductivity had an average value of 482 μS/cm. On the other hand, McCleskey et al. [51] studied the conductivity in water samples coming from different springs (mountain water, geothermal water, acid mine water, and sea water), including a sample from a mountain spring located in Boulder Creek, Colorado, USA. They measured an average conductivity level of 103 μS/cm. Kouras et al. [48] measured the electric conductivity of water in Chalkidiki city, Greece, which is located on the coast of Greece. The average conductivity in a three-year study was measured as 1406 μS/cm. The coastal spring exhibited higher values, indicating the likely impact of seawater.

3.3. Turbidity

The level of turbidity quantifies how cloudy the water is. An increase in turbidity levels results in a decrease in the transparency of the sample. Multiple components combine to form turbidity. It can be caused by several different purposes including mud, silt, sand, tiny pieces of decaying plants, microorganisms, algae, and chemical precipitates. Suspended particles in water can be caused by erosion, garbage discharge, or urban run-off [52]. Algae development can be indirectly aided by agricultural run-off, which also increases suspended particles. The increased run-off that occurs after a storm or flooding typically results in a rapid increase in turbidity in the surface water [53]. When determining whether water is safe for human consumption, turbidity is a major factor. There may be a high concentration of disease-causing organisms in the particles floating in muddy water [54]. The results of the turbidity value measurements are summarized in Table 3. The parametric value (Directive (EU) 2020/2184) [44] is determined as acceptable to consumers and without unusual variation. According to the World Health Organization [55], the human eye can detect turbidity at a threshold of approximately 4.0 NTU. To guarantee the efficacy of disinfection, it is essential that the level of turbidity does not exceed 1 NTU and is ideally maintained at a significantly lower level. Properly handled municipal water supplies may preserve turbidity below 0.5 NTU before disinfection [55]. The analyzed samples showed relatively low and acceptable turbidity values. However, statistically significant differences were also measured (p < 0.05) between the samples. Specifically, the water sample of January 2021 had a higher value of turbidity than any other sample, from approximately 45 to 85%. Various anthropogenic activities, such as agriculture, forestry, mining, road construction, and urbanization, are recognized as major contributors to stream sedimentation and turbidity [56]. The escalation of surface run-off is a contributing factor to turbidity, a measurable parameter that is frequently linked to total suspended solids [57] and microbial levels that is possibly caused by weather conditions. A study also revealed a significant correlation (p < 0.001) between turbidity and elevated levels of chlorophyll α in water samples [58]. This hypothesis, however, is not applicable in our case because color was not detected in any sample.

3.4. Color Analysis

The parametric value (Directive (EU) 2020/2184) [44] is determined as acceptable for consumers and without unusual change. The results of the analyzed water samples showed that color units (CU) were not detected or quantified in each sample.

3.5. Total Hardness

Water hardness is the total calcium and magnesium ion content in a water sample, expressed as calcium carbonate. Consequently, the composition of cations stemming from soil has a direct impact on the level of water hardness. It can be classified into four categories: very soft (0–100 mg/L), soft (100–200 mg/L), hard (200–300 mg/L), and very hard (>300 mg/L) [59]. The results of total hardness value are summarized in Table 3. The water samples from July 2021, July 2022, and October 2022 had statistically significantly (p < 0.05) lower total hardness values than the other samples. It seems that the water samples belong to the first category (very soft), as an average 97.13 mg/L of CaCO3 was measured. This consequence is of high importance because in other studies [60,61] water samples were found to have much higher values of hardness. An analysis of the quality status of 14 distinct brands of bottled water was conducted by Dippong et al. [60]. The sources of groundwater for these brands were derived from various mountainous regions adjacent to the Carpathian Mountains in Romania. The measured total hardness from several water samples varied from 24.1 to 1582.1 mg CaCO3/L. Fytianos et al. [61] investigated the overall characteristics of drinking water pollution caused by nitrates, chloride, and arsenic in the Prefecture of Thessaloniki, Greece, with a specific focus on the physicochemical properties of groundwater sources. Over a span of six months, a total of 52 samples of tap water were gathered from various villages located within the Prefecture. They measured an average of 318 mg CaCO3/L.

3.6. Inorganic Compounds

3.6.1. Metals

The results of measured metals are given in Table 4. It is observed that most of the metals were not detected (<LOD). Chromium is the only metal to be measured in every water sample, along with aluminum and iron which are rarely found. Human-caused contributors of chromium in waterways include leather tanneries, textile manufacturers, and plating companies, and others that use substantial amounts of chromium. Mineral leaching is the principal source of chromium in waterways. In waterways, trivalent [Cr(III)] and hexavalent [Cr(VI)] chromium are the most common oxidation states. Ingestion of Cr(III) has not been shown to cause cancer in either animals or humans. It is an essential micronutrient in the body that cooperates with multiple enzymes to convert sugar, protein, and fat. It may cause eye and skin irritation; however, this is often due to their acidic nature [62]. Cr(VI) inhalation causes nosebleeds and discomfort. Cr(VI) consumption causes skin rashes, ulcers, respiratory issues, impaired immune systems, kidney and liver damage, genetic material alteration, lung cancer, and death [63]. Chromium enters water mostly in its hexavalent oxidation state from its minerals, due to its higher water solubility [64]. At natural water pH 7−8.5, Cr(III) solubility is low—around 5 μg/L [65]. We measured an average of 8.01 μg/L of chromium which is below the parametric value. We also detected statistically significant differences (p < 0.05) between the measurements. The water sample of April 2021 recorded the highest value (9.7 μg/L) and had approximately 32% higher chromium content than the water sample of October 2021. Our study is comparable to that carried out by Mitrakas et al. [49], who studied chromium origin in various aquifers of Greece. Specifically, they investigated chromium levels in the Samarina region and measured an average of 11 ± 1 μg/L in potable water samples. Regarding iron concentration in water samples, we measured 17 ± 1 μg/L only in the water sample from January 2021, which is also below the parametric value. Karamanis et al. [66] examined the trace elements and natural radionuclides in some of the most popular Greek bottled waters in 2006. Specifically, they measured 4.23 ± 0.32 μg Fe/L in the Samarina bottled water. Finally, aluminum was quantified in three measurements with an average value of 33 μg/L, which is below the parametric value.

3.6.2. Anions

The results of the measured anions are shown in Table 4. Most of the analyzed anions were either not detected (<LOD) or not quantified (<LOQ). The concentrations of nitrites, bromides, fluorides, and phosphates were below the detection or quantitation limit in all water samples. Chlorides and sulfates were only measured in the water samples from January 2022 at 1.84 and 3.22 mg/L, respectively. These values are considerably lower than the corresponding parametric values, though. Nitrates were the only anions to be measured in every water sample with an average value of 1.34 mg/L, which, however, was lower than the parametric value. Among the samples examined, the concentration of nitrates was found to be statistically significantly (p < 0.05) lower in the samples from January 2021 compared to the other samples. This is somewhat expected due to the lack of fertilizer usage at this altitude of the mountain. A similar study was conducted by Amanatidou et al. [67]. Their study examined the physicochemical and microbiological properties of drinking water sources in Kozani city of Western Macedonia, Greece, during 2002–2004. In 1160 samples, they measured an average nitrate concentration of 35.7 mg/L. In addition, Fytianos et al. [61] also studied physicochemical properties over a span of six months; data were collected from 52 villages within the Prefecture of Thessaloniki. They measured an average of 21.9 mg/L. The elevated nitrate levels in these regions were anticipated due to the irresponsible and increased usage of fertilizers containing nitrogen. Fertilizers penetrate the groundwater through rainwater percolation and ultimately contaminate the potable water supply, as evidenced by the tap water quality [68].

3.6.3. Cations

The results of the measured cations are shown in Table 4. Cations such as lithium and calcium were either not detected or not quantified, while ammonium cations were only quantified in the water sample from January 2021 (0.035 mg/L). Sodium, potassium, and magnesium cations recorded an average concentration of 1.07, 0.38, and 22.58 mg/L, respectively. In potassium cations, values show statistically significant differences (p < 0.05) over two years. The water sample from January 2021 had a remarkably higher value than any other sample (0.94 mg/L) and, noticeably, it had an approximately 78% difference from the water sample in January 2022. The same pattern was also observed in the quantification of sodium cations. The water sample from January 2021 recorded a much higher value (2.9 mg/L) and was found again to be 78% higher than the sample one year later. The concentration values of sodium cations were fluctuated and their differences were also statistically significant (p < 0.05). Magnesium cations were the most prevalent in the water samples (24.1 mg/L), possibly having the greatest effect on the taste of all cations. Our study is comparable to that conducted by Loukas et al. [69], who evaluated the quantity and quality of surface water in Pinios river of the Thessaly region, Greece. The average concentrations of sodium and magnesium cations in 195 samples were measured as 10.04 and 22.63 mg/L, respectively.

3.7. Total Organic Carbon (TOC)

The measurement of total organic carbon contained in water and waste, regardless of the type of compounds in which it is contained, provides important information about the quality and level of water pollution in terms of the presence of organic components. Organic compounds present in water are mainly phenols, chlorinated hydrocarbons, detergents, pesticides, and petroleum products [70]. The parametric value (Directive (EU) 2020/2184) [44] is determined as having no unusual change. The results of the analyses showed that TOC levels were below LOQ in each sample, hence they were not quantified.

3.8. Volatile Compounds

2-Methylisoborneol (2-MIB) can occur in surface waters in which cyanobacteria have grown, imparting a complex moldy-soil odor. Both the toxins and 2-MIB could be released into the water mainly by the death of cyanobacteria and the lysis of their cells. Geosmin is the second substance with an unpleasant mold odor after 2-MIB, produced by cyanobacteria and actinomycetes [71]. The primary synthesizers of these compounds, when conditions are beneficial to photosynthesis, are cyanobacteria or selected cyanobacterial species. Geosmin and 2-MIB exhibit extremely low odor detection thresholds, being within the range of 0.4 to 10 ng/L [72,73]. The concentrations of the two abovementioned compounds in the water samples are given in Table 5. The average concentrations of 2-MIB and geosmin were measured to be 9.4 and 2.7 ng/L, respectively. In 2-MIB, the results indicate a statistically significant variation (p < 0.05) in the concentrations of January 2022 and April 2021 samples. It can be concluded that the concentration of 2-MIB showed an increase in October 2021 (10.7 ng/L) and a decrease during April (7.0 ng/L). As for geosmin, the concentration reached its peak in April of 2022 (4.0 ng/L). Geosmin levels were found to be lower than the detectable threshold of 10 ng/L, while those of 2-MIB were sometimes above that threshold. As a result, it could have a negative effect on water taste and odor. Other studies regarding off-odor concentration in water were also conducted [74,75]. Tsao et al. [74] used a qPCR technique to quantify geosmin-producing cyanobacteria in a burst of Anabaena circinalis in Myponga Reservoir, South Australia. The geosmin concentration varied from 12.93 to 81.77 ng/L. These concentrations are approximately ten times higher than those we measured. Ma et al. [75] investigated the Headspace Liquid Phase Microextraction technique coupled with GC-MS to analyze various surface water samples in China. They found that 2-MIB had an average concentration of 18 ng/L in Yellow River, 15 ng/L in effluent water from Baisha River, and 9 ng/L in effluent water from Xianjiazhai.

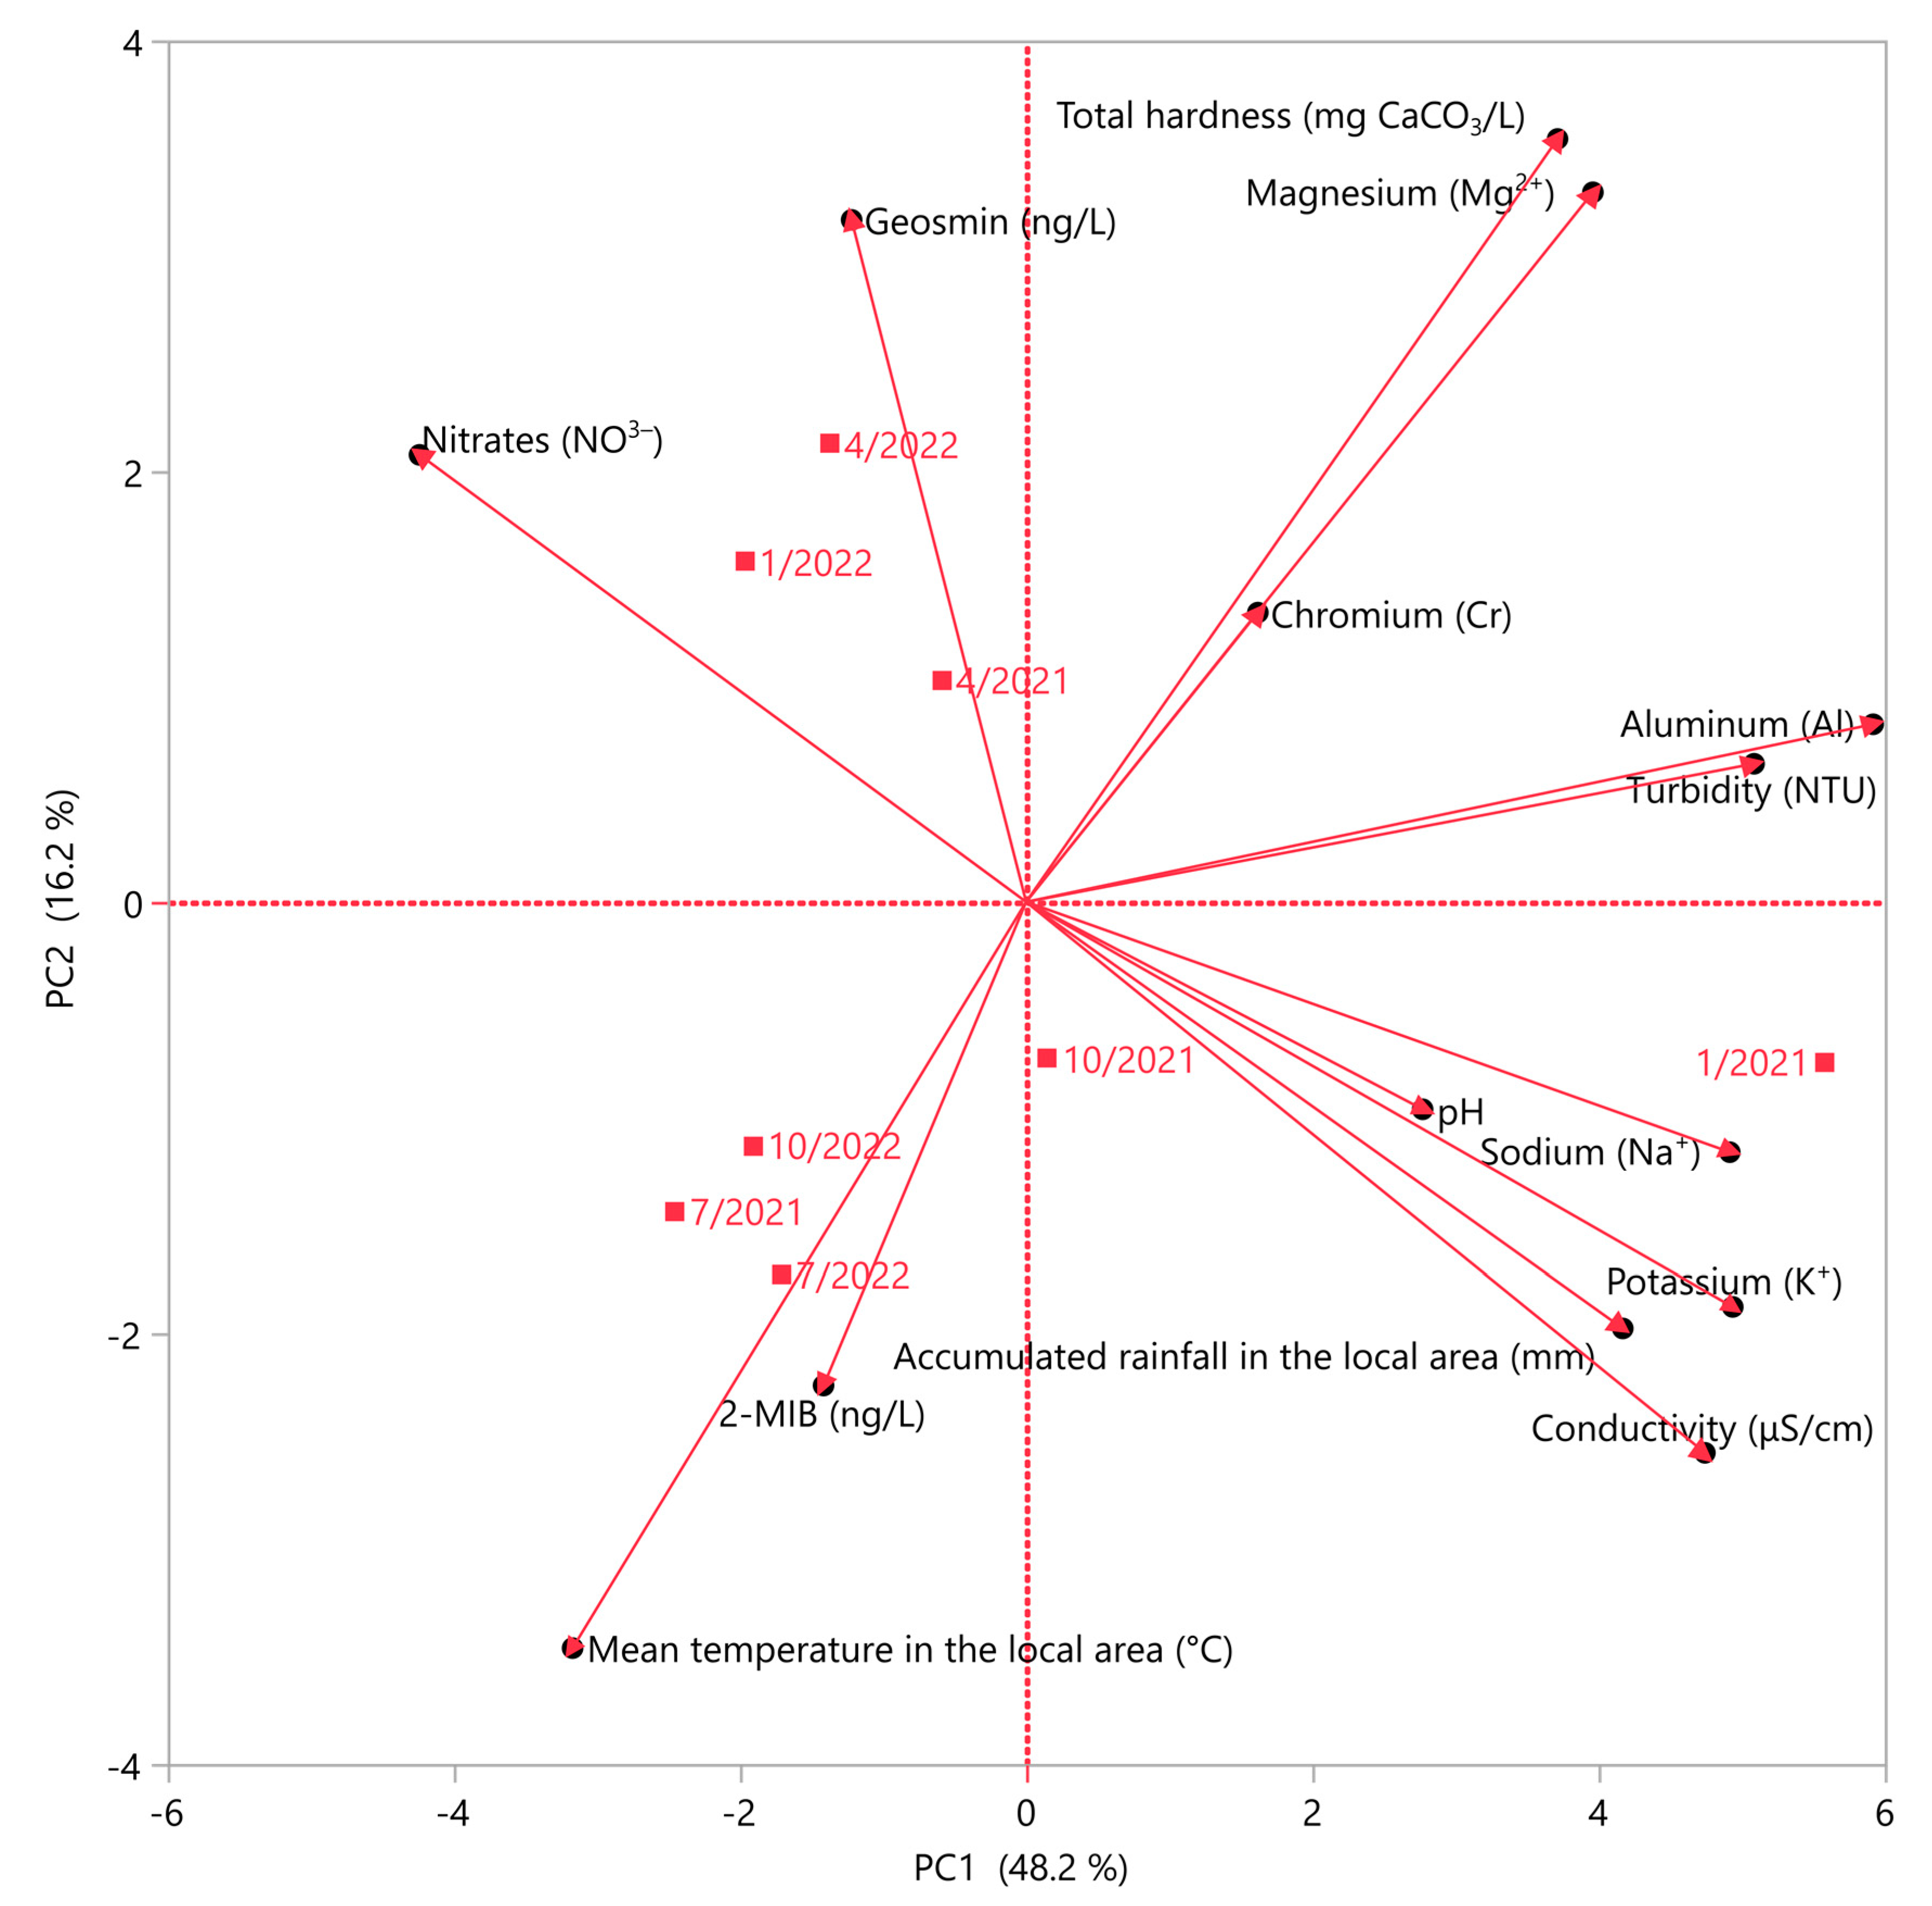
3.9. Principal Component Analysis

A principal component analysis (PCA) was conducted to simplify the analysis of multiple variable data and enhance the clarity of the results. The parameters were used to investigate whether any correlation with climate conditions, mainly accumulated rainfall and mean temperature of the local area, was observed. The selection of two principal components, as depicted in Figure 3, was based on their eigenvalues > 1, which collectively represented 64.4% of the variance. The results show that PC1 exhibited a positive correlation with total hardness, turbidity, and various concentrations of organic and inorganic compounds such as geosmin, magnesium cations, aluminum, chromium, and nitrates. On the contrary, a negative correlation was observed between PC1 and pH and conductivity values, potassium, and sodium cations, 2-MIB concentration, and climate data such as accumulated rainfall and mean temperature in the local area. PC1 accounted for 48.2% of the variance. PC2 accounted for 16.2% of the variance, respectively. Strong positive and negative correlations (>0.90) were observed in the parameters illustrated in Figure 3, and in combination with statistically significant (p < 0.05) results were examined. It was observed that the average temperature exhibited a strong negative correlation with the concentration of magnesium cations. As previously mentioned, the salts of divalent cations, such as calcium and magnesium, are characterized by a prevalence of bitter and salty tastes [30]. The concentration of these cations exhibits an inverse correlation with the temperature of the region, thereby rendering the water terroir directly responsive to the temperature of the area. Additionally, a good positive correlation (>0.7) with statistically significant differences (p < 0.05) was observed between accumulated rainfall and the concentration of potassium cations. Despite lacking a direct impact on taste, potassium cations may facilitate an indirect influence by enhancing the activity of taste buds, even at concentrations commonly present in drinking water. Potassium cations have an essential role as an ion in facilitating communication among nerve cells, as noted by Matsuo et al. [76].

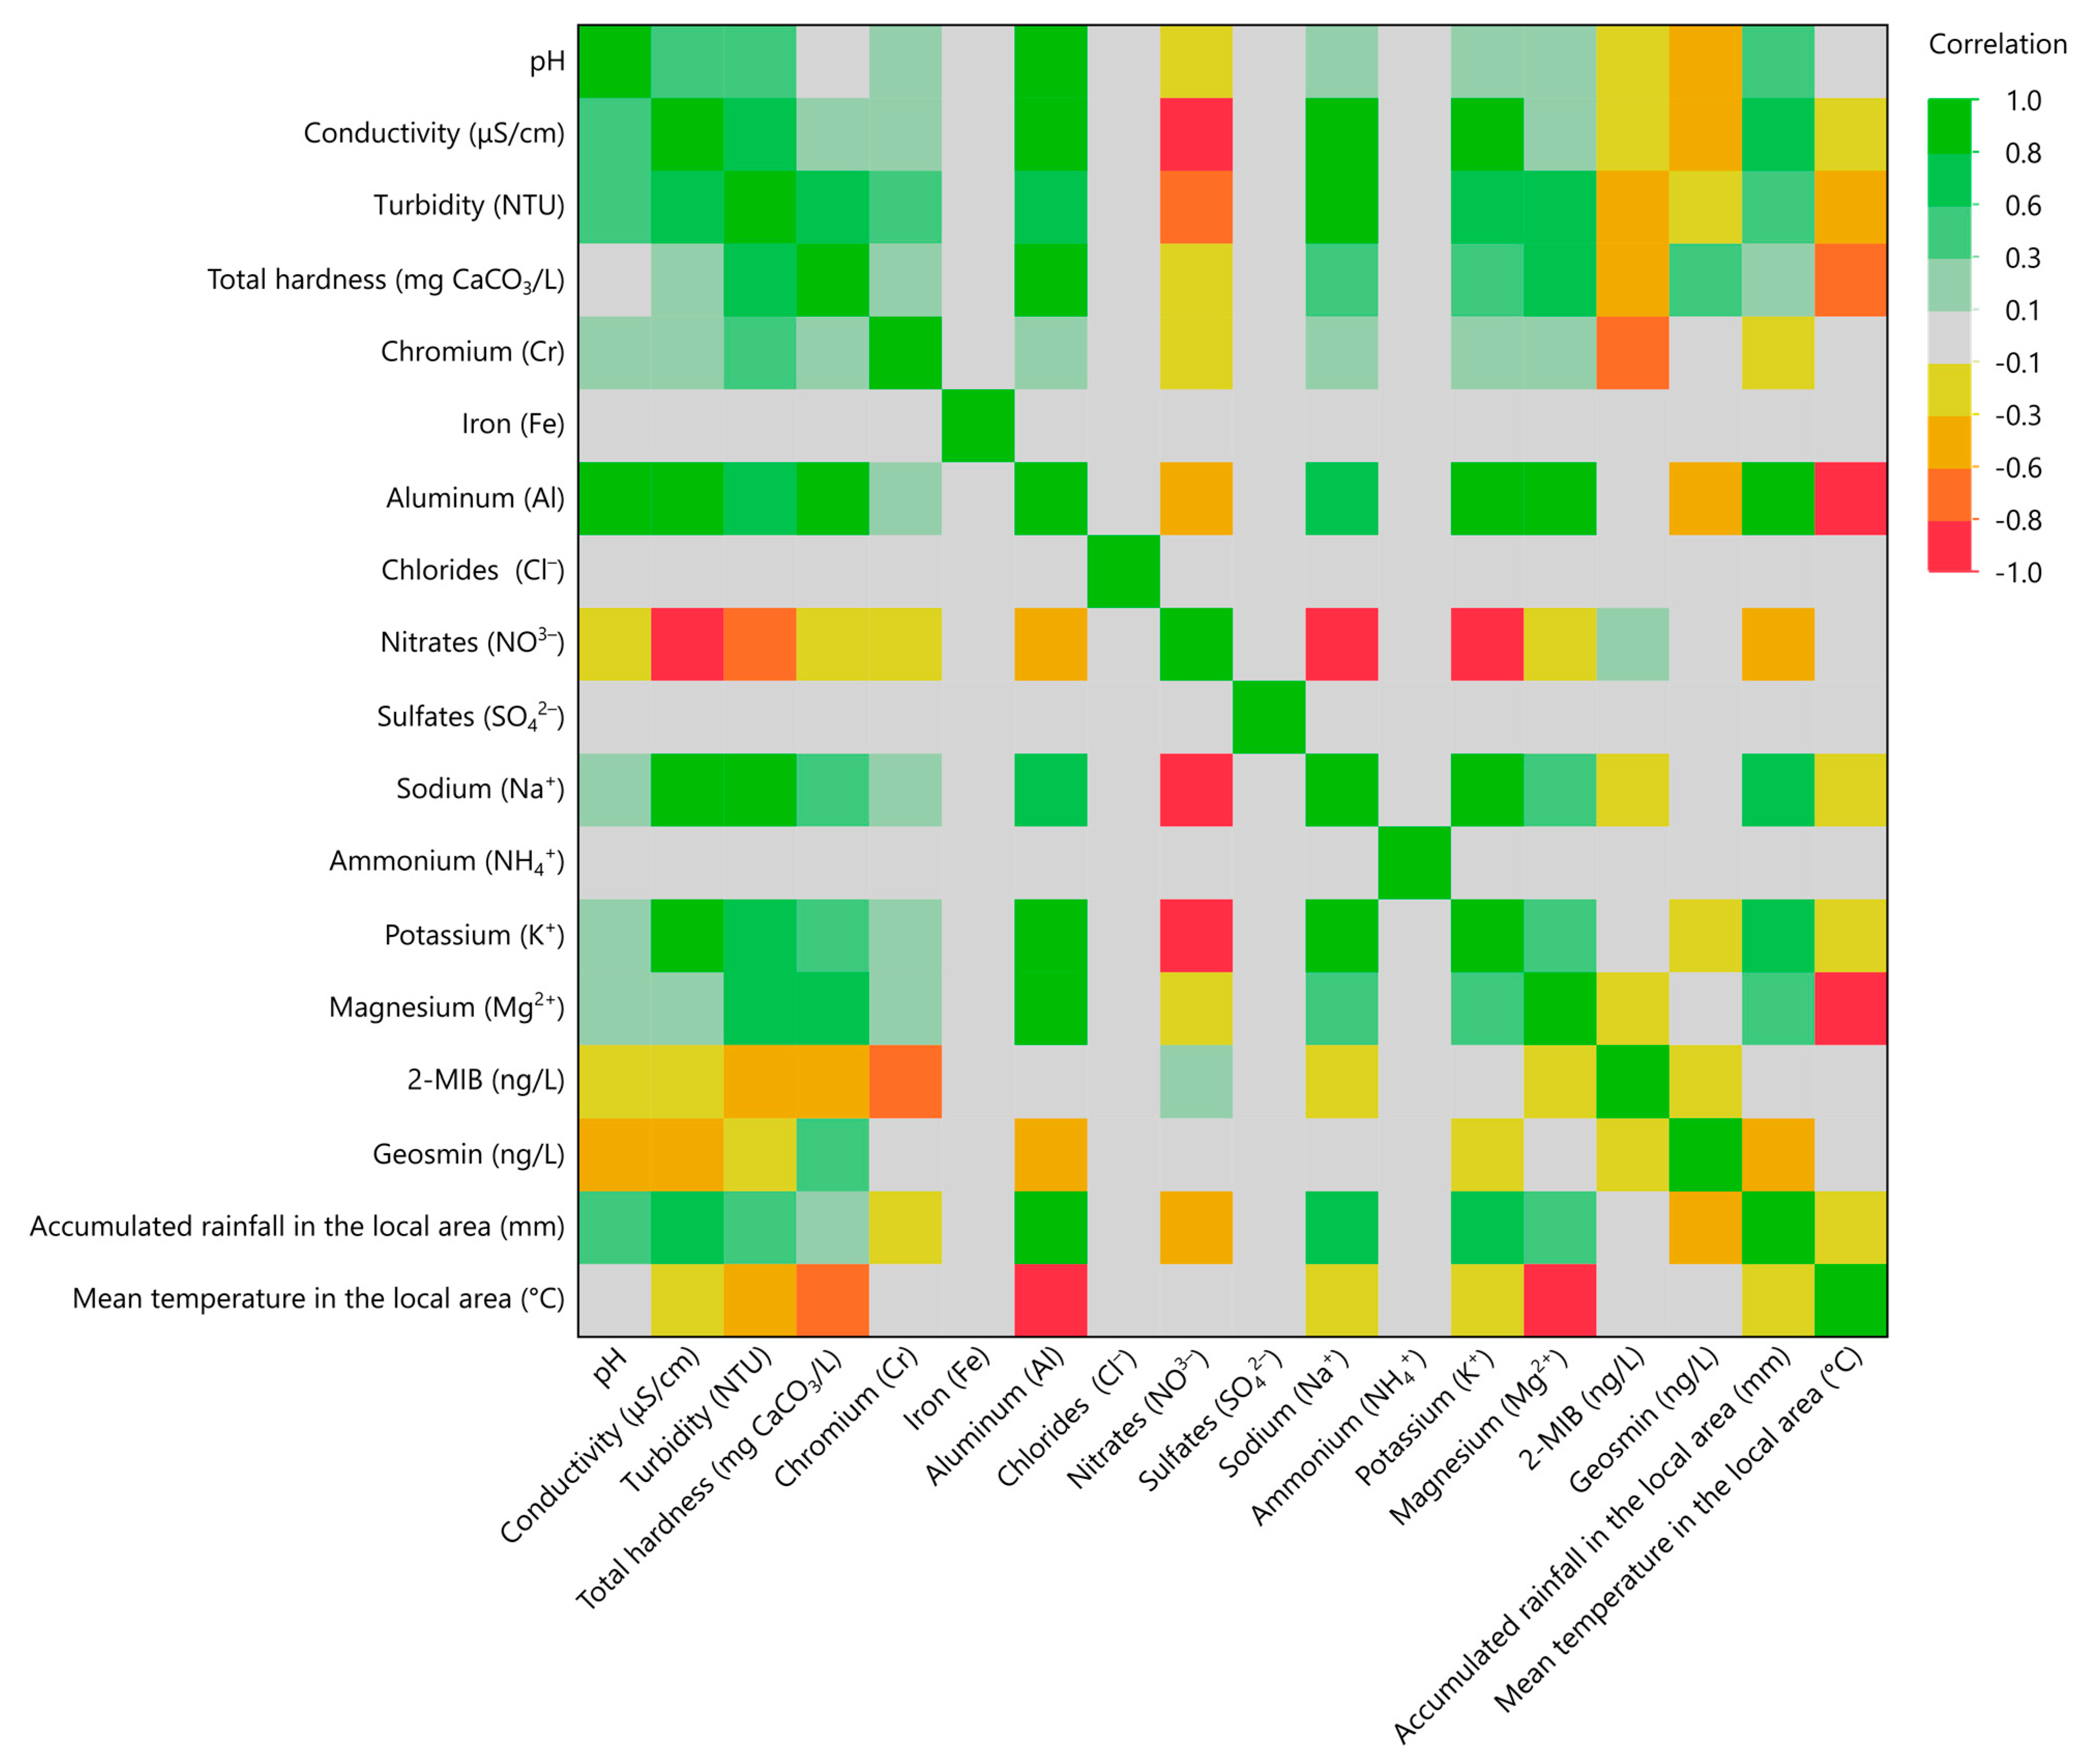
3.10. Multivariate Correlation Analysis

A multivariate correlation analysis (MCA) was also performed to further clarify the correlation of the studied parameters with climate conditions and the results are illustrated in Figure 4. In this color map, the color scale has correlation values from −1 to 1. The more intense the green color, the higher the positive correlation between the parameters. On the other hand, a more intense red color suggests higher negative correlation between the parameters. Iron, chlorides, sulfates, and ammonium cations did not show a correlation with any parameter. Nitrate concentration showed a strong negative correlation with both potassium and sodium cations concentration. Aluminum seemed to have strong correlation (>0.9) with many parameters, but it was measured only in three water samples, rendering the observation statistically insignificant (p > 0.05). The off-odor compounds 2-MIB and geosmin barely had any good correlation (>0.7) with other parameters. It was only observed that 2-MIB had a good negative correlation (>0.7) with chromium concentration. Mean temperature also had a good negative correlation with the average temperature in the local area. No other significant correlation of the climate conditions with any parameter was observed.

4. Conclusions

This study evaluated the composition of water samples stemming from Goura mineral water spring on mount Smolikas in Greece over a period of two years. The physicochemical parameters (pH, conductivity, turbidity, color, and total hardness) of the water samples were examined, along with its content of metals, inorganic salts (cations and anions), and total organic carbon. Samples were also analyzed for their content of off-odor volatile compounds (2-methylisoborneol and geosmin), which can be naturally found in water. Climate conditions (accumulated rainfall and average temperature) were also investigated in terms of how they affect the measured parameters. These parameters affect the flavor of water and, consequently, the terroir of mineral water. The results showed that both the physicochemical properties and inorganic compounds were in compliance with the related regulations. Organic off-odor components were also found at reasonable levels in water samples. Geosmin concentration was lower than 2-MIB and below the detection limit of 10 ng/L. On the other hand, 2-MIB slightly surpassed that level, potentially negatively affecting the taste of water samples. A strong negative correlation (>0.9) was found between magnesium cations and the average temperature of the local area, while a good positive correlation (>0.7) was identified between accumulated rainfall and the concentration of potassium cations. The aftermath of this research could be used as a benchmark for future investigations into the terroir of mineral water.

Author Contributions

Conceptualization, V.A., T.C. and S.I.L.; methodology, V.A., T.C. and S.I.L.; validation V.A., T.C., D.K., E.B. and D.P.M.; formal analysis, V.A., E.B. and T.C.; investigation, V.A., E.B. and T.C.; resources, S.I.L.; data curation, V.A. and T.C.; writing—original draft preparation, V.A. and D.K.; writing—review and editing, V.A., T.C., D.K., D.P.M., E.B. and S.I.L.; visualization, V.A. and T.C.; supervision, S.I.L.; project administration, S.I.L.; funding acquisition, S.I.L. All authors have read and agreed to the published version of the manuscript.

Funding

This research was co-financed by the European Union and the Hellenic Ministry of Economy & Development through the Operational Program Competitiveness, Entrepreneurship and Innovation, under the call RESEARCH—CREATE—INNOVATE (Project code: T2EDK-03772).

Data Availability Statement

Not applicable.

Acknowledgments

The authors would like to thank Eirini Papadaki, Geologist, for providing the geographical and hydrolithological maps of the Samarina region.

Conflicts of Interest

The authors declare no conflict of interest.

References

  1. Varsha, M.; Senthil Kumar, P.; Senthil Rathi, B. A Review on Recent Trends in the Removal of Emerging Contaminants from Aquatic Environment Using Low-Cost Adsorbents. Chemosphere 2022, 287, 132270. [Google Scholar] [CrossRef] [PubMed]
  2. Thekkedath, A.; Sugaraj, S.; Sridharan, K. Nanomaterials in Advanced Oxidation Processes (AOPs) in Anionic Dye Removal. In Advanced Oxidation Processes in Dye-Containing Wastewater: Volume 1; Muthu, S.S., Khadir, A., Eds.; Sustainable Textiles: Production, Processing, Manufacturing & Chemistry; Springer Nature: Singapore, 2022; pp. 129–165. ISBN 978-981-19098-7-0. [Google Scholar]
  3. Chemat, F.; Rombaut, N.; Meullemiestre, A.; Turk, M.; Perino, S.; Fabiano-Tixier, A.-S.; Abert-Vian, M. Review of Green Food Processing Techniques. Preservation, Transformation, and Extraction. Innov. Food Sci. Emerg. Technol. 2017, 41, 357–377. [Google Scholar] [CrossRef]
  4. Ritter, L.; Solomon, K.; Sibley, P.; Hall, K.; Keen, P.; Mattu, G.; Linton, B. Sources, Pathways, and Relative Risks of Contaminants in Surface Water and Groundwater: A Perspective Prepared for the Walkerton Inquiry. J. Toxicol. Environ. Health Part A 2002, 65, 1–142. [Google Scholar] [CrossRef]
  5. Azoulay, A.; Garzon, P.; Eisenberg, M.J. Comparison of the Mineral Content of Tap Water and Bottled Waters. J. Gen. Intern. Med. 2001, 16, 168–175. [Google Scholar] [CrossRef] [PubMed]
  6. Pampaloni, B.; Brandi, M.L. Mineral Water as Food for Bone: An Overview. Int. J. Bone Fragility 2022, 2, 48–55. [Google Scholar] [CrossRef]
  7. Baghel, A.; Singh, B. Emerging Potable Water Technologies. Def. Life Sci. J. 2016, 1, 113. [Google Scholar] [CrossRef]
  8. Diduch, M.; Polkowska, Ż.; Namieśnik, J. Chemical Quality of Bottled Waters: A Review. J. Food Sci. 2011, 76, R178–R196. [Google Scholar] [CrossRef] [PubMed]
  9. Levallois, P.; Grondin, J.; Gingras, S. Evaluation of Consumer Attitudes on Taste and Tap Water Alternatives in Québec. Water Sci. Technol. 1999, 40, 135–139. [Google Scholar] [CrossRef]
  10. Castaño-Vinyals, G.; Cantor, K.P.; Villanueva, C.M.; Tardon, A.; Garcia-Closas, R.; Serra, C.; Carrato, A.; Malats, N.; Rothman, N.; Silverman, D.; et al. Socioeconomic Status and Exposure to Disinfection By-Products in Drinking Water in Spain. Environ. Health 2011, 10, 18. [Google Scholar] [CrossRef] [Green Version]
  11. Parag, Y.; Roberts, J.T. A Battle Against the Bottles: Building, Claiming, and Regaining Tap-Water Trustworthiness. Soc. Nat. Resour. 2009, 22, 625–636. [Google Scholar] [CrossRef]
  12. LeChevallier, M.W. Coliform Regrowth in Drinking Water: A Review. J. AWWA 1990, 82, 74–86. [Google Scholar] [CrossRef]
  13. Palansooriya, K.N.; Yang, Y.; Tsang, Y.F.; Sarkar, B.; Hou, D.; Cao, X.; Meers, E.; Rinklebe, J.; Kim, K.-H.; Ok, Y.S. Occurrence of Contaminants in Drinking Water Sources and the Potential of Biochar for Water Quality Improvement: A Review. Crit. Rev. Environ. Sci. Technol. 2020, 50, 549–611. [Google Scholar] [CrossRef]
  14. Pintar, K.D.M.; Waltner-Toews, D.; Charron, D.; Pollari, F.; Fazil, A.; McEwen, S.A.; Nesbitt, A.; Majowicz, S. Water Consumption Habits of a South-Western Ontario Community. J. Water Health 2009, 7, 276–292. [Google Scholar] [CrossRef] [Green Version]
  15. de França Doria, M.; Pidgeon, N.; Hunter, P.R. Perceptions of Drinking Water Quality and Risk and Its Effect on Behaviour: A Cross-National Study. Sci. Total Environ. 2009, 407, 5455–5464. [Google Scholar] [CrossRef] [PubMed]
  16. Ward, L.A.; Cain, O.L.; Mullally, R.A.; Holliday, K.S.; Wernham, A.G.; Baillie, P.D.; Greenfield, S.M. Health Beliefs about Bottled Water: A Qualitative Study. BMC Public Health 2009, 9, 196. [Google Scholar] [CrossRef] [PubMed] [Green Version]
  17. Rodwan, G. Bottled Water 2017: Staying Strong: U.S. and International Developments & Statistics; Flanders Environment Agency: Aalst, Belgium, 2017.
  18. Arnold, E.; Larsen, J. Bottled Water: Pouring Resources down the Drain. Earth Policy Inst. 2006, 2, 500. [Google Scholar]
  19. Pant, N.D.; Poudyal, N.; Bhattacharya, S.K. Bacteriological Quality of Bottled Drinking Water versus Municipal Tap Water in Dharan Municipality, Nepal. J. Health Popul. Nutr. 2016, 35, 17. [Google Scholar] [CrossRef] [Green Version]
  20. Foroni, F.; Vignando, M.; Aiello, M.; Parma, V.; Paoletti, M.G.; Squartini, A.; Rumiati, R.I. The Smell of Terroir! Olfactory Discrimination between Wines of Different Grape Variety and Different Terroir. Food Qual. Prefer. 2017, 58, 18–23. [Google Scholar] [CrossRef]
  21. Van Leeuwen, C.; Seguin, G. The Concept of Terroir in Viticulture. J. Wine Res. 2006, 17, 1–10. [Google Scholar] [CrossRef]
  22. Frost, R.; Quiñones, I.; Veldhuizen, M.; Alava, J.-I.; Small, D.; Carreiras, M. What Can the Brain Teach Us about Winemaking? An FMRI Study of Alcohol Level Preferences. PLoS ONE 2015, 10, e0119220. [Google Scholar] [CrossRef]
  23. Vaudour, E.; Costantini, E.; Jones, G.V.; Mocali, S. An Overview of the Recent Approaches to Terroir Functional Modelling, Footprinting and Zoning. SOIL 2015, 1, 287–312. [Google Scholar] [CrossRef] [Green Version]
  24. de França Doria, M. Factors Influencing Public Perception of Drinking Water Quality. Water Policy 2009, 12, 1–19. [Google Scholar] [CrossRef]
  25. Lucini, L.; Rocchetti, G.; Trevisan, M. Extending the Concept of Terroir from Grapes to Other Agricultural Commodities: An Overview. Curr. Opin. Food Sci. 2020, 31, 88–95. [Google Scholar] [CrossRef]
  26. Koseki, M.; Tanaka, Y.; Noguchi, H.; Nishikawa, T. Effect of PH on the Taste of Alkaline Electrolyzed Water. J. Food Sci. 2007, 72, S298–S302. [Google Scholar] [CrossRef] [PubMed]
  27. Karavoltsos, S.; Sakellari, A.; Mihopoulos, N.; Dassenakis, M.; Scoullos, M.J. Evaluation of the Quality of Drinking Water in Regions of Greece. Desalination 2008, 224, 317–329. [Google Scholar] [CrossRef]
  28. Gikas, G.D.; Tsihrintzis, V.A.; Akratos, C.S.; Haralambidis, G. Water Quality Trends in Polyphytos Reservoir, Aliakmon River, Greece. Environ. Monit. Assess. 2009, 149, 163–181. [Google Scholar] [CrossRef] [PubMed]
  29. Gonzalez, A.R.; Ndung’u, K.; Flegal, A.R. Natural Occurrence of Hexavalent Chromium in the Aromas Red Sands Aquifer, California. Environ. Sci. Technol. 2005, 39, 5505–5511. [Google Scholar] [CrossRef]
  30. Lawless, H.T.; Rapacki, F.; Horne, J.; Hayes, A. The Taste of Calcium and Magnesium Salts and Anionic Modifications. Food Qual. Prefer. 2003, 14, 319–325. [Google Scholar] [CrossRef]
  31. Watson, S. Aquatic Taste and Odor: A Primary Signal of Drinking-Water Integrity. J. Toxicol. Environ. Health A 2004, 67, 1779–1795. [Google Scholar] [CrossRef] [PubMed]
  32. Bae, B.U.; Shin, H.S.; Choi, J.J. Taste and Odour Issues in South Korea’s Drinking Water Industry. Water Sci. Technol. J. Int. Assoc. Water Pollut. Res. 2007, 55, 203–208. [Google Scholar] [CrossRef] [Green Version]
  33. Webber, M.A.; Atherton, P.; Newcombe, G. Taste and Odour and Public Perceptions: What Do Our Customers Really Think about Their Drinking Water? J. Water Supply Res. Technol. Aqua 2015, 64, 802–811. [Google Scholar] [CrossRef] [Green Version]
  34. Baird, R.B.; Eaton, A.D.; Rice, E.W. Standard Methods for the Examination of Water and Wastewater, 23rd ed.; American Public Health Association: Washington, DC, USA, 2017. [Google Scholar]
  35. ISO 10304-1:2007/Cor 1:2010; Water Quality—Determination of Dissolved Anions by Liquid Chromatography of Ions—Part 1: Determination of Bromide, Chloride, Fluoride, Nitrate, Nitrite, Phosphate and Sulfate—Technical Corrigendum 1. International Organization for Standardization: Geneva, Switzerland, 2010.
  36. ISO 14911:1998; Water Quality—Determination of Dissolved Li+, Na+, NH4+, K+, Mn2+, Ca2+, Mg2+, Sr2+ and Ba2+ Using Ion Chromatography—Method for Water and Waste Water. International Organization for Standardization: Geneva, Switzerland, 1998.
  37. Hegler, F.; Lösekann-Behrens, T.; Hanselmann, K.; Behrens, S.; Kappler, A. Influence of Seasonal and Geochemical Changes on the Geomicrobiology of an Iron Carbonate Mineral Water Spring. Appl. Environ. Microbiol. 2012, 78, 7185–7196. [Google Scholar] [CrossRef] [PubMed] [Green Version]
  38. Thomas, J.; Joseph, S.; Thrivikramji, K.P.; Manjusree, T.M.; Arunkumar, K.S. Seasonal Variation in Major Ion Chemistry of a Tropical Mountain River, the Southern Western Ghats, Kerala, India. Environ. Earth Sci. 2014, 71, 2333–2351. [Google Scholar] [CrossRef]
  39. Latest Conditions in Grevena. Available online: https://penteli.meteo.gr/stations/grevena/ (accessed on 11 May 2023).
  40. GeoPortal—River Basin Management Plans. Available online: http://wfdver.ypeka.gr/en/geoportal-en/ (accessed on 7 June 2023).
  41. Mountrakis, D. Geology of Greece; University Studio Press: Thessaloniki, Greece, 1985. (In Greek) [Google Scholar]
  42. Ntokos Synthesis of Literature and Field Work Data Leading to the Compilation of a New Geological Map—A Review of Geology of Northwestern Greece. Int. J. Geosci. 2017, 08, 205–236. [CrossRef] [Green Version]
  43. Anastasiadou-Anastasiou, S.I. Characteristics and Classification of the Natural Mineral Waters of Greece Using Hydrochemical Criteria; Postgraduate Theses at the Theofrastos Library of the Department of Geology of the Aristotle University of Thessaloniki: Thessaloniki, Greece, 2020. [Google Scholar]
  44. European Parliament, Council of the European Union. Directive (EU) 2020/2184 of the European Parliament and of the Council of 16 December 2020 on the Quality of Water Intended for Human Consumption (Recast) (Text with EEA Relevance); European Union Commission: Brussels, Belgium, 2020.
  45. Deocampo, D.M. Chapter 1 The Geochemistry of Continental Carbonates. In Developments in Sedimentology; Alonso-Zarza, A.M., Tanner, L.H., Eds.; Carbonates in Continental Settings: Geochemistry, Diagenesis and Applications; Elsevier: Amsterdam, The Netherlands, 2010; Volume 62, pp. 1–59. [Google Scholar]
  46. Schroeder, E.D. Water Resources. In Encyclopedia of Physical Science and Technology, 3rd ed.; Meyers, R.A., Ed.; Academic Press: New York, NY, USA, 2003; pp. 721–751. ISBN 978-0-12-227410-7. [Google Scholar]
  47. Whelton, A.J.; Dietrich, A.M.; Burlingame, G.A.; Schechs, M.; Duncan, S.E. Minerals in Drinking Water: Impacts on Taste and Importance to Consumer Health. Water Sci. Technol. 2007, 55, 283–291. [Google Scholar] [CrossRef] [Green Version]
  48. Kouras, A.; Katsoyiannis, I.; Voutsa, D. Distribution of Arsenic in Groundwater in the Area of Chalkidiki, Northern Greece. J. Hazard. Mater. 2007, 147, 890–899. [Google Scholar] [CrossRef]
  49. Mitrakas, M.; Tzoupanos, N.D.; Kazakis, N.; Kaprara, E.; Samaras, P.; Zouboulis, A.I. Hexavalent Chromium [Cr(VI)] in Drinking Water of Greece—Estimation of the Origin. In Proceedings of the 3rd International Conference on Industrial and Hazardous Waste Management, Chania, Greece, 12–14 September 2012. [Google Scholar]
  50. Ignatov, I. Physicochemical Research of Mineral and Mountain Spring Waters in Bulgaria. Asian J. Appl. Chem. Res. 2020, 7, 40–46. [Google Scholar] [CrossRef]
  51. McCleskey, R.B.; Kirk Nordstrom, D.; Ryan, J.N. Electrical Conductivity Method for Natural Waters. Appl. Geochem. 2011, 26, S227–S229. [Google Scholar] [CrossRef]
  52. Davies-Colley, R.J.; Smith, D.G. Turbidity Suspended Sediment, and Water Clarity: A Review. JAWRA J. Am. Water Resour. Assoc. 2001, 37, 1085–1101. [Google Scholar] [CrossRef]
  53. Ma, W.; Huang, T.; Li, X.; Zhou, Z.; Li, Y.; Zeng, K. The Effects of Storm Runoff on Water Quality and the Coping Strategy of a Deep Canyon-Shaped Source Water Reservoir in China. Int. J. Environ. Res. Public Health 2015, 12, 7839–7855. [Google Scholar] [CrossRef] [Green Version]
  54. Mann, A.G.; Tam, C.C.; Higgins, C.D.; Rodrigues, L.C. The Association between Drinking Water Turbidity and Gastrointestinal Illness: A Systematic Review. BMC Public Health 2007, 7, 256. [Google Scholar] [CrossRef] [PubMed] [Green Version]
  55. World Health Organization. Guidelines for Drinking-Water Quality, 4th ed.; World Health Organization: Geneva, Switzerland, 2011.
  56. Henley, W.F.; Patterson, M.A.; Neves, R.J.; Lemly, A.D. Effects of Sedimentation and Turbidity on Lotic Food Webs: A Concise Review for Natural Resource Managers. Rev. Fish. Sci. 2000, 8, 125–139. [Google Scholar] [CrossRef] [Green Version]
  57. Huey, G.M.; Meyer, M.L. Turbidity as an Indicator of Water Quality in Diverse Watersheds of the Upper Pecos River Basin. Water 2010, 2, 273–284. [Google Scholar] [CrossRef]
  58. Fraser, R.N. Hyperspectral Remote Sensing of Turbidity and Chlorophyll a among Nebraska Sand Hills Lakes. Int. J. Remote Sens. 1998, 19, 1579–1589. [Google Scholar] [CrossRef]
  59. Albertini, M.C.; Dacha, M.; Teodori, L.; Conti, M.E. Drinking Mineral Waters: Biochemical Effects and Health Implications the State-of-the-Art. Int. J. Environ. Health 2007, 1, 153. [Google Scholar] [CrossRef]
  60. Dippong, T.; Hoaghia, M.-A.; Mihali, C.; Cical, E.; Calugaru, M. Human Health Risk Assessment of Some Bottled Waters from Romania. Environ. Pollut. 2020, 267, 115409. [Google Scholar] [CrossRef]
  61. Fytianos, K.; Christophoridis, C. Nitrate, Arsenic and Chloride Pollution of Drinking Water in Northern Greece. Elaboration by Applying GIS. Environ. Monit. Assess. 2004, 93, 55–67. [Google Scholar] [CrossRef]
  62. International Agency for Research on Cancer (IARC). Chromium, Nickel and Welding; IARC Monographs on the Evaluation of Carcinogenic Risks to Humans; IARC: Lyon, France, 1990; ISBN 978-92-832-1249-2.
  63. Rakhunde, R.; Deshpande, L.; Juneja, H.D. Chemical Speciation of Chromium in Water: A Review. Crit. Rev. Environ. Sci. Technol. 2012, 42, 776–810. [Google Scholar] [CrossRef]
  64. World Health Organization. Chromium in Drinking-Water: Background Document for Development of WHO Guidelines for Drinking-Water Quality; World Health Organization: Geneva, Switzerland, 2020.
  65. Rai, D.; Sass, B.M.; Moore, D.A. Chromium(III) Hydrolysis Constants and Solubility of Chromium(III) Hydroxide. Inorg. Chem. 1987, 26, 345–349. [Google Scholar] [CrossRef]
  66. Karamanis, D.; Stamoulis, K.; Ioannides, K.G. Natural Radionuclides and Heavy Metals in Bottled Water in Greece. Desalination 2007, 213, 90–97. [Google Scholar] [CrossRef]
  67. Amanatidou, E.; Adamidou, K.; Trikoilidou, E.; Katsiouli, F.; Patrikaki, O.; Tsikritzis, L. Physicochemical and Microbiological Characteristics of the Potable Water Supply Sources in the Area of Kozani, Western Macedonia. Desalination 2007, 213, 1–8. [Google Scholar] [CrossRef]
  68. Akhtar, N.; Syakir Ishak, M.I.; Bhawani, S.A.; Umar, K. Various Natural and Anthropogenic Factors Responsible for Water Quality Degradation: A Review. Water 2021, 13, 2660. [Google Scholar] [CrossRef]
  69. Loukas, A. Surface Water Quantity and Quality Assessment in Pinios River, Thessaly, Greece. Desalination 2010, 250, 266–273. [Google Scholar] [CrossRef]
  70. Bisutti, I.; Hilke, I.; Raessler, M. Determination of Total Organic Carbon—An Overview of Current Methods. TrAC Trends Anal. Chem. 2004, 23, 716–726. [Google Scholar] [CrossRef]
  71. Kaloudis, T.; Triantis, T.M.; Hiskia, A. Determination of Geosmin and 2-Methylisoborneol in Water by HS-SPME-GC/MS. In Handbook of Cyanobacterial Monitoring and Cyanotoxin Analysis; John Wiley & Sons, Ltd.: Hoboken, NJ, USA, 2016; pp. 469–474. ISBN 978-1-119-06876-1. [Google Scholar]
  72. Young, W.F.; Horth, H.; Crane, R.; Ogden, T.; Arnott, M. Taste and Odour Threshold Concentrations of Potential Potable Water Contaminants. Water Res. 1996, 30, 331–340. [Google Scholar] [CrossRef]
  73. Piriou, P.; Devesa, R.; De Lalande, M.; Glucina, K. European Reassessment of MIB and Geosmin Perception in Drinking Water. J. Water Supply Res. Technol. Aqua 2009, 58, 532–538. [Google Scholar] [CrossRef]
  74. Tsao, H.-W.; Michinaka, A.; Yen, H.-K.; Giglio, S.; Hobson, P.; Monis, P.; Lin, T.-F. Monitoring of Geosmin Producing Anabaena Circinalis Using Quantitative PCR. Water Res. 2014, 49, 416–425. [Google Scholar] [CrossRef]
  75. Ma, J.; Lu, W.; Li, J.; Song, Z.; Liu, D.; Chen, L. Determination of Geosmin and 2-Methylisoborneol in Water by Headspace Liquid-Phase Microextraction Coupled with Gas Chromatography-Mass Spectrometry. Anal. Lett. 2011, 44, 1544–1557. [Google Scholar] [CrossRef]
  76. Matsuo, R. Role of Saliva in the Maintenance of Taste Sensitivity. Crit. Rev. Oral Biol. Med. 2000, 11, 216–229. [Google Scholar] [CrossRef] [Green Version]
Figure 1. Geographical map of the Samarina region, showing the sampling point.
Analytica 04 00022 g001
Figure 2. Hydrolithological map of Samarina region.
Analytica 04 00022 g002
Figure 3. Principal component analysis (PCA) for the measured physicochemical parameters and chemical substances with climate data.
Analytica 04 00022 g003
Figure 4. Multivariate correlation analysis (MCA) for the measured physicochemical parameters and chemical substances with climate data.
Analytica 04 00022 g004
Table 1. LOD and LOQ of metals, anions, and cations.
LODLOQ
Metals (μg/L)
Boron (B)0.0450.15
Cadmium (Cd)0.150.50
Lead (Pb)0.882.90
Chromium (Cr)0.913.00
Manganese (Mn)1.525.00
Copper (Cu)4.5515.00
Arsenic (As)0.521.72
Nickel (Ni)1.525.00
Iron (Fe)4.5515.00
Aluminum (Al)2.428.00
Selenium (Se)0.892.98
Antimony (Sb)0.260.86
Mercury (Hg)0.0610.20
Anions (mg/L)
Fluorides (F)0.0080.027
Chlorides (Cl)0.551.80
Nitrites (NO2)0.0280.094
Bromides (Br)0.0280.094
Nitrates (NO3)0.100.33
Phosphates (PO43−)0.461.5
Sulfates (SO42−)0.882.9
Cations (mg/L)
Lithium (Li+)0.0030.011
Sodium (Na+)0.180.60
Ammonium (NH4+)0.0050.017
Potassium (K+)0.0610.20
Magnesium (Mg2+)0.180.60
Calcium (Ca2+)1.605.30
Table 2. Volatile substances with their corresponding molar masses.
Volatile Compoundm/z 1
2-Methylisoborneol (2-MIB)95, 107, 108, 135
Geosmin94, 111, 112, 125, 149
2-Isopropyl-3-methoxypyrazine (ISTD)94, 124, 137, 152
1 m/z: mass-to-charge ratio. Boldfaced molecular masses indicate the base peak of each compound.
Table 3. Results of physicochemical characteristics of water samples.
Water SamplepHConductivity (μS/cm)Turbidity (NTU)Total Hardness (mg CaCO3/L)
1/20218.6 ± 0.5 a199 ± 13 a0.35 ± 0.02 a106 ± 4 a
4/20218.8 ± 0.3 a172 ± 9 a,b0.19 ± 0.01 b100 ± 2 a,b
7/20217.9 ± 0.2 a168 ± 12 b0.06 ± 0.01 d,e93 ± 4 b
10/20218.7 ± 0.6 a171 ± 7 b0.08 ± 0.01 d100 ± 1 a,b
1/20227.7 ± 0.5 a164 ± 5 b0.08 ± 0.01 d103 ± 5 a
4/20228.3 ± 0.5 a 162 ± 12 b0.11 ± 0.01 c105 ± 5 a
7/20228.4 ± 0.3 a 179 ± 6 a,b0.05 ± 0.01 e98 ± 3 a,b
10/20228.7 ± 0.6 a171 ± 12 b0.06 ± 0.01 d,e92 ± 2 b
Within each column, statistically significant differences (p < 0.05) are stated with different superscript letters (e.g., a–e).
Table 4. Metal, anion, and cation content of water samples.
Parametric Value 11/20214/20217/202110/20211/20224/20227/202210/2022
Metal concentration (μg/L)
Boron (B)1000<LOQ<LOD<LOD<LOD<LOD<LOD<LOD<LOD
Cadmium (Cd)5<LOD<LOD<LOD<LOD<LOD<LOD<LOD<LOD
Lead (Pb)10<LOD<LOD<LOD<LOD<LOQ<LOQ<LOQ<LOQ
Chromium (Cr)508.5 ± 0.4 a,b9.7 ± 0.4 a7.6 ± 0.6 b,c6.6 ± 0.2 c7.7 ± 0.3 b,c7.9 ± 0.5 b8.4 ± 0.4 b7.7 ± 0.6 b,c
Manganese (Mn)50<LOD<LOD<LOD<LOD<LOD<LOD<LOD<LOD
Copper (Cu)2000<LOQ<LOD<LOQ<LOD<LOD<LOD<LOD<LOD
Arsenic (As)10<LOQ<LOD<LOD<LOD<LOD<LOD<LOD<LOD
Nickel (Ni)20<LOQ<LOD<LOD<LOD<LOD<LOD<LOD<LOD
Iron (Fe)20017 ± 1<LOD<LOD<LOD<LOD<LOD<LOD<LOD
Aluminum (Al)20046 ± 2 a<LOQ16 ± 1 c37 ± 1 b<LOD<LOD<LOD<LOD
Selenium (Se)20<LOD<LOD<LOD<LOD<LOD<LOD<LOD<LOD
Antimony (Sb)10<LOD<LOD<LOD<LOD<LOD<LOD<LOD<LOD
Mercury (Hg)1<LOD<LOD<LOD<LOD<LOD<LOD<LOD<LOD
Anion concentration (mg/L)
Fluorides (F)1.5<LOD<LOD<LOD<LOQ<LOD<LOD<LOD<LOD
Chlorides (Cl)250<LOQ<LOQ<LOQ<LOQ1.84 ± 0.07<LOQ<LOQ<LOQ
Nitrites (NO2)0.50<LOD<LOD<LOD<LOD<LOD<LOD<LOD<LOD
Bromides (Br)-<LOD<LOD<LOD<LOD<LOD<LOD<LOD<LOQ
Nitrates (NO3)501.12 ± 0.05 b1.42 ± 0.06 a1.33 ± 0.04 a1.41 ± 0.05 a1.43 ± 0.04 a1.37 ± 0.07 a1.34 ± 0.06 a1.38 ± 0.03 a
Phosphates (PO43−)-<LOD<LOD<LOD<LOD<LOD<LOD<LOD<LOD
Bicarbonates (HCO3)-96 ± 5.7 a104 ± 5.4 a109 ± 6.3 a107 ± 6.1 a97 ± 5.1 a102 ± 5.0 a108 ± 6.2 a105 ± 5.7 a
Carbonates (CO32−)-1.87 ± 0.13 c,d2.80 ± 0.20 a<LOD2.21 ± 0.16 b,c<LOD1.30 ± 0.09 e1.56 ± 0.11 d,e2.39 ± 0.18 b
Sulfates (SO42−)250<LOQ<LOQ<LOQ<LOQ3.2 ± 0.1<LOQ<LOQ<LOQ
Cation concentration (mg/L)
Lithium (Li+)-<LOD<LOD<LOD<LOD<LOD<LOD<LOD<LOD
Sodium (Na+)2002.9 ± 0.2 a0.52 ± 0.03 d0.75 ± 0.05 b,c0.72 ± 0.03 b,c,d0.62 ± 0.04 c,d0.88 ± 0.05 b0.82 ± 0.06 b,c0.8 ± 0.1 b,c
Ammonium (NH4+)0.500.04 ± 0<LOD<LOD<LOD<LOD<LOD<LOD<LOD
Potassium (Κ+)-0.94 ± 0.03 a0.21 ± 0.01 e0.22 ± 0.01 e0.37 ± 0.02 c0.21 ± 0.01 e0.29 ± 0.01 d0.47 ± 0.02 b0.3 ± 0.0 d
Magnesium (Mg2+)-24 ± 1 a23 ± 1 a21 ± 2 a23 ± 1 a23 ± 2 a23 ± 2 a21 ± 2 a23 ± 1 a
Calcium (Ca2+)-<LOQ<LOQ<LOQ<LOQ<LOQ<LOQ<LOQ<LOQ
Within each column, statistically significant differences (p < 0.05) are stated with different superscript letters (e.g., a–e). 1 According to Directive (ΕU) 2020/2184. The corresponding limit of detection (LOD) and limit of quantification (LOQ) values of these metals, anions and cations are given in Table 1.
Table 5. Concentrations of volatile substances in water samples.
Water Sample2-MIB (ng/L)Geosmin (ng/L)
1/20218.7 ± 0.3 c2.5 ± 0.1 b,c
4/20217.0 ± 0.3 c,d2.3 ± 0.1 c
7/20219.2 ± 0.2 b,c2.6 ± 0.2 b,c
10/202110.7 ± 0.7 a2.3 ± 0.1 c
1/202210.8 ± 0.7 a2.8 ± 0.1 b
4/20228.0 ± 0.3 d4.0 ± 0.3 a
7/202210.1 ± 0.5 a,b2.7 ± 0.1 b,c
10/202210.7 ± 0.3 a2.4 ± 0.1 b,c
Within each column, statistically significant differences (p < 0.05) are stated with different superscript letters (e.g., a–d).
Disclaimer/Publisher’s Note: The statements, opinions and data contained in all publications are solely those of the individual author(s) and contributor(s) and not of MDPI and/or the editor(s). MDPI and/or the editor(s) disclaim responsibility for any injury to people or property resulting from any ideas, methods, instructions or products referred to in the content.

