Article

Gold Nanoparticles: A Didactic Step-by-Step of the Synthesis Using the Turkevich Method, Mechanisms, and Characterizations

by
Ana Elisa F. Oliveira
1,
Arnaldo César Pereira
1,*,
Mayra A. C. Resende
1 and
Lucas Franco Ferreira
2
1
Departamento de Ciências Naturais, Universidade Federal de São João del-Rei (UFSJ), São João del-Rei 36307-352, MG, Brazil
2
Instituto de Ciência e Tecnologia, Universidade Federal dos Vales do Jequitinhonha e Mucuri (UFVJM), Diamantina 39100-000, MG, Brazil
*
Author to whom correspondence should be addressed.
Analytica 2023, 4(2), 250-263; https://doi.org/10.3390/analytica4020020
Submission received: 19 May 2023 / Revised: 4 June 2023 / Accepted: 6 June 2023 / Published: 8 June 2023
(This article belongs to the Section Electroanalysis)

Abstract

:
In this study, gold nanoparticles (AuNPs) were synthesized using the Turkevich method. This article explains the didactic step-by-step synthesis, showing pictures of the entire process, including a well-explained mechanism and characterization study. Synthesis involves the reduction of NaAuCl4 using sodium citrate at high temperatures (approximately 90 °C). The two main mechanisms used to explain AuNPs synthesis via the Turkevich method are also discussed. The first mechanism considers that a nanowire intermediary and the other proposes that aggregate intermediates are not formed at any time during the synthesis. The materials (NaAuCl4 and AuNPs) were characterized using UV-Vis spectroscopy, scanning electron microscopy (SEM), atomic force microscopy (AFM), X-ray diffraction (XRD), and dynamic light scattering (DLS). The UV-Vis spectrum exhibits an absorption maximum at 521 nm because of the surface plasmon resonance (SPR) absorption band of the AuNPs. The SEM images of NaAuCl4 show crystals with cubic shapes, while the AuNPs have an average particle size of approximately 16–25 nm and particles that appear mainly spherical. To confirm the particle shapes, AFM was conducted, and it was possible to clearly observe individual spherical nanoparticles and their aggregates, and the average diameter of these AuNPs was approximately 12–19 nm. The XRD pattern of AuNPs showed four main characteristic peaks corresponding to the (111), (200), (220), and (311) planes, confirming the presence of cubic (FCC) gold. The DLS presented an average particle size of 3.3 ± 0.9 nm and a polydispersity index (PDI) of 0.574. AuNPs were synthesized using a simple and rapid method. The resulting spherical and ultra-small particles can be used in several applications.

1. Introduction

During the 1850s, Faraday fabricated gold slides and examined them using shining light. For this purpose, he used sodium chloroaurate (NaAuCl4) with a reducing suspension, such as phosphorus in carbon disulfide, where the color changed from bright yellow to deep ruby. The resulting liquid is known as Faraday gold [1,2,3]. While shining a beam of light through the liquid, Faraday observed that a portion of the light was scattered, leading to the divergence of the light beam. This was explained by the presence of fine particles of gold dispersed in the liquid “in a state of extreme division”, which was not visible in any microscopy. This behavior is known as the Faraday–Tyndall effect. Faraday’s studies recognized the emergence of nanoscience and nanotechnology [1,2,3].
Gold nanoparticles (AuNPs) of various sizes and shapes have been fabricated using different techniques and routes. AuNPs have attractive physical properties, including surface plasmon resonance (SPR), the ability to quench fluorescence, surface-enhanced Raman scattering (SERS), and redox activity. Over the last decade, these properties have been used in the fabrication of electronic devices, imaging, sensing, printable inks, photodynamic therapy, therapeutic agent delivery, sensors, catalysis, probes, and others [4,5,6,7,8,9,10,11].
In addition, AuNPs exhibit excellent biocompatibility owing to their high binding affinities to biomolecules. Both covalent and noncovalent approaches have been designed to conjugate AuNPs. The most common covalent conjugation is the direct attachment of the thiolate molecule to AuNPs. Non-covalent interactions are usually due to electrostatic interactions, hydrophobic interactions, and specific binding affinities [4,12].
The synthesis of nanoparticles, in general, is usually classified by two methods: top-down and bottom-up approaches. In the top-down method, bulk metals decompose into smaller particles, generating the required nanostructures. The bottom-up method assembles atoms or molecules into larger nanostructures to generate nano-sized materials [11,12,13]. These synthetic approaches have been performed using physical, chemical, and biological methods. Each fabrication method has its own advantages and disadvantages.
The most common approach for synthesizing AuNPs is chemical methods. It usually employs three components: a metal precursor, reducing agent, and stabilizing/capping agents. The metal precursor is a metallic salt, such as gold. Chemical reduction can be performed using various chemical reductants such as sodium citrate (Na3C6H5O7), hydrazine (N2H4), ascorbic acid (HC6H7O6), and sodium borohydride (NaBH4) [14]. In addition, the stabilizing agent was absorbed onto the AuNPs surface to prevent agglomeration. The most common are phosphorus ligands, trisodium citrate dihydrate (C6H9Na3O9), cetyltrimethylammonium bromide (CTAB), chitosan, surfactants, and other polymers [12,13,14,15].
Although there are many articles discussing the synthesis of gold nanoparticles, to the best of our knowledge, we did not find an article that explained didactic step-by-step synthesis, the role of each reagent, or showed pictures of the entire process, including a well-explained mechanism and characterization study. Therefore, in this study, gold nanoparticles were synthesized using the well-known Turkevich method, and these aspects are considered in the discussions. This classical method was presented by Turkevich in 1951 using trisodium citrate as a reducing agent. Since then, several articles have proposed syntheses using a modified version of the Turkevich method [16,17,18,19].

2. Materials and Methods

2.1. Reagents

Sodium citrate (Na3C6H5O7) was purchased from Synth (Diadema, São Paulo, Brazil). Sodium tetrachloroaurate (III) dihydrate (NaAuCl4) was purchased from Sigma-Aldrich (Barueri, São Paulo, Brazil). All reagents were of analytical purity and all solutions were prepared with purified water using a Millipore Milli-Q system with a resistivity of 18.2 MΩ cm (at 25 °C).

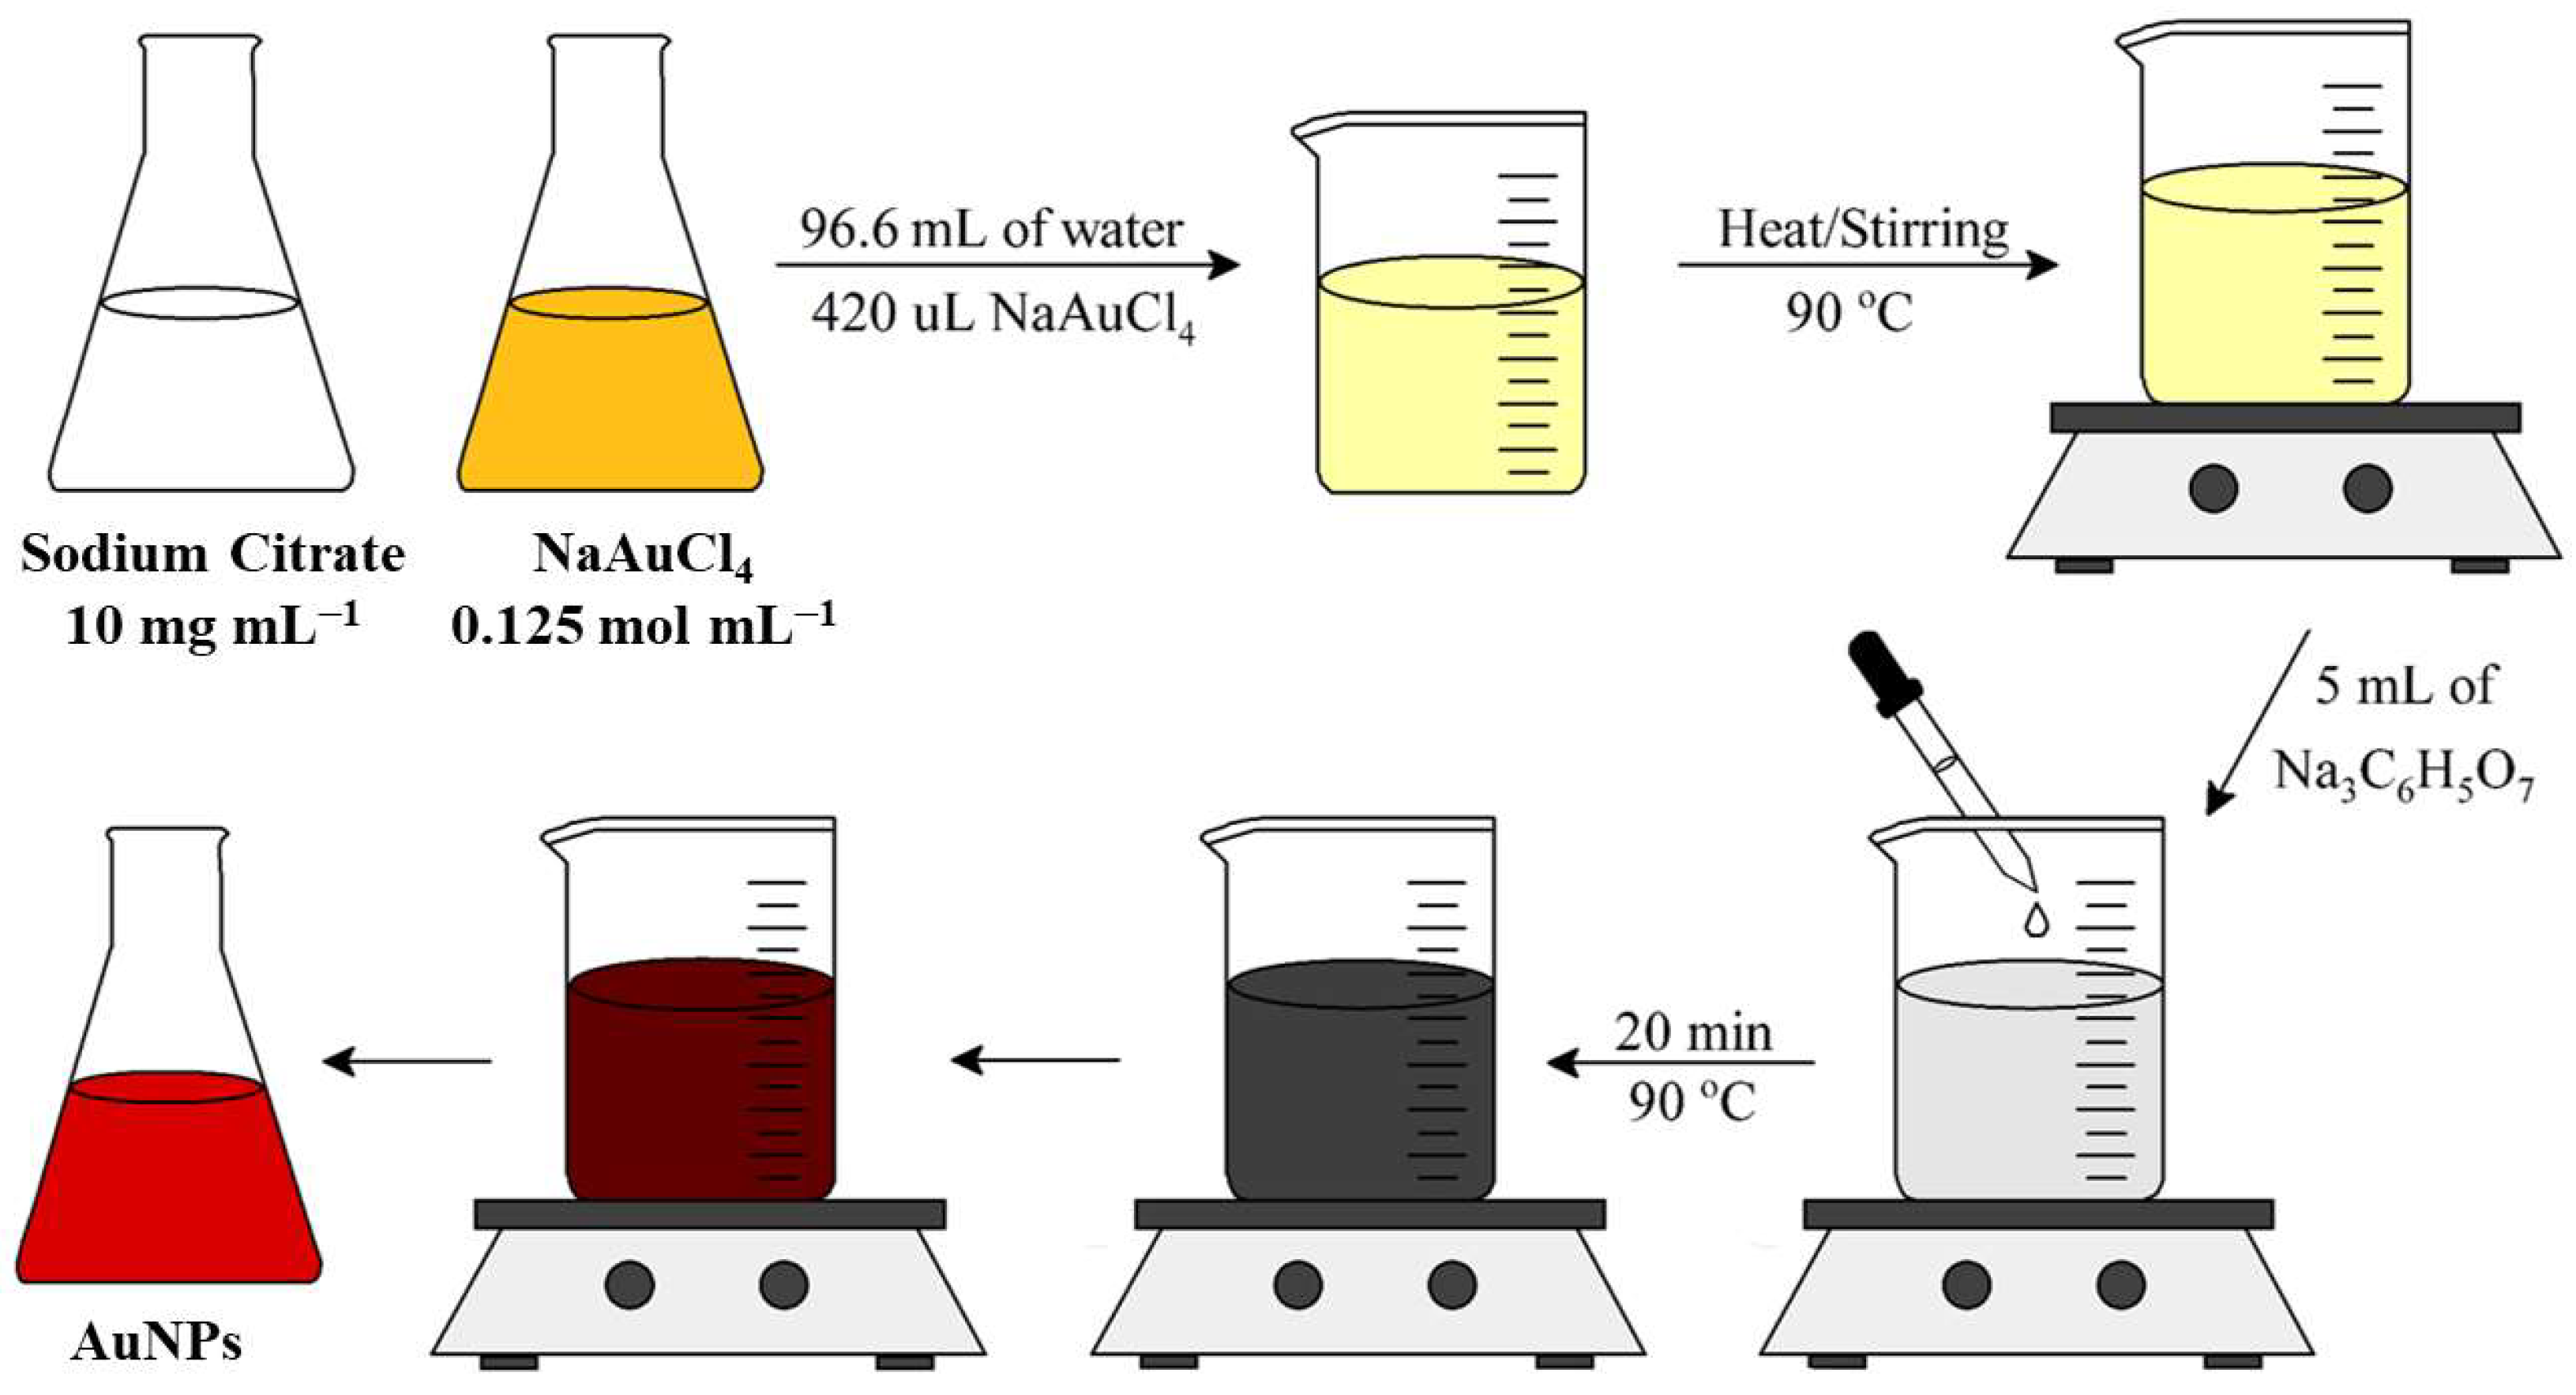
2.2. Synthesis of Gold Nanoparticle

This paper will explain the didactic step-by-step process of the synthesis, showing pictures of the entire process, including a well-explained mechanism and characterization study. The synthetic process is illustrated in Figure 1. The gold nanoparticles were fabricated using classical citrate synthesis, also known as the Turkevich method.
Stock solutions of sodium citrate (10 mg mL−1) and sodium tetrachloroaurate (NaAuCl4) (0.125 mol L−1) were prepared. Subsequently, 420 µL of NaAuCl4 was added to 94.6 mL of deionized water, and the solution was agitated and heated to 90 °C. When the required temperature was achieved, 5 mL of sodium citrate was quickly added. Agitation and heating at 90 °C were performed for 20 min. The color of the suspension changed from light yellow to grey and then to red, indicating the formation of AuNPs. The AuNPs suspension was then slowly cooled to room temperature and maintained at 4 °C.

2.3. Characterization Techniques

NaAuCl4 and AuNPs samples were characterized using different techniques. UV-Vis Spectrometry was performed using a spectrophotometer UV-2550 (Shimadzu, Kyoto, Japan) at 300–800 nm. Both samples were diluted in deionized water using a quartz cuvette.
Scanning electron microscopy (SEM) images were recorded on a JEOL JSM 300-LV instrument (Tokyo, Japan). The measurements were performed by Prof. Dr. Lucas Franco Ferreira of the Federal University of the Jequitinhonha and Mucuri Valleys (UFVJM). X-ray diffraction analysis (XRD) was performed using a Shimadzu model XRD 6000 (30 kV, 30 mA) and Cu-Kα (λ = 1.54 Å) in the 30–90° range. In both techniques (SEM and XRD), the NaAuCl4 and AuNPs samples were placed on an acetate slide and dried at 70 °C.
Atomic force microscopy (AFM) was performed using a Bruker Multimode 8 (MM8) microscope. A scan size of 5.00 µm and amplitude of 5000 mV were used. AFM was conducted only for AuNPs. The sample was dried on a graphite substrate and placed on a circular metallic AFM holder using silver tape.

3. Results

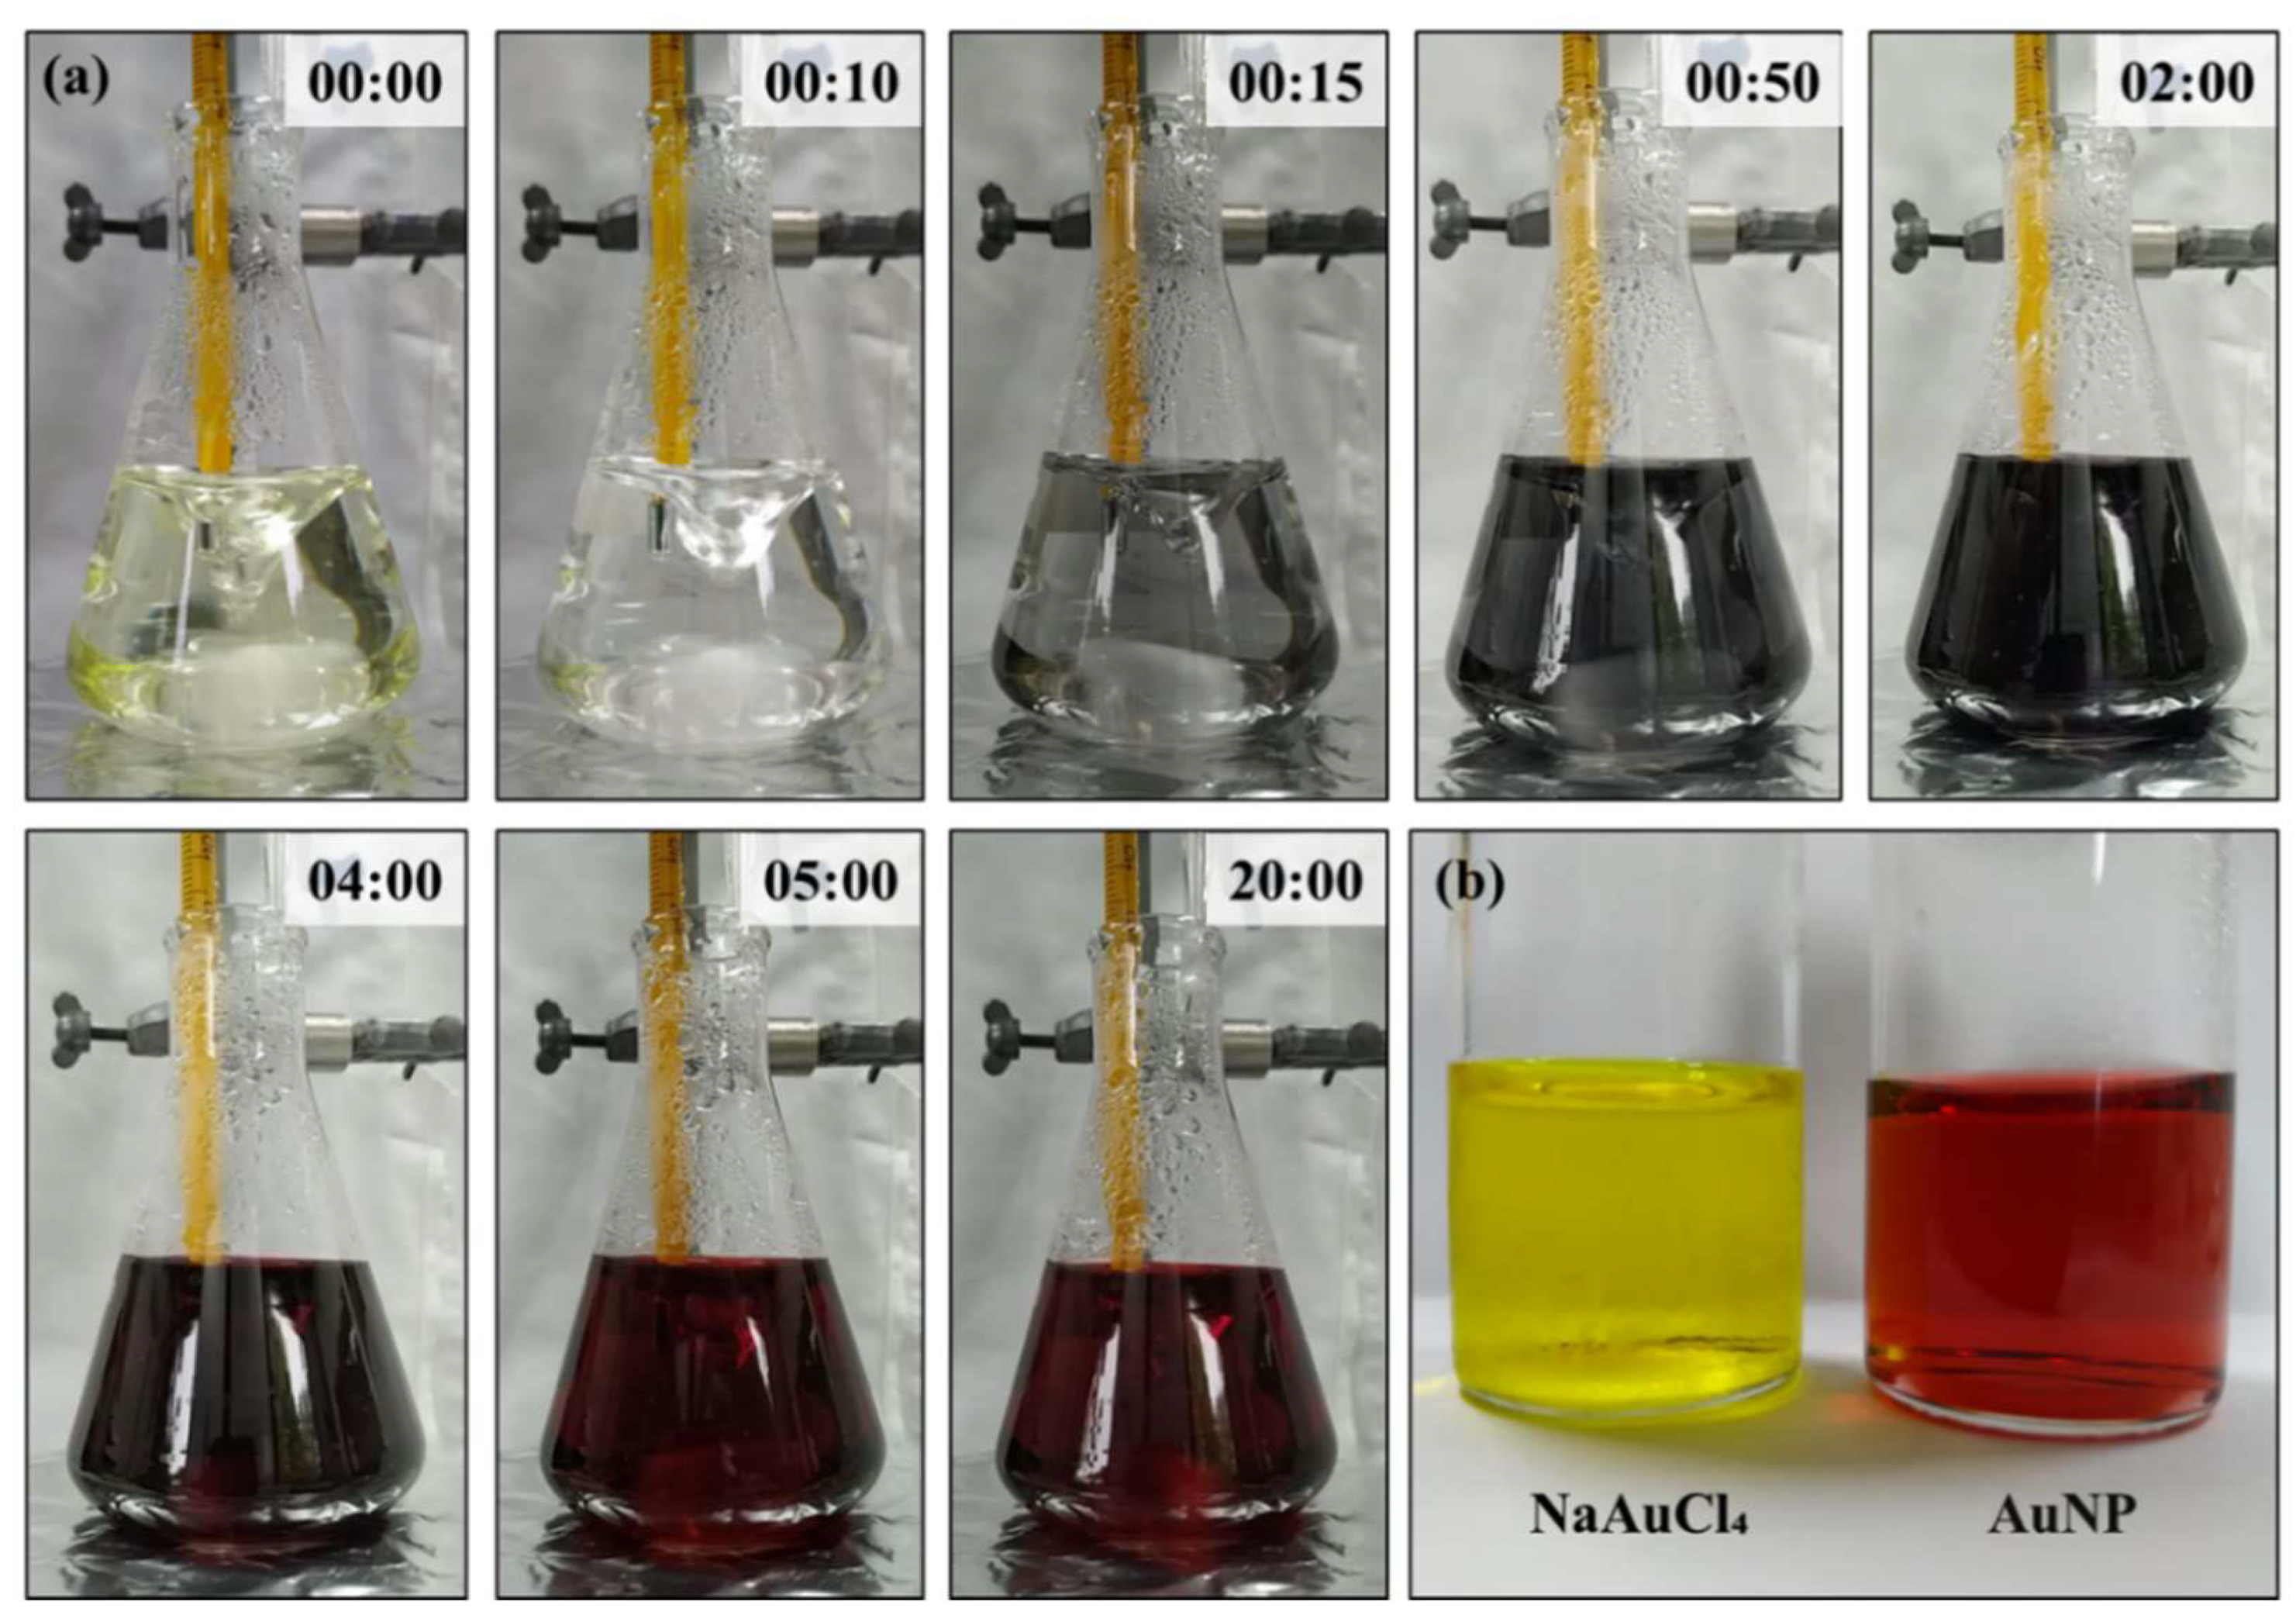
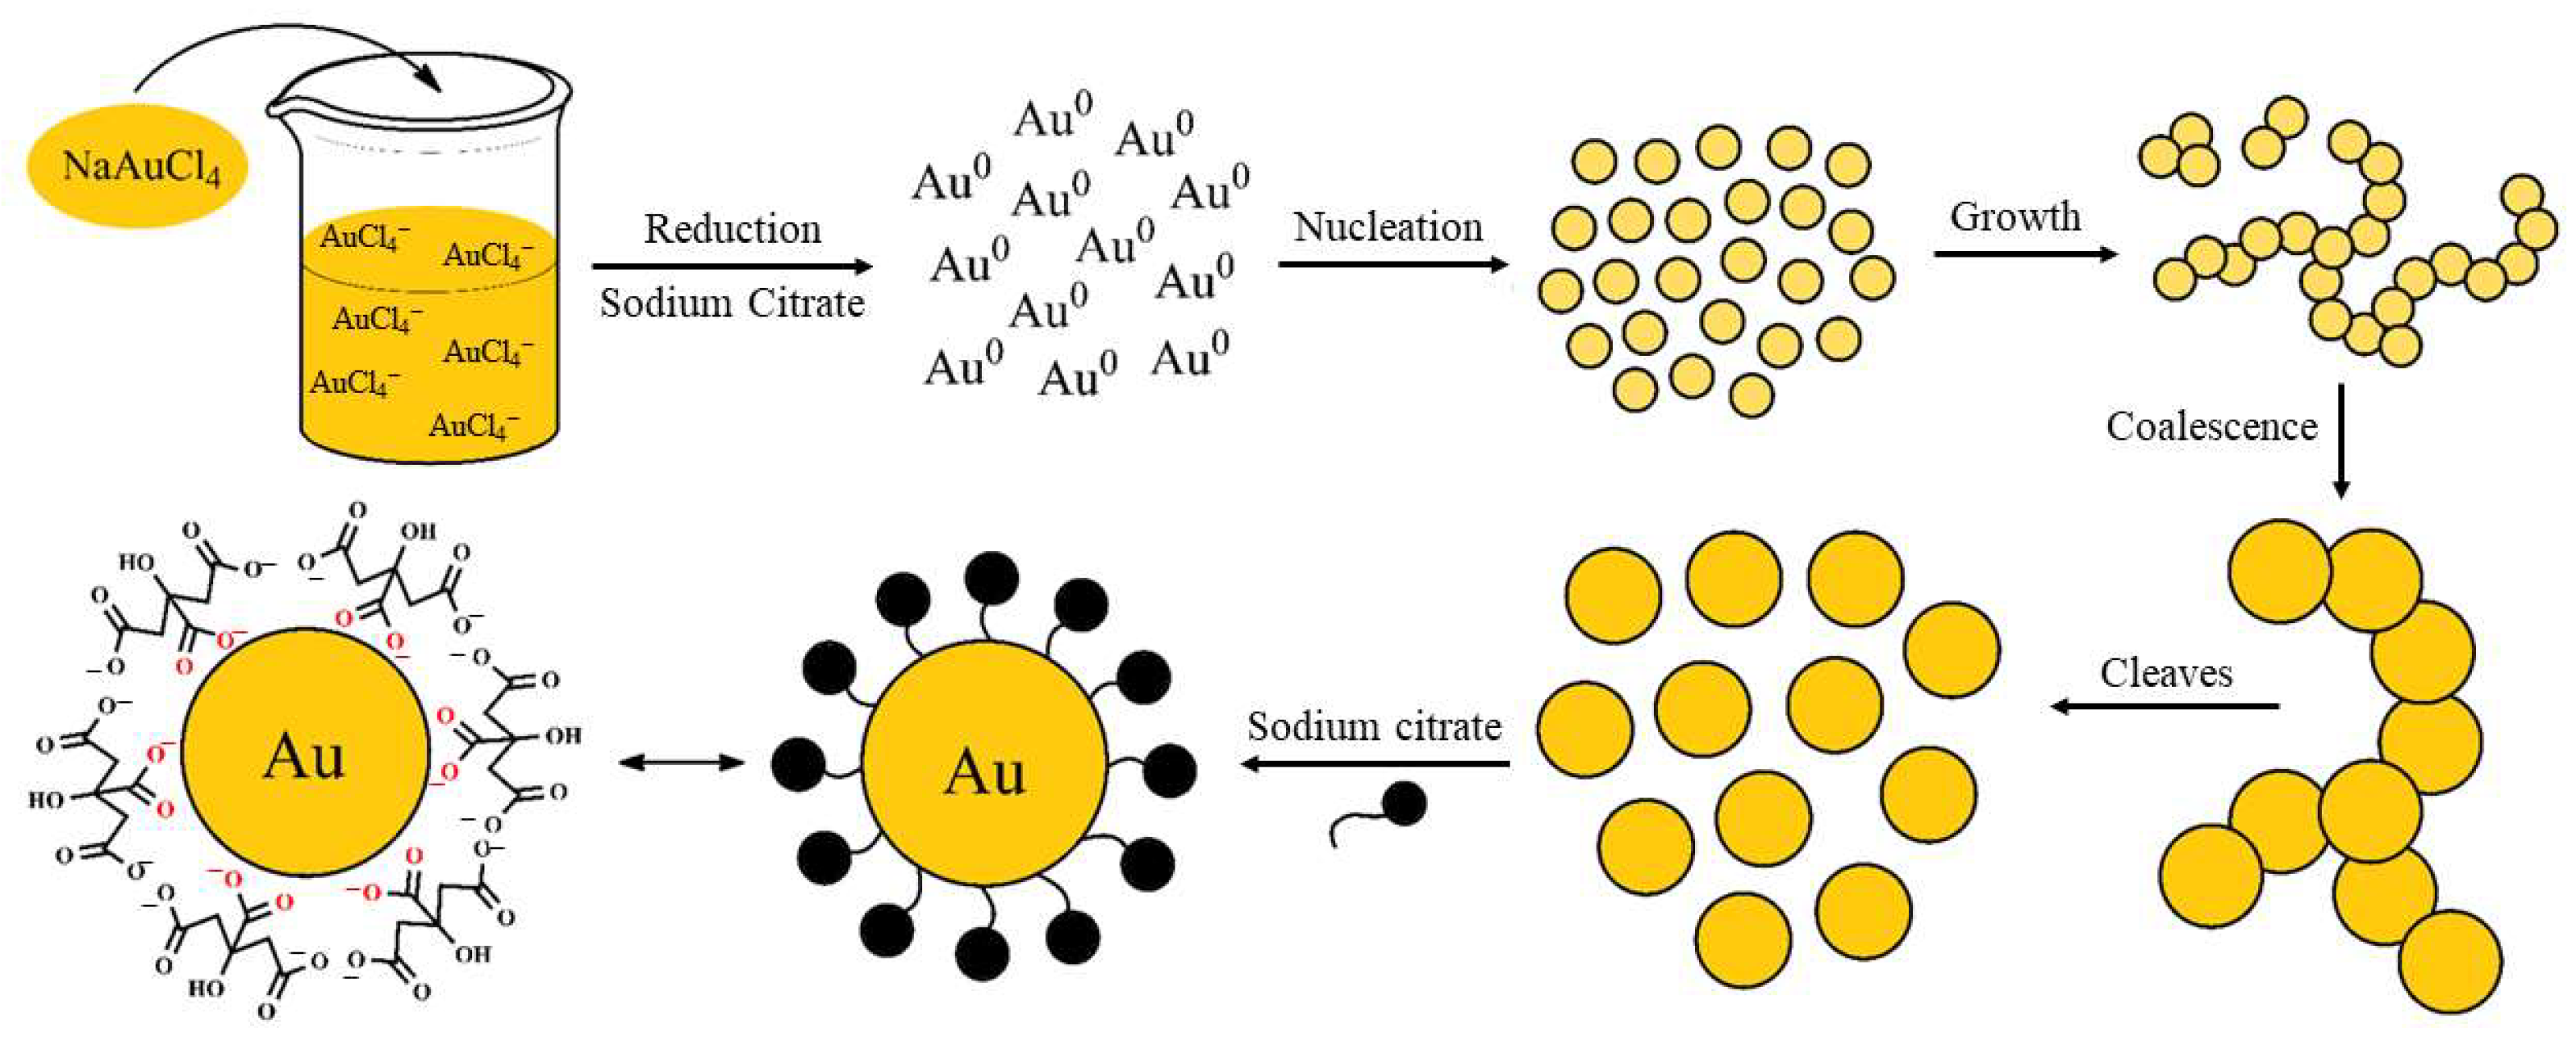
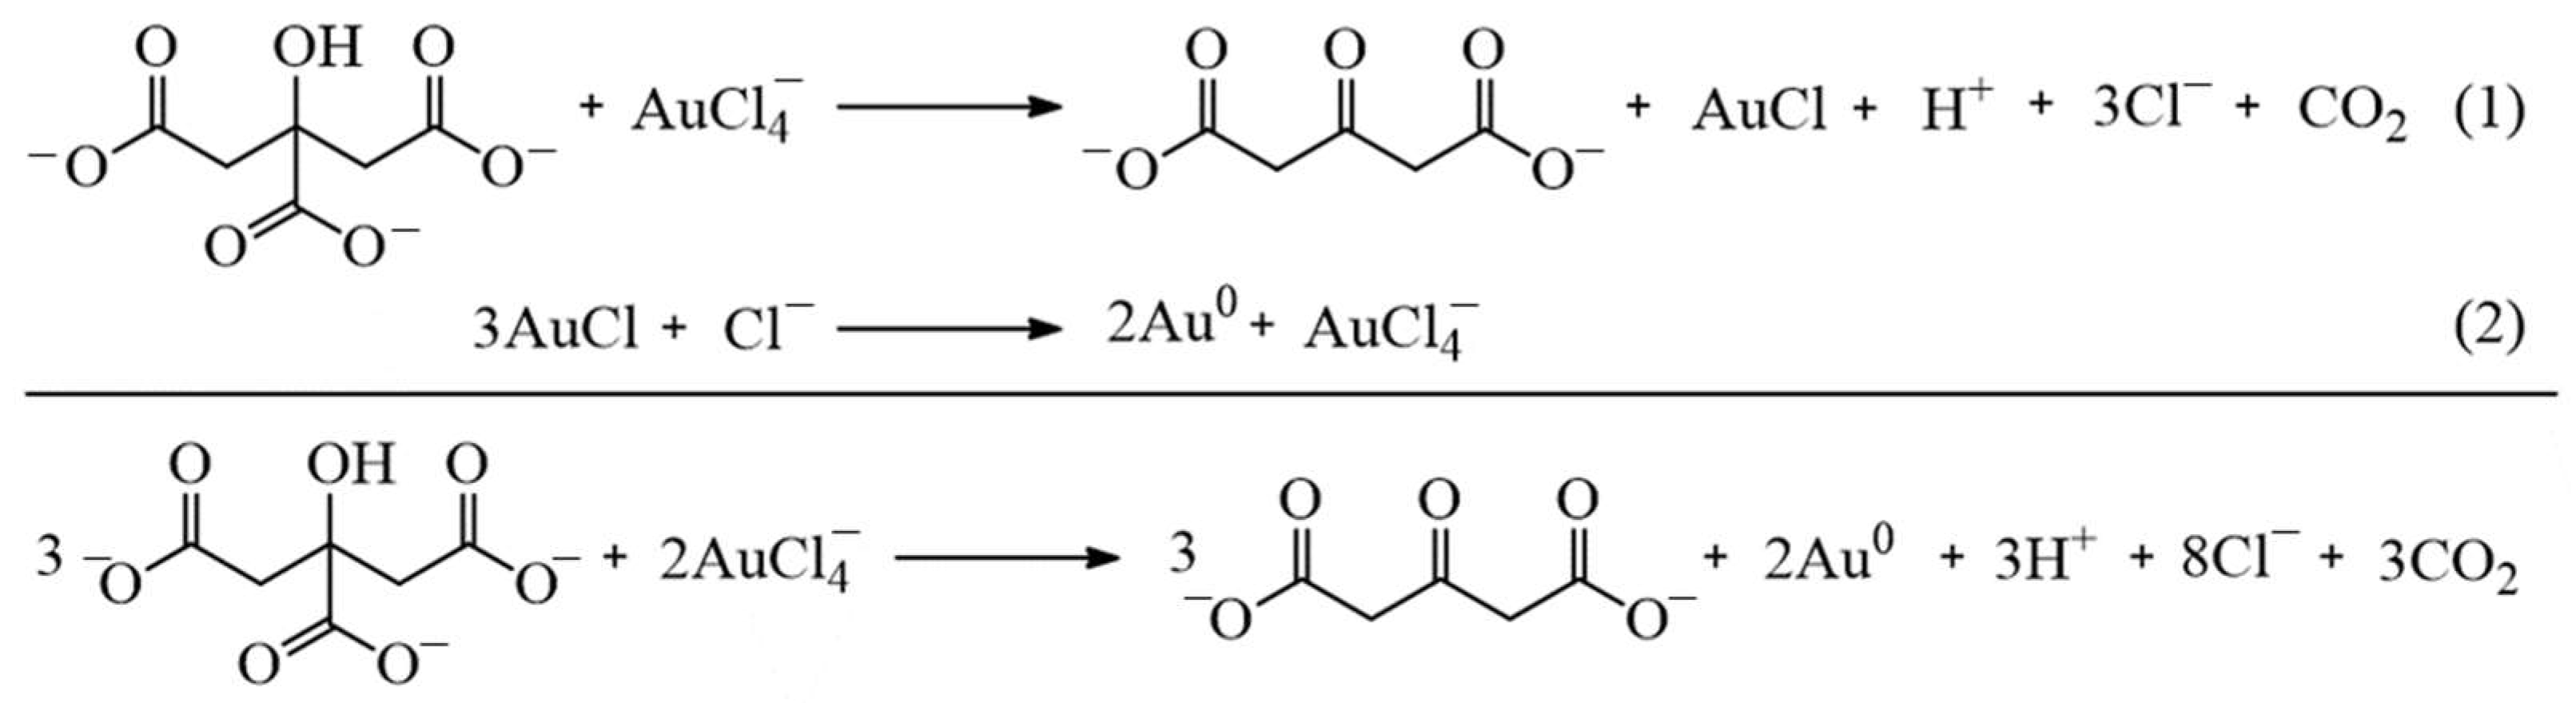
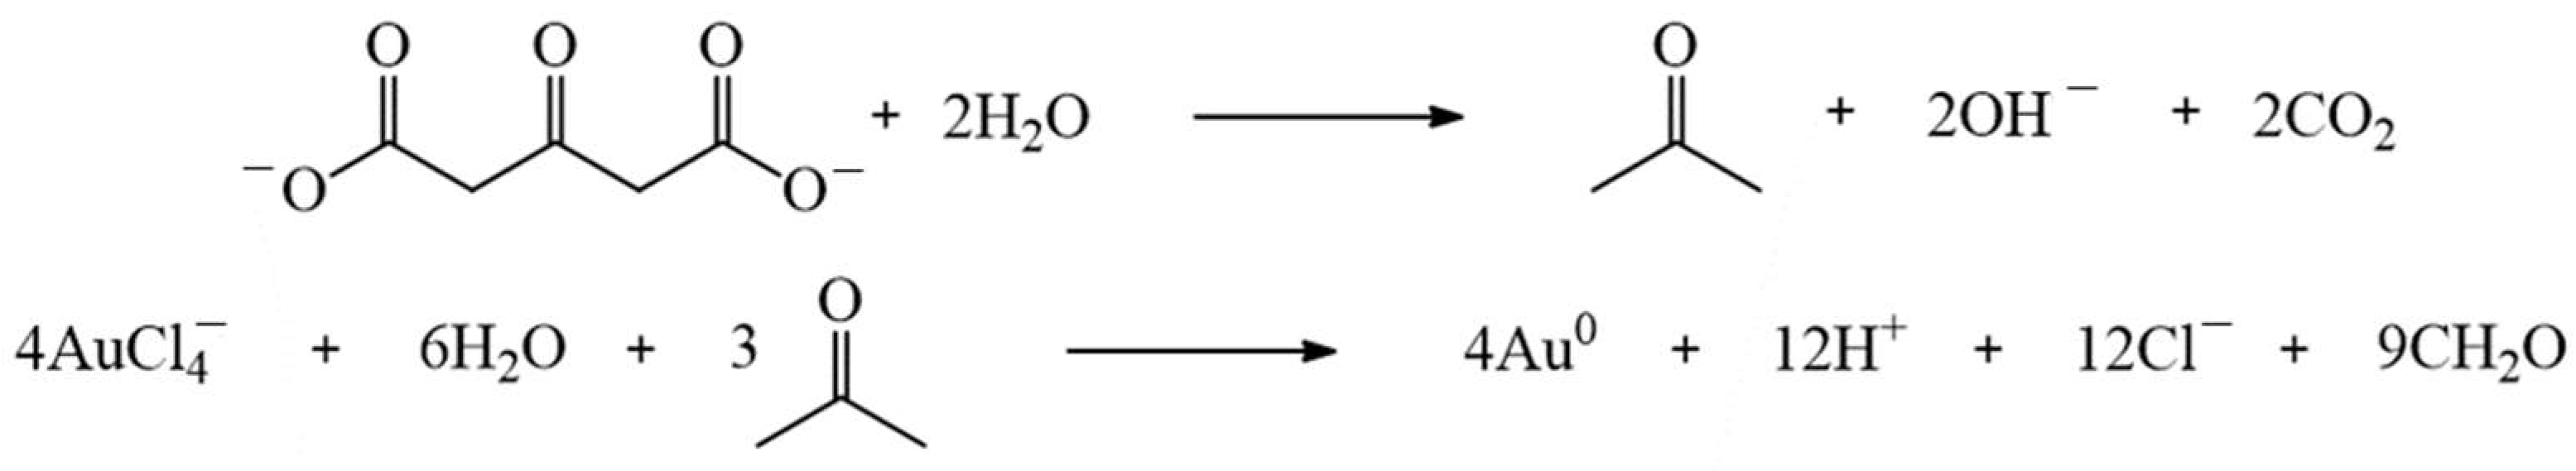
3.1. Synthesis of Gold Nanoparticle

AuNPs were synthesized using the Turkevich method, and photographs of the process are shown in Figure 2a. As observed in the photographs, during synthesis, the color changed from pale yellow to a transparent colorless suspension almost immediately after citrate addition. The suspension remained colorless for 10 s and rapidly turned bluish gray. The next minute, the suspension continued to darken to a dark blue/purple color that was almost black. At this point, the suspension started to turn deep wine red, which is a characteristic of AuNPs. At the end of the synthesis (20 min), the color did not change considerably.
Notably, the suspension must be continuously stirred during the synthesis or agglomeration/precipitation of Au. In addition, the temperature was precisely controlled because it is a defining parameter in the synthesis of AuNPs. Increasing the temperature usually decreases the size of AuNPs. Hence, the chosen temperature was 90 °C, which was kept constant during all syntheses [20].
A color change was clearly observed when comparing the stock solutions of NaAuCl4 and the synthesized AuNPs, as shown in Figure 2b. For spherical particles of approximately 30 nm, the AuNPs absorbed light in the blue-green portion of the spectrum, reflecting red light. This results in a AuNPs red suspension, which is characteristic of stable AuNPs suspensions of gold nanoparticles. However, as the particle size increased, absorption shifted to higher wavelengths. Red light is absorbed, and blue/purple light is reflected [21]. Hence, the formation of red AuNPs during the synthesis indicated that the nanoparticles were approximately 30 nm in size.
Several authors have discussed the mechanisms of AuNPs synthesis. Two mechanisms are generally used to explain the Turkevich method. Both are discussed in this section and are related to the synthesis performed in this study. The first mechanism, presented in Figure 3, considers that an intermediary is formed during the synthesis. The second mechanism, shown in Figure 4, proposes the formation of non-aggregate intermediates.
Pong et al. studied the growth mechanism in the citrate reduction of gold(III) salt and proved the formation of a Au nanowire intermediate via transmission electron microscopy (TEM) [22]. Zhao et al. also reported the formation of wire-like aggregates as an intermediate step [23]. First, a NaAuCl4 solution was prepared in water. The pale-yellow color was due to the presence of gold salt, which is a yellow-gold powder. After the addition of sodium citrate, the Au3+ species was rapidly reduced to metallic Au (Au0) and formed small clusters. This process was observed during the colorless phase. The nanoclusters then coalesced to form a network of nanowires, turning the suspension bluish-gray. This initial stage was extremely rapid, as shown in Figure 2a. Therefore, the blue/purple color observed during the synthesis is related to the formation of gold nanowires as an intermediate step during AuNPs growth [23,24,25].
As the suspensions became darker, the diameter of the nanowires increased linearly, owing to coalescence. This refers to the process in which particles merge during contact, thereby decreasing the number of particles. Simultaneously, the extensive network begins to cleave, leaving fragments of spherical particles. This process is clearly observed because it gives the suspension a red color [23,24,25].
Another mechanism explains the Turkevich method. Polte et al. proposed that aggregate intermediates are not formed at any time during the Turkevich synthesis [22,26]. Wuithschick et al. refined this theory and explained the bluish color in the middle of their synthesis [27]. The first step involved the rapid reduction of NaAuCl4 by sodium citrate and the formation of small clusters. These steps occurred during the first 10 s of synthesis. Then, the cluster grew owing to coalescence, forming citrate-capped AuNPs. According to Wuithschick et al., the blue/purple color observed during synthesis is caused by the adsorption of NaAuCl4 on the nanoparticle surface, which influences the surface chemistry or dielectric constant of the surrounding medium. Therefore, after a few minutes, NaAuCl4 is completely reduced, resulting in ruby red [12,18,22,26,27,28].
Therefore, in this study, we consider both the mechanisms proposed for the synthesis of AuNPs and the perspectives of different authors. This was chosen because there is no consensus among researchers regarding the underlying mechanisms.
However, both these mechanisms involve the reduction of AuCl4 using citrate. Figure 5 illustrates the proposed mechanism involved in this reduction. This mechanism involved two steps. First, trivalent gold (Au3+) is reduced to monovalent gold (Au+) by citrate. Simultaneously, citrate (Cit3+) is oxidized to acetone dicarboxylate (ACDC2−). The second step involves a disproportionation reaction in which metallic gold (Au0) and trivalent gold (Au3+) are produced. The overall reaction is shown in Figure 5 [29,30,31,32].
Previous studies have suggested that acetone dicarboxylate (ACDC2−) is rapidly degraded to acetone at a synthesis temperature of approximately 100 °C, as shown in Figure 6. The degradation products reduce trivalent gold (Au3+) and lead to a complete conversion to Au0. Therefore, ACDC2− acts as an auxiliary reducing agent [29,31].

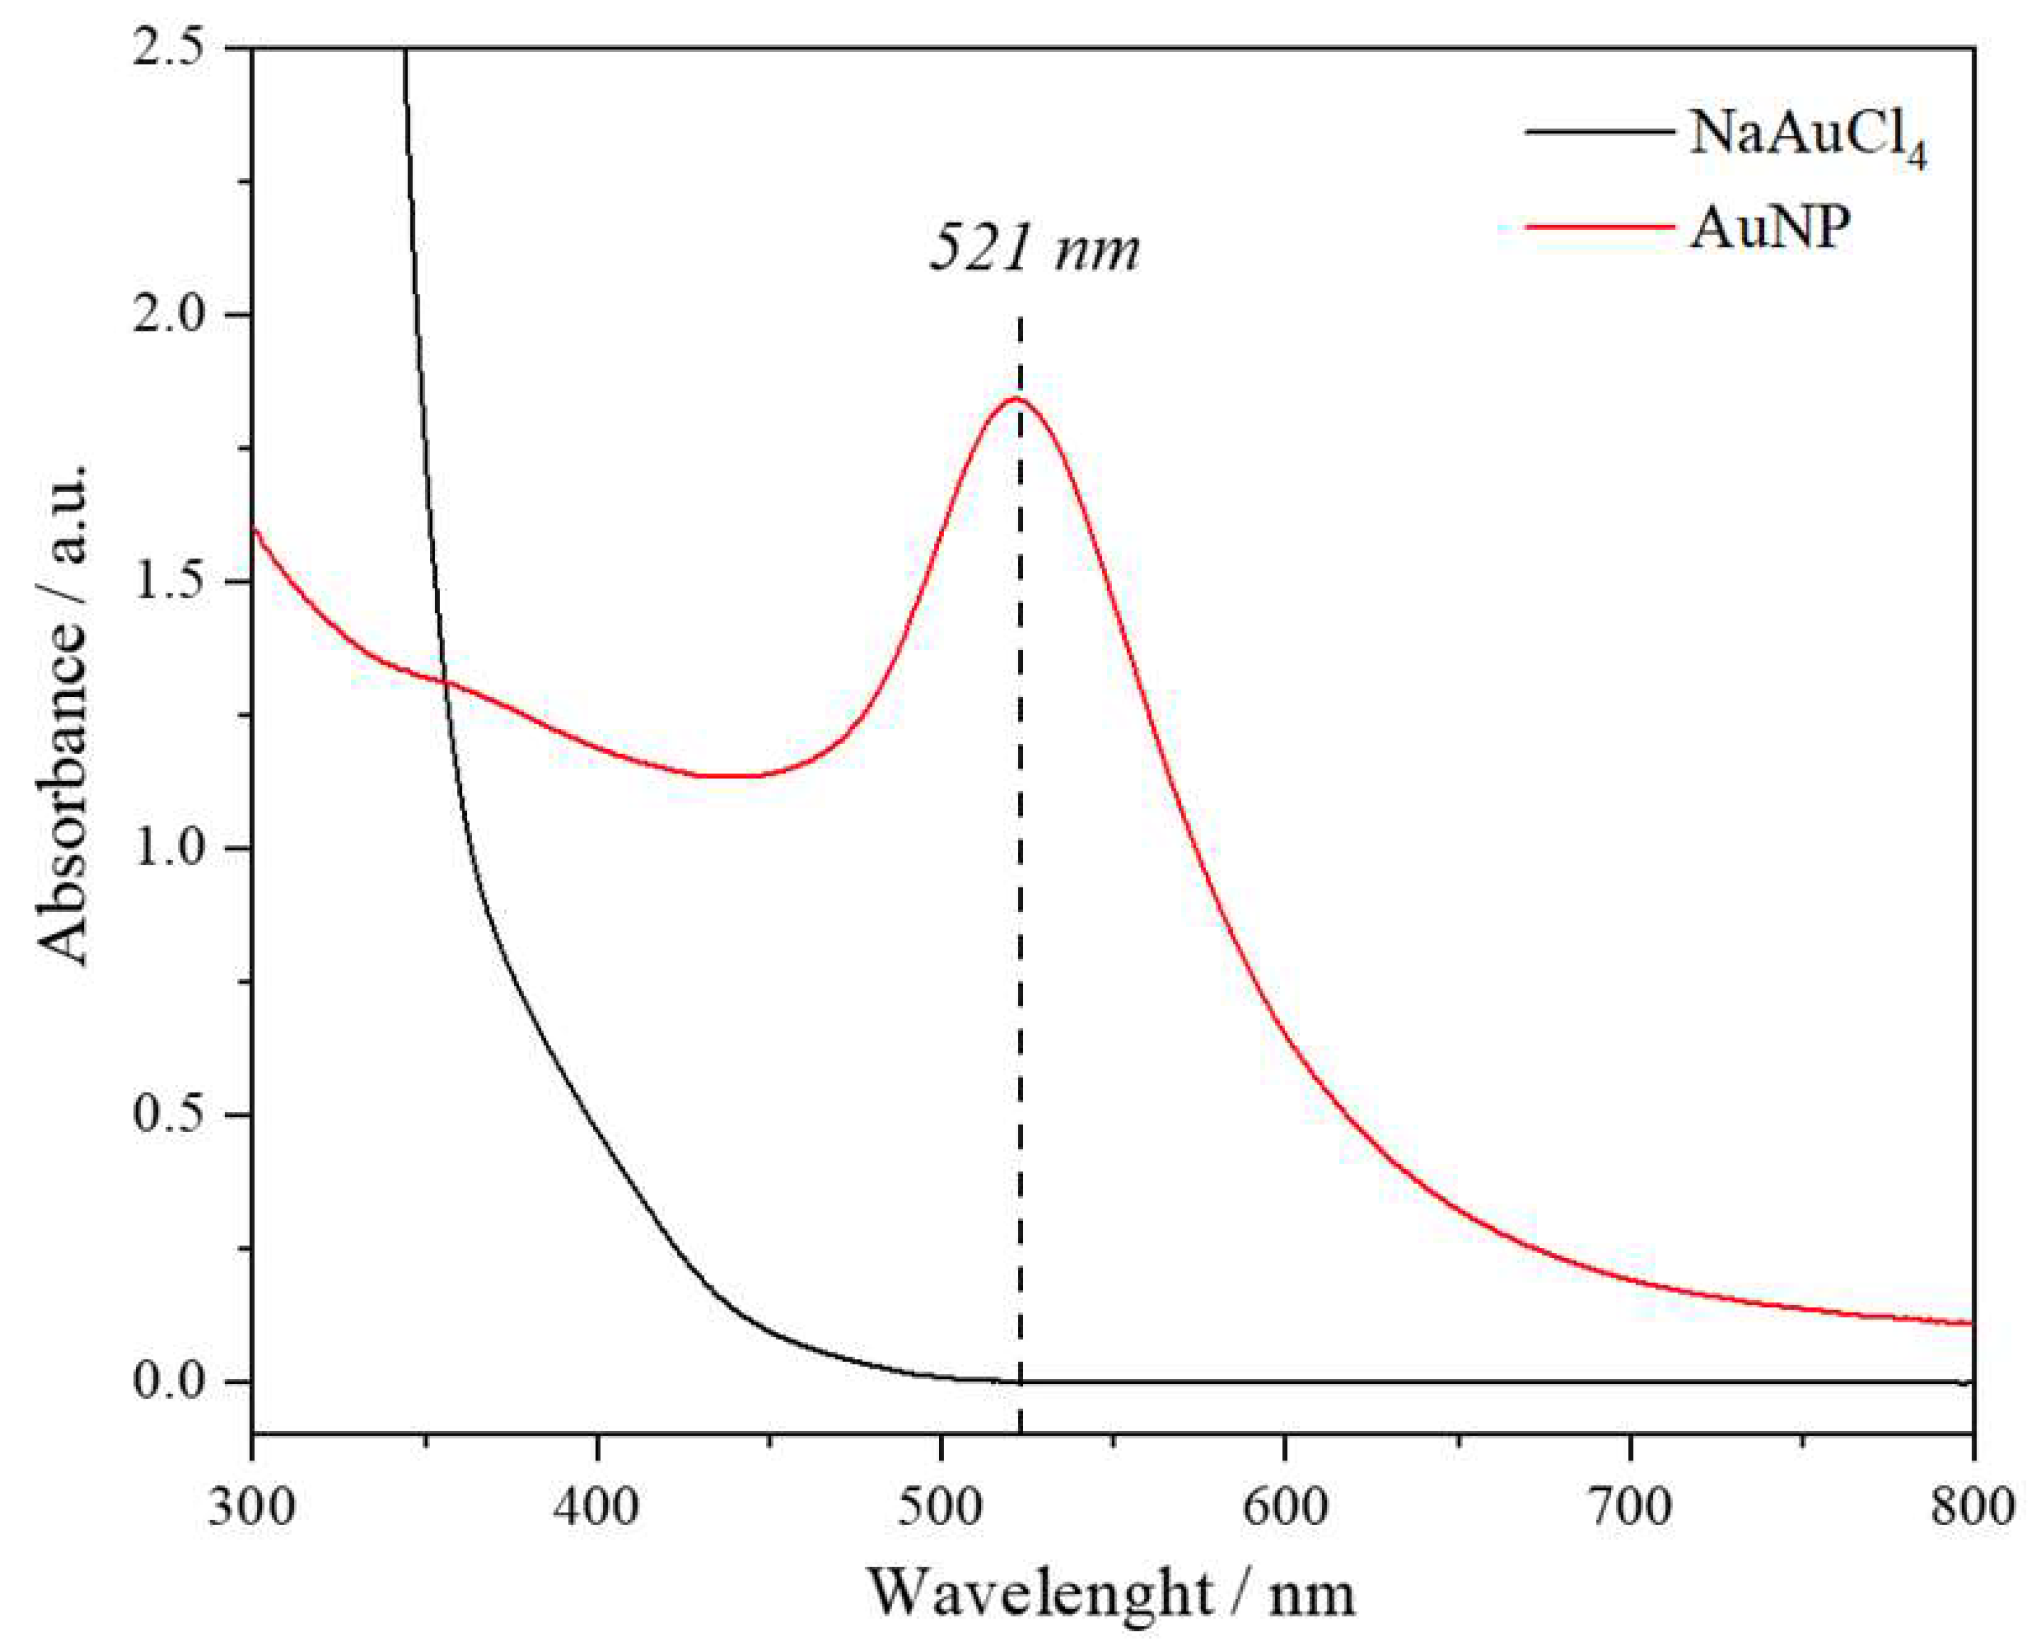
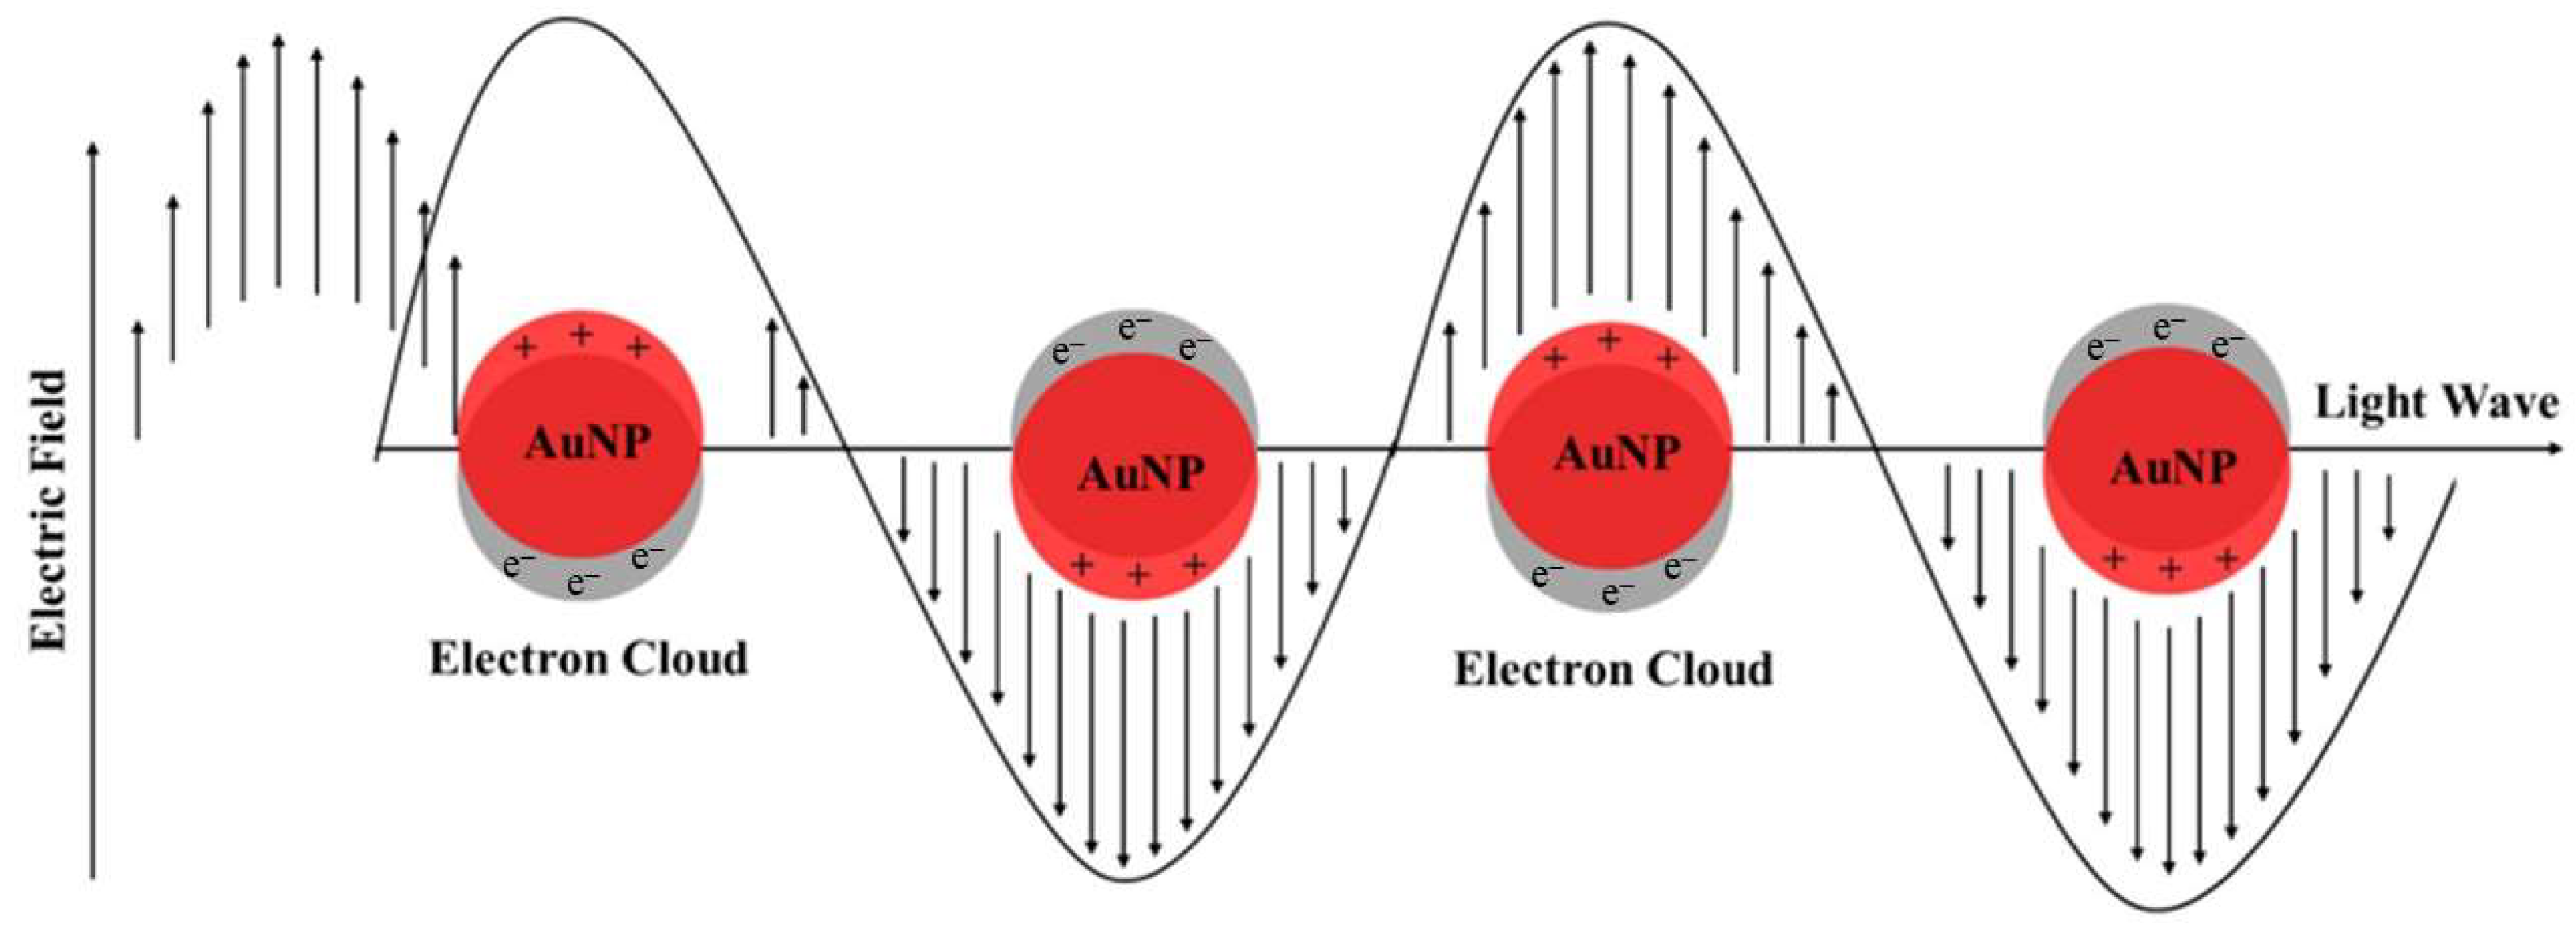
3.2. UV-Vis Spectroscopy

Gold nanoparticles exhibit localized surface plasmon resonance (LSPR), which results in a strong absorbance band in the visible region (500–600 nm) that can be measured using UV-Vis spectroscopy. The spectra obtained are shown in Figure 7. As expected, AuNPs exhibited an absorption maximum at 521 nm, owing to the SPR absorption band [33].
The surface plasmon (SP) phenomenon is the oscillation of free electrons on the surface of a solid material. Surface plasmons exist in two forms: localized and propagating. The localized surface plasmon resonance (LSPR) is supported by metal nanoparticles. LSPR occurs when the frequency of incident light matches the natural frequency of surface electrons [33,34].
The oscillating field of the incident light induces the free electrons to oscillate coherently, causing a disturbance in the electron cloud in the AuNPs, leaving a portion of the particle positively charged. The electron cloud oscillates at the dipolar plasmon resonance frequency [35,36,37]. This phenomenon is illustrated in Figure 8.
The band intensity and wavelength depend on the properties of AuNPs, including their structure, shape, metal, and size [33,36,38]. Typically, the surface plasmon band for spherical AuNPs of 10 nm presents peaks at approximately 521 nm in the UV-Vis spectrum. The wavelength shifts to higher values with an increase in the NP diameter [38]. The synthesized AuNPs exhibited a strong, broad peak at 521 nm. This result indicated that the obtained AuNPs had a diameter of approximately 10 nm.

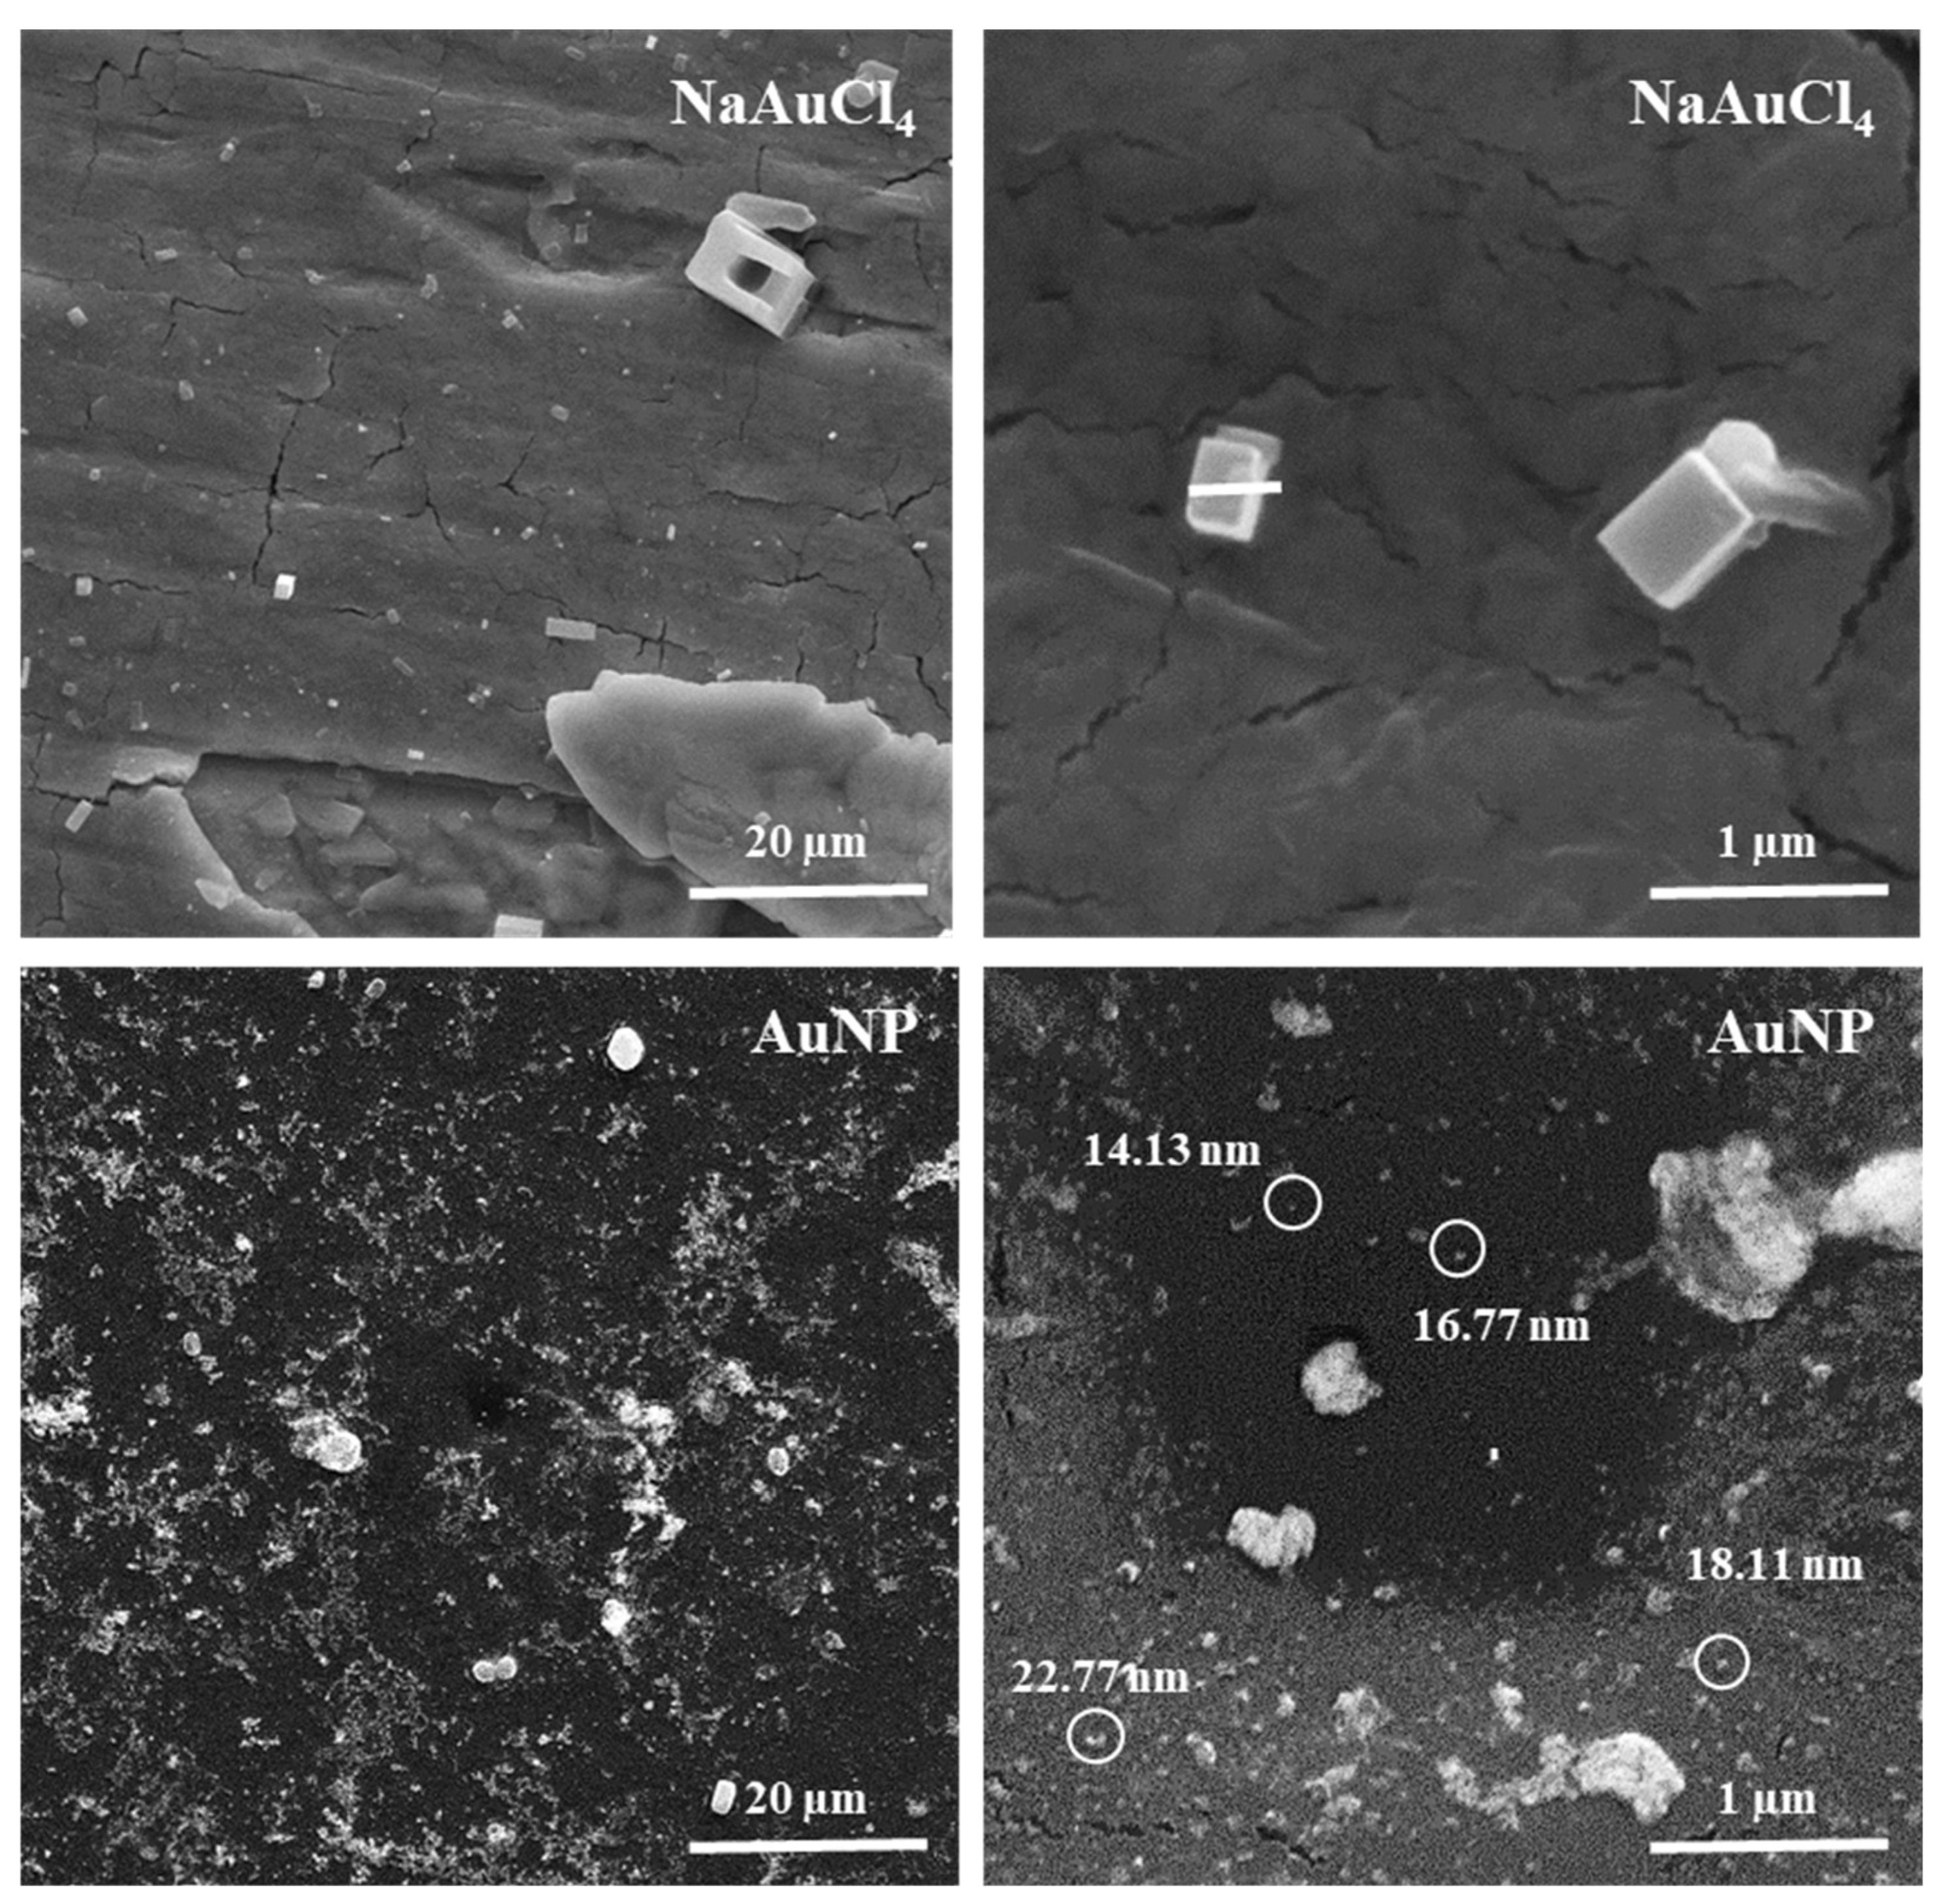
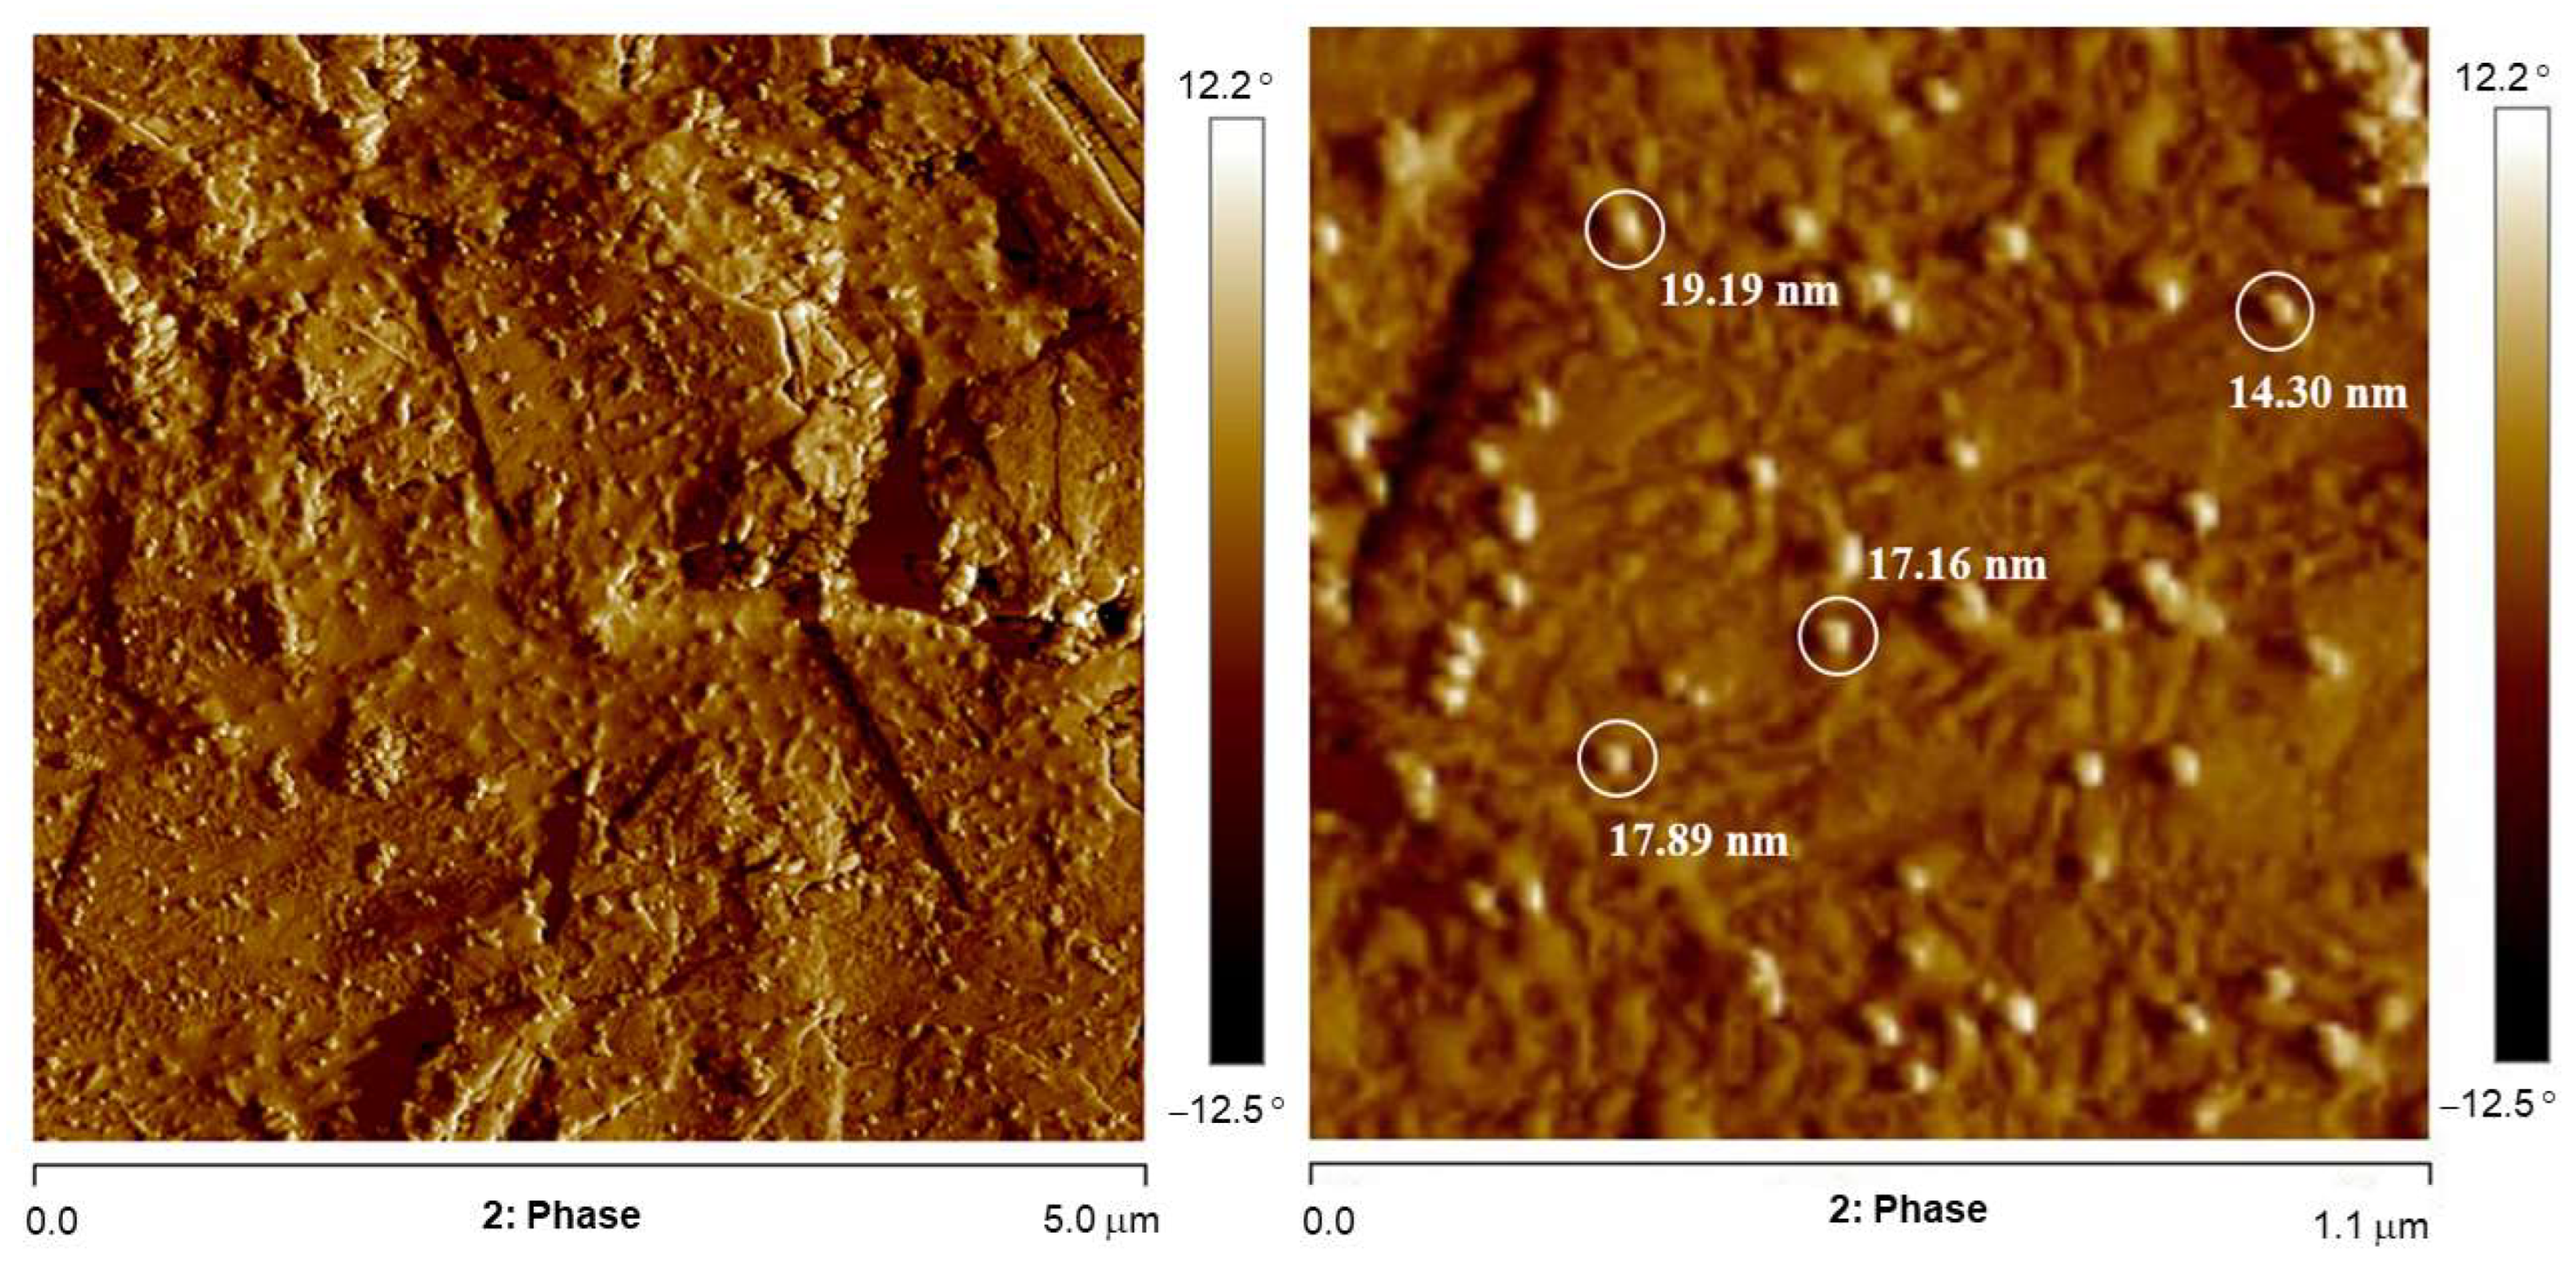
3.3. Scanning Electron Microscopy and Atomic Force Microscopy

Scanning electron microscopy (SEM) is a valuable tool for examining the surfaces of materials [39]. In this study, SEM was used to confirm the production of AuNPs and study the topography of NaAuCl4 and the obtained AuNPs. Images were viewed at magnifications of 2000× and 30,000×. The obtained images are shown in Figure 9. The images of tetrachloroaurate(III) dehydrate (NaAuCl4) present cubic crystals. At a magnification of 30,000×, there were two crystals of 0.38 µm and 0.67 µm [40,41].
The SEM results revealed the structure of AuNPs. The image shows a uniform distribution of AuNPs; however, the surface indicates some degree of aggregation, generating random aggregates of several sizes and irregular shapes. In addition, a high-magnification image shows the formation of larger particles and more agglomerations [42,43]. The average particle size was not determined in this study.
The image also shows particles that appear to be mainly spherical [44,45,46]. However, because of the limited resolution of SEM, a clear shape and size of the obtained AuNPs could not be observed. Therefore, the morphology of the AuNPs was characterized by atomic force microscopy (AFM).
Atomic force microscopy (AFM) is a powerful technique for investigating surface morphology. AFM scans the sample surface with a sharp tip, producing a three-dimensional topography. This provides a higher level of detail for these surfaces [47]. The obtained images are shown in Figure 10. In these images, it was possible to observe individual spherical nanoparticles and their aggregates. The average diameter of the AuNPs measured from the images was approximately 11–19 nm [48,49].
These results are in agreement with the SEM images. The size was close to that observed in SEM, and it was possible to observe the shape more clearly. This indicated the effective synthesis of AuNPs from the precursor NaAuCl4 [46]. It also shows that the particles have a spherical shape with an average diameter of approximately 15 nm.

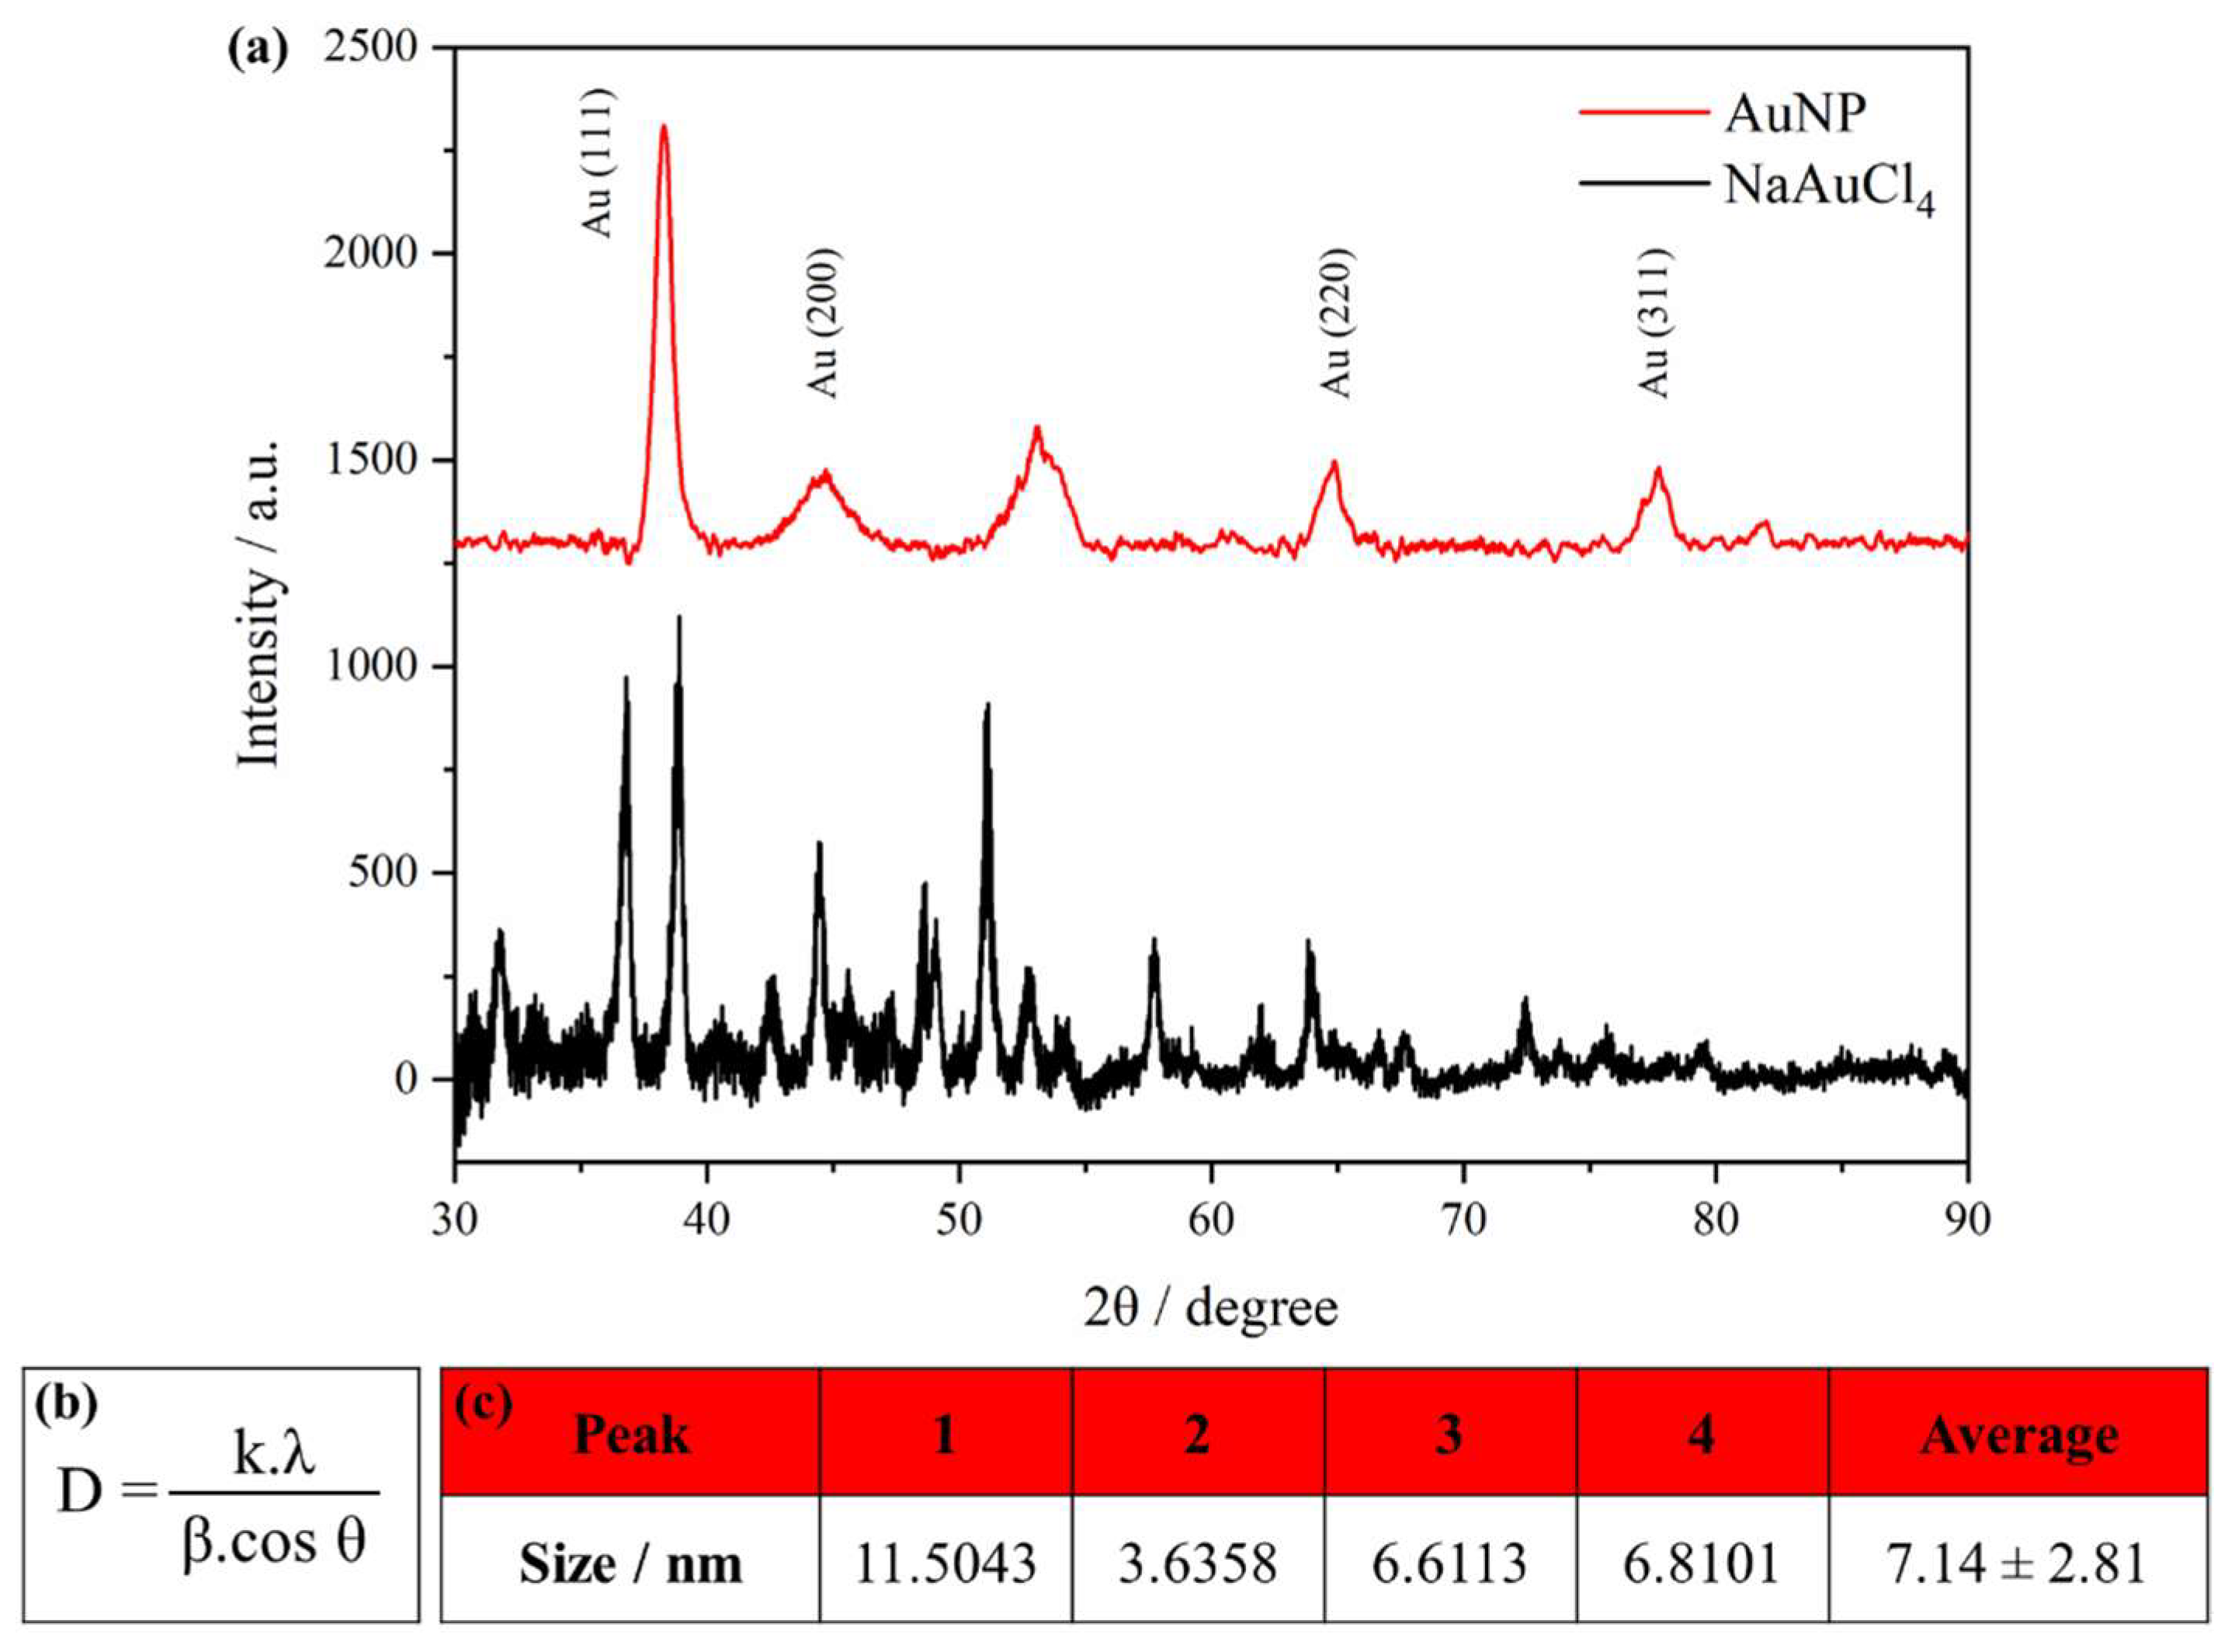
3.4. X-ray Diffraction Analysis

The crystallinity of the synthesized AuNPs was investigated by X-ray diffraction (XRD). The corresponding XRD patterns are shown in Figure 11a. The typical XRD pattern of NaAuCl4 exhibits several sharp, intense crystalline peaks [50,51]. As expected, the obtained diffractogram showed this behavior.
The AuNPs pattern exhibited four distinct peaks at 38.24°, 44.47°, 64.71°, and 77.79°. All the peaks correspond to the (111), (200), (220), and (311) lattice planes indexed to the face-centered cubic (FCC) structure [52,53]. There is another intense unassigned peak at 53.17° which might have resulted from some organic compounds in the nanoparticles during the synthesis, such as sodium citrate. However, the presence of these external peaks did not alter the Bragg reflection peaks of AuNPs [54,55]. The XRD results provided strong evidence for the synthesis of AuNPs from NaAuCl4.
The crystallite size of the AuNPs scan was measured by X-ray diffraction using the Scherrer equation, as shown in Figure 11b. Where D is the average crystallite size, λ is the X-ray wavelength (0.15406 nm), β is the line broadening at the full width of the peak (FWHM) in radians, and θ is the Bragg angle in degrees (half of 2θ). The Scherrer constant K depends on the width, shape, and size distribution of the crystal. Langford and Wilson discussed K as a function of crystal shape [56]. Therefore, several authors have used a K value of 0.94 for spherical crystals with cubic symmetry [57]. The crystallite size was calculated for all the four peaks, and the results are shown in Figure 11c. The average crystallite size obtained was 7.14 nm.
Generally, the peak width varies inversely with crystallite size. Therefore, when the crystallite size increased, the broadening of the diffraction peaks decreased. However, other parameters affected the results. The value obtained using the Scherrer equation is limited owing to the instrument, structural defects, relationship between the signal and sample, and noise. Therefore, it is difficult to distinguish the broadening due to the crystallite size from other factors [58,59]. The Scherrer equation provides the average nanoparticle size.

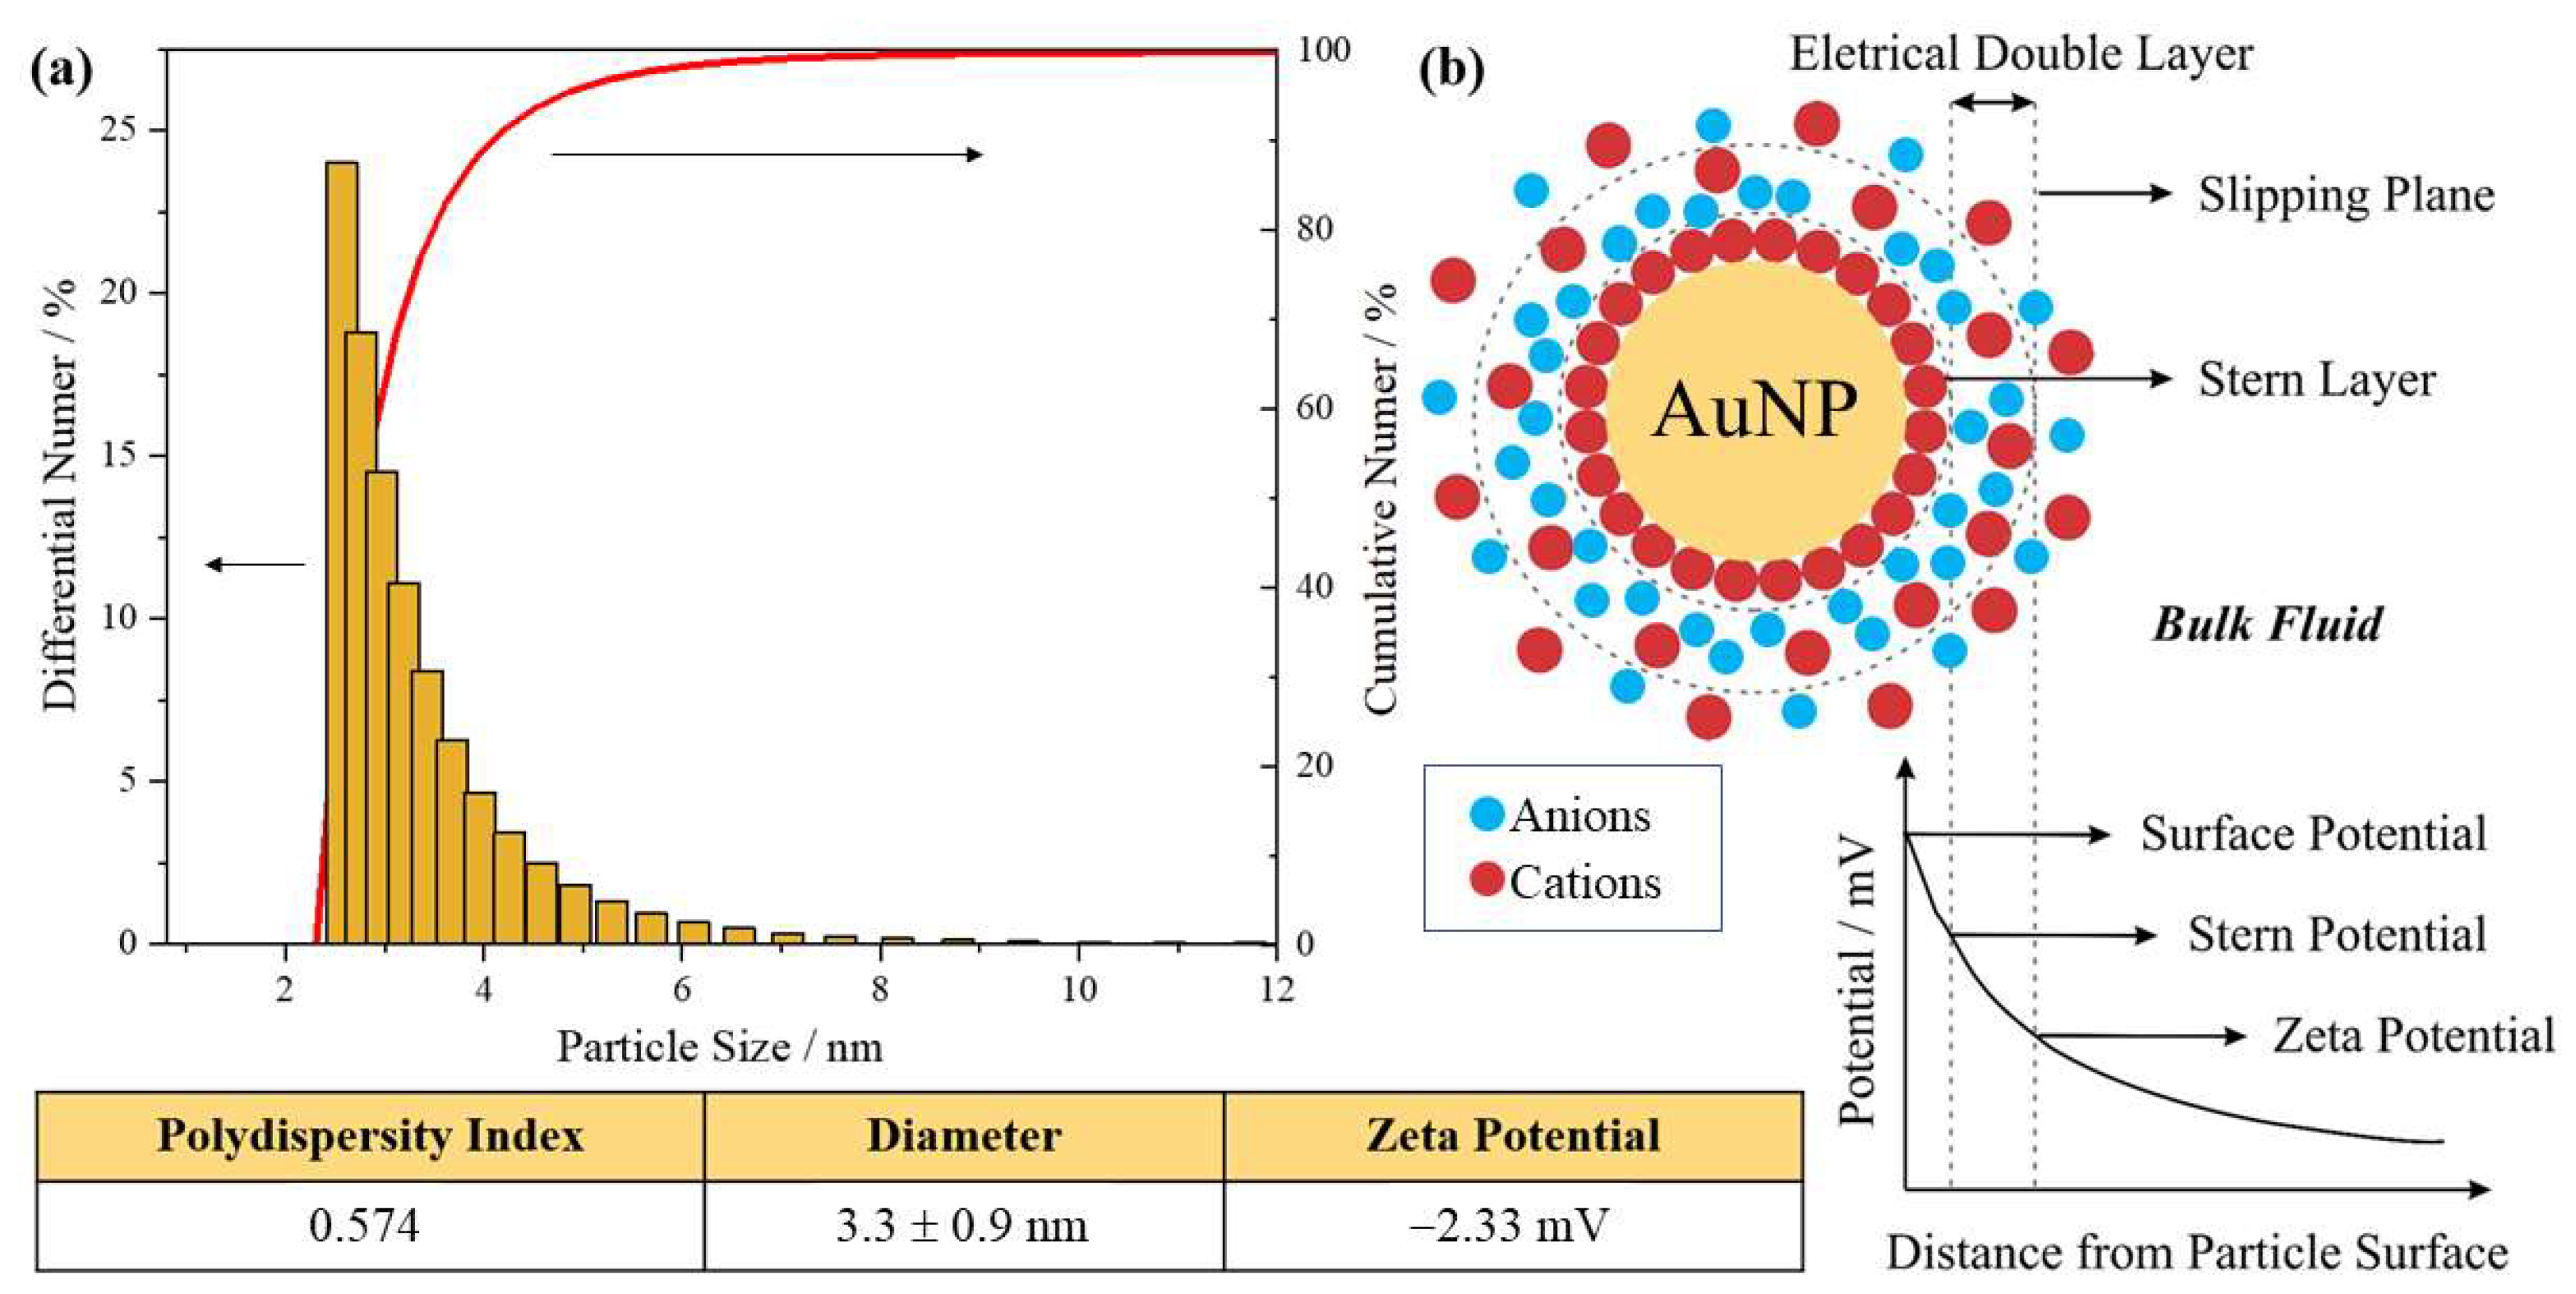
3.5. Dynamic Light Scattering

Dynamic light scattering (DLS) was used to evaluate the average size, size distribution, and possible aggregation of the synthesized AuNPs [60,61]. The zeta potentials were also measured. Figure 12a shows a graph of the particle size distribution (differential number % and cumulative number %). The values obtained from the zeta potential graphs are also presented. As observed from the particle size distribution graph, an average particle size of 3.3 ± 0.9 nm and polydispersity index (PDI) of 0.574 were obtained. Regarding the zeta potential, the value found was −2.33 mV.
As discussed previously, AuNPs are small gold particles with diameters of 1–100 nm. Particles smaller than 10 nm can be consider ultrasmall AuNPs; the particle size obtained was 3.3 ± 0.9 nm. Hence, according to DLS, synthesized AuNPs are ultra-small nanoparticles [62,63,64]. In addition, only one peak was observed in the graph, indicating that there were no particles of very different sizes in the colloid [65].
PDI describes the degree of “non-uniformity” of a distribution. This value was calculated based on the width of the size distribution. The range is from 0.0 (a perfect uniform sample) to 1.0 (highly polydisperse sample with multiple particle size) [60]. PDI values above 0.7 indicate a broad particle size distribution profile [66,67]. The obtained PDI of 0.574 had a wide particle size distribution and can be considered medium polydispersity, with an acceptable value indicating moderate homogeneity.
When particles are present in a liquid, an electrical double layer (EDL) is usually formed, consisting of ions in the liquid, as shown in Figure 12b. This model explains the operation of the electrical repulsive force. The EDL surface consists of two layers. The inner layer, known as the stern layer, is composed of oppositely charged particles that are coupled to the core of the central particle. The outer layer, called the diffuse layer, is where the ions diffuse more freely around the particle [68,69,70]. The double-layer properties directly influence the zeta potential of the system. The zeta potential, or ζ potential, is the potential measured at the slipping plane, that is, the difference between the EDL and the layer of dispersant around it [66,71].
The (ZP) is an important parameter that directly affects the stability of nanodispersions [72]. Hence, it can provide a good prediction of the dispersion stability. High potentials (negative or positive) are electrically stabilized; generally, repulsive forces exceed attractive forces, resulting in a stable system. Low potentials tend to coagulate or flocculate [65,73]. Usually, particles with ZP in the range of −30 mV to +30 mV are considered to be normally stable [66].
The ZP of the synthesized AuNPs obtained, −2.33 mV, was slightly small, resulting in a slightly negative surface charge. These results suggest that nanoparticles may be close to the agglomeration threshold. However, the average particle size was very small (3.3 ± 0.9 nm), indicating that large aggregations were not observed. In theory, the zeta potential is not related to the particle size. However, some authors observed a relationship between these two values. According to Nakutuka et al., the absolute negative value of the zeta potential of small particles is greater than that of large particles [74,75]. The smaller the nanoparticles, the easier it is to aggregate [76].
Other authors have also reported a correlation between these values [77,78]. Another important thing to understand is that the zeta potential is not a direct measurement of stability but a guide for the stability or instability of a system. Therefore, a value close to zero does not mean that the nanoparticle becomes unstable and aggregates or collapses [79].
In conclusion, the materials were characterized using UV-Vis, SEM, and AFM XRD and DLS. UV-Vis spectroscopy exhibited an absorption maximum at 520 nm. This peak is characteristic of AuNPs and is associated with the SPR absorption band, which is the oscillation of the free electrons.
The SEM images show cubic crystals of the NaAuCl4 sample. AuNPs exhibited a uniform distribution with some degree of aggregation, generating random aggregates of several sizes and irregular shapes. The clear shape of the obtained AuNPs could not be observed using SEM. Therefore, the synthesized AuNPs were characterized by AFM. Individual spherical nanoparticles and their aggregates were clearly observed, and the average diameter of the AuNPs was approximately 12–19 nm.
The typical XRD pattern of NaAuCl4 exhibited several sharp intense crystalline peaks. The AuNPs diffractogram exhibited four characteristic peaks associated with the (111), (200), (220), and (311) crystallographic planes, which were indexed to a face-centered cubic (FCC) structure. The average crystallite size was calculated using the Scherrer equation, resulting in 7.14 nm. The DLS presented an average particle size of 3.3 ± 0.9 nm and a polydispersity index (PDI) of 0.574. Regarding the zeta potential, the value found was −2.33 mV.
Comparing the results of each characterization, AFM presented a size of approximately 11–19 nm, while that in DLS was 3.3 nm. According to the Scherrer equation, the average crystallite size is 7.14 nm. Each technique has its own limitations, although all the techniques produce nanoparticles with diameters less than 19 nm.

4. Conclusions

Many articles have discussed the synthesis of AuNPs. However, this paper attempted to explain didactic step-by-step synthesis, the role of each reagent, and to show pictures of the entire process, including a well-explained mechanism and characterization study. In this study, AuNPs were synthesized using the Turkevich method. This process involves the reduction of NaAuCl4 using sodium citrate at high temperatures. A red suspension was obtained, indicating the formation of AuNPs.
Two main mechanisms were used to explain the synthesis of AuNPs via the Turkevich method. The first mechanism considers that a nanowire intermediary is formed during the synthesis that coalesces in a linear-like manner and then cleaves, leaving fragments of spherical particles.
However, another mechanism proposes that aggregate intermediates are not formed at any time during Turkevich synthesis. This includes the reduction of NaAuCl4 and the formation of small clusters that grow due to coalescence, forming citrate-capped gold nanoparticles.
AuNPs were synthesized using a simple and rapid method. The resulting spherical and small particles can be used for several applications. In a subsequent study, AuNPs will be used to modify electrochemical sensors.

Author Contributions

Conceptualization, A.E.F.O. and A.C.P.; methodology, A.E.F.O. and M.A.C.R.; investigation, A.E.F.O., M.A.C.R., and L.F.F.; writing—original draft preparation, A.E.F.O. and M.A.C.R.; writing—review and editing, A.C.P. and L.F.F.; supervision, project administration, and funding acquisition, A.C.P. All authors have read and agreed to the published version of the manuscript.

Funding

This research was funded by Fundação de Amparo a Pesquisa do Estado de Minas Gerais–FAPEMIG (CEX-APQ-0067-22), Conselho Nacional de Desenvolvimento Científico e Tecnológico-CNPq (40210/2021–0 and 305360/2022-1) and INCT-DATREM (465571/2014–0). This study was financed in part by the Coordenação de Aperfeiçoamento de Pessoal de Nível Superior, Brazil (CAPES), Finance Code 001.

Data Availability Statement

Data sharing not applicable.

Conflicts of Interest

The authors declare no conflict of interest.

References

  1. Heiligtag, F.J.; Niederberger, M. The fascinating world of nanoparticle research. Mater. Today 2013, 16, 262–271. [Google Scholar] [CrossRef]
  2. Edwards, P.P.; Thomas, J.M. Gold in a metallic divided state--from Faraday to present-day nanoscience. Angew. Chem. Int. Ed. Engl. 2007, 46, 5480–5486. [Google Scholar] [CrossRef] [PubMed]
  3. Tweney, R.D. Discovering Discovery: How Faraday Found the First Metallic Colloid. Perspect. Sci. 2006, 14, 97–121. [Google Scholar] [CrossRef]
  4. Yeh, Y.C.; Creran, B.; Rotello, V.M. Gold nanoparticles: Preparation, properties, and applications in bionanotechnology. Nanoscale 2012, 4, 1871–1880. [Google Scholar] [CrossRef] [PubMed]
  5. Swierczewska, M.; Lee, S.; Chen, X. The design and application of fluorophore-gold nanoparticle activatable probes. Phys. Chem. Chem. Phys. 2011, 13, 9929–9941. [Google Scholar] [CrossRef]
  6. Samanta, A.; Maiti, K.K.; Soh, K.-S.; Liao, X.; Vendrell, M.; Dinish, U.S.; Yun, S.-W.; Bhuvaneswari, R.; Kim, H.; Rautela, S.; et al. Ultrasensitive near-infrared Raman reporters for SERS-based in vivo cancer detection. Angew. Chem. Int. Edit. 2011, 50, 6089–6092. [Google Scholar] [CrossRef]
  7. Van de Broek, B.; Devoogdt, N.; D’Hollander, A.; Gijs, H.-L.; Jans, K.; Lagae, L.; Muyldermans, S.; Maes, G.; Borghs, G. Specific cell targeting with nanobody conjugated branched gold nanoparticles for photothermal therapy. ACS Nano 2011, 5, 4319–4328. [Google Scholar] [CrossRef]
  8. Liang, T.C.; Lin, H.C. Supramolecular assembly of H-bonded copolymers/complexes/nanocomposites and fluorescence quenching effects of surface-modified gold nanoparticles on fluorescent copolymers containing pyridyl H-acceptors and acid H-donors. J. Mater. Chem. 2009, 19, 4753–4763. [Google Scholar] [CrossRef]
  9. Lou, T.; Wang, Y.; Li, J.; Peng, H.; Xiong, H.; Chen, L. Rapid detection of melamine with 4-mercaptopyridine-modified gold nanoparticles by surface-enhanced Raman scattering. Anal. Bioanal. Chem. 2011, 401, 333–338. [Google Scholar] [CrossRef]
  10. Li, X.; Wang, J.; Sun, L.; Wang, Z. Gold nanoparticle-based colorimetric assay for selective detection of aluminium cation on living cellular surfaces. Chem. Commun. 2010, 46, 988–990. [Google Scholar] [CrossRef]
  11. Kumar, S.S.; Kwak, K.; Lee, D. Electrochemical sensing using quantum-sized gold nanoparticles. Anal. Chem. 2011, 83, 3244–3247. [Google Scholar] [CrossRef]
  12. Souza, C.D.; Nogueira, B.R.; Rostelato, M.E.C.M. Review of the methodologies used in the synthesis gold nanoparticles by chemical reduction. J. Alloys Compd. 2019, 798, 714–740. [Google Scholar] [CrossRef]
  13. Zhang, X.-F.; Liu, Z.-G.; Shen, W.; Gurunathan, S. Silver Nanoparticles: Synthesis, Characterization, Properties, Applications, and Therapeutic Approaches. Int. J. Mol. Sci. 2016, 17, 1534. [Google Scholar] [CrossRef] [PubMed]
  14. Lee, S.H.; Jun, B.-H. Silver Nanoparticles: Synthesis and Application for Nanomedicine. Int. J. Mol. Sci. 2019, 20, 865. [Google Scholar] [CrossRef]
  15. Chanda, N.; Kan, P.; Watkinson, L.D.; Shukla, R.; Zambre, A.; Carmack, T.L.; Engelbrecht, H.; Lever, J.R.; Katti, K.; Fent, G.M.; et al. Radioactive gold nanoparticles in cancer therapy: Therapeutic efficacy studies of GA-198AuNP nanoconstruct in prostate tumor-bearing mice. Nanomed. Nanotechnol. Biol. Med. 2010, 6, 201–209. [Google Scholar] [CrossRef] [PubMed]
  16. Dobrowolska, P.; Krajewska, A.; Gajda-Rczka, M.; Bartosewicz, B.; Nyga, P.; Jankiewicz, B. Application of Turkevich Method for Gold Nanoparticles Synthesis to Fabrication of SiO2@Au and TiO2@Au Core-Shell Nanostructures. Materials 2015, 8, 2849–2862. [Google Scholar] [CrossRef]
  17. Nirala, N.R.; Saxena, P.S.; Srivastava, A. Colorimetric detection of cholesterolbased on enzyme modified gold nanoparticles. Spectrochim. Acta Part A Mol. Biomol. Spectrosc. 2018, 190, 506–512. [Google Scholar] [CrossRef]
  18. Polte, J. Fundamental growth principles of colloidal metal nanoparticles—A new perspective. Cryst. Eng. Comm. 2015, 17, 6809–6830. [Google Scholar] [CrossRef]
  19. Shi, D.; Sheng, F.; Zhang, X.; Wang, G. Gold nanoparticle aggregation: Colori-metric detection of the interactions between avidin and biotin. Talanta 2018, 185, 106–112. [Google Scholar] [CrossRef]
  20. Tran, M.; DePenning, R.; Turner, M.; Padalkar, S. Effect of citrate ratio and temperature on gold nanoparticle size and morphology. Mater. Res. Express 2016, 3, 105027. [Google Scholar] [CrossRef]
  21. Montazer, M.; Harifi, T. Chapter 2—Nanofinishing: Fundamental principles. In The Textile Institute Book Series—Nanofinishing of Textile Materials; Woodhead Publishing: Sawston, UK, 2018; pp. 19–34. [Google Scholar]
  22. Polte, J.; Tuaev, X.; Wuithschick, M.; Fischer, A.; Thuenemann, A.F.; Rademann, K.; Karehnert, R.; Emmerling, F. Formation Mechanism of Colloidal Silver Nanoparticles: Analogies and Differences to the Growth of Gold Nanoparticles. ACS Nano 2012, 6, 5791–5802. [Google Scholar] [CrossRef]
  23. Zhao, L.; Jiang, D.; Cai, Y.; Ji, X.; Xie, R.; Yang, W. Tuning the Size of Gold Nanoparticles in the Citrate Reduction by Chloride Ions. Nanoscale 2012, 4, 5071–5076. [Google Scholar] [CrossRef] [PubMed]
  24. Pong, B.-K.; Elim, H.I.; Chong, J.-X.; Ji, W.; Trout, B.L.; Lee, J.-Y. New Insights on the Nanoparticle Growth Mechanism in the Citrate Reduction of Gold(III) Salt:? Formation of the Au Nanowire Intermediate and Its Nonlinear Optical Properties. J. Phys. Chem. C 2007, 111, 6281–6287. [Google Scholar] [CrossRef]
  25. Ji, X.; Song, X.; Li, J.; Bai, Y.; Yang, W.; Peng, X. Size Control of Gold Nanocrystals in Citrate Reduction: The Third Role of Citrate. J. Am. Chem. Soc. 2007, 129, 13939–13948. [Google Scholar] [CrossRef] [PubMed]
  26. Polte, J.; Erler, R.; Thünemann, A.F.; Sokolov, S.; Ahner, T.T.; Rademann, K.; Kraehnert, R. Nucleation and Growth of Gold Nanoparticles Studied via in situ Small Angle X-ray Scattering at Millisecond Time Resolution. ACS Nano 2012, 4, 1076–1082. [Google Scholar] [CrossRef] [PubMed]
  27. Wuithschick, M.; Birnbaum, A.; Witte, S.; Sztucki, M.; Vainio, U.; Pinna, N.; Polte, J. Turkevich in New Robes: Key Questions Answered for the Most Common Gold Nanoparticle Synthesis. ACS Nano 2015, 9, 7052–7071. [Google Scholar] [CrossRef]
  28. Badilescu, S.; Packirisamy, M. Microfluidics-Nano-Integration for Synthesis and Sensing. Polymers 2012, 4, 1278–1310. [Google Scholar] [CrossRef]
  29. Gao, Y.; Torrente-Murciano, L. Mechanistic insights of the reduction of gold salts in the Turkevich protocol. Nanoscale 2020, 12, 2740–2751. [Google Scholar] [CrossRef]
  30. Heinzerling, P.; Oetken, M. Nanochemistry—A Split between 18th Century and Modern Times. World J. Chem. Educ. 2018, 6, 1–7. [Google Scholar] [CrossRef]
  31. Leng, W.; Pati, P.; Vikesland, J. Room temperature seed mediated growth of gold nanoparticles: Mechanistic investigations and life cycle assessment. Environ. Sci. Nano 2015, 2, 440–453. [Google Scholar] [CrossRef]
  32. Kumar, S.; Gandhi, K.S.; Kumar, R. Modeling of Formation of Gold Nanoparticles by Citrate Method. Ind. Eng. Chem. Res. 2007, 46, 3128–3136. [Google Scholar] [CrossRef]
  33. Jana, J.; Ganguly, M.; Pal, T. Enlightening surface plasmon resonance effect of metal nanoparticles for practical spectroscopic application. RSC Adv. 2016, 6, 86174–86211. [Google Scholar] [CrossRef]
  34. Sadrolhosseini, A.R.; Noor, A.S.M.; Moksin, M.M. Application of Surface Plasmon Resonance Based on a Metal Nanoparticle. In Plasmonics—Principles and Applications; IntechOpen: London, UK, 2012; pp. 253–282. [Google Scholar]
  35. Umashankari, J.; Inbakandan, D.; Ajithkumar, T.; Balasubramanian, T. Mangrove plant, Rhizophora mucronata (Lamk, 1804) mediated one pot green synthesis of silver nanoparticles and its antibacterial activity against aquatic pathogens. Saline Syst. 2012, 8, 11–19. [Google Scholar] [CrossRef] [PubMed]
  36. Sevenler, D.; Ünlü, N.L.; Ünlü, M.S. Nanoparticle Biosensing with Interferometric Reflectance Imaging. Nanobiosens. Nanobioanal. 2015, 1, 81–95. [Google Scholar]
  37. Waghmode, S.; Chavan, P.; Kalyankar, V.; Dagade, S. Synthesis of Silver Nanoparticles Using Triticum aestivum and its Effect on Peroxide Catalytic Activity and Toxicology. J. Chem. 2013, 2013, 265864. [Google Scholar] [CrossRef]
  38. Thomas, K.G. Surface Plasmon Resonances in Nanostructured Materials. Nanomater. Chem. 2007, 6, 185–218. [Google Scholar]
  39. Pereira-da-Silva, M.A.; Ferri, F.A. Scanning Electron Microscopy. Nanocharact. Tech. 2017, 1, 1–35. [Google Scholar]
  40. Ali, M.A.; Ali, M.F.; Ciliberto, E.; Greco, E.; Mello, D.; Viscuso, E. A new method for the preparation of gelatin nanolayer: A possible approach to the in situ consolidation of damaged gelatin photographic emulsions. Appl. Phys. A 2016, 122, 552. [Google Scholar] [CrossRef]
  41. Chen, Y.; Gu, X.; Nie, C.-G.; Jiang, Z.-Y.; Xie, Z.-X.; Lin, C.-J. Shape controlled growth of gold nanoparticles by a solution synthesis. Chem. Commun. 2005, 33, 4181–4183. [Google Scholar] [CrossRef]
  42. Benson, J.; Fung, C.M.; Lloyd, J.S.; Deganello, D.; Smith, N.A.; Teng, K.S. Direct patterning of gold nanoparticles using flexographic printing for biosensing applications. Nanoscale Res. Lett. 2015, 10, 127. [Google Scholar] [CrossRef]
  43. Devi, R.A.; Francis, A.P.; Devasena, T. Green-synthesized gold nanocubes functionalized with bisdemethoxycurcumin analog as an ideal anticancer candidate. Green Process. Synth. 2014, 3, 47–61. [Google Scholar] [CrossRef]
  44. Çulha, M.; Kahraman, M.; Tokman, N.; Türko?lu, G. Surface-Enhanced Raman Scattering on Aggregates of Silver Nanoparticles with Definite Size. J. Phys. Chem. C 2008, 112, 10338–10343. [Google Scholar] [CrossRef]
  45. Rajeshkumar, S.; Malarkodi, C. In Vitro Antibacterial Activity and Mechanism of Silver Nanoparticles against Foodborne Pathogens. Bioinorg. Chem. Appl. 2014, 2014, 581890. [Google Scholar] [CrossRef]
  46. Platnich, C.M.; Banerjee, A.; Kollath, V.O.; Karan, K.; Trudel, S. Thiol-ene click microcontact printing of gold nanoparticles onto silicon surfaces. Can. J. Chem. 2018, 96, 190–195. [Google Scholar] [CrossRef]
  47. Novotna, V.; Horak, J.; Konecny, M.; Hegrova, V.; Novotny, O.; Novacek, Z.; Neuman, J. AFM-in-SEM as a Tool for Comprehensive Sample Surface Analysis. Microsc. Today 2020, 28, 38–46. [Google Scholar] [CrossRef]
  48. Brobbey, K.J.; Haapanen, J.; Mäkelä, J.M.; Gunell, M.; Eerola, E.; Rosqvist, E.; Toivakka, M. Characterization of flame coated nanoparticle surfaces with antibacterial properties and the heat-induced embedding in thermoplastic-coated paper. SN Appl. Sci. 2018, 1, 65–79. [Google Scholar] [CrossRef]
  49. Darwich, S.; Mougin, K.; Rao, A.; Gnecco, E.; Jayaraman, S.; Haidara, H. Manipulation of gold colloidal nanoparticles with atomic force microscopy in dynamic mode: Influence of particle-substrate chemistry and morphology, and of operating conditions. Beilstein J. Nanotechnol. 2011, 2, 85–98. [Google Scholar] [CrossRef]
  50. Novais, A.L.F.; Lima, A.P.P.; Santos, A.R.S.; Bezerra, R.R.R.; Ferreira, F.C.L.; Souza, D.N. Caracterização estrutural e morfológica de compostos químicos para produção vítrea. Sci. Plena 2019, 15, 074810. [Google Scholar] [CrossRef]
  51. Aziz, S.B.; Abdulwahid, R.T.; Rasheed, M.A.; Abdullah, O.G.; Ahmed, H.M. Polymer Blending as a Novel Approach for Tuning the SPR Peaks of Silver Nanoparticles. Polymers 2017, 9, 486. [Google Scholar] [CrossRef] [PubMed]
  52. Milaneze, B.A.; Oliveira, J.P.; Augusto, I.; Keijok, W.J.; Côrrea, A.S.; Ferreira, D.M.; Guimarães, M.C.C. Facile Synthesis of Monodisperse Gold Nanocrystals Using Virola oleifera. Nanoscale Res. Lett. 2016, 11, 465–472. [Google Scholar] [CrossRef]
  53. Krishnamurthy, S.; Esterle, A.; Sharma, N.C.; Sahi, S.V. Yucca-derived synthesis of gold nanomaterial and their catalytic potential. Nanoscale Res. Lett. 2014, 9, 627–637. [Google Scholar] [CrossRef] [PubMed]
  54. Nejad, M.S.; Bonjar, G.H.S.; Khaleghi, N. Biosynthesis of gold nanoparticles using streptomyces fulvissimus isolate. Nanomed. J. 2015, 2, 153–159. [Google Scholar]
  55. Singh, M.; Kalaivani, R.; Manikandan, S.; Sangeetha, N.; Kumaraguru, A.K. Facile green synthesis of variable metallic gold nanoparticle using Padina gymnospora, a brown marine macroalga. Appl. Nanosci. 2012, 3, 145–151. [Google Scholar] [CrossRef]
  56. Langford, J.I.; Wilson, A.J.C. Scherrer after sixty years: A survey and some new results in the determination of crystallite size. J. Appl. Crystallogr. 1978, 11, 102–113. [Google Scholar] [CrossRef]
  57. Ingham, B.; Toney, M.F. X-ray diffraction for characterizing metallic films. In Metallic Films for Electronic, Optical and Magnetic Applications; Woodhead Publishing: Sawston, UK, 2014; Volume 1, pp. 3–38. [Google Scholar]
  58. Miranda, M.A.R.; Sasaki, J.M. The limit of application of the Scherrer equation. Acta Crystallogr. Sect. A Found. Adv. 2018, 74, 54–65. [Google Scholar] [CrossRef]
  59. Rabiei, M.; Palevicius, A.; Monshi, A.; Nasiri, S.; Vilkauskas, A.; Janusas, G. Comparing Methods for Calculating Nano Crystal Size of Natural Hydroxyapatite Using X-Ray Diffraction. Nanomaterials 2020, 10, 1627. [Google Scholar] [CrossRef]
  60. Danaei, M.; Dehghankhold, M.; Ataei, S.; Hasanzadeh Davarani, F.; Javanmard, R.; Dokhani, A.; Mozafari, M. Impact of Particle Size and Polydispersity Index on the Clinical Applications of Lipidic Nanocarrier Systems. Pharmaceutics 2018, 10, 57. [Google Scholar] [CrossRef] [PubMed]
  61. Gao, Y.; Anand, A.V.M.; Ramachandran, V.; Karthikkumar, V.; Shalini, V.; Vijayalakshmi, S.; Ernest, D. Biofabrication of Zinc Oxide Nanoparticles from Aspergillus niger, Their Antioxidant, Antimicrobial and Anticancer Activity. J. Clust. Sci. 2019, 30, 937–946. [Google Scholar] [CrossRef]
  62. Kathiravan, G.; Yamini, K.R.; Rajagopal, K.; Sambandam, A. Phytogenic Synthesis of Nano Silver from Madagascar Periwinkle Extracts and Their Angiogenic Activities in Zebrafish Embryos (ZFE). Nanosci. Nanotechnol. Lett. 2020, 12, 79–87. [Google Scholar] [CrossRef]
  63. Gontijo, L.A.P.; Raphael, E.; Ferrari, D.P.S.; Ferrai, J.L.; Lyon, J.P.; Schiavon, M.A. pH effect on the synthesis of different size silver nanoparticles evaluated by DLS and their size-dependent antimicrobial activity. Matéria 2020, 25, 4. [Google Scholar] [CrossRef]
  64. Zarschler, K.; Rocks, L.; Licciardello, N.; Boselli, L.; Polo, E.; Garcia, K.P.; Dawson, K.A. Ultrasmall inorganic nanoparticles: State-of-the-art and perspectives for biomedical applications. Nanomed. Nanotechnol. Biol. Med. 2016, 12, 1663–1701. [Google Scholar] [CrossRef]
  65. Banerjee, S.; Saha, A.K.; Show, B.; Ganguly, J.; Bhattacharyay, R.; Datta, S.K.; Mukherjee, N. A regular rippled pattern formed by the molecular self-organization of polyvinylpyrrolidone encapsulated Ag nanoparticles: A high transmissive coating for efficiency enhancement of c-Si solar cells. RSC Adv. 2015, 5, 5667–5673. [Google Scholar] [CrossRef]
  66. Joseph, E.; Singhvi, G. Multifunctional nanocrystals for cancer therapy: A potential nanocarrier. Nanomater. Drug Deliv. Ther. 2019, 1, 91–116. [Google Scholar]
  67. Mudalige, T.; Qu, H.; Van Haute, D.; Ansar, S.M.; Paredes, A.; Ingle, T. Characterization of Nanomaterials. Nanomater. Food Appl. 2019, 1, 313–353. [Google Scholar]
  68. Nisticò, R.; Cesano, F.; Garello, F. Magnetic Materials and Systems: Domain Structure Visualization and Other Characterization Techniques for the Application in the Materials Science and Biomedicine. Inorganics 2020, 8, 6. [Google Scholar] [CrossRef]
  69. Park, S.-J.; Seo, M.-K. Intermolecular Force. Interface Sci. Technol. 2011, 1, 1–57. [Google Scholar]
  70. Carvalho, P.M.; Felício, M.R.; Santos, N.C.; Gonçalves, S.; Domingues, M.M. Application of Light Scattering Techniques to Nanoparticle Characterization and Development. Front. Chem. 2018, 6, 237. [Google Scholar] [CrossRef] [PubMed]
  71. Adegoke, O.; Park, E.Y. Gold Nanoparticle-Quantum Dot Fluorescent Nanohybrid: Application for Localized Surface Plasmon Resonance-induced Molecular Beacon Ultrasensitive DNA Detection. Nanoscale Res. Lett. 2016, 11, 523. [Google Scholar] [CrossRef] [PubMed]
  72. Ding, Z.; Jiang, Y.; Liu, X. Nanemulsions-Based Drug Delivery for Brain Tumors. Nanotechnol.-Based Target. Drug Deliv. Syst. Brain Tumors 2018, 1, 327–358. [Google Scholar]
  73. Lu, G.W.; Gao, P. Emulsions and Microemulsions for Topical and Transdermal Drug Delivery. In Handbook of Non-Invasive Drug Delivery Systems; William Andrew Publishing: Norwich, NY, USA, 2010; Volume 1, pp. 59–94. [Google Scholar]
  74. Nakatuka, Y.; Yoshida, H.; Fukui, K.; Matuzawa, M. The effect of particle size distribution on effective zeta-potential by use of the sedimentation method. Adv. Powder Technol. 2015, 26, 650–656. [Google Scholar] [CrossRef]
  75. Zuki, N.M.; Ismail, N.; Omar, F.M. Evaluation of zeta potential and particle size measurements of multiple coagulants in semiconductor wastewater. In Proceedings of the 6th International Conference on Environment (ICENV2018), Penang, Malaysia, 11–13 December 2018; Volume 1, pp. 1–10. [Google Scholar]
  76. Wang, N.; Cheng, X.; Li, N.; Wang, H.; Chen, H. Nanocarriers and Their Loading Strategies. Adv. Healthc. Mater. 2018, 1, 1801002. [Google Scholar] [CrossRef] [PubMed]
  77. Kazi, S.N.; Badarudin, A.; Zubir, M.N.M.; Ming, H.N.; Misran, M.; Sadeghinezhad, E.; Syuhada, N.I. Investigation on the use of graphene oxide as novel surfactant to stabilize weakly charged graphene nanoplatelets. Nanoscale Res. Lett. 2015, 10, 212. [Google Scholar] [CrossRef] [PubMed]
  78. Choudhari, Y.M.; Kulthe, S.; Inamdar, N.; Shirolikar, S. Combination of Low and High Molecular Weight Chitosans for the Preparation of Nanoparticles: A Novel Approach Towards Sustained Drug Delivery. J. Nanopharm. Drug Deliv. 2014, 1, 376–387. [Google Scholar] [CrossRef]
  79. Dietrich, A.; Neubrand, A. Effects of Particle Size and Molecular Weight of Polyethylenimine on Properties of Nanoparticulate Silicon Dispersions. J. Am. Ceram. Soc. 2001, 84, 806–812. [Google Scholar] [CrossRef]
Figure 1. Schematic diagram showing the steps for gold nanoparticles synthesis.
Analytica 04 00020 g001
Figure 2. (a) Synthesis of gold nanoparticle using Turkevich method during the process; (b) stock solution of NaAuCl4 and the synthesized AuNPs after reach room temperature.
Analytica 04 00020 g002
Figure 3. Schematic representation of synthesis of gold nanoparticle forming an intermediary during the process.
Analytica 04 00020 g003
Figure 4. Scheme of AuNPs synthesis without formation of an intermediary during the process.
Analytica 04 00020 g004
Figure 5. Accepted reduction mechanism of AuCl4 using citrate in two step redox reaction.
Analytica 04 00020 g005
Figure 6. Decomposition of acetone dicarboxylate (ACDC2−) and reduction of Au3+ by acetone.
Analytica 04 00020 g006
Figure 7. UV-vis absorption spectrum of sodium tetrachloroaurate and gold nanoparticles.
Analytica 04 00020 g007
Figure 8. Schematic illustration of surface plasmon resonance (SPR) in gold nanoparticles.
Analytica 04 00020 g008
Figure 9. SEM images at 2000× and 30,000× magnification of NaAuCl4 and AuNPs samples.
Analytica 04 00020 g009
Figure 10. AFM phase images of AuNPs on a bare graphite substrate. The circled regions exhibited gold nanoparticles and their diameter (particles around 11–19 nm).
Analytica 04 00020 g010
Figure 11. (a) XRD pattern of gold nanoparticle and sodium tetrachloroaurate; (b) Scherrer equation; (c) crystallite size obtained from each peak.
Analytica 04 00020 g011
Figure 12. (a) DLS analysis of particle size distribution and zeta potential; (b) schematic representation of the double layer that surrounds the nanoparticle in aqueous medium.
Analytica 04 00020 g012
Disclaimer/Publisher’s Note: The statements, opinions and data contained in all publications are solely those of the individual author(s) and contributor(s) and not of MDPI and/or the editor(s). MDPI and/or the editor(s) disclaim responsibility for any injury to people or property resulting from any ideas, methods, instructions or products referred to in the content.

