Article

Evaluation of Sweat-Sampling Procedures for Human Stress-Biomarker Detection

by
Maria João Nunes
1,*,
José J. G. Moura
1,
João Paulo Noronha
1,
Luís Cobra Branco
1,
Alejandro Samhan-Arias
1,2,
João P. Sousa
3,
Carlos Rouco
3 and
Cristina M. Cordas
1,*
1
LAQV-REQUIMTE, Department of Chemistry, NOVA School of Science and Technology, Universidade Nova de Lisboa, 2829-516 Caparica, Portugal
2
Departamento de Bioquímica, Instituto de Investigaciones Biomédicas ‘Alberto Sols’ (CSIC-UAM), Universidad Autónoma de Madrid, C/Arturo Duperier 4, 28029 Madrid, Spain
3
CINAMIL, Academia Militar, Rua Gomes Freire, 1150-244 Lisboa, Portugal
*
Authors to whom correspondence should be addressed.
Analytica 2022, 3(2), 178-194; https://doi.org/10.3390/analytica3020013
Submission received: 4 March 2022 / Revised: 31 March 2022 / Accepted: 8 April 2022 / Published: 16 April 2022

Abstract

:
Sweat is a potential biological fluid for the non-invasive analytical assessment of diverse molecules, including biomarkers. Notwithstanding, the sampling methodology is critical, and it must be assessed prior to using sweat for clinical diagnosis. In the current work, the analytical methodology was further developed taking into account the sampling step, in view of the identification and level variations of sweat components that have potential to be stress biomarkers using separation by liquid chromatography and detection by tandem mass spectrometry, in order to attain a screening profile of 26 molecules in just one stage. As such, the molecule identification was used as a test for the evaluation of the sampling procedures, including the location on the body, using patches for long-term sampling and vials for direct sampling, through a qualitative approach. From this evaluation it was possible to conclude that the sampling may be performed on the chest or back skin. Additionally, possible interference was evaluated. The long-term sampling with patches can be used under both rest and exercise conditions with variation of the detected molecule’s levels. The direct sampling, using vials, has the advantage of not having interferences but the disadvantage of only being effective after exercise in order to have enough sample for sweat analysis.

Graphical Abstract

1. Introduction

In humans, the two major systems that respond to stress comprise the hypothalamic–pituitary–adrenal axis and the autonomic nervous system [1]. These two systems synchronise many other physiological responses to a stressor, including the immune and cardiovascular systems’ reaction. Stress is an inevitable response in mammals to maintain their homeostasis [1,2], producing powerful effects on the brain and body [3]. Metabolic homeostasis is linked to immune and stress responses, implying that dysregulation will produce variations, contributing to potential diseases [4]. Stress has already been identified as a significant factor that affects health, the economy, and quality of life [5,6,7,8], being considered as a decisive problem [9].
Monitoring stress levels is considered determinant for many groups, including those in stressful occupations (armed-forces personnel, police, firefighters, emergency personnel), but also athletes and other individuals with particular medical conditions or the will to improve their overall health status [10]. Physiological and psychological consequences due to exposure to acute or chronic stress [11] can be vast and detrimental, manifesting in various physical and chemical ways [12]. Some of the harmful effects due to prolonged periods of stress are depression [13], neurological disorder or breakdown, cardiothoracic disease [14], weight variations (loss or gain) [15], and hyperglycaemia [16,17].
Molecules identified as markers of different biological processes that can be monitored are designated as biomarkers [2,18,19,20,21,22,23,24]. Currently, the most common human biofluids for metabolomics analysis are blood and urine [25,26]. Blood analysis is well established and highly standardised, and blood is the standard biofluid when it comes to physiologic feedback analysis [27]. Alternative biofluids such as sweat, which can be obtained non-invasively and present a simpler composition than serum/plasma or urine, may be advantageous for novel analytical procedures [28,29]. However, sweat, as a biofluid for clinical use, is still under discussion [27] and, so far, approved clinical protocols for sweat analysis have only been determined for cystic fibrosis diagnosis [30,31,32]. One of the most critical points in discussion is the sampling step, since sweat composition presents considerable variability due to evaporation, contamination on the skin surface, and other factors that challenge the metabolite quantification. Additionally, sweat samples are usually attained in small volumes and sweat glands are not homogeneously distributed along the body surface, implying that the specific localisation of sampling must be carefully chosen [27,33,34]. As such, the sweat collection is an analytical limiting step considering the possible variability, which was already mentioned, as well as the particular physiological effects and sweat rate [26,27,30,31]. Several sampling devices such as wearable sensors, i.e., electrochemical, and the Macroduct® Sweat Analysis System with a sweat inducer and a sweat collector have been developed in recent years [26,35], but these are still under study [32,35,36,37,38,39,40,41,42] and there are not yet accepted standard protocols. Besides, the majority of sweat analyses are performed with fresh sweat (direct sweat measurement without storage) [31,43,44,45,46], and standard procedures for storage are still needed [47,48,49]. Sweat has mainly been sampled on patches of filter paper, cotton, gauze or towel [50]. Additionally, these methods of sampling require several hours to reach enough sweat volume for analysis [45,46,51]. Other alternatives involve the use of commercial devices requiring the use of chemical sweat inductors [31,52,53], using pilocarpine [54], such as the example of Macroduct®, based on iontophoresis, which is used for cystic fibrosis diagnostic [36,39,55,56]. The main restriction to the use of these devices is the possible irritative effects in the patients [30,45,57]; moreover, the pilocarpine induction itself is an invasive procedure. The localised sweat-sampling methods may be used depending on the analytical fit-for-purpose [58], but different sampling protocols would be another source of undesirable variability in sweat rate and sweat-electrolyte concentrations. The above referred methods using patches have the advantage of being helpful for long-term sampling without environmental interference on the skin. The main disadvantage of patch collection is that the lack of ventilation caused by an occlusive covering increases moisture accumulation on the skin, thereby leading to progressive blocking of sweat ducts and sweat suppression, i.e., hidromeiosis. However, hidromeiosis may be minimised with the decrease in sampling time or the use of patches made from a material with a high absorbent capacity [50]. The choice of a direct-collection system can modify the local environment and consequently alter the flow rate of sweat onto the skin surface [59]. In summary, of these sampling protocols it may be said that if the intention is to use a regional absorbent-patch method, in order to minimise the hidromeiosis, a patch with high absorbent capacity should be chosen and the sampling time should be minimised. Instead, if direct collection is chosen, it should be considered that the result may be affected by the local environment.
In previous studies, sweat sampling was performed at the end of physical training from volunteers, after a university football match, directly, and with sterile glass vials [60], in order to identify a range of molecules that could be used as potential biomarkers, using a pool sample and chromatography with tandem-mass-spectrometry (LC-MS/MS) detection analysis. In the current work, the main goal was to evaluate the non-invasive sweat-sampling procedures, by using the previously identified molecules associated with physical training. Thus, different sampling protocols were chosen with the aim of performing a qualitative analysis of selected molecules by LC-MS/MS, using the previous methodology of one-stage analysis [60]. The current qualitative analysis was used to confirm the possibility of monitoring variations in the molecule’s levels between rest and exercise-stress conditions. Sampling was performed during both rest and exercise, at different skin locations, using patches, and, immediately after exercise, using sterile glass vials, with the aim of contributing to the development of sweat analysis for clinical diagnosis.

2. Materials and Methods

2.1. Chemicals and Reagents

2.1.1. Analytical Standards

All chemicals and reagents were of commercial origin. Analytical standard biomarkers tested:
  • (−)-Epinephrine (E, ≥99%, Sigma®, St. Louis, Missouri, USA), (−)-Norepinephrine (NE, ≥98%, Sigma®, USA), L-Phenylalanine (Phe, ≥99%, BioUltra, Sigma®, Tokyo, Japan), L-Tryptophan (Tryp, ≥98% HPLC, Sigma-Aldrich®, Shanghai, China), L-Tyrosine (Tyr, ≥98% HPLC, Sigma-Aldrich®, Darmstadt, Germany), L-Histidine.HCl (His, ≥98% HPLC, Sigma®, St. Louis, Missouri, USA), L-Lysine (Lys, ≥95% HPLC, analytical standard, Sigma-Aldrich®, Auckland, Switzerland) and L-Ascorbic acid (Asc, PHR, certified reference material, Sigma-Aldrich®, St. Louis, Missouri, USA).
  • Analytical solvents, methanol and acetonitrile solvents for UHPLC-MS grade and Formic acid for LC-MS grade, were supplied from Carlo Erba® Reagents S.A.S, Wadreuil, France.
  • Ultrapure water was supplied from a Milli-Q®, USA ultrapure water system equipped at the end of assembly line with a Milli-Q® Reference and a Q-POD® element.

2.1.2. Standard Solution Preparation

Stock solutions were prepared to a concentration of 2 mg mL−1 in methanol and stored at −20 °C before use. Diluted solutions of 1 ng mL−1 in methanol were prepared daily.

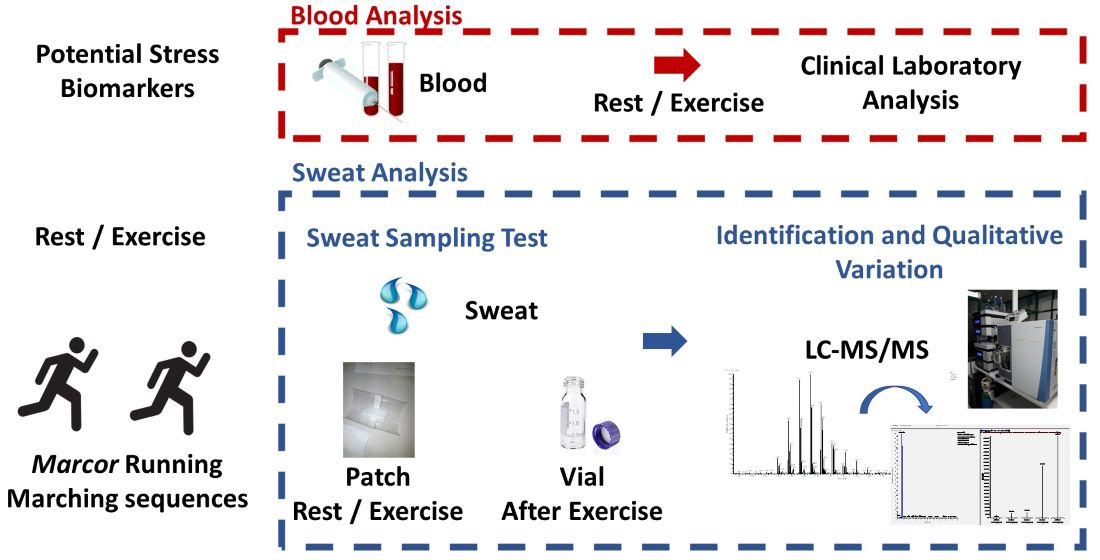
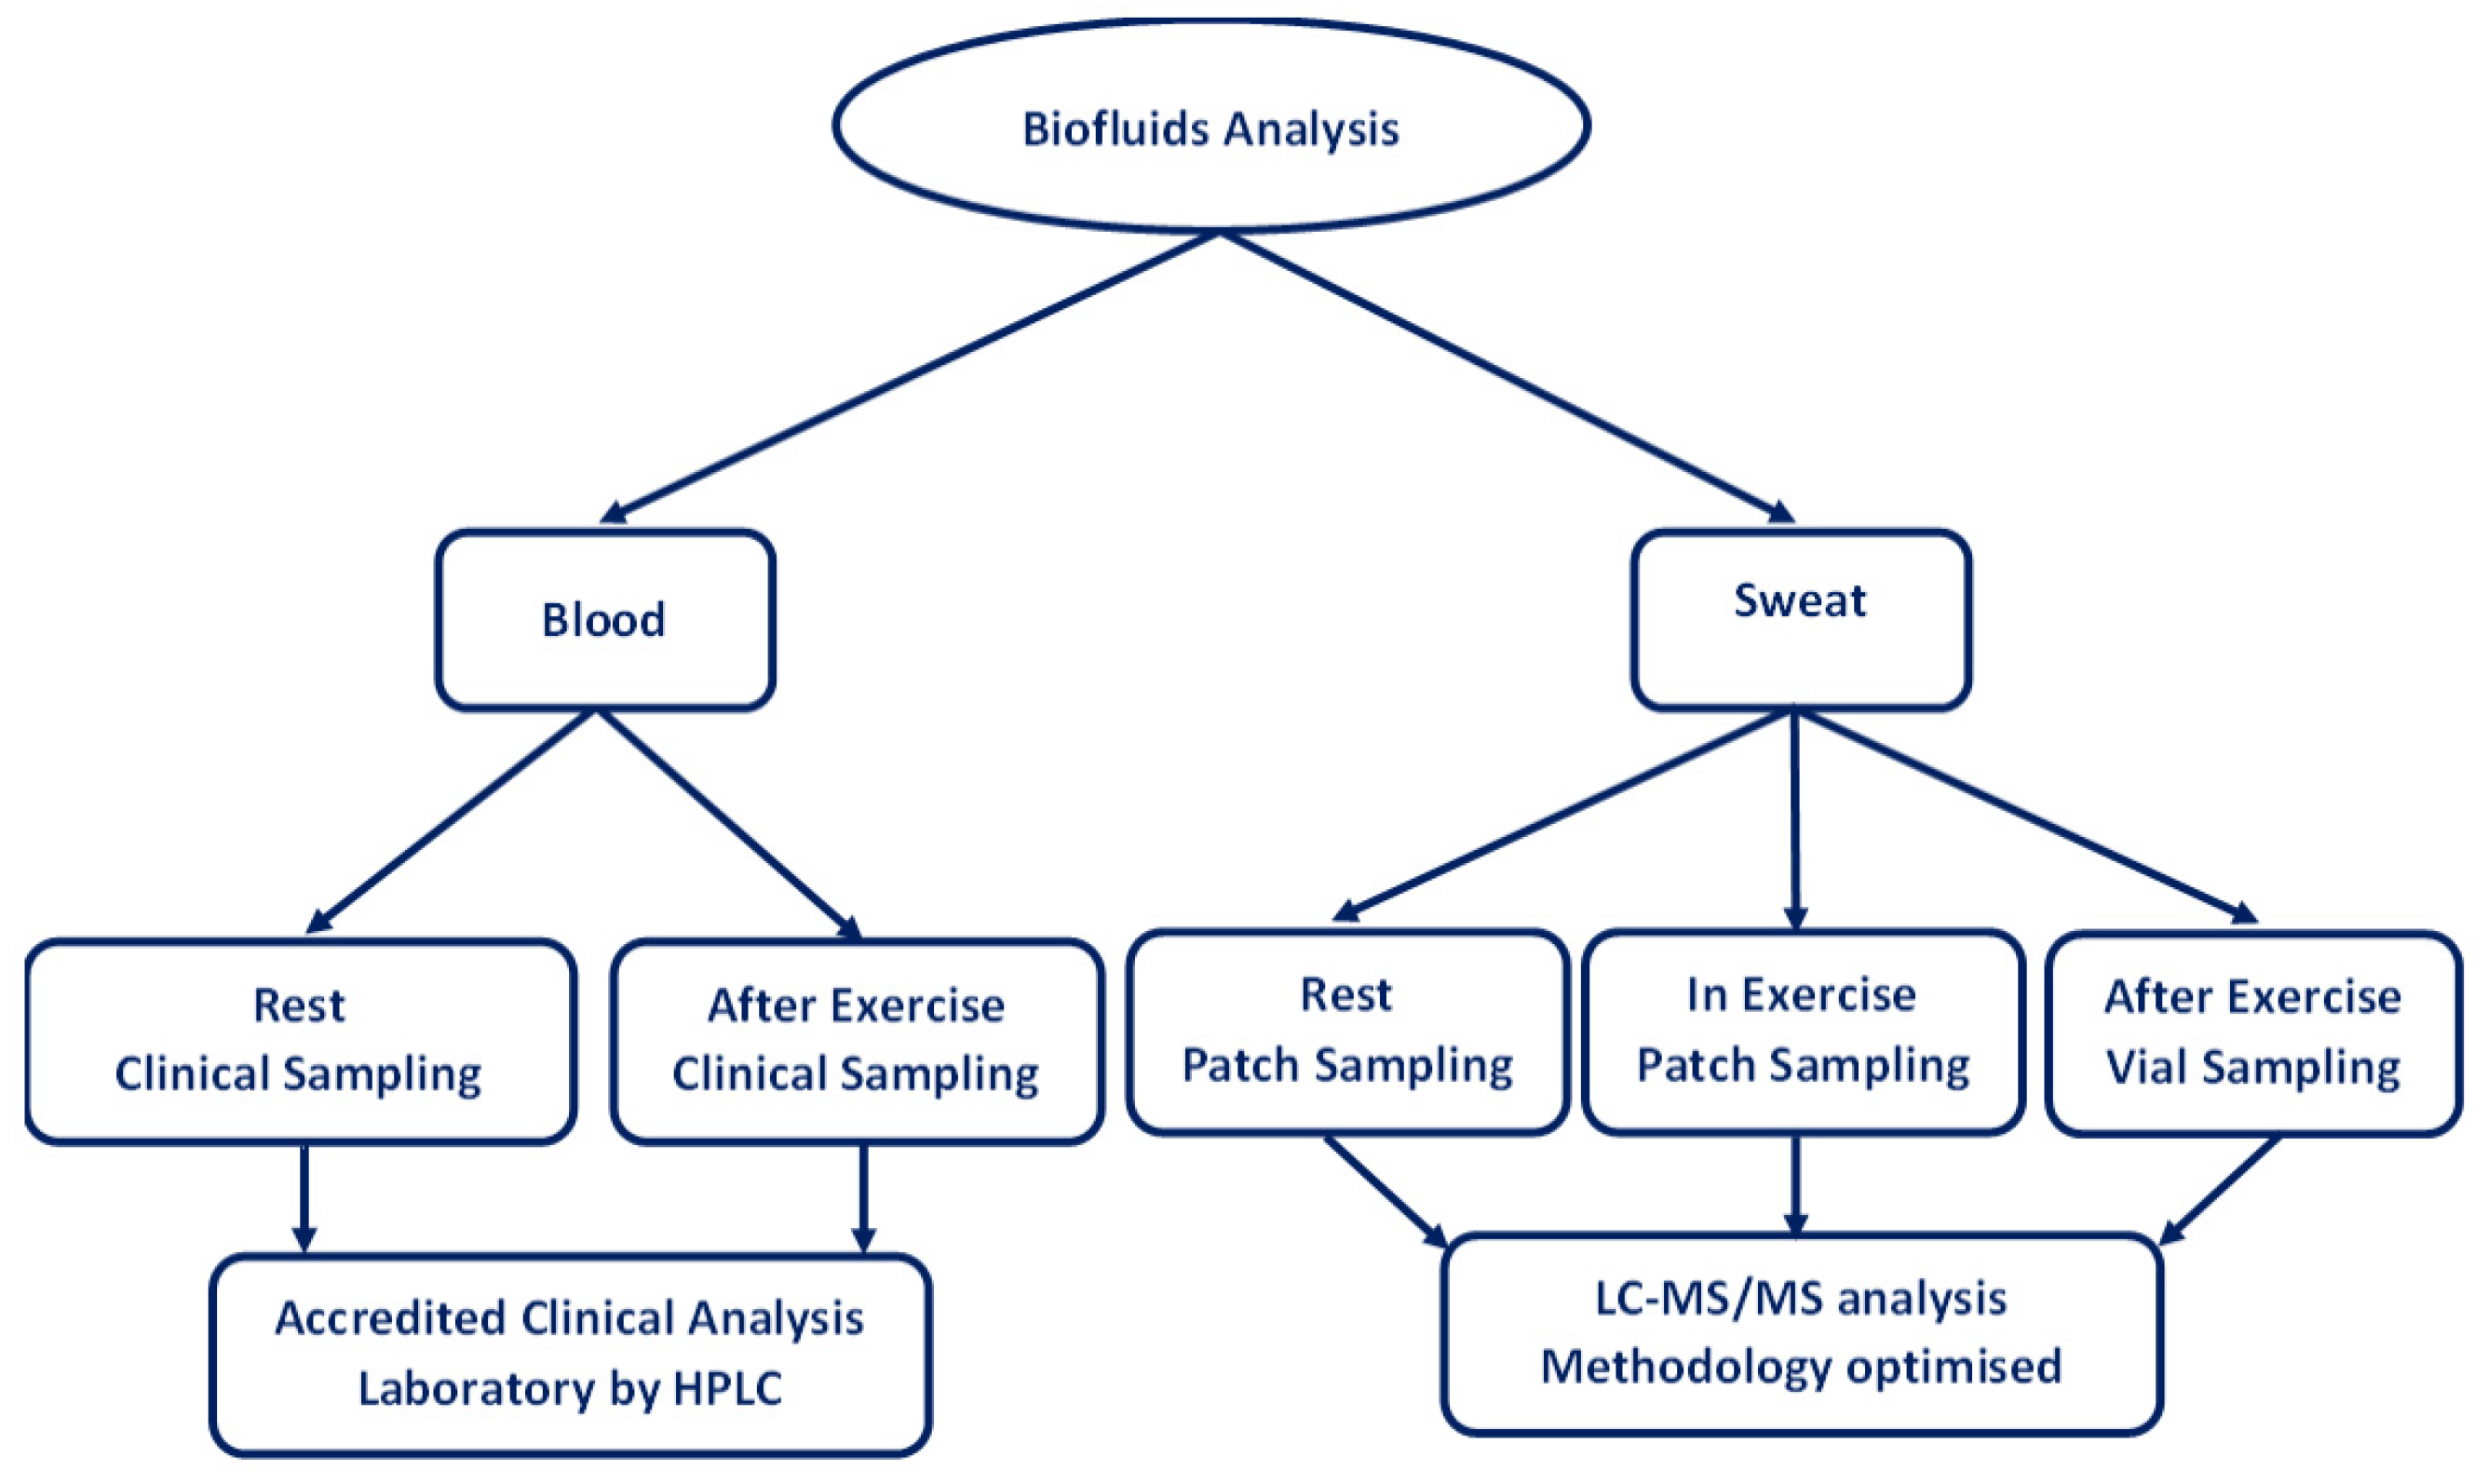
2.2. Biofluid Sampling

The exercise-stress condition to be evaluated involved a physical military training procedure of the Portuguese Military School Academy wherein the volunteers performed marching and running, the so-called “Marcor” training, for 20 min (known to be considered arduous and “stressful” among the students). Blood sampling was also performed before and after exercise and analysed by a certified clinical laboratory for a results comparison considering only a qualitative approach (trends).
Biological samples were kindly donated by three healthy military-cadet student volunteers (3 males with ages between 22 to 23 years). The target population of our project, as an initial case study, was healthy military cadets, to ensure that no other health conditions would interfere in the measure of molecules associated with stress and rest. Additionally, this population in particular, by living in military facilities, has the same conditions, namely, in terms of food, activities, etc., which facilitates the study. All the cadet students were wearing uniforms and carrying their weapons. To all of them, complete information of all procedures was provided, and an informed consent was given and signed. All collected data were made anonymous, in agreement with the protocols submitted to the Universidade Nova de Lisboa Ethics Commission and the Portuguese Army. The use of deodorants, perfumes and cosmetics was prohibited at least 12 h before the sweat collection. Two biofluids were collected: blood and sweat (Figure 1). Random sample codes were generated by the military clinical staff for biological-fluid identification of each volunteer.
This study was conducted according to the Declaration of Helsinki, and the protocol was approved by the ethics committee of Universidade Nova de Lisboa (approval reference Parecer_CE18082020) and the Portuguese Army.

2.2.1. Blood Collection

Blood samples (30 mL) were collected in the morning before and after exercise by the military clinical staff. These samples were immediately refrigerated and delivered to an accredited clinical-analysis laboratory for blood analysis of phenylalanine, tyrosine, tryptophan, dopamine, serotonin, cortisol, epinephrine, norepinephrine, total catecholamines and creatinine biomarkers by high-performance liquid chromatography (HPLC).

2.2.2. Sweat Collection

Occlusive patches for sampling during rest (overnight) and during exercise (20 min) were used and sterile glass vials with round borders for direct sampling of sweat (after exercise) were employed. The skin was cleaned (using a diluted solution of isopropanol) before placing the patches and before training exercise in the body zones where sweat was collected using vials (chest and back). A control analysis of the patches was also performed. The major concern of this procedure was to minimise analytical interferences.

Sweat Patch Sampling

The collection was performed in chest and back using two occlusive patches consisting of 5 layers of gauze (ADA swabs®, Portugal), 5 × 5 cm2, fixed with dressing surgical transparent film roll TegardemTM, USA.
Sampling during rest was performed when the volunteers were sleeping; in the morning before breakfast the patch was removed and stored in a coded sterile zip-lock bag (DELTA LAB®, Spain, 80 × 1200 mm) and refrigerated. The skin was cleaned as described and a new patch was fixed for sweat collection during exercise. After the “Marcor” physical military training, the patch was removed and stored in a coded sterile zip-lock bag and refrigerated.

Sweat Vials Sampling

Samples were collected in sterile 2 mL clean round-border glass vials (9-425 C0000752) with screw cap and red PTFE/white silicone septa (Alwsci® Technologies, Shaoxing, China). Sampling was performed at a period of 5 min after the “Marcor” training. A vial was leaned against the volunteers’ skin-sampling zones into which the sweat was naturally drained. One vial per volunteer was collected and the collection volume of each was approximately 300 µL to 350 µL.
The sterile zip-lock bags and the vials for each volunteer were stored refrigerated in a sterile Nasco® Whirl-Pak, USA. Individual sweat samples of volunteers were transported to the laboratory in refrigerated bags between 2 °C and 6 °C. These were then stored frozen at −20 °C and analysed after 24 h.

2.3. Sample Preparation for Analysis

Different experimental protocols were used for the treatment of vials and patches collected during rest and exercise.

2.3.1. Vials

Vials with samples were subjected to vortex mixing for 30 s and an aliquot of 250 µL was transferred to another vial for extraction. The remaining sample was stored frozen at −20 °C.

2.3.2. Patches

Rest and blank patches containing the samples were placed in a Salivette® SARSTEDT Germany tube and diluted in 1 mL Ultra-Pure water (Millipore).
Patches with samples taken during exercise were placed in a Salivette® tube.
The tube samples were centrifuged for 10 min at 10,000× g and 4 °C. An aliquot of 250 µL was transferred to a vial for extraction. The remaining sample was stored frozen at −20 °C.

2.3.3. Extraction for LC-MS/MS Analysis

All plastic material and glassware were previously carefully cleaned to avoid contamination. Organic solvents (LC-MS grade) and distilled water were evaluated before use to minimise background interferences.
The liquid–liquid extraction was performed with 250 µL of sample and 250 µL methanol LC-MS grade in a sterile 2 mL vial (Alwsci® Technologies, China) with screw cap and red PTFE/white silicone septa. The extract was centrifuged for 10 min at 3000× g rpm using a Sigma 3K30 centrifuge from B. Braun Biotech International GmbH, Germany equipped with a 12,156 rotor. The supernatant liquid extract was transferred using a 500 µL syringe (Gastight 1750 Hamilton®, Vernon Hills, IL, USA) and filtered with a 13 mm, 0.22 µm nylon syringe filter (Filter-Lab®, Sant Pere de Riudebitlles, Spain) into a conical insert (5.8 × 31.5 mm for 2 mL-N2004) into a sterile 2 mL vial (9-425 C0000752) with screw cap and red PTFE/white silicone septa (Alwsci® Technologies, China). The sample was successively analysed after preparation and stored in the LC sampler at 6 °C for LC-MS/MS analysis.

2.4. Instrumentation

The LC-MS/MS analysis was performed on a Dionex® Ultimate 3000 System UHPLC+ focused system (Thermo Scientific, Germany) coupled to a TSQ QuantisTM triple-stage quadrupole mass spectrometer (Thermo Scientific, Waltham, MA, USA).
The liquid-chromatography system, an ultra-high performance liquid chromatograph (UHPLC), was equipped with four modules, a SR-3000 Solvent Rack, a LPG-3400RS pump, a WPS-3000TRS auto sampler with temperature control, a TCC-3000RS column compartment from Thermo Scientific Dionex Ultimate 3000 series UHLPC+ focused.
The triple-stage quadrupole mass spectrometer was equipped with an electrospray-ionisation (ESI) source.
The TSQ Quantis Mass Spectrometer was controlled by the TSQ Quantis 3.1 Tune software (Application 3.1.2415.15 Thermo Scientific, USA) and the LC-MS/MS operation and acquisition data system was controlled by the XCaliburTM 4.1 Thermo Scientific SP1 (0388-00CD-7B33, USA) software.

2.5. Chromatographic and Mass-Spectrometry Conditions

The sample injection volume was 10 µL. The separation of compounds was attained using an AccuroreTM RP-MS Column (2.6 µm, 150 × 2.1 mm, ThermoFisher Scientific, USA). The gradient mobile phase consisted of water with 0.1% formic acid (A) and acetonitrile (B).
Tandem-mass-spectrometry (MS/MS) analysis was carried out using the triple-stage quadrupole mass spectrometer. The prepared samples was first injected in full-scan acquisition mode in positive- and negative-ion-spray voltage-acquisition modes (two times) to obtain information on the product ion of the most relevant compounds. Table 1 outlines the instrumental parameter settings for chromatographic and mass-spectrometry assays conditions.
After detection and identification by full-scan analysis, targeted-MS/MS experiments were conducted by injecting samples in select-reaction-monitoring (SRM) mode, using multiple-reaction monitoring (MRM). Each targeted analyte was identified by at least two product ions of the precursor ion according to Commission Decision Directive [61] for identification confirmation. The identification of the targeted analyte was also confirmed from comparison with previous studies [60]. In this work, the mobile-phase flow was optimised for a better chromatographic compound separation. Collision energy was also optimised, and the signal of the MS/MS detection was improved. The instrumental MS/MS analytical conditions for the targeted biomarkers are presented in Table 2.

2.6. Validation of the Analytical Procedure

The proposal of this analytical methodology is to be used as a screening technique. Instead of trying to quantify the analytes in the samples as the first goal, it is sufficient to determine whether they are present and if variations can be detected. As such, a qualitative method was used that enables both time and cost of analysis to be reduced. Considering the complex composition of sweat samples, UHPLC was used for analyte separation and tandem mass spectrometry was used for detection by analyte identification, as well as a quantitative approach through peak-area abundance. Rather than working in the concentration domain, this method works in the response domain.
There is still no consensus about the validation protocol and the terminology used for qualitative methods, or in this case, a semi-quantitative approach. Notwithstanding, validation has to be carried out in any analytical application, but there is no established worldwide criterion for their validation in qualitative methods. The validation of this analytical procedure was made in-house, with the analytical detection by LC-MS/MS being a critical step for ensuring reliability in the results. The analysis aims to allow the suitability of sampling protocols using this approach, with control over the analytical detection. Thus, for the validation of this analysis we considered which analytes were identified, the presence or absence of the analytes in question, and the UHPLC and MS/MS performance parameters. This validation proposal considered the principles of the (a) International Union of Pure and Applied Chemistry (IUPAC), which stated that “the analysis in which substances are identified or classified on the basis of their chemical or physical properties” [62]; (b) the Eurachem fitness for purpose of analytical methods [63]; (c) the ISO 17025 which it establishes the concept of ‘fitness-for-purpose’ since it evaluates the fitness of the analytical method for its purpose. As a result, the performance characteristics to be established depend on the requirements of the analytical problem [64], and (d) according to Commission Decision Directive [61] for identification confirmation concerning the performance of analytical methods and the interpretation of results. Thus, the parameters of concern for UHPLC (and MS/MS) identification are presented in Table 2 and are (a) peak identification by retention time (RT) within ±0.1 min for each biomarker, and by two selective MRM transitions that were monitored for each targeted analyte, and (b) peak-area repeatability less than 5% for three replicate-sample injections. After the validation, we used these parameters for quality-control assurance of the presented results.

3. Results and Discussion

The methodology of attaining results for the sweat samples is discussed below. Additionally, the results obtained from sweat and blood samples of the volunteers were compared, and a brief description of their relevance is discussed, taking into consideration the main goals of the work: optimisation of analytical methodology, and the identification of molecules with potential to be considered as biomarkers in sweat for the sampling protocols evaluation and assessment of variations in blood and sweat, under the volunteers’ conditions (rest and stress).

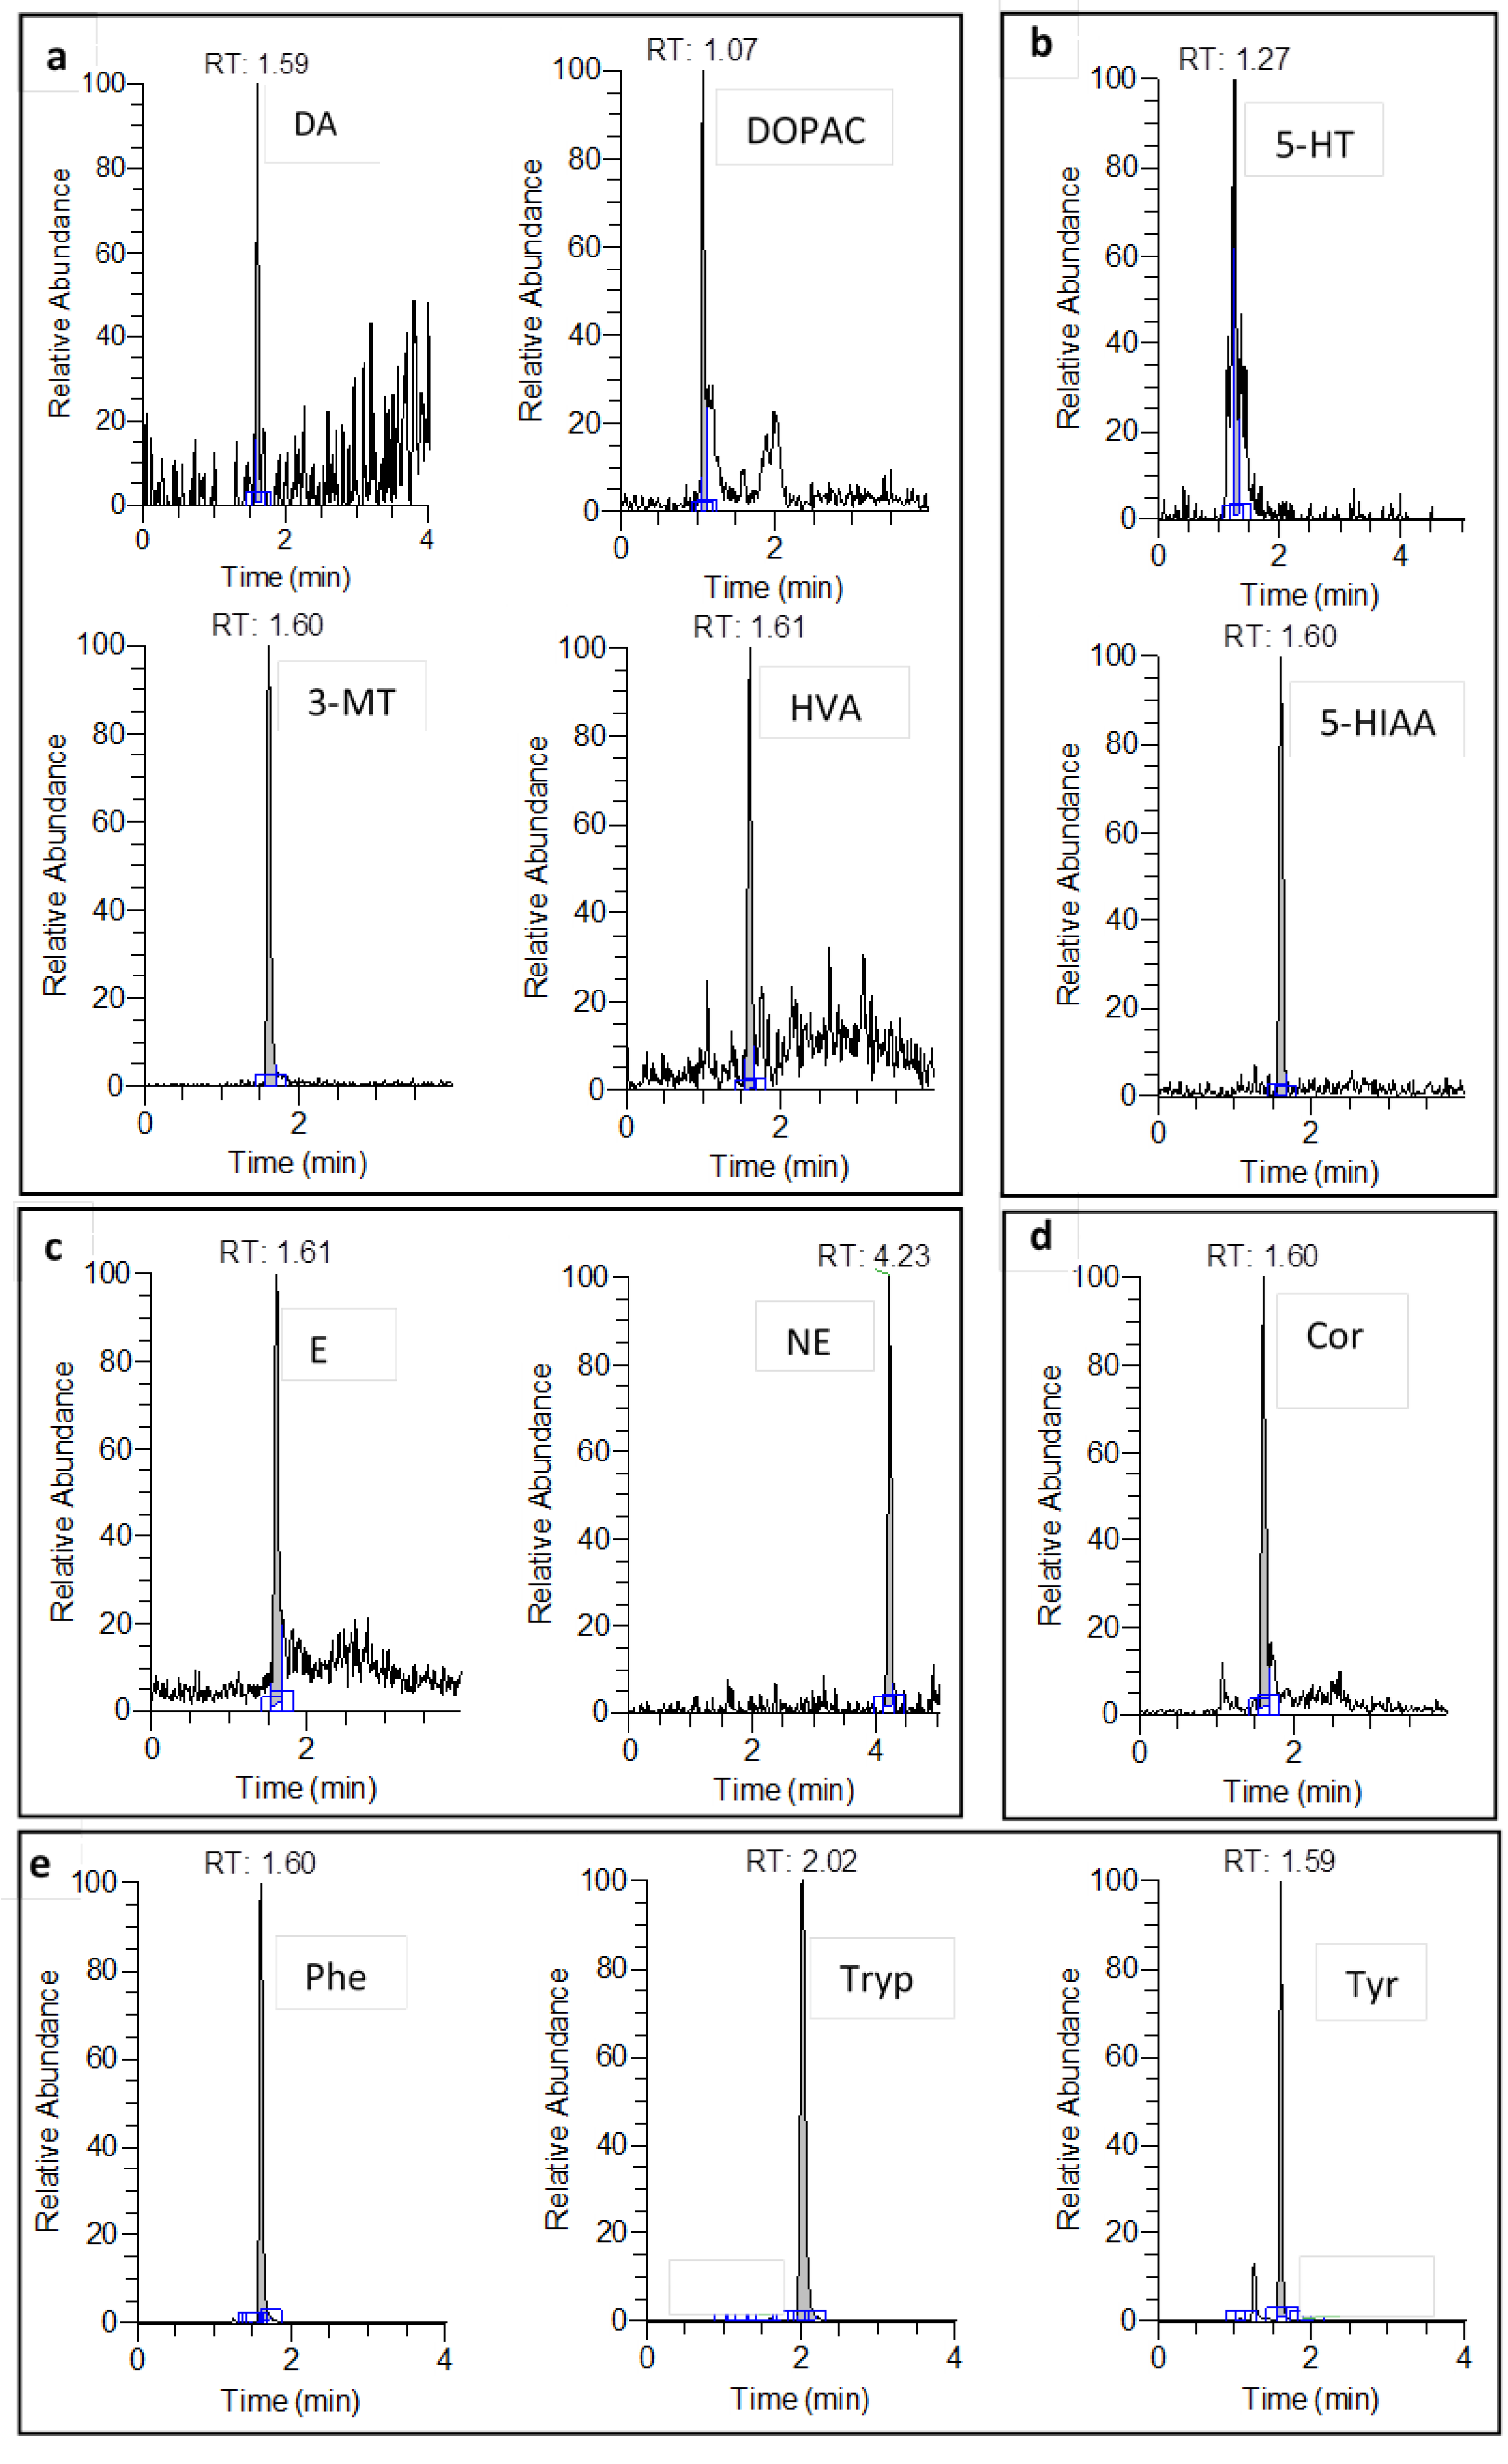
3.1. Optimisation of Analytical Detection Methodology

Considering that some of the major components of sweat samples are proteins and salts, a pre-treatment of samples is necessary, which in our case is described in Section 2.3, and may imply the loss of molecules that are intended to be identified. The extraction efficiency for each analyte was not under investigation since the goal was to check which compounds were possible to detect simultaneously, and not to specify a methodology for each family (or individual molecule), aiming to achieve only one screening profile in one detection analysis for small molecules.
As stated before, in a previous study, 26 potential stress-related biomarkers in pooled sweat samples were identified through a screening profile by LC-MS/MS [60]. In this work, the analytical methodology for the screening profile of sweat by LC-MS/MS was further optimised by improving the elution program to increase the chromatographic separation (Table 1), and at the MS/MS level the detection was also optimised by improving the collision energy, using the instrumental MS/MS operational conditions indicated in Table 2.

3.2. Identification of Potential Biomarkers in Sweat

Targeted analysis was applied to characterise sweat samples in select-reaction-monitoring (SRM) mode, using multiple-reaction monitoring (MRM). At least two selective MRM transitions were monitored for each targeted analyte according to the Commission Decision Directive [61] for identification confirmation. Additionally, the identification criteria included retention time (RT) within ±0.1 min for each biomarker. The identified molecules are indicated in Table 2 and listed below:
(a)
Neurotransmitters (NTs): Acetylcholine (Ach); biological amines and their metabolites, Dopamine (DA), 3,4-Dihydroxyphenylacetic acid (DOPAC, DA metabolite), Homovanillic acid (HVA, DA metabolite), 3-Methoxytyramine (3-MT, DA metabolite), Epinephrine (E), Norepinephrine (NE), Serotonin (5-HT) and 5-Hydroxyindol-3-acetic acid (5-HIAA, 5-HT metabolite); Amino acids, Glutamic Acid (Glu); Purines, Adenosine (Ade).
(b)
Other identified molecules: Amino acids precursors of biogenic amines, L-Phenylalanine (Phe), L-Tyrosine (Tyr) and L-Tryptophan (Trp); Amino acids, Creatine (Crea), L-Glutamine (Gln), L-Histidine (His), L-Isoleucine (Ile), L-Leucine (Leu) and L-Lysine (Lys); Carboxylic acids, Ascorbic Acid (Asc) and Lactic Acid (Lacta); Carbohydrates, D-Glucose (Gluc); Breakdown products, Creatinine (Creat); Steroid hormones, Cortisol (or hydrocortisone) (Cor) and Cortisone (Cort).
The experimental signal described by normalisation level (NL), which describes the intensity of the base peak results, was the criterion by which to determine the detection of biomarkers. Compounds detected and identified with NL signals, between 102 and 103, 103 and 104, and higher than 104 were considered as low-intensity, medium-intensity and high-intensity signal biomarkers, respectively. As indicated in Table 2 and relating the identified biomarkers with the NL signal, it is possible to classify the biomarkers according to:
-
low NL signal: DA, DOPAC, HVA and NE;
-
medium NL signal: Ach, E, 5-HT, 5-HIAA, Ade, Asc and Creat;
-
high NL signal: 3-MT, Glu, Phe, Trp, Tyr, Crea, Gln, His, Ile, Leu, Lys, Lacta, Gluc, Cor and Cort.
The selected experimental LC-MS/MS chromatograms of the identified potential biomarkers are indicated in Figure 2, which represents (a) DA and its metabolites (DOPAC, 3-MT and HVA), (b) 5-HT and its metabolite (5-HIAA), (c) E and NE, (d) Cor and (e) Phe, Tryp, and Tyr LC-MS/MS chromatograms. This selection of chromatograms exhibited the main biomarkers related with stress and training, as indicated in the literature [1,2,3,4,5,6,7,8,9,10,11].
The selected molecules and the corresponding LC-MS/MS peak-area analysis allow a simple qualitative comparison with the results of the blood analysis in order to search for common trends, as shown in Table 3. Figure 3 shows the peak area of the LC-MS/MS analysis of the sweat samples considering all individuals, in a box plot of each sampling protocol in the two different body zones, chest and back. Namely, sampling using patches during rest (PR-Chest and PR-Back), patches during exercise (PE-Chest, PE-Back) and vials after 5 min after “Marcor” training (VE-Chest and VE-Back) where bars signify the minimal and maximal values of each target analyte with the inclusive median. The selected molecules are (a) Phe, (b) Tyr, (c) Tryp; (d) 3-MT, (e) HVA and (f) Cortisol; and (g) 5-HT, (h) 5-HIAA and (i) E.
The results of the peak area attained by LC-MS/MS analysis for the other identified targeted compounds in the sweat samples are supplied as supplementary material in a box plot of each sampling protocol in Figure S1 for (a) Ach, (b) DOPAC, (c) NE; (d) Glu, (e) Ade, (f) Crea; (g) Gln, (h) His and (i) Ile; (j) Leu, (k) Lys and (l) Asc; (m) Lacta, (n) Gluc and (o) Creat and (p) Cort potential biomarkers. Additionally, the blood-analysis results are supplied as supplementary material in Figure S2 for (a) Phe, (b) Tyr, (c) Tryp, (d) DA, (e) 5-HT, (f) Cor, (g) E, (H) NE, (i) total catecholamines and (j) Creat biomarkers.
From the above, the analytical methodology for the screening profile of the samples, with different sampling protocols, leads to the successful identification of the expected 26 potential stress biomarkers during rest and exercise (Table 2).

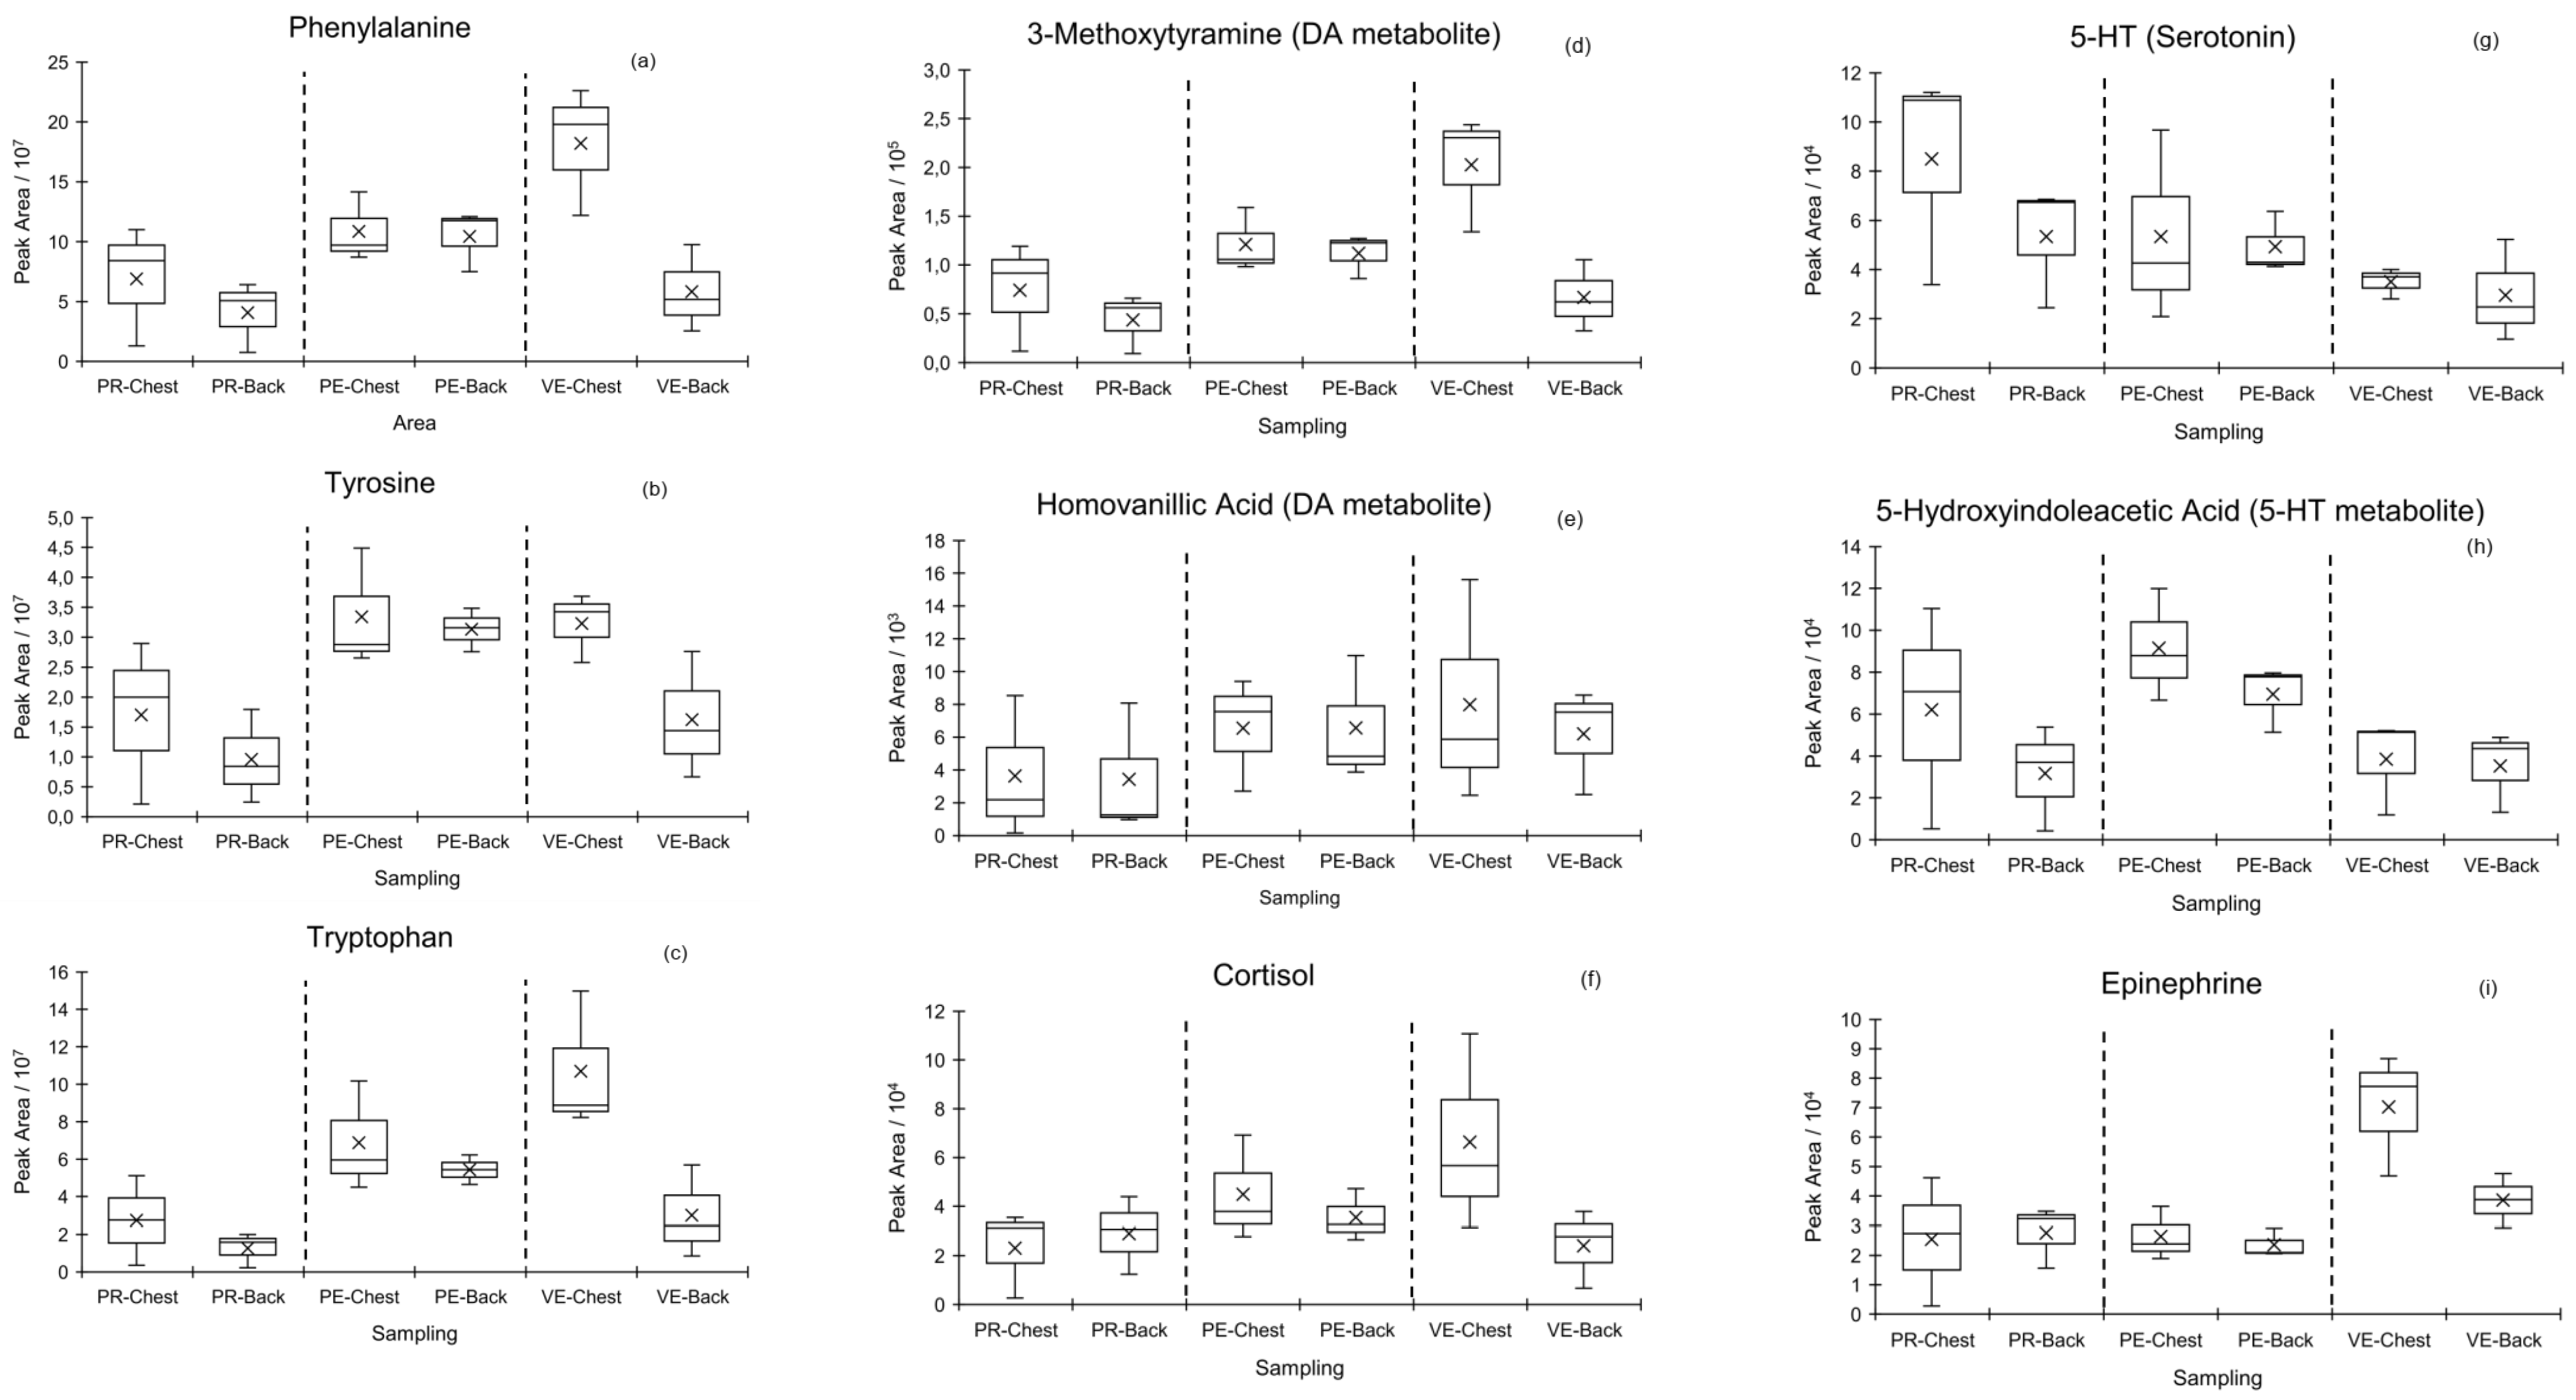
3.3. Sampling Sweat Performance

The current study is part of a larger project that intends to establish new stress biomarkers for in situ measurements. The in situ measurements are planned to be taken using wearables, namely a T-shirt, that may be used by the military. As such, the chest and back are the most suitable positions for that purpose.
The sampling-methodology evaluation was performed by comparison of qualitative abundance, considering the peak area of LC-MS/MS ion chromatograms. Therefore, it is necessary to observe any analytically interfering compounds when patches are used and to observe if there are relevant differences between a direct sampling, as in the case of vial sampling, and an indirect sampling using patches. As such, LC-MS/MS analysis began by controlling interfering compounds. The analysis of solvents and laboratory material confirmed that there were no contaminations and interferences. Comparing results attained by patches and vials, some interfering signals were observed using gauze patches. The blank-patch (Blk) analysis by LC-MS/MS pointed out interferences that, in some cases, were of the same order of magnitude as the molecules detected in sweat, namely for Ach, DOPAC, NE, Ade, Asc, Gluc and Create (Figure S1). However, it must be considered that for patches, the peak area of each sample was presented with the corresponding blank peak area subtracted. For these compounds, it must be taken into consideration that when using patches, possible interference may be detected from the blank patch. From this, it is concluded that for the biomarkers Ach, DOPAC, NE, Ade, Asc, Gluc and Creat, although it was possible to observe variations using patches, more reliable results were obtained from the direct sampling using vials, which implies the collection of consistent data only under the “after training” condition. Even so, the results show that it is possible to observe variations without patch interferences under both rest and exercise conditions for Phe, Tyr, Tryp, 3-MT (DA met), HVA (DA-Met), Cor, 5-HT, 5-HIAAA (5-HT Met) and E as shown in Figure 3, and for Glu, Creat, Gln, His, Ile, Leu, Lys, Lacta and Cort as shown in Figure S1.
The results for the detected molecules, which were sampled using patches and vials between on chest and the back, show that the order of magnitude of the NL was the same (Figure 3 and Figure S1). As such, the sweat samples from the chest and back body-sampling zones may be considered, which may be an advantage for the issue of low sweat volume. Some authors point out the problem of the variability in sweat rate, within and among individuals, and the body symmetry that cannot be assumed. Nevertheless, these studies were conducted considering exercise-induced sweat and regarding metabolic sample stability [47,48,49] and cannot be directly compared with the current study. A recent revision describes studies with attention to sweat induction and sampling techniques, the timing of sweat collection, sweat-storage conditions, laboratory derivation, and processing and analytical platforms, in view of the challenges to standardising sweat collection for metabolomics analysis [65].
Information about quantitative measurement assessment of the presence of particular molecules in sweat, such as dopamine and serotonin, is limited, and no data suggesting its presence under rest or exercise conditions were found; however, some information is available on their roles, and their receptors, in regulating sleep and waking [66,67]. For cortisol, more data can be found. For instance, a revision that assessed analytes in biofluids pointed out, by a comparison of the levels of analytes in blood plasma and sweat, that cortisol is unbound and glucose is −1% in sweat than plasma [68]. From the above considerations, it is our belief that all the attained information is a contribution to the use of sweat as clinical biofluid.
Although the aim of the current study was the sampling-methodology evaluation/optimisation by testing the molecule identification and level variations between “in rest” and “in exercise” conditions, it should be highlighted that even with only three volunteers it was possible to attain a qualitative correlation between the results attained from sweat and blood for the metabolites 5-HT, Phe, Tryp, and Tyr (Figure 3 and Figure S2).

3.4. Preliminary Assessment of Level Variations of Selected Molecules in Blood and Sweat

The level variations of the molecules considered as having the potential to be used as stress-related biomarkers, which were attained from sweat and its comparison with the results from blood analysis, are shown in Table 3. The sweat LC-MS/MS peak results are represented in Figure 3 and Figure S1 for each molecule. Blood results from the clinical analysis are presented in supplementary material, Figure S2, for Phe, Tyr, Tryp, DA, 5-HT, Cor, E, NE, total catecholamines and Creat, attained by HPLC. Table 3 summarises the variation of the molecule signals that presented relevant differences between rest and exercise, both in blood and sweat. As mentioned before, a good correlation was found for the qualitative variations of 5-HT, Phe, Tryp, and Tyr attained from sweat and blood. Additionally, DA is an interesting case, since in blood, it was found that its levels decreased and increased during rest and exercise, respectively. In sweat, the observed DA degradation metabolites (DOPAC, 3-MT and HVA) also followed the same trend.
For NE, the attained results showed variations, namely a decrease during rest and an increase during exercise.
5-HT showed a decrease during rest and an increase during exercise conditions, with a similar variation in sweat and blood. 5-HT is generated from Tryp by the enzyme tryptophan hydroxylase. 5-HT and DA are neurotransmitters associated with fatigue, which is a feeling that leads to reduced intensity or interruption of physical exercises, thereby regulating performance [69].
Tyr and Phe also presented increased levels during exercise, both in sweat and blood, which is in agreement with results obtained by Bergman et al. [70].
The Creat results were considered inconclusive in sweat, but increased levels in blood under exercise conditions were attained.

4. Conclusions

A novel LC-MS/MS approach previously developed for a screening profile of molecules with potential to be considered as biomarkers in sweat was used for sampling-procedure testing. The method exhibits high sensitivity and can be a valuable tool for identifying molecules that may be stress related, as well as a useful tool for qualitative analysis due to its sole LC-MS/MS analysis step, allowing cost and time savings.
The great advantage is that it is possible to perform the screening profile in only one analysis step. Additionally, in the future, it will be possible to extend the method for the screening of other molecules. The sweat-sampling procedures using patches led to the conclusion that it is possible, and may be adequate, to use chest and back sweat samples, which allow a less costly analysis and enable larger sample volumes. Additionally, patch sampling seems to be a suitable methodology to distinguish between qualitative abundance under rest and exercise conditions. In summary, the content variation of the potential biomarker molecules can be attained, which is a clear advantage. One disadvantage to long-term sampling during rest, as already mentioned in the introduction, may be the possibility of the occurrence of hidromeiosis. In order to avoid interfering and control decomposition effects, when applicable, the use of vials for direct sampling at the end of exercise seems to be more appropriate, despite the limitation of not being easy to use during rest. Additionally, this direct methodology may have the advantage of sweat contamination by environmental pollution during exercise.
A comparison of the results from sweat and blood analysis points to the possibility to observe the biological impact of stress for catecholamines, NTs, and amino-acid precursors of catecholamine NTs using sweat as the target fluid.
In this study, the potential of sweat is outlined for a case study of attaining molecules that can be used as potential stress biomarkers, obtained from military volunteers during a Marcor exercise. Sampling procedures/protocols were considered suitable since the analytical results showed that it is possible not only to identify the molecules but also to detect their level variations. The observation of variations between the two conditions of concern, rest and exercise, can be accomplished using patches (or vials during exercise), opening the possibility for the construction of a device for in situ detection. Despite the limitations linked with low sampling volumes, it was demonstrated, using the LC-MS/MS analysis, that sweat can offer valuable physiological information and is a potential diagnostic biofluid, coupled with the advantage of being a non-invasive method of assessment, showing promising prospects for future in situ measurements. The results were particularly interesting for 5-HT, Phe, Tryp, and Tyr, and it may be considered that these molecules have potential to be used together as a set of biomarkers for stress.

Supplementary Materials

The following supporting information can be downloaded at: https://www.mdpi.com/article/10.3390/analytica3020013/s1, Figure S1: Sweat box plot results by LC-MSMS analysis for (a) Ach, (b) DOPAC, (c) NE, (d) Glu, (e) Ade, (f) Crea, (g) Gln, (h) His, (i) Ile, (j) Leu, (k) Lys (l) Asc, (m) Lacta, (n) Gluc and (o) Create and (p) Cort potential biomarkers; Figure S2: Blood analysis results by clinical analysis laboratory of (a) Phe, (b) Tyr, (c) Tryp, (d) DA, (e) 5-HT, (f) Cor, (g) E, (h) NE, (i) Total Catecholamines and (j) Creat biomarkers by HPLC high resolution.

Author Contributions

All authors have participated in this work. M.J.N.: conception of the study; acquisition, analysis and interpretation of data; drafted and revision of the work. J.J.G.M.: revision of the work. J.P.N.: laboratory facilities. L.C.B.: laboratory facilities. A.S.-A.: interpretation of data and revision of work. J.P.S.: Sampling facilities. C.R.: Sampling facilities and revision of work. C.M.C.: conception of the study; drafted and revision of the work. All authors have read and agreed to the published version of the manuscript.

Funding

The authors acknowledge the financial support of Fundação para a Ciência e Tecnologia (FCT/MCTES), project PTDC/SAU-SOC/28390/2017. Also, this work was supported by the Associate Laboratory for Green Chemistry-LAQV which is financed by national funds from FCT/MCTES (UIDB/50006/2020 and UIDP/50006/2020).

Institutional Review Board Statement

The study was performed in compliance with the ethical standards defined by the World Medical Association (WMA) Declaration of Helsinki (DoH). This study was conducted under the scope of Project Stressense and was approved by the ethics committee of Universidade Nova de Lisboa and the Portuguese Army.

Informed Consent Statement

The volunteers that participated in this study were previously informed and a written informed consent was attained.

Data Availability Statement

Data generated or analysed during this study are included in this published article and its supplementary information files. Raw data may be available on request.

Acknowledgments

The authors acknowledge the anonymous volunteers that agreed to participate in this study.

Conflicts of Interest

The authors declare no conflict of interest.

References

  1. Marques, A.H.; Silverman, M.N.; Sternberg, E.M. Evaluation of stress systems by applying noninvasive methodologies: Measurements of neuroimmune biomarkers in the sweat, heart rate variability and salivary cortisol. Neuroimmunomodulation 2010, 17, 205–208. [Google Scholar] [CrossRef] [PubMed] [Green Version]
  2. Dhama, K.; Latheef, S.K.; Dadar, M.; Samad, H.A.; Munjal, A.; Khandia, R.; Karthik, K.; Tiwari, R.; Yatoo, M.I.; Bhatt, P.; et al. Biomarkers in Stress Related Diseases/Disorders: Diagnostic, Prognostic, and Therapeutic Values. Front. Mol. Biosci. 2019, 6, 91. [Google Scholar] [CrossRef] [PubMed]
  3. Cai, H.; Cao, T.; Li, N.; Fang, P.; Xu, P.; Wu, X.; Zhang, B.; Xiang, D. Quantitative monitoring of a panel of stress-induced biomarkers in human plasma by liquid chromatography-tandem mass spectrometry: An application in a comparative study between depressive patients and healthy subjects. Anal. Bioanal. Chem. 2019, 411, 5765–5777. [Google Scholar] [CrossRef] [PubMed]
  4. Pilon, S.; Holloway, A.C.; Thomson, E.M. Metabolic, stress, and inflammatory biomarker responses to glucose administration in Fischer-344 rats: Intraperitoneal vs. oral delivery. J. Pharmacol. Toxicol. Methods 2018, 90, 1–6. [Google Scholar] [CrossRef] [PubMed]
  5. Picard, R.W. Automating the Recognition of Stress and Emotion: From Lab to Real-World Impact. IEEE Multimed. 2016, 23, 3–7. [Google Scholar] [CrossRef]
  6. Stress at the Workplace. Available online: https://www.who.int/occupational_health/topics/stressatwp/en/ (accessed on 15 January 2022).
  7. Singh, A.; Kaushik, A.; Kumar, R.; Nair, M.; Bhansali, S. Electrochemical sensing of cortisol: A recent update. Appl. Biochem. Biotechnol. 2014, 174, 1115–1126. [Google Scholar] [CrossRef] [Green Version]
  8. Cano-Lopez, I.; Gonzalez-Bono, E. Cortisol levels and seizures in adults with epilepsy: A systematic review. Neurosci. Biobehav. Rev. 2019, 103, 216–229. [Google Scholar] [CrossRef]
  9. Zamkah, A.; Hui, T.; Andrews, S.; Dey, N.; Shi, F.; Sherratt, R.S. Identification of Suitable Biomarkers for Stress and Emotion Detection for Future Personal Affective Wearable Sensors. Biosensensors 2020, 10, 40. [Google Scholar] [CrossRef] [Green Version]
  10. Steckl, A.J.; Ray, P. Stress Biomarkers in Biological Fluids and Their Point-of-Use Detection. ACS Sens. 2018, 3, 2025–2044. [Google Scholar] [CrossRef]
  11. Steptoe, A.; Hamer, M.; Chida, Y. The effects of acute psychological stress on circulating inflammatory factors in humans: A review and meta-analysis. Brain Behav. Immun. 2007, 21, 901–912. [Google Scholar] [CrossRef]
  12. Sapolsky, R.M. Why stress is bad for your brain. Science 1996, 273, 749–750. [Google Scholar] [CrossRef] [PubMed]
  13. Chaouloff, F.; Berton, O.; Mormede, P. Serotonin and stress. Neuropsychopharmacology 1999, 21, S28–S32. [Google Scholar] [CrossRef]
  14. Taelman, J.; Vandeput, S.; Spaepen, A.; Van Huffel, S. Influence of Mental Stress on Heart Rate and Heart Rate Variability. In Proceedings of the 4th European Conference of the International Federation for Medical and Biological Engineering, Antwerp, Belgium, 23–27 November 2009; Volume 22, pp. 1366–1369. [Google Scholar]
  15. Heraclides, A.M.; Chandola, T.; Witte, D.R.; Brunner, E.J. Work Stress, Obesity and the Risk of Type 2 Diabetes: Gender-Specific Bidirectional Effect in the Whitehall II Study. Obesity 2012, 20, 428–433. [Google Scholar] [CrossRef] [PubMed]
  16. McCowen, K.C.; Malhotra, A.; Bistrian, B.R. Stress-induced hyperglycemia. Crit. Care Clin. 2001, 17, 107–124. [Google Scholar] [CrossRef]
  17. Ray, P.; Steckl, A.J. Label-Free Optical Detection of Multiple Biomarkers in Sweat, Plasma, Urine, and Saliva. ACS Sens. 2019, 4, 1346–1357. [Google Scholar] [CrossRef]
  18. Griffiths, H.R.; Moller, L.; Bartosz, G.; Bast, A.; Bertoni-Freddari, C.; Collins, A.; Cooke, M.; Coolen, S.; Haenen, G.; Hoberg, A.M.; et al. Biomarkers. Mol. Asp. Med. 2002, 23, 101–208. [Google Scholar] [CrossRef]
  19. Dadar, M.; Dhama, K.; Iqbal, H.M.N.; Munjal, A.; Khandia, R.; Karthik, K.; Sachan, S.; Latheef, S.K.; Samad, H.A.; Joshi, S.K. Molecular Signatures of Biomarkers in Cancer Development, Diagnosis, and its Prognostic Accuracy. Curr. Biomark. 2016, 6, 89–96. [Google Scholar] [CrossRef]
  20. Abbas, M.; Habib, M.; Naveed, M.; Karthik, K.; Dhama, K.; Shi, M.; Dingding, C. The relevance of gastric cancer biomarkers in prognosis and pre- and post-chemotherapy in clinical practice. Biomed. Pharmacother. 2017, 95, 1082–1090. [Google Scholar] [CrossRef]
  21. Prajapati, B.M.; Gupta, J.P.; Pandey, D.P.; Parmar, G.A.; Chaudhari, J.D. Molecular markers for resistance against infectious diseases of economic importance. Vet. World 2017, 10, 112–120. [Google Scholar] [CrossRef] [Green Version]
  22. Selleck, M.J.; Senthil, M.; Wall, N.R. Making Meaningful Clinical Use of Biomarkers. Biomark. Insights 2017, 12, 1177271917715236. [Google Scholar] [CrossRef] [Green Version]
  23. Ewert, A.; Chang, Y. Levels of Nature and Stress Response. Behav. Sci. 2018, 8, 49. [Google Scholar] [CrossRef] [PubMed] [Green Version]
  24. Tampa, M.; Sarbu, M.I.; Mitran, M.I.; Mitran, C.I.; Matei, C.; Georgescu, S.R. The Pathophysiological Mechanisms and the Quest for Biomarkers in Psoriasis, a Stress-Related Skin Disease. Dis. Markers 2018, 2018, 5823684. [Google Scholar] [CrossRef] [PubMed] [Green Version]
  25. Wishart, D.S. Metabolomics for Investigating Physiological and Pathophysiological Processes. Physiol. Rev. 2019, 99, 1819–1875. [Google Scholar] [CrossRef] [PubMed]
  26. Calderon-Santiago, M.; Priego-Capote, F.; Turck, N.; Robin, X.; Jurado-Gamez, B.; Sanchez, J.C.; Luque de Castro, M.D. Human sweat metabolomics for lung cancer screening. Anal. Bioanal. Chem. 2015, 407, 5381–5392. [Google Scholar] [CrossRef]
  27. Brasier, N.; Eckstein, J. Sweat as a Source of Next-Generation Digital Biomarkers. Digit. Biomark. 2019, 3, 155–165. [Google Scholar] [CrossRef]
  28. Alvarez-Sanchez, B.; Priego-Capote, F.; de Castro, M.D.L. Metabolomics analysis I. Selection of biological samples and practical aspects preceding sample preparation. TrAC Trends Anal. Chem. 2010, 29, 111–119. [Google Scholar] [CrossRef]
  29. Causon, T.J.; Hann, S. Review of sample preparation strategies for MS-based metabolomic studies in industrial biotechnology. Anal. Chim. Acta 2016, 938, 18–32. [Google Scholar] [CrossRef]
  30. Jadoon, S.; Karim, S.; Akram, M.R.; Kalsoom Khan, A.; Zia, M.A.; Siddiqi, A.R.; Murtaza, G. Recent developments in sweat analysis and its applications. Int. J. Anal. Chem. 2015, 2015, 164974. [Google Scholar] [CrossRef]
  31. Mena-Bravo, A.; Luque de Castro, M.D. Sweat: A sample with limited present applications and promising future in metabolomics. J. Pharm. Biomed. Anal. 2014, 90, 139–147. [Google Scholar] [CrossRef]
  32. Delgado-Povedano, M.M.; Castillo-Peinado, L.S.; Calderon-Santiago, M.; Luque de Castro, M.D.; Priego-Capote, F. Dry sweat as sample for metabolomics analysis. Talanta 2020, 208, 120428. [Google Scholar] [CrossRef]
  33. Lee, J.B.; Kim, J.H.; Murota, H. Perspiration Functions in Different Ethnic, Age, and Sex Populations: Modification of Sudomotor Function. Curr. Probl. Dermatol. 2016, 51, 109–119. [Google Scholar] [CrossRef] [PubMed]
  34. Hladek, M.D.; Szanton, S.L.; Cho, Y.E.; Lai, C.; Sacko, C.; Roberts, L.; Gill, J. Using sweat to measure cytokines in older adults compared to younger adults: A pilot study. J. Immunol. Methods 2018, 454, 1–5. [Google Scholar] [CrossRef] [PubMed]
  35. Chung, M.; Fortunato, G.; Radacsi, N. Wearable flexible sweat sensors for healthcare monitoring: A review. J. R. Soc. Interface 2019, 16, 20190217. [Google Scholar] [CrossRef] [PubMed]
  36. Liu, C.; Xu, T.; Wang, D.; Zhang, X. The role of sampling in wearable sweat sensors. Talanta 2020, 212, 120801. [Google Scholar] [CrossRef]
  37. O’Neil, G.D. Toward single-step production of functional electrochemical devices using 3D printing: Progress, challenges, and opportunities. Curr. Opin. Electrochem. 2020, 20, 60–65. [Google Scholar] [CrossRef]
  38. Hannah, S.; Blair, E.; Corrigan, D.K. Developments in microscale and nanoscale sensors for biomedical sensing. Curr. Opin. Electrochem. 2020, 23, 7–15. [Google Scholar] [CrossRef]
  39. Liu, H.; Zhao, C. Wearable electrochemical sensors for noninvasive monitoring of health—A perspective. Curr. Opin. Electrochem. 2020, 23, 42–46. [Google Scholar] [CrossRef]
  40. Li, R.T.; Kling, S.R.; Salata, M.J.; Cupp, S.A.; Sheehan, J.; Voos, J.E. Wearable Performance Devices in Sports Medicine. Sports Health 2016, 8, 74–78. [Google Scholar] [CrossRef] [Green Version]
  41. Ely, M.R.; Ely, B.R.; Chinevere, T.D.; Lacher, C.P.; Lukaski, H.C.; Cheuvront, S.N. Evaluation of the Megaduct sweat collector for mineral analysis. Physiol. Meas. 2012, 33, 385–394. [Google Scholar] [CrossRef]
  42. Bandodkar, A.J.; Jeang, W.J.; Ghaffari, R.; Rogers, J.A. Wearable Sensors for Biochemical Sweat Analysis. Annu. Rev. Anal. Chem. 2019, 12, 1–22. [Google Scholar] [CrossRef] [Green Version]
  43. Fiehn, O. Metabolomics—The link between genotypes and phenotypes. Plant. Mol. Biol. 2002, 48, 155–171. [Google Scholar] [CrossRef] [PubMed]
  44. Barroso, M.; Gallardo, E.; Vieira, D.N.; Queiroz, J.A.; Lopez-Rivadulla, M. Bioanalytical procedures and recent developments in the determination of opiates/opioids in human biological samples. Anal. Bioanal. Chem. 2011, 400, 1665–1690. [Google Scholar] [CrossRef] [PubMed]
  45. Kintz, P.; Samyn, N. Unconventional samples and alternative matrices. In Forensic Science—Handbook of Analytical Separations; Bogusz, M.J., Ed.; Elsevier Science BV: Amsterdam, The Netherlands, 2000; pp. 459–488. [Google Scholar]
  46. Huestis, M.A.; Oyler, J.M.; Cone, E.J.; Wstadik, A.T.; Schoendorfer, D.; Joseph, R.E. Sweat testing for cocaine, codeine and metabolites by gas chromatography—Mass spectrometry. J. Chromatogr. B 1999, 733, 247–264. [Google Scholar] [CrossRef]
  47. Harshman, S.W.; Pitsch, R.L.; Smith, Z.K.; O’Connor, M.L.; Geier, B.A.; Qualley, A.V.; Schaeublin, N.M.; Fischer, M.V.; Eckerle, J.J.; Strang, A.J.; et al. The proteomic and metabolomic characterization of exercise-induced sweat for human performance monitoring: A pilot investigation. PLoS ONE 2018, 13, e0203133. [Google Scholar] [CrossRef] [PubMed] [Green Version]
  48. Harshman, S.W.; Pitsch, R.L.; Schaeublin, N.M.; Smith, Z.K.; Strayer, K.E.; Phelps, M.S.; Qualley, A.V.; Cowan, D.W.; Rose, S.D.; O’Connor, M.L.; et al. Metabolomic stability of exercise-induced sweat. J. Chromatogr. B Anal. Technol. Biomed. Life Sci. 2019, 1126, 121763. [Google Scholar] [CrossRef]
  49. Harshman, S.W.; Strayer, K.E.; Davidson, C.N.; Pitsch, R.L.; Narayanan, L.; Scott, A.M.; Schaeublin, N.M.; Wiens, T.L.; Phelps, M.S.; O’Connor, M.L.; et al. Rate normalization for sweat metabolomics biomarker discovery. Talanta 2021, 223, 121797. [Google Scholar] [CrossRef]
  50. Baker, L.B. Sweating Rate and Sweat Sodium Concentration in Athletes: A Review of Methodology and Intra/Interindividual Variability. Sports Med. 2017, 47, 111–128. [Google Scholar] [CrossRef] [Green Version]
  51. Rowe, S.M.; Accurso, F.; Clancy, J.P. Detection of cystic fibrosis transmembrane conductance regulator activity in early-phase clinical trials. Proc. Am. Thorac. Soc. 2007, 4, 387–398. [Google Scholar] [CrossRef]
  52. Oncescu, V.; O’Dell, D.; Erickson, D. Smartphone based health accessory for colorimetric detection of biomarkers in sweat and saliva. Lab Chip 2013, 13, 3232–3238. [Google Scholar] [CrossRef]
  53. LeGrys, V.A. Sweat testing for the diagnosis of cystic fibrosis: Practical considerations. J. Pediatr. 1996, 129, 892–897. [Google Scholar] [CrossRef]
  54. Heeley, M.E.; Woolf, D.A.; Heeley, A.F. Indirect measurements of sweat electrolyte concentration in the laboratory diagnosis of cystic fibrosis. Arch. Dis. Child. 2000, 82, 420–424. [Google Scholar] [CrossRef] [PubMed] [Green Version]
  55. Beauchamp, M.; Lands, L.C. Sweat-testing: A review of current technical requirements. Pediatr. Pulmonol. 2005, 39, 507–511. [Google Scholar] [CrossRef] [PubMed]
  56. Guidelines for the Performance of the Sweat Test for the Investigation of Cystic Fibrosis in the UK. Available online: http://www.exeterlaboratory.com/images/sweat-guideline-v2-1.pdf (accessed on 12 April 2022).
  57. Schneider, S.; Ait, M.B.Z.; Schummer, C.; Lemmer, P.; Yegles, M.; Appenzeller, B.; Wennig, R. Determination of fentanyl in sweat and hair of a patient using transdermal patches. J. Anal. Toxicol. 2008, 32, 260–264. [Google Scholar] [CrossRef]
  58. Dziedzic, C.E.; Ross, M.L.; Slater, G.J.; Burke, L.M. Variability of measurements of sweat sodium using the regional absorbent-patch method. Int. J. Sports Physiol. Perform. 2014, 9, 832–838. [Google Scholar] [CrossRef]
  59. Baker, L.B.; Stofan, J.R.; Hamilton, A.A.; Horswill, C.A. Comparison of regional patch collection vs. whole body washdown for measuring sweat sodium and potassium loss during exercise. J. Appl. Physiol. 2009, 107, 887–895. [Google Scholar] [CrossRef] [PubMed] [Green Version]
  60. Nunes, M.J.; Moura, J.G.M.; Noronha, J.P.; Branco, L.C.; Cordas, C.M. Screening of potential stress biomarkers in sweat associated with sports training. Sports Med.-Open 2021, 7, 8. [Google Scholar] [CrossRef]
  61. 2002/657/EC: Commission Decision of 12 August 2002 Implementing Council Directive 96/23/EC Concerning the Performance of Analytical Methods and the Interpretation of Results (Text with EEA Relevance) (Notified under Document Number C(2002) 3044)—Publications Office of the EU. Available online: https://op.europa.eu/en/publication-detail/-/publication/ed928116-a955-4a84-b10a-cf7a82bad858/language-en (accessed on 4 November 2020).
  62. MacArthur, R.; Von Holst, C. A protocol for the validation of qualitative methods of detection. Anal. Methods 2012, 4, 2744–2754. [Google Scholar] [CrossRef]
  63. Magnusson, B.; Örnemark, U. Eurachem Guide: The Fitness for Purpose of Analytical Methods—A Laboratory Guide to Method Validation and Related Topics, 2nd ed.; Eurachem: Windsor, UK, 2014; ISBN 9789187461590. [Google Scholar]
  64. General Requirements for the Competence of Testing and calibration Laboratories; ISO/IEC 17025:2017; ISO: Geneva, Switzerland, 2017.
  65. Hussain, J.N.; Mantri, N.; Cohen, M.M. Working up a good sweat—The challenges of standardising sweat collection for metabolomics analysis. Clin. Biochem. Rev. 2017, 38, 13–34. [Google Scholar]
  66. Monti, J.M.; Jantos, H. The roles of dopamine and serotonin, and of their receptors, in regulating sleep and waking. Prog. Brain Res. 2008, 172, 625–646. [Google Scholar] [CrossRef]
  67. Monti, J.M. Serotonin control of sleep-wake behavior. Sleep Med. Rev. 2011, 15, 269–281. [Google Scholar] [CrossRef]
  68. Heikenfeld, J.; Jajack, A.; Feldman, B.; Granger, S.W.; Gaitonde, S.; Begtrup, G.; Katchman, B.A. Accessing analytes in biofluids for peripheral biochemical monitoring. Nat. Biotechnol. 2019, 37, 407–419. [Google Scholar] [CrossRef] [PubMed]
  69. Cordeiro, L.M.S.; Rabelo, P.C.R.; Moraes, M.M.; Teixeira-Coelho, F.; Coimbra, C.C.; Wanner, S.P.; Soares, D.D. Physical exercise-induced fatigue: The role of serotonergic and dopaminergic systems. Braz. J. Med. Biol. Res. 2017, 50, e6432. [Google Scholar] [CrossRef] [PubMed]
  70. Bergman, A.L.; Christopher, M.S.; Bowen, S. Changes in Facets of Mindfulness Predict Stress and Anger Outcomes for Police Officers. Mindfulness 2016, 7, 851–858. [Google Scholar] [CrossRef]
Figure 1. Schema of biological-fluid analysis.
Analytica 03 00013 g001
Figure 2. Sweat ion chromatograms for (a) DA and its metabolites (DOPAC, 3-MT and HVA); (b) 5-HT and its metabolite 5-HIAA; (c) E and NE; (d) Cor and (e) Phe, Tryp, and Tyr.
Analytica 03 00013 g002
Figure 3. Box-whisker plot of the peak area of potential-biomarker analysis by LC-MS/MS of volunteer sweat samples for each sampling mode; patch sampling during rest on chest and back body zones (PR-Chest and PR-Back), patch sampling during exercise on chest and back body zones (PE-Chest and PE-Back) and vial sampling after exercise on chest and back body zones (VE-Chest and VE-Back); for (a) Phe, (b) Tyr, (c)Tryp, (d) 3-MT, (e)HVA, (f) Cortisol, (g) 5-HT, (h)5-HIAA and (i) E.
Analytica 03 00013 g003
Table 1. LC-MS/MS operational conditions.
LC
UHPLC pre-column
UHPLC column
Security GuardTM Ultra Holder (AJO-9000 Phenomenex®, Germany)
AccuroreTM RP-MS Column (2.6 µm, 150 × 2.1 mm, Thermo Fisher Scientific)
Column temperature25 °C
Flow rate0.25 mL min−1
Mobile phase(A) H2O: 0.1% Formic acid (V/V)
(B) Acetonitrile
Equilibration B: 15% (5 min) Elution B: 0–1 min (15–80%); 1–2 min (80%); 2–6 min (80–90%); 6–7 min (90%); 7–7.5 min (90–50%); 7.5–8 min (50–15%); 8–20 min (15%)
Injection volume10 µL
MS/MS
Ionisation Source
Ion-spray voltage
Vaporiser temperature
Capillary temperature
ESI positive and negative
Positive (3500 V) and Negative (2500 V) 320 °C
325 °C
Table 2. Instrumentation MS/MS conditions for the targeted biomarkers. Biomarker, retention time (RT), ESI operation mode, precursor ion (m/z) and product-fragment ions (m/z), signal (NL) and collision energy (eV).
BiomarkerRTESI ModePrecursor Ion (m/z)Fragment Ions (m/z)SignalCollision Energy (eV)
Major NTs
Ach1.59+14660/8710310/19
Biological amines and metabolites
DA1.59+15491/1371024
DOPAC (DA Met)1.07-167122/123/14910210
3-MT (DA Met)1.6+168119/121/15110410
HVA (DA Met)1.61-181122/13710210
E1.61+184.1106/16610312/21
NE4.23+170107/13510224/15
5-HT1.27+177115/1601034
5-HIAA (5-HT Met)1.6-190146/17210313
Amino acids
Glu1.57+14884/13010510
Purines
Ade1.59+268136/17010312
Other biomarkers
Amino acids precursors of biological amines
Phe1.6+166.177/103/120/14910710
Trp2.02+205.2118/144/146/159/18810610
Tyr1.59+182105/119/123/136/16510610
Amino acids
Crea1.59+132.143.3/90.210410
Gln1.32+14784/85/103/121/13010510
His1.32+15656/83/93/95/11010510
Ile1.59+13269/86.2/115.210510
Leu1.59+132.186/115.310710
Lys1.05+147.256/84/13010510
Carboxylic acids
Asc1.99-17587/11510323/15
Lacta1.58-8943/8710610
Carbohydrates
Gluc1.58-17959/71/8910510
Breakdown product
Creat1.31+11444.3/8610310
Steroid hormones
Cor1.59+363.1121/309/32710410
Cort1.6+361163/34310410
St—Analytical Standard analysed by LC-MS/MS.
Table 3. Potential stress-biomarker molecules with relevant variations with the physical condition—comparison between rest and exercise in blood and/or sweat (↑ increase, decrease, in comparison with rest, - data not available or inconclusive).
BiofluidBloodSweat
Physical ConditionVariation from Rest to ExerciseVariation from Rest to Exercise
Major NTs
Biological amines and metabolites
DA-
DOPAC (DA Met)-
3-MT (DA Met)-
HVA (DA Met)-
NE-
5-HT-
5-HIAA (5-HT Met)--
Other biomarkers
Amino-acid precursors of biogenic amines
Phe
Tryp
Tyr
Breakdown product
Creat-
Steroid hormones
Cor-
Publisher’s Note: MDPI stays neutral with regard to jurisdictional claims in published maps and institutional affiliations.

