
Quantification of PD-1/PD-L1 Interaction between Membranes from PBMCs and Melanoma Samples Using Cell Membrane Microarray and Time-Resolved Förster Resonance Energy Transfer

 , , and
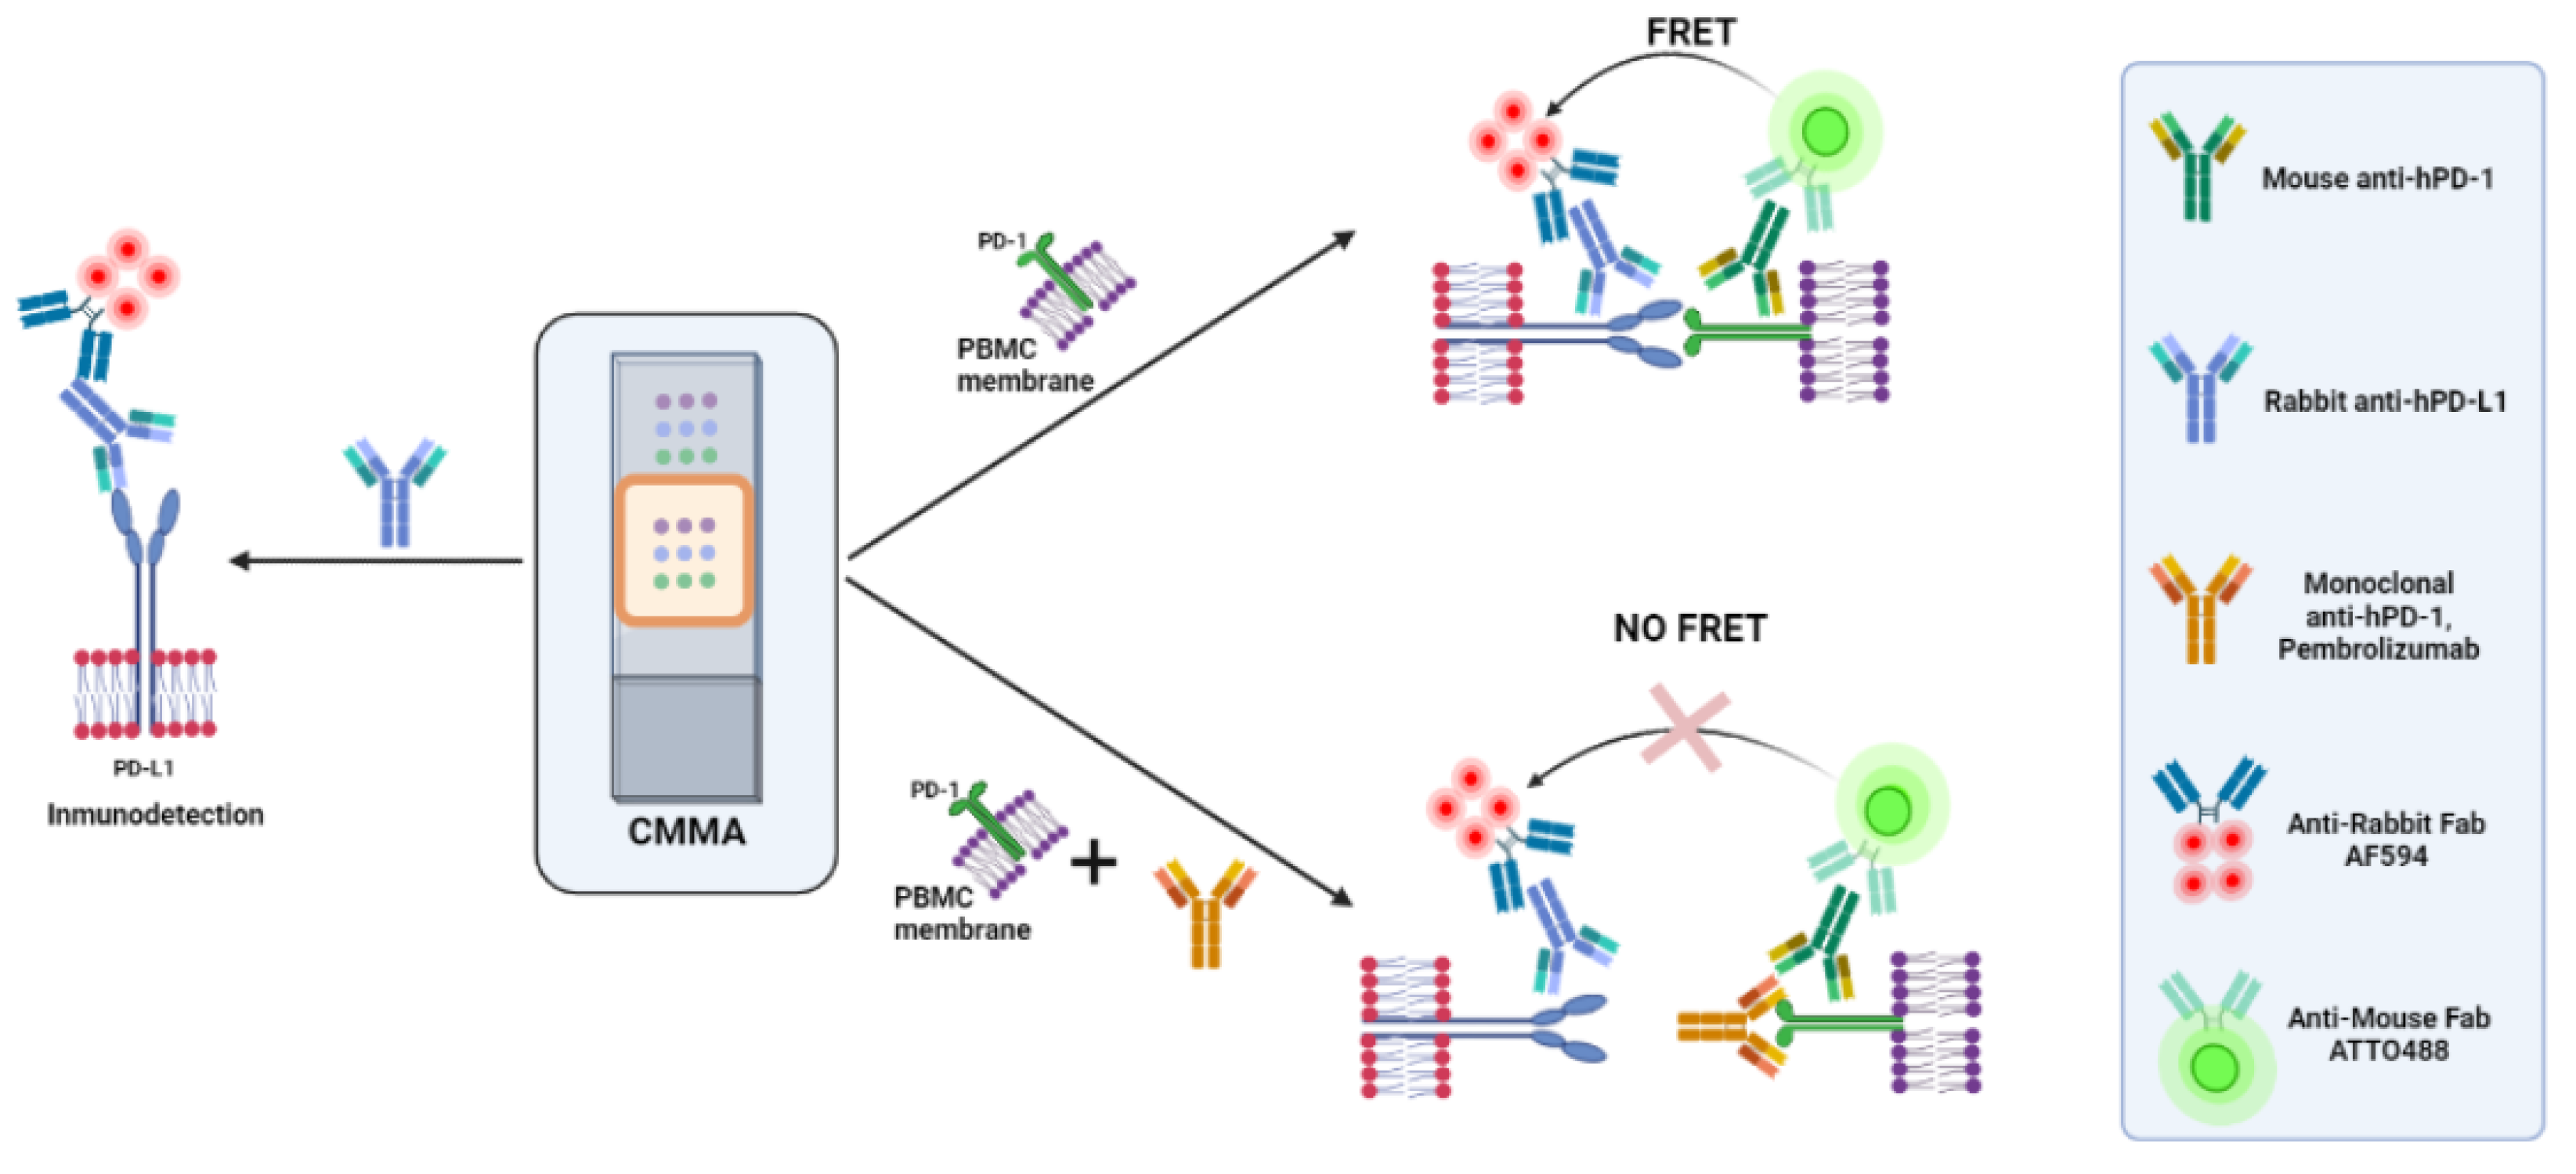
Abstract
:1. Introduction
2. Materials and Methods
2.1. Antibodies and Reagents
2.2. Tissue Samples and Reagents
2.3. Cell Membrane Microarray
2.4. Time-Resolved Immune-Amplified Förster Resonance Energy Transfer (iFRET) Detected by Fluorescence Lifetime Imaging Microscopy (FLIM)
2.5. FRET-FLIM Assay for PD-1/PD-L1 Interaction in Cell Membrane Microarrays
2.6. Data Normalization
2.7. Data Analysis
3. Results
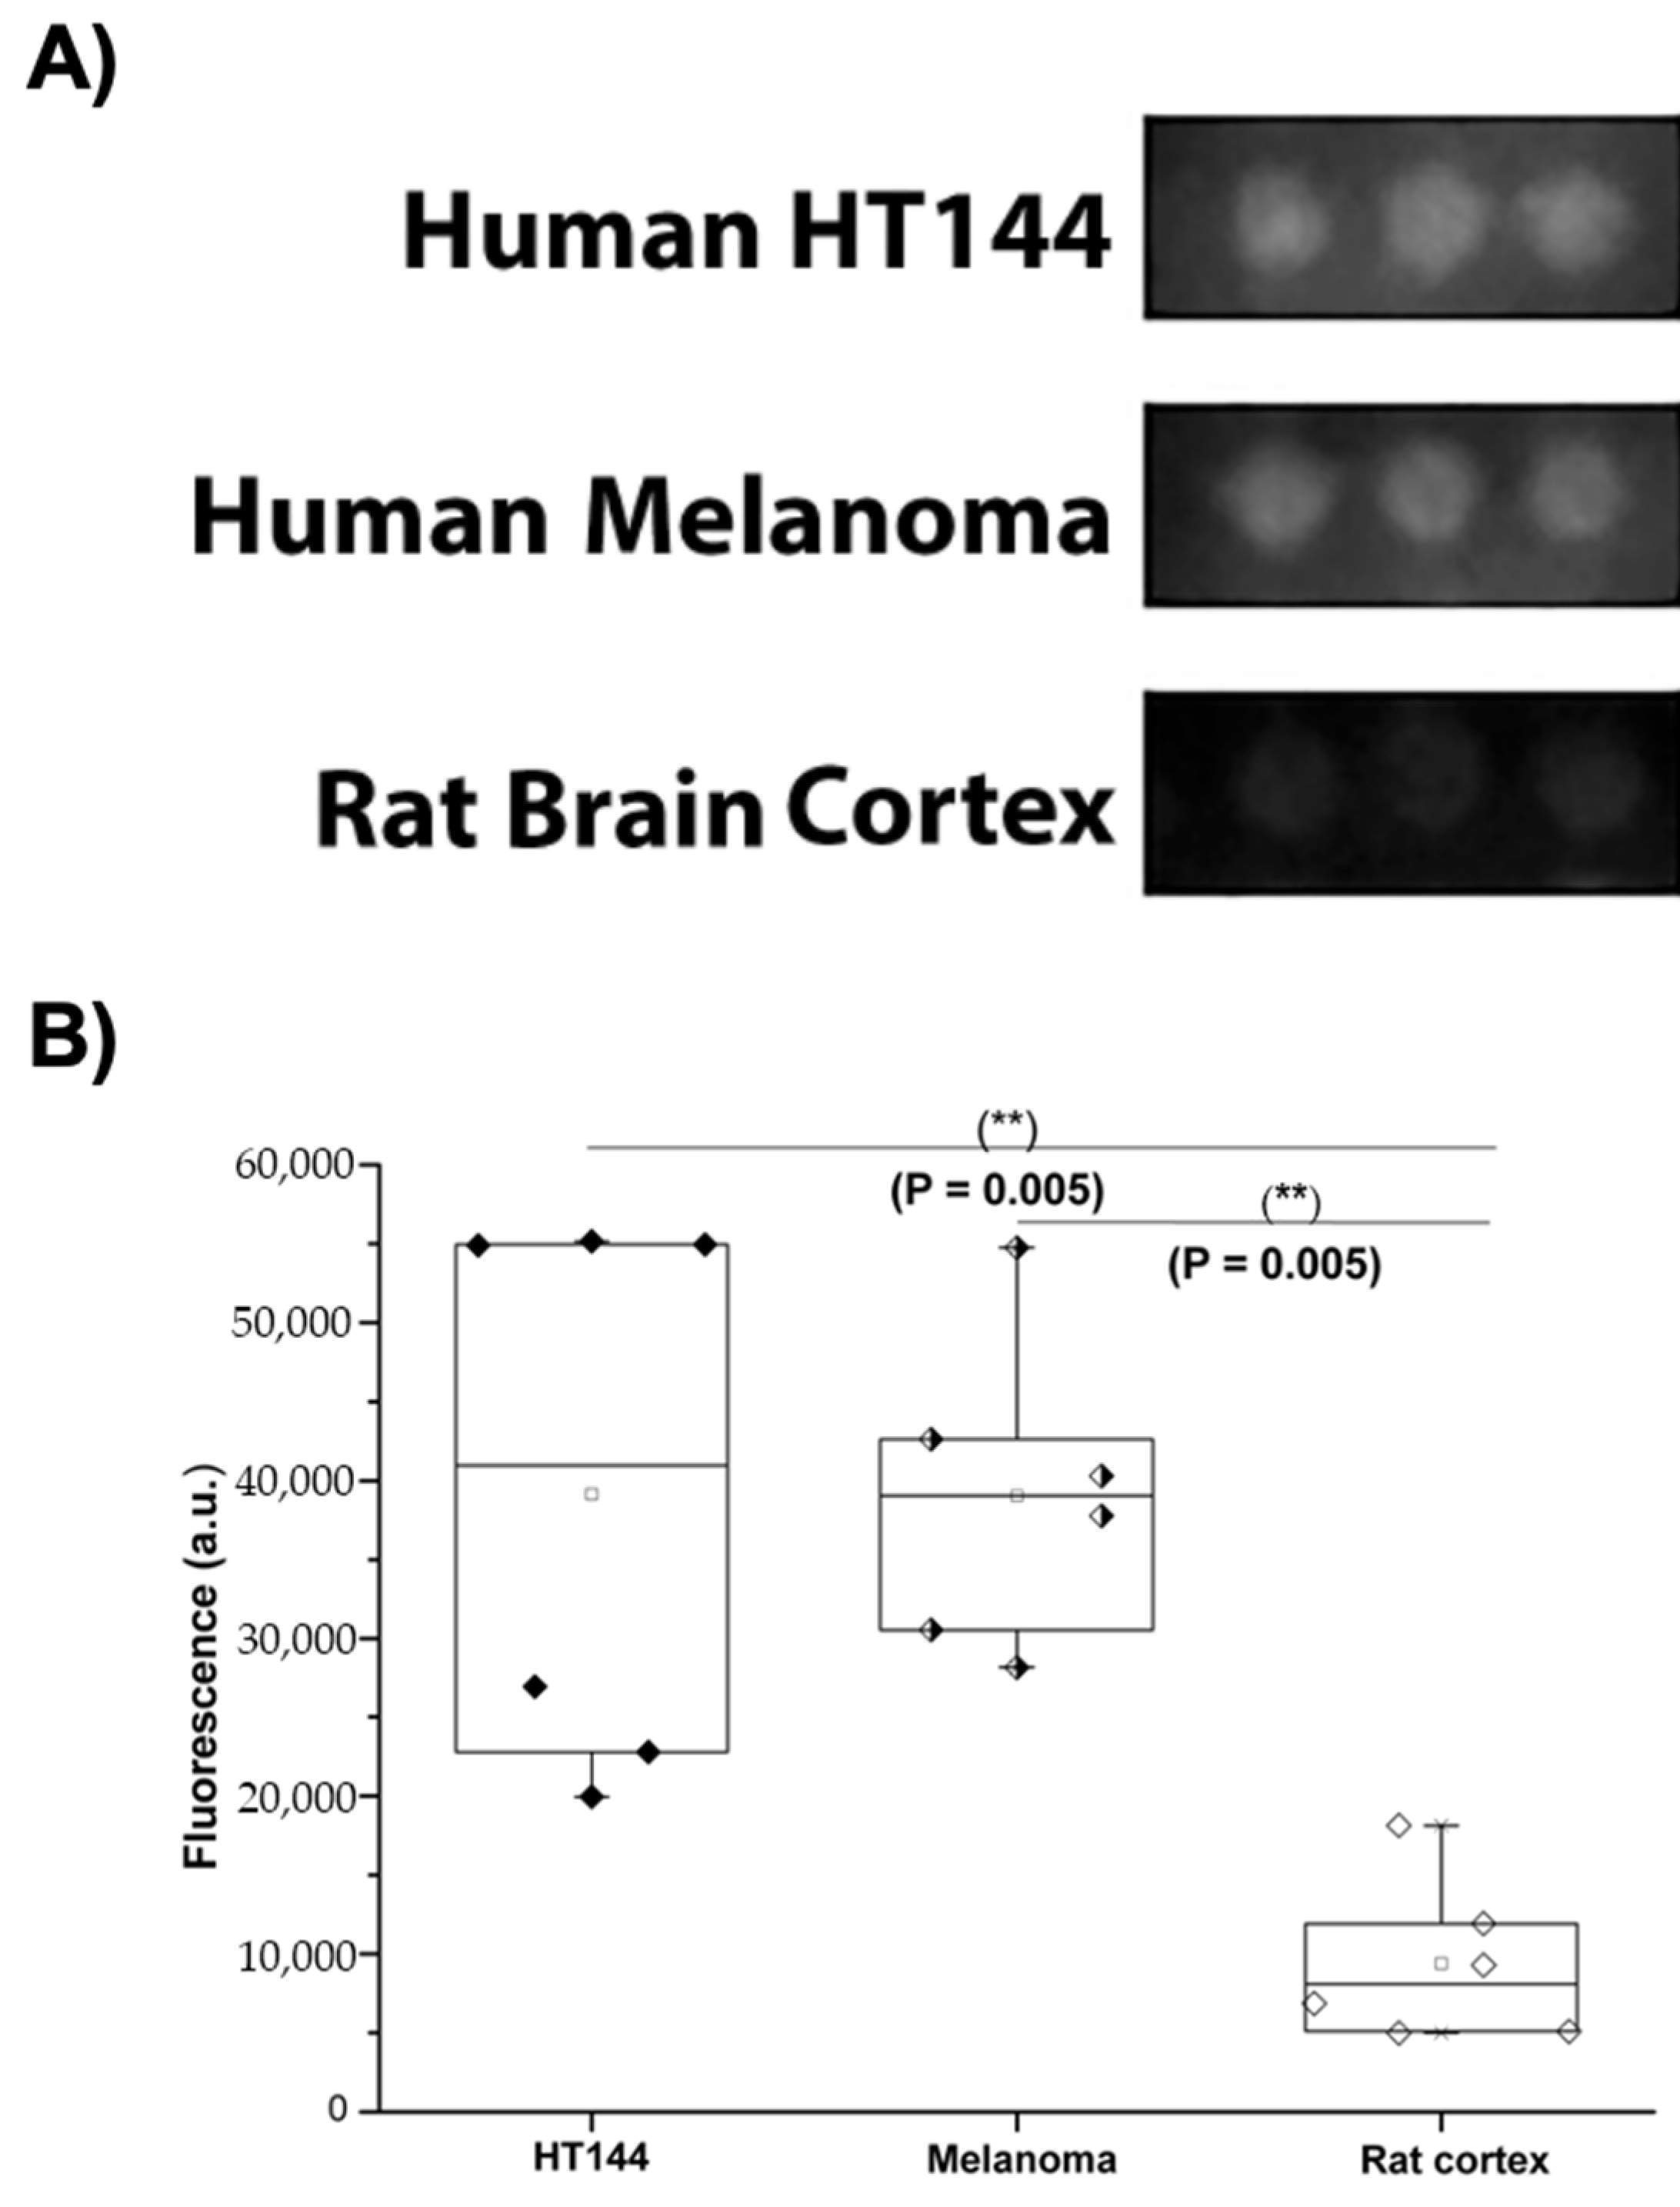
3.1. PD-L1 Is Expressed in Melanoma and HT144 Cell Membranes
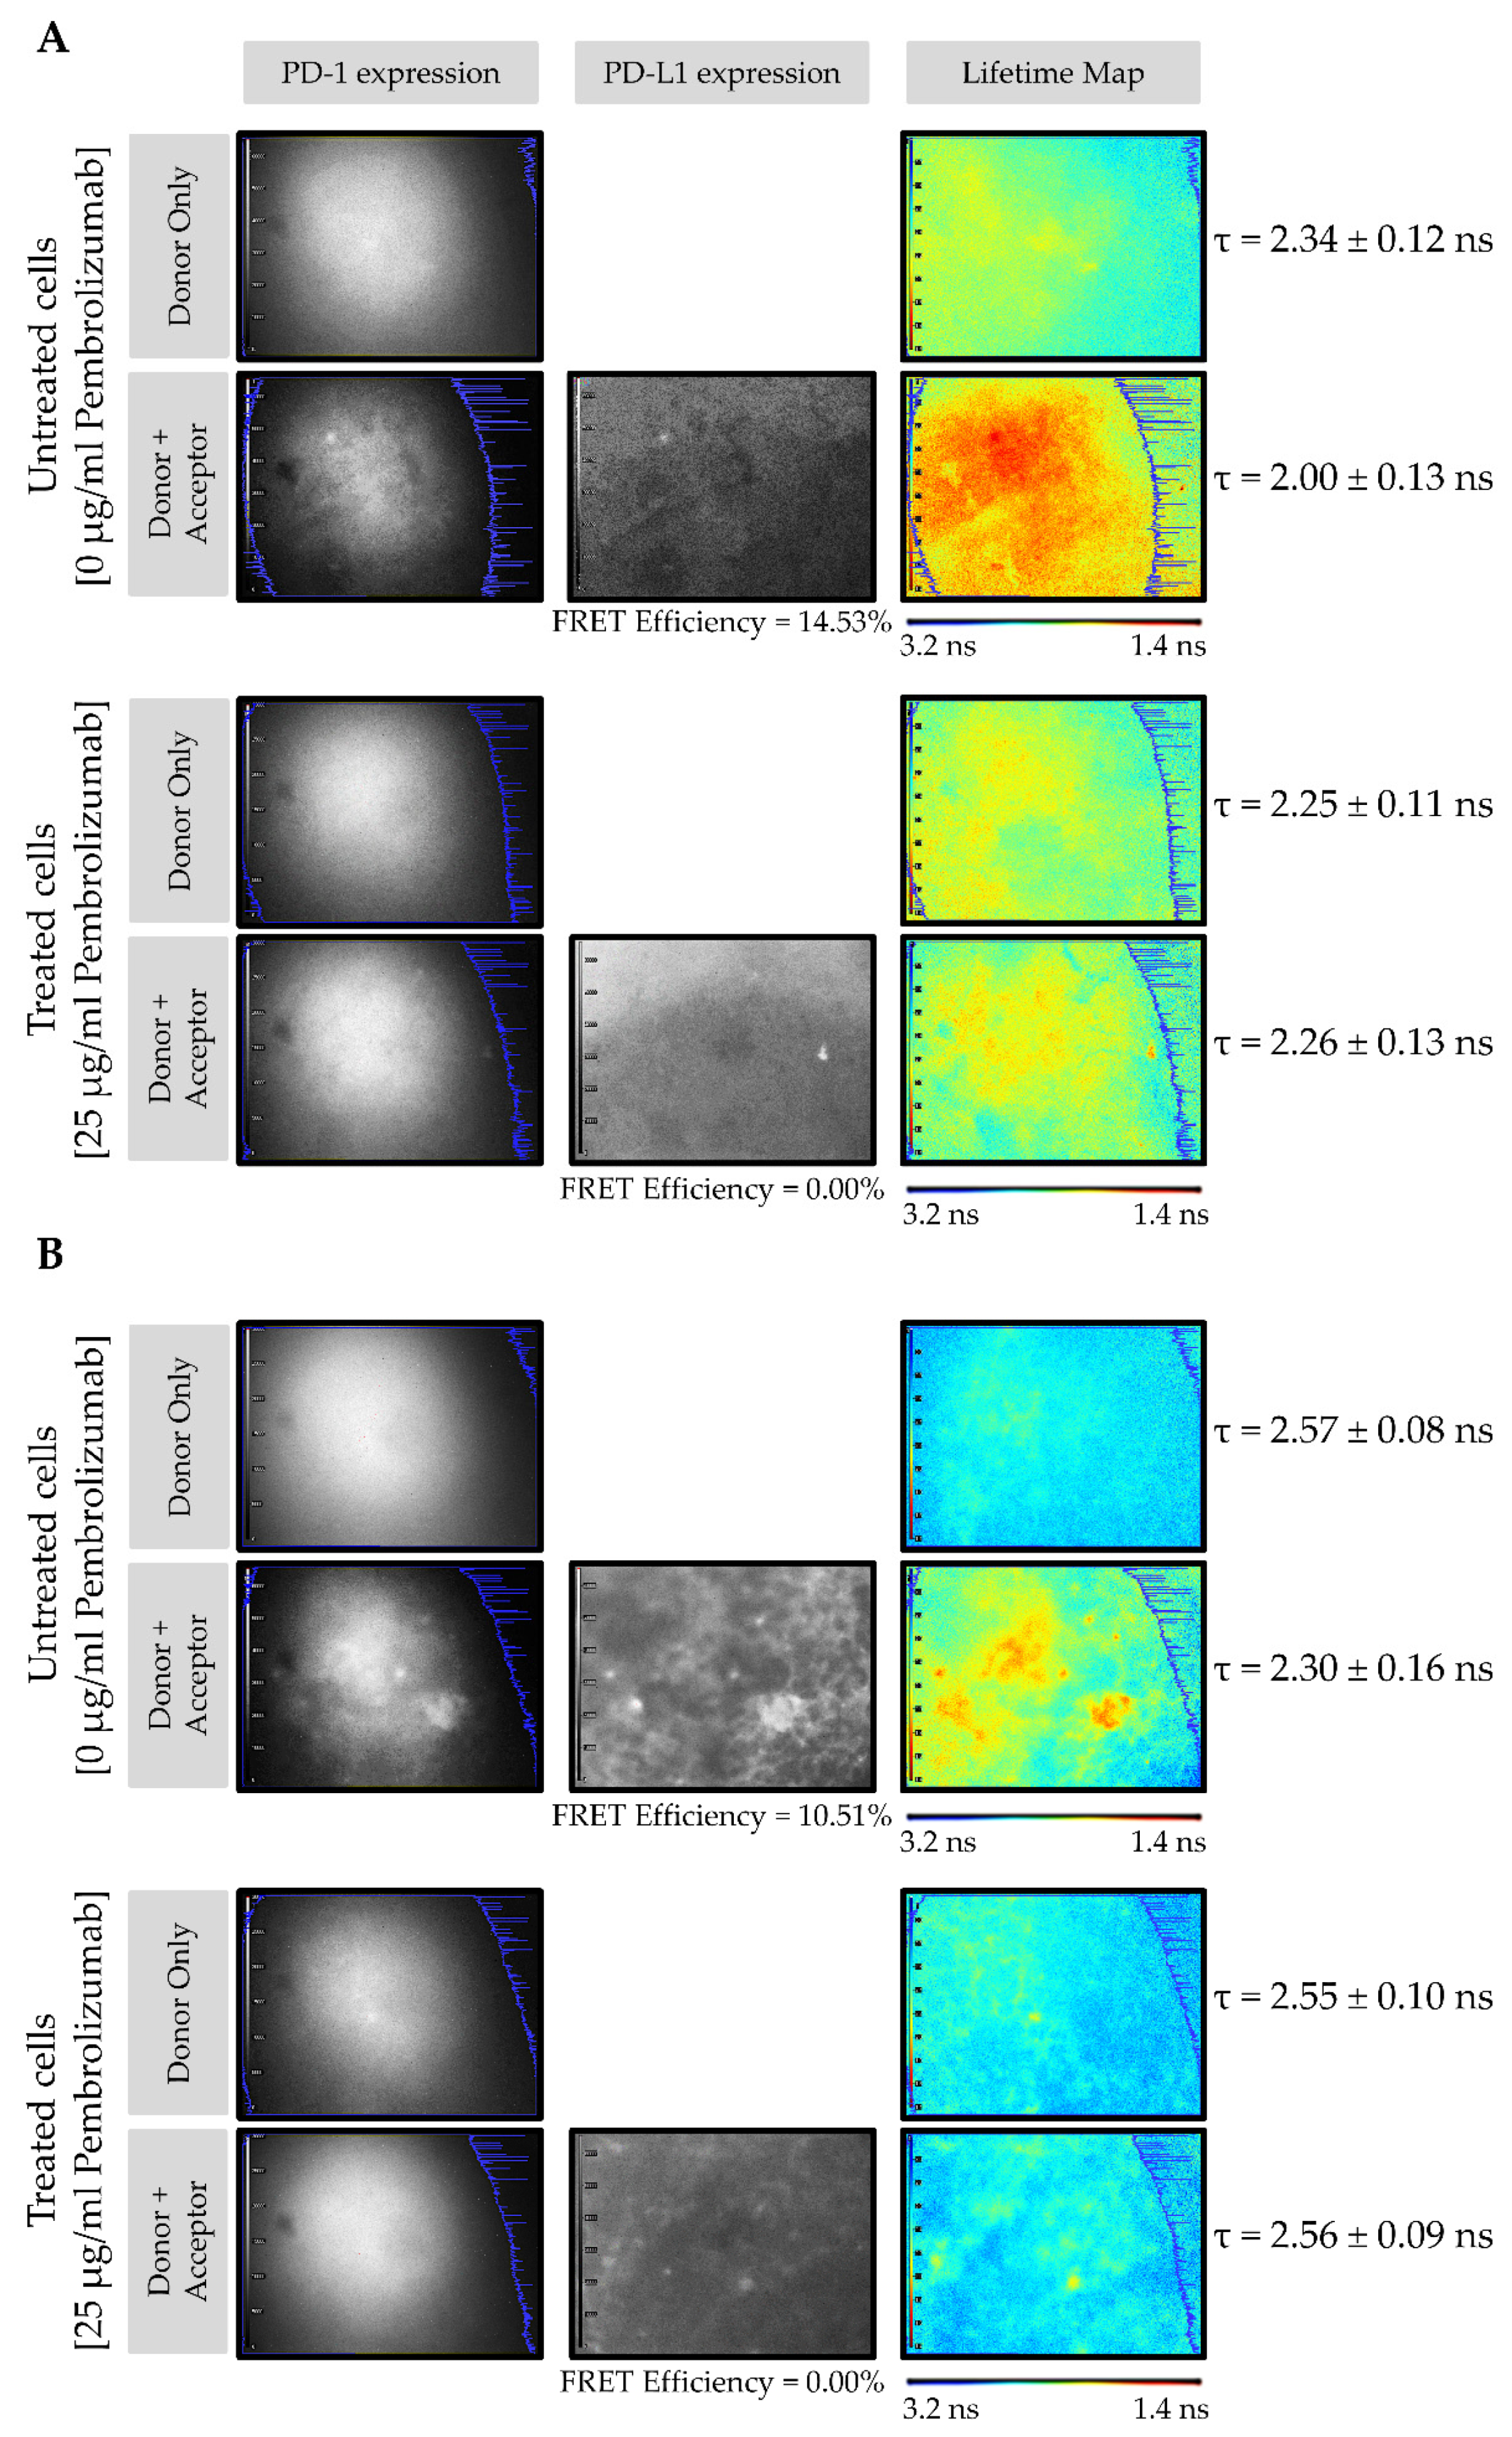
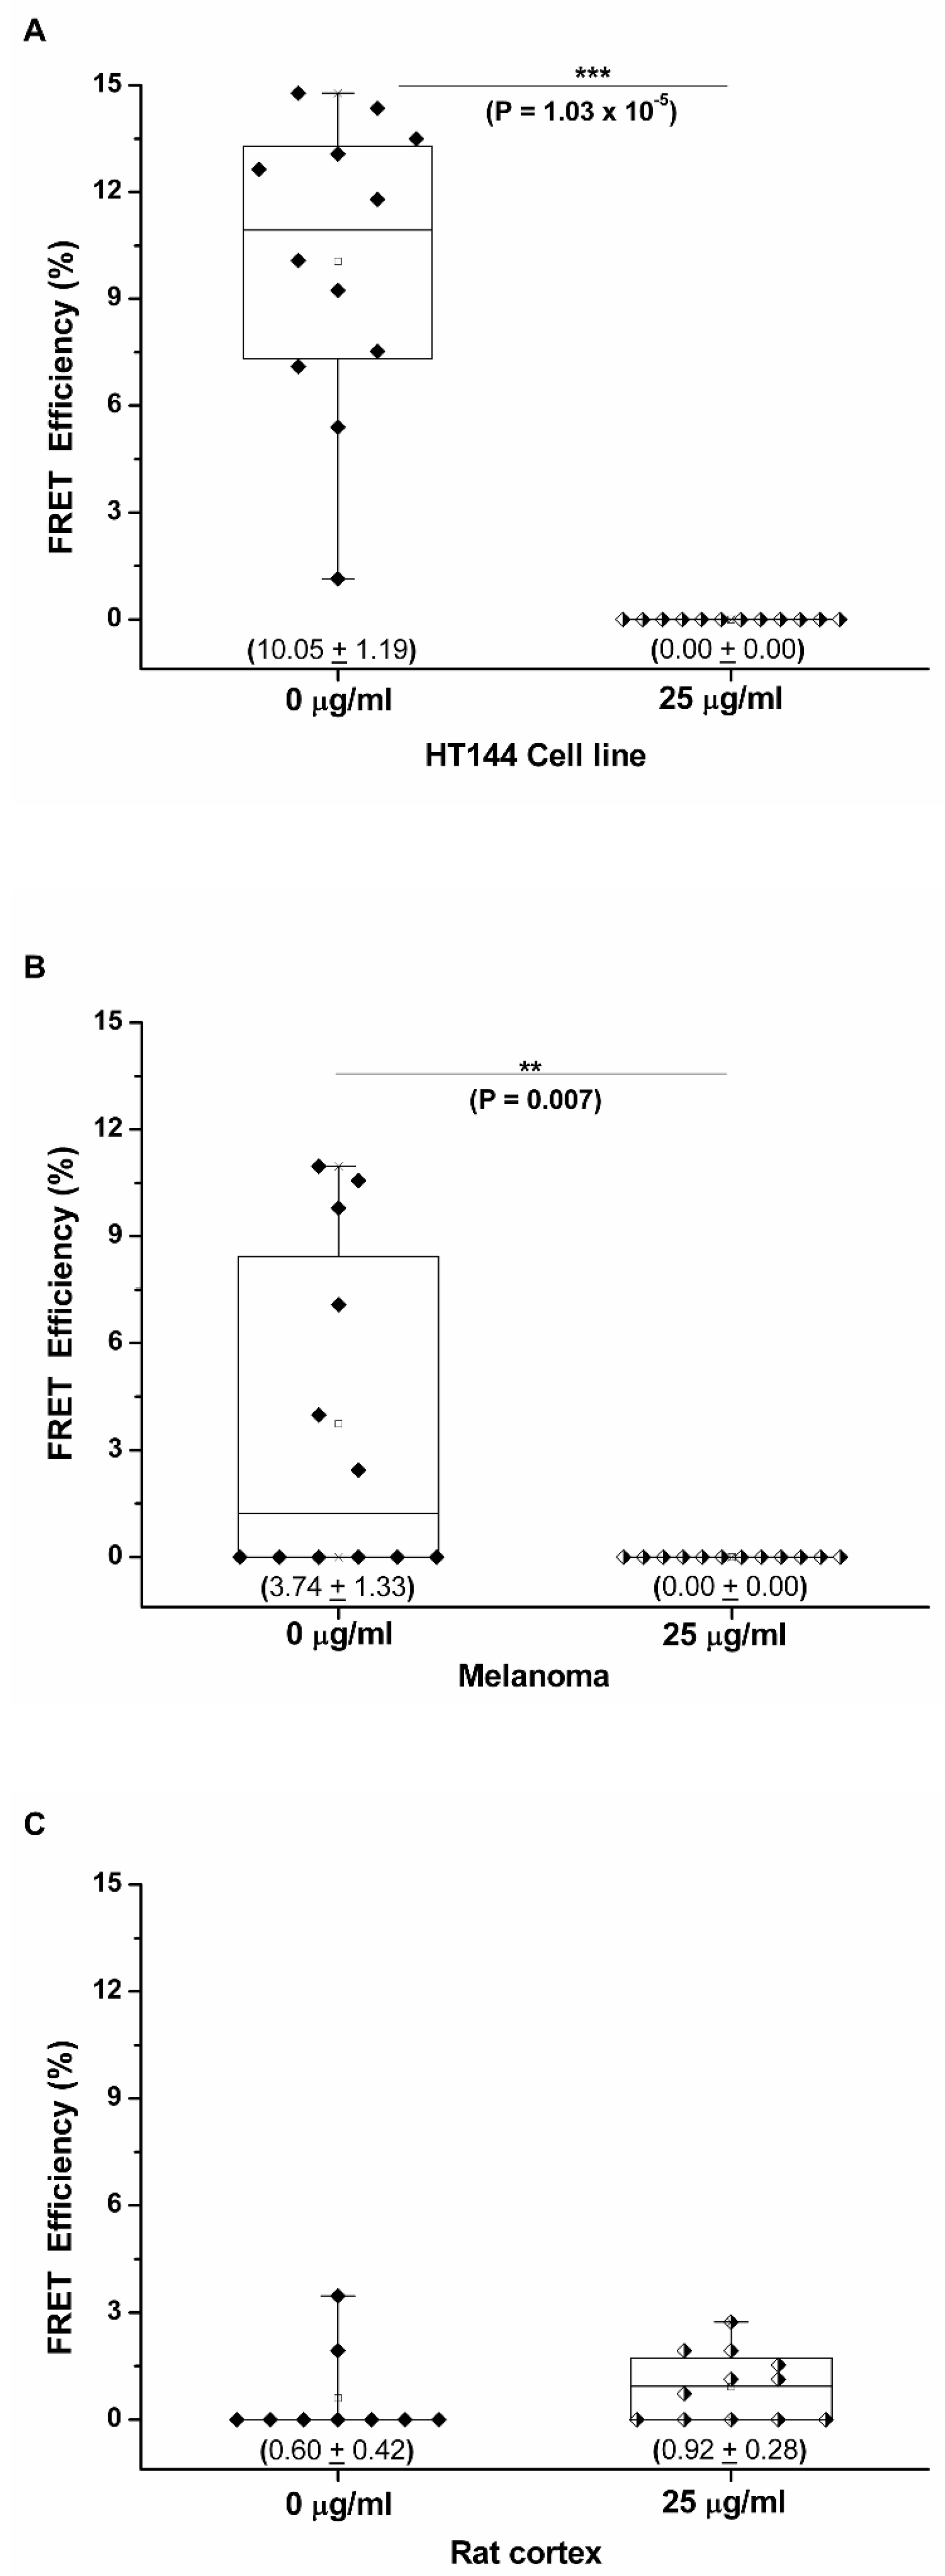
3.2. PD-1/PD-L1 Specific Interaction Is Quantified in CMMAs Incubated with PBMC Membranes Using iFRET
4. Discussion
5. Conclusions
Author Contributions
Funding
Institutional Review Board Statement
Informed Consent Statement
Data Availability Statement
Acknowledgments
Conflicts of Interest
Appendix A


References
- Okazaki, T.; Maeda, A.; Nishimura, H.; Kurosaki, T.; Honjo, T. PD-1 immunoreceptor inhibits B cell receptor-mediated signaling by recruiting src homology 2-domain-containing tyrosine phosphatase 2 to phosphotyrosine. Proc. Natl. Acad. Sci. USA 2001, 98, 13866–13871. [Google Scholar] [CrossRef] [Green Version]
- Ding, H.; Wu, X.; Gao, W. PD-L1 is expressed by human renal tubular epithelial cells and suppresses T cell cytokine synthesis. Clin. Immunol. 2005, 115, 184–191. [Google Scholar] [CrossRef]
- Carbone, D.P.; Gandara, D.R.; Antonia, S.J.; Zielinski, C.; Paz-Ares, L. Non-Small-Cell Lung Cancer:Role of the Immune System and Potential for Immunotherapy. J. Thorac. Oncol. 2015, 10, 974–984. [Google Scholar] [CrossRef] [Green Version]
- Nunes-Xavier, C.E.; Angulo, J.C.; Pulido, R.; López, J.I. A Critical Insight into the Clinical Translation of PD-1/PD-L1 Blockade Therapy in Clear Cell Renal Cell Carcinoma. Curr. Urol. Rep. 2019, 20, 1. [Google Scholar] [CrossRef]
- Bagchi, S.; Yuan, R.; Engleman, E.G. Immune Checkpoint Inhibitors for the Treatment of Cancer: Clinical Impact and Mechanisms of Response and Resistance. Annu. Rev. Pathol. 2021, 16, 223–249. [Google Scholar] [CrossRef]
- Simeone, E.; Ascierto, P.A. Anti-PD-1 and PD-L1 antibodies in metastatic melanoma. Melanoma Manag. 2017, 4, 175–178. [Google Scholar] [CrossRef]
- Angulo, J.C.; Shapiro, O. The Changing Therapeutic Landscape of Metastatic Renal Cancer. Cancers 2019, 11, 1227. [Google Scholar] [CrossRef] [Green Version]
- Nunes-Xavier, C.E.; Zaldumbide, L.; Aurtenetxe, O.; López-Almaraz, R.; López, J.I.; Pulido, R. Dual-Specificity Phosphatases in Neuroblastoma Cell Growth and Differentiation. Int. J. Mol. Sci. 2019, 20, 1170. [Google Scholar] [CrossRef] [Green Version]
- Stenzel, P.J.; Schindeldecker, M.; Tagscherer, K.E.; Foersch, S.; Herpel, E.; Hohenfellner, M.; Hatiboglu, G.; Alt, J.; Thomas, C.; Haferkamp, A.; et al. Prognostic and Predictive Value of Tumor-infiltrating Leukocytes and of Immune Checkpoint Molecules PD1 and PDL1 in Clear Cell Renal Cell Carcinoma. Transl. Oncol. 2020, 13, 336–345. [Google Scholar] [CrossRef]
- Ribas, A.; Hamid, O.; Daud, A.; Hodi, F.S.; Wolchok, J.D.; Kefford, R.; Joshua, A.; Patnaik, A.; Hwu, W.-J.; Weber, J.; et al. Association of Pembrolizumab with Tumor Response and Survival Among Patients with Advanced Melanoma. JAMA 2016, 315, 1600–1609. [Google Scholar] [CrossRef]
- Sánchez-Magraner, L.; Miles, J.; Baker, C.L.; Applebee, C.J.; Lee, D.-J.; Elsheikh, S.; Lashin, S.; Withers, K.; Watts, A.G.; Parry, R.; et al. High PD-1/PD-L1 Checkpoint Interaction Infers Tumor Selection and Therapeutic Sensitivity to Anti-PD-1/PD-L1 Treatment. Cancer Res. 2020, 80, 4244–4257. [Google Scholar] [CrossRef] [PubMed]
- Hebert-Chatelain, E.; Desprez, T.; Serrat, R.; Bellocchio, L.; Soria-Gomez, E.; Busquets-Garcia, A.; Zottola, A.C.P.; Delamarre, A.; Cannich, A.; Vincent, P.; et al. A cannabinoid link between mitochondria and memory. Nature 2016, 539, 555–559. [Google Scholar] [CrossRef] [PubMed]
- Fernández, R.A.; Garate, J.; Tolentino-Cortez, T.; Herraiz, A.; Lombardero, L.; Ducrocq, F.; Rodriguez-Puertas, R.; Trifilieff, P.; Astigarraga, E.; Barreda-Gómez, G.; et al. Microarray and Mass Spectrometry-Based Methodology for Lipid Profiling of Tissues and Cell Cultures. Anal. Chem. 2019, 91, 15967–15973. [Google Scholar] [CrossRef] [PubMed]
- Rienda, B.; Elexpe, A.; Tolentino-Cortez, T.; Gulak, M.; Bruzos-Cidón, C.; Torrecilla, M.; Astigarraga, E.; Barreda-Gómez, G. Analysis of Acetylcholinesterase Activity in Cell Membrane Microarrays of Brain Areas as a Screening Tool to Identify Tissue Specific Inhibitors. Analytica 2021, 2, 25–36. [Google Scholar] [CrossRef]
- Veeriah, S.; Leboucher, P.; De Naurois, J.; Jethwa, N.; Nye, E.; Bunting, T.; Stone, R.; Stamp, G.; Calleja, V.; Jeffrey, S.; et al. High-Throughput Time-Resolved FRET Reveals Akt/PKB Activation as a Poor Prognostic Marker in Breast Cancer. Cancer Res. 2014, 74, 4983–4995. [Google Scholar] [CrossRef] [Green Version]
- Pereiro, X.; Fernández, R.; Barreda-Gómez, G.; Ruzafa, N.; Acera, A.; Araiz, J.; Astigarraga, E.; Vecino, E. Comparative lipidomic analysis of mammalian retinal ganglion cells and Müller glia in situ and in vitro using High-Resolution Imaging Mass Spectrometry. Sci. Rep. 2020, 10, 20053. [Google Scholar] [CrossRef]
- Bradford, M.M. A rapid and sensitive method for the quantitation of microgram quantities of protein utilizing the principle of protein-dye binding. Anal. Biochem. 1976, 72, 248–254. [Google Scholar] [CrossRef]
- Miles, J.; Applebee, C.J.; Leboucher, P.; Lopez-Fernandez, S.; Lee, D.-J.; Guarch, R.; Ward, S.; Parker, P.; López, J.I.; Larijani, B. Time resolved amplified FRET identifies protein kinase B activation state as a marker for poor prognosis in clear cell renal cell carcinoma. BBA Clin. 2017, 8, 97–102. [Google Scholar] [CrossRef]
- Suárez, H.; Andreu, Z.; Mazzeo, C.; Toribio, V.; Pérez-Rivera, A.E.; López-Martín, S.; García-Silva, S.; Hurtado, B.; Morato, E.; Peláez, L.; et al. CD9 inhibition reveals a functional connection of extracellular vesicle secretion with mitophagy in melanoma cells. J. Extracell. Vesicles 2021, 10, e12082. [Google Scholar] [CrossRef]
- Fogh, J.; Trempe, G. New Human Tumor Cell Lines BT—Human Tumor Cells In Vitro; Fogh, J., Ed.; Springer: Boston, MA, USA, 1975; pp. 115–159. [Google Scholar] [CrossRef]
- Costantini, F.; Barbieri, G. The HLA-DR mediated signalling increases the migration and invasion of melanoma cells, the expression and lipid raft recruitment of adhesion receptors, PD-L1 and signal transduction proteins. Cell. Signal. 2017, 36, 189–203. [Google Scholar] [CrossRef]
- Yi, M.; Niu, M.; Xu, L.; Luo, S.; Wu, K. Regulation of PD-L1 expression in the tumor microenvironment. J. Hematol. Oncol. 2021, 14, 10. [Google Scholar] [CrossRef]
- Sunshine, J.C.; Nguyen, P.L.; Kaunitz, G.J.; Cottrell, T.R.; Berry, S.; Esandrio, J.; Xu, H.; Ogurtsova, A.; Bleich, K.B.; Cornish, T.C.; et al. PD-L1 Expression in Melanoma: A Quantitative Immunohistochemical Antibody Comparison. Clin. Cancer Res. 2017, 23, 4938–4944. [Google Scholar] [CrossRef] [Green Version]
- Han, Y.; Liu, D.; Li, L. PD-1/PD-L1 pathway:current researches in cancer. Am. J. Cancer Res. 2020, 10, 727–742. [Google Scholar]
- Söderberg, O.; Gullberg, M.; Jarvius, M.; Ridderstråle, K.; Leuchowius, K.-J.; Jarvius, J.; Wester, K.; Hydbring, P.; Bahram, F.; Larsson, L.-G.; et al. Direct observation of individual endogenous protein complexes in situ by proximity ligation. Nat. Methods 2006, 3, 995–1000. [Google Scholar] [CrossRef] [PubMed]
- Söderberg, O.; Leuchowius, K.-J.; Gullberg, M.; Jarvius, M.; Weibrecht, I.; Larsson, L.-G.; Landegren, U. Characterizing proteins and their interactions in cells and tissues using the in situ proximity ligation assay. Methods 2008, 45, 227–232. [Google Scholar] [CrossRef] [PubMed]
- Tu, S.; Jiang, H.-W.; Liu, C.-X.; Zhou, S.-M.; Tao, S.-C. Protein Microarrays for Studies of Drug Mechanisms and Biomarker Discovery in the Era of Systems Biology. Curr. Pharm. Des. 2014, 20, 49–55. [Google Scholar] [CrossRef]
- Wegener, J. Cell-Based Microarrays for In Vitro Toxicology. Annu. Rev. Anal. Chem. 2015, 8, 335–358. [Google Scholar] [CrossRef] [PubMed] [Green Version]
- Yang, L.; Guo, S.; Li, Y.; Zhou, S.; Tao, S. Protein microarrays for systems biology. Acta Biochim. Biophys. Sin. 2011, 43, 161–171. [Google Scholar] [CrossRef] [PubMed] [Green Version]
- Manuel, I.; Barreda-Gómez, G.; Román, E.G.D.S.; Veloso, A.; Fernandez, J.; Giralt, M.T.; Rodríguez-Puertas, R. Neurotransmitter Receptor Localization: From Autoradiography to Imaging Mass Spectrometry. ACS Chem. Neurosci. 2015, 6, 362–373. [Google Scholar] [CrossRef] [PubMed]
- Barreda-Gómez, G.; Giralt, M.; Rodriguez-Puertas, R. Effects of central galanin administration on muscarinic cholinergic and galanin receptor G protein coupling. Neuropeptides 2005, 39, 157–160. [Google Scholar] [CrossRef]
- Papon, M.-A.; Le Feuvre, Y.; Barreda-Gómez, G.; Favereaux, A.; Farrugia, F.; Bouali-Benazzouz, R.; Nagy, F.; Rodríguez-Puertas, R.; Landry, M. Spinal Inhibition of GABAB Receptors by the Extracellular Matrix Protein Fibulin-2 in Neuropathic Rats. Front. Cell. Neurosci. 2020, 14, 214. [Google Scholar] [CrossRef] [PubMed]


Publisher’s Note: MDPI stays neutral with regard to jurisdictional claims in published maps and institutional affiliations. |
© 2021 by the authors. Licensee MDPI, Basel, Switzerland. This article is an open access article distributed under the terms and conditions of the Creative Commons Attribution (CC BY) license (https://creativecommons.org/licenses/by/4.0/).
Share and Cite
Sánchez-Magraner, L.; de la Fuente, M.; Evans, C.; Miles, J.; Elexpe, A.; Rodriguez-Astigarraga, M.; Astigarraga, E.; Barreda-Gómez, G. Quantification of PD-1/PD-L1 Interaction between Membranes from PBMCs and Melanoma Samples Using Cell Membrane Microarray and Time-Resolved Förster Resonance Energy Transfer. Analytica 2021, 2, 156-170. https://doi.org/10.3390/analytica2040015
Sánchez-Magraner L, de la Fuente M, Evans C, Miles J, Elexpe A, Rodriguez-Astigarraga M, Astigarraga E, Barreda-Gómez G. Quantification of PD-1/PD-L1 Interaction between Membranes from PBMCs and Melanoma Samples Using Cell Membrane Microarray and Time-Resolved Förster Resonance Energy Transfer. Analytica. 2021; 2(4):156-170. https://doi.org/10.3390/analytica2040015
Chicago/Turabian StyleSánchez-Magraner, Lissete, Miguel de la Fuente, Charles Evans, James Miles, Ane Elexpe, Maddalen Rodriguez-Astigarraga, Egoitz Astigarraga, and Gabriel Barreda-Gómez. 2021. "Quantification of PD-1/PD-L1 Interaction between Membranes from PBMCs and Melanoma Samples Using Cell Membrane Microarray and Time-Resolved Förster Resonance Energy Transfer" Analytica 2, no. 4: 156-170. https://doi.org/10.3390/analytica2040015