Article

An Authentication Study on Grappa Spirit: The Use of Chemometrics to Detect a Food Fraud

1
Chemical Laboratory of Bologna, Anti-Fraud and Controls Office-Laboratories Section, DT VI, Italian Customs and Monopolies Agency, 40121 Bologna, Italy
2
Department of Chemistry “Giacomo Ciamician”, University of Bologna, 40126 Bologna, Italy
3
Department of Pharmacy, University “G. D’Annunzio” of Chieti-Pescara, 66100 Chieti, Italy
*
Author to whom correspondence should be addressed.
Analytica 2021, 2(3), 84-92; https://doi.org/10.3390/analytica2030010
Submission received: 27 July 2021 / Revised: 10 August 2021 / Accepted: 12 August 2021 / Published: 30 August 2021
(This article belongs to the Special Issue New Analytical Techniques and Methods in Pharmaceutical Science)

Abstract

:
An authenticity study on Italian grape marc spirit was carried out by gas chromatography (GC) and chemometrics. A grape marc spirit produced in Italy takes the particular name of “grappa”, a product which has peculiar tradition and production in its country of origin. Therefore, the evaluation of its authenticity plays an important role for its consumption in Italy, as well as for its exportation all around the world. For the present work, 123 samples of grappa and several kinds of spirits were analyzed in their alcohol content by electronic densimetry, and in their volatile fraction by gas-chromatography with a flame-ionization detector. Part of these samples (94) was employed as a training set to compute a chemometric model (by linear discriminant analysis, LDA) and the other part (29 samples) was used as a test set to validate it. Finally, two grappa samples seized from the market by the Italian Customs and Monopolies Agency and considered suspicious due to their aroma reported as non-compliant were projected onto the LDA model to evaluate the compliance with the “grappa” class. A further one-class classification method by principal component analysis (PCA) was carried out to evaluate the compliance with other classes. Results showed that the suspicious samples were not recognized as belonging to any of the analyzed spirit classes, confirming the starting hypothesis that they could be grappa samples adulterated in some way.

1. Introduction

The term “grappa” indicates a traditional Italian spirit obtained by distillation of fermented grape marc and seeds right after the winemaking process [1]. Several Italian [2] and European regulations [3,4] are focused on the definition and protection of spirit beverages across Europe. The common characteristics of spirit beverages are the alcohol content, which has to be higher than 15%V/V, and the suitability for human consumption; however, each spirit can be produced with different processes and from different raw materials [5]. The grape marc spirit can be denominated “grappa” only if grapes are cultivated and processed in Italy [2], otherwise, it can assume other denominations, such as the Spanish “orujo”, the Greek “tsipouro”, the Portuguese “bagaçeira”, or the French “eau-de-vie de marc”.
The Regulation (EU) 2019/787 [3] defines other categories of spirits as those obtained by distillation of, for example, wine (“wine spirit”, that can be called “brandy” if aged for at least six months in oak casks), the fermented mash of grain (“grain spirit”), fruit (e.g., “apple spirit” and “pear spirit”), but also honey, cider, beer, and other agri-food products.
The volatile fraction of spirit alcoholic beverages has been extensively studied by gas-chromatography (GC) [6,7,8]. However, only few studies were focused on grappa, most of which evaluated the chemical compounds responsible for the aroma [9,10,11] or the changes due to aging [12] by GC coupled with mass-spectrometry (GC-MS). In order to protect the uniqueness of grappa, which is often produced by small and family-run distilleries, that cannot commercially compete with the great spirit producers, some authentication works were carried out. As other spirit drinks, indeed, grappa might be adulterated by the addition of less valuable spirits or by indicating a false production origin [13], thus generating an illicit profit for the producer. Moreover, consumers are more and more interested in food authenticity, due to the health problems that a not-genuine product might cause. Therefore, many works in analytical chemistry were devoted to food authenticity in the last years [14,15,16]. In the spirit-beverages field, for example, GC in combination with isotope ratio mass spectrometry [17] as well as infrared spectroscopy [13,18] have been applied for authentication purposes, in combination with chemometrics.
The chemometric approach has already been successfully applied several times for authentication purposes [19], for example in honey [20] or saffron [21] samples. Nowadays, chemometrics is largely used in analytical research, and also the American Food and Drug Administration is starting to recommend its use in analytical procedures [22].
The present work starts from a case study. The Italian Customs and Monopolies Agency (Agenzia delle Dogane e Monopoli) seized a batch of bottles of spirit labeled as “Italian grappa”; however, some suspicions arose about the authenticity of such products, due to the flavor of the spirit not compliant with the usual one perceived by some consumers. Therefore, the chemical law parameters of the suspicious samples were analyzed and compared to those of other grappa samples. Some other classes of spirits that can be used to adulterate the grappa were analyzed in the same way. Thus, a multivariate classification model was computed and validated to predict the belonging spirit-class of the suspicious samples.

2. Materials and Methods

2.1. Samples

Besides two samples of the suspicious batch, 123 spirit samples were analyzed. Ninety-four of them were used to calculate the chemometric model (training-set, TrS) and the remaining 29, independent from the TrS, were used for the model validation (test-set, TeS). The TrS was composed of 30 grappa samples, 25 wine spirits, 13 grain spirits, 13 pear spirits, and 13 apple spirits. The TeS was composed of 13 grappa samples, 10 wine spirits, 2 pear spirits, 2 apple spirits, and 2 grain spirits.

2.2. Chemical Analyses

All samples were analyzed by the Customs Chemical Laboratory of Bologna following the official methods established by the European Commission [4] and validated by other scientific works [6,23].
The actual alcoholic strength by volume was obtained by first distilling 200 mL of the samples through a digital oenological distiller SUPER DEE (Gibertini Elettronica s.r.l., Milan, Italy) and then measuring the volume percentage of alcohol in the distillate by a densimeter DMA 4500 (Anton Paar GmbH, Graz, Austria).
Volatile substances were determined by GC with a flame-ionization detector (GC-FID). Ten molecules were quantified: 1,1-diethoxyethane (acetal, as reported in the official method), 2-methylbutan-1-ol (active amyl alcohol), 3-methylbutan-1-ol (isoamyl alcohol), methanol (methyl alcohol), ethyl ethanoate (ethyl acetate), butan-1-ol (n-butanol), butan-2-ol (sec-butanol), 2-methylpropan-1-ol (isobutyl alcohol), propan-1-ol (n-propanol) and ethanal (acetaldehyde).
Quantifications were carried out by the internal standard method. Calibration lines (with concentration ratios as independent variable and signal ratios as dependent variable) were recalculated every six months by injecting the standards, and the relevant R2 were verified to be higher than 0.99. Before each analysis, a standard sample with volatile substances concentrations close to the line centroids was injected to verify the accuracy of calibration lines. For GC analyses, 9 mL of sample were mixed with 1 mL of internal standard (n-pentanol). Analyses were carried out by a GC-2010 Plus with autosampler (Shimadzu Corporation, Kyoto, Japan) equipped with a GC column DB-624, fused silica capillary 60 m × 0.25 mm i.d., and 1.40 μm film thickness (Agilent, Santa Clara, CA, USA). The carrier gas was helium, at a flow rate of 1 mL min−1. The injection volume was 0.8 μL with a split ratio of 1:35, the injector temperature was 200 °C and the FID temperature was 230 °C. The column-temperature program was as follows: 37 °C held for 13 min, then to 200 °C (4 °C min−1 increase) held for 20 min, finally to 220 °C (20 °C min−1) held for 2 min. The total analysis time was 40 min. Data are expressed as g hL−1 of analyte in absolute alcohol.
Sugars were also analyzed by high-performance liquid-chromatography with refractive index detector (HPLC-RI). For the analysis, 10 μL of samples, pre-filtered with 0.45 μm syringe-filters, were injected into an HPLC-RID Agilent 1200 equipped with a SphereClone 250 mm × 4.6 mm (5 µm) amino column (Phenomenex, Torrance, CA, USA) using Acetonitrile/Water 75/25% as mobile phase at a flow rate of 1.3 mL min−1 in isocratic conditions. Each analysis took 25 min, the column and the RI detector were kept at 40 °C. Five sugars were quantified by interpolation on calibration lines: glucose, fructose, sucrose, lactose, and maltose. However, all sugar concentrations were found lower than the respective limit of detections (all LoD were 0.5 g L−1). Therefore, sugars data were not used for the following chemometric analyses.

2.3. Chemometrics

Data were chemometrically analyzed by linear discriminant analysis (LDA) and principal component analysis (PCA). Both techniques are very well-known chemometric methods, the first one [24] aimed at classifying samples based on known prior (true) classes and then assigning unknown samples to a specific class, the second one [25] aimed at exploring data and finding relationships between samples (objects) and variables. The LDA model was computed with the TrS samples and validated [26] both by cross-validation (CV) and by projecting the TeS samples. For CV non-error-rate (NER), sensitivity and specificity were evaluated. NER is the ratio between the number of correctly classified samples and the total number of samples. Sensitivity is the ratio between the correctly assigned samples to each class and the number of prior samples of that class; it is an index of the performance of each class to recognize itself. Specificity is the ratio between the correctly assigned samples to each class and the total number of samples assigned to that class; it is an index of the performance of each class to be discriminated by the others.
PCA was also used for class-modeling purposes. In this case, a PCA was computed for a single class at a time and the Hotelling-T2 and Q statistics [27] were used to compute “class limits” beyond which a projected sample is considered not belonging to that class. Such use of PCA for class-modeling goes sometimes under the name of SIMCA (soft independent modelling of class analogy) [28].
All computations were performed by the software R version 4.0.1 (R Core Team, Vienna, Austria). LDA was computed with the package MASS [29], while PCA, T2, and Q statistics were computed with the software CAT [30], based on the R environment.

3. Results and Discussion

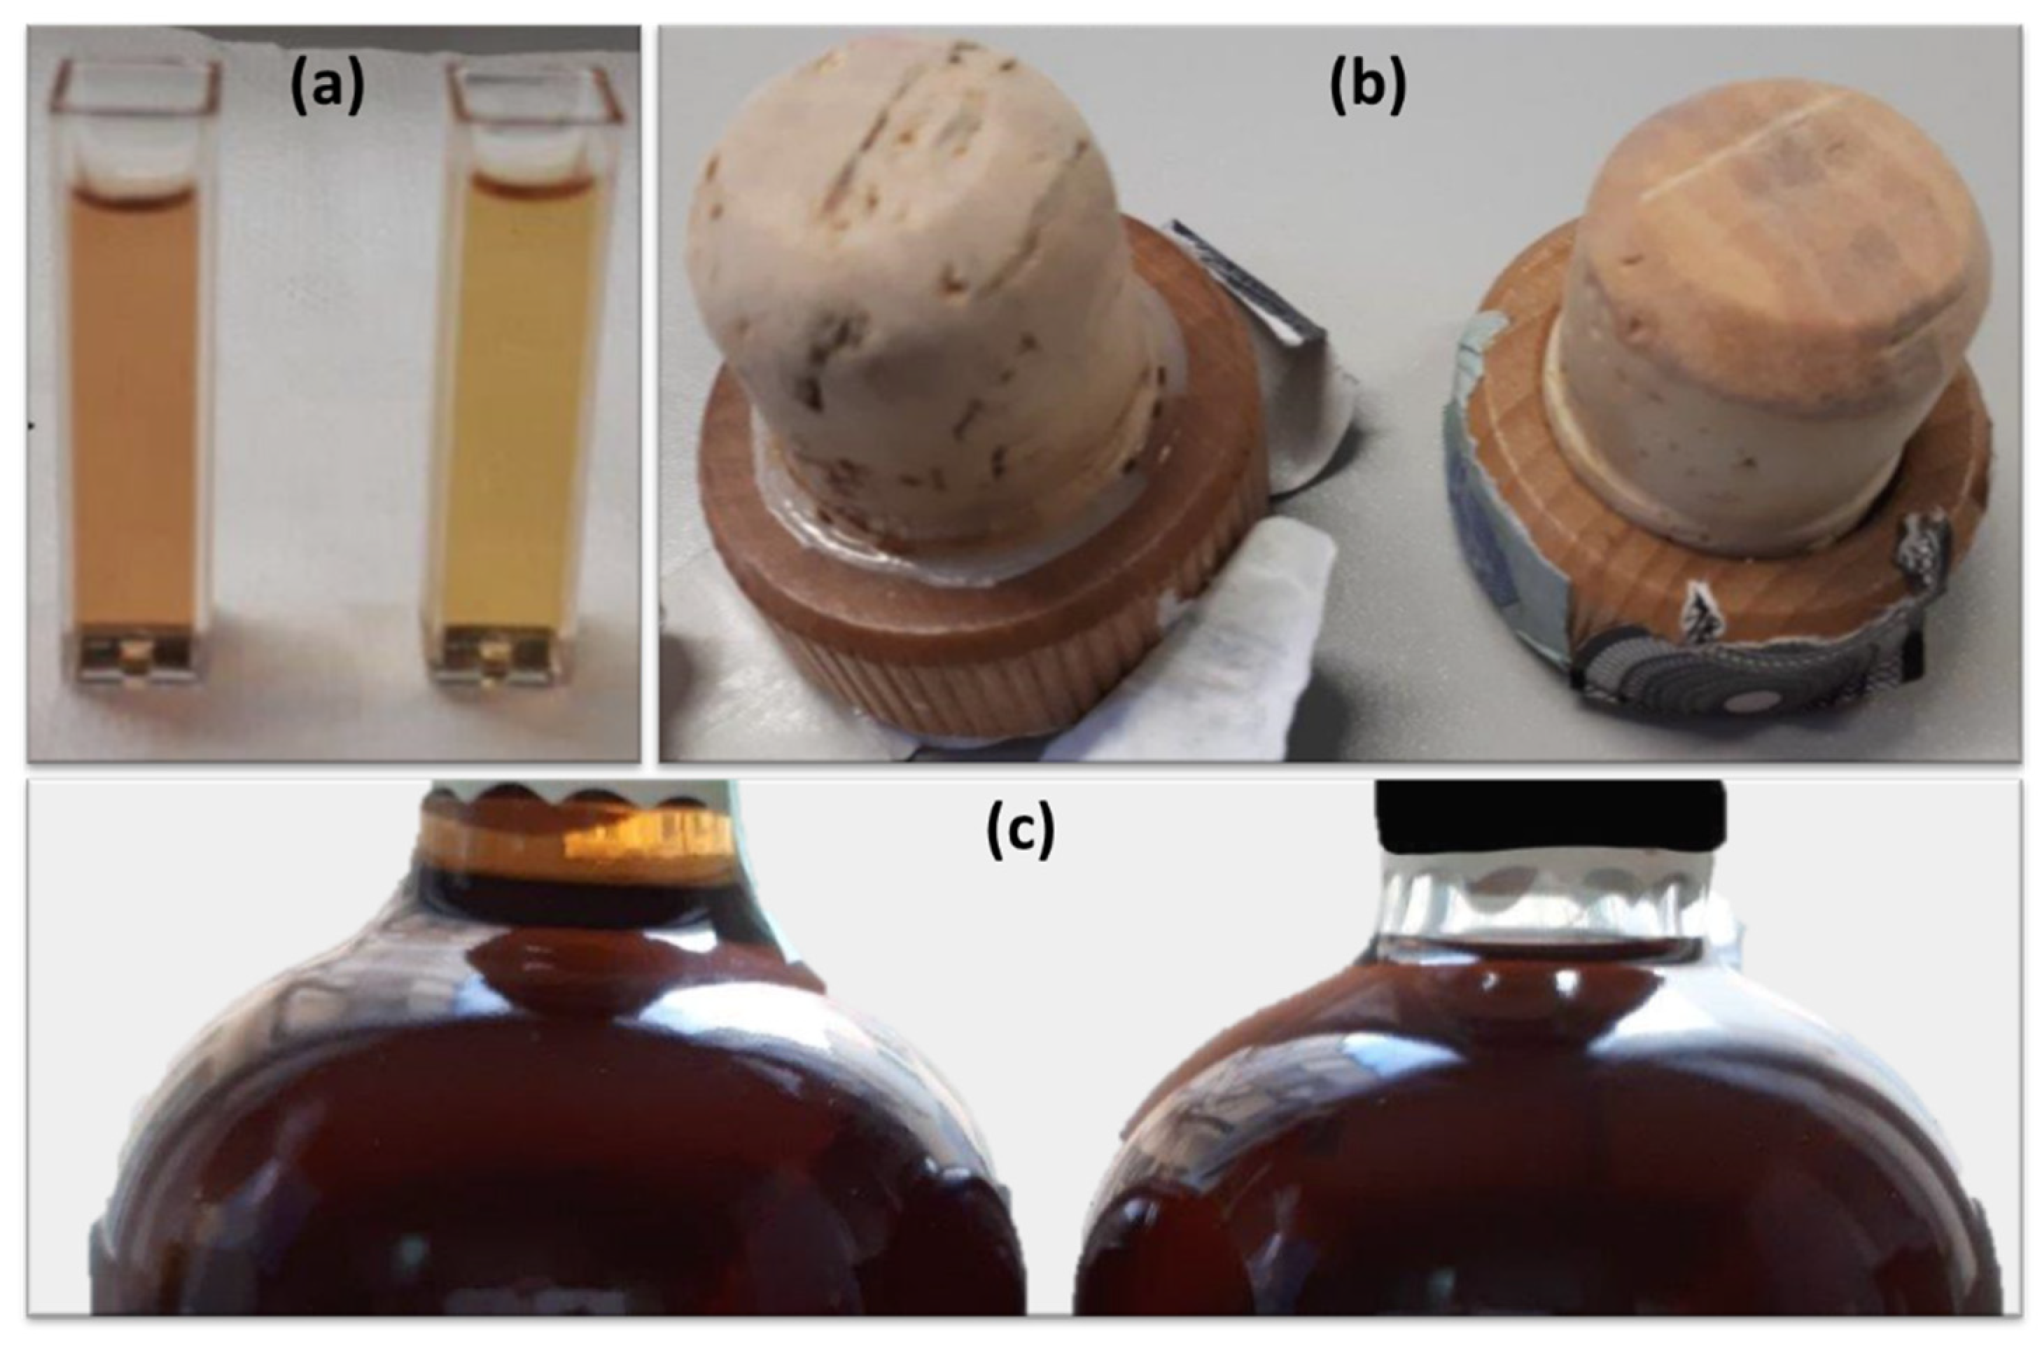
3.1. The Suspicious Samples
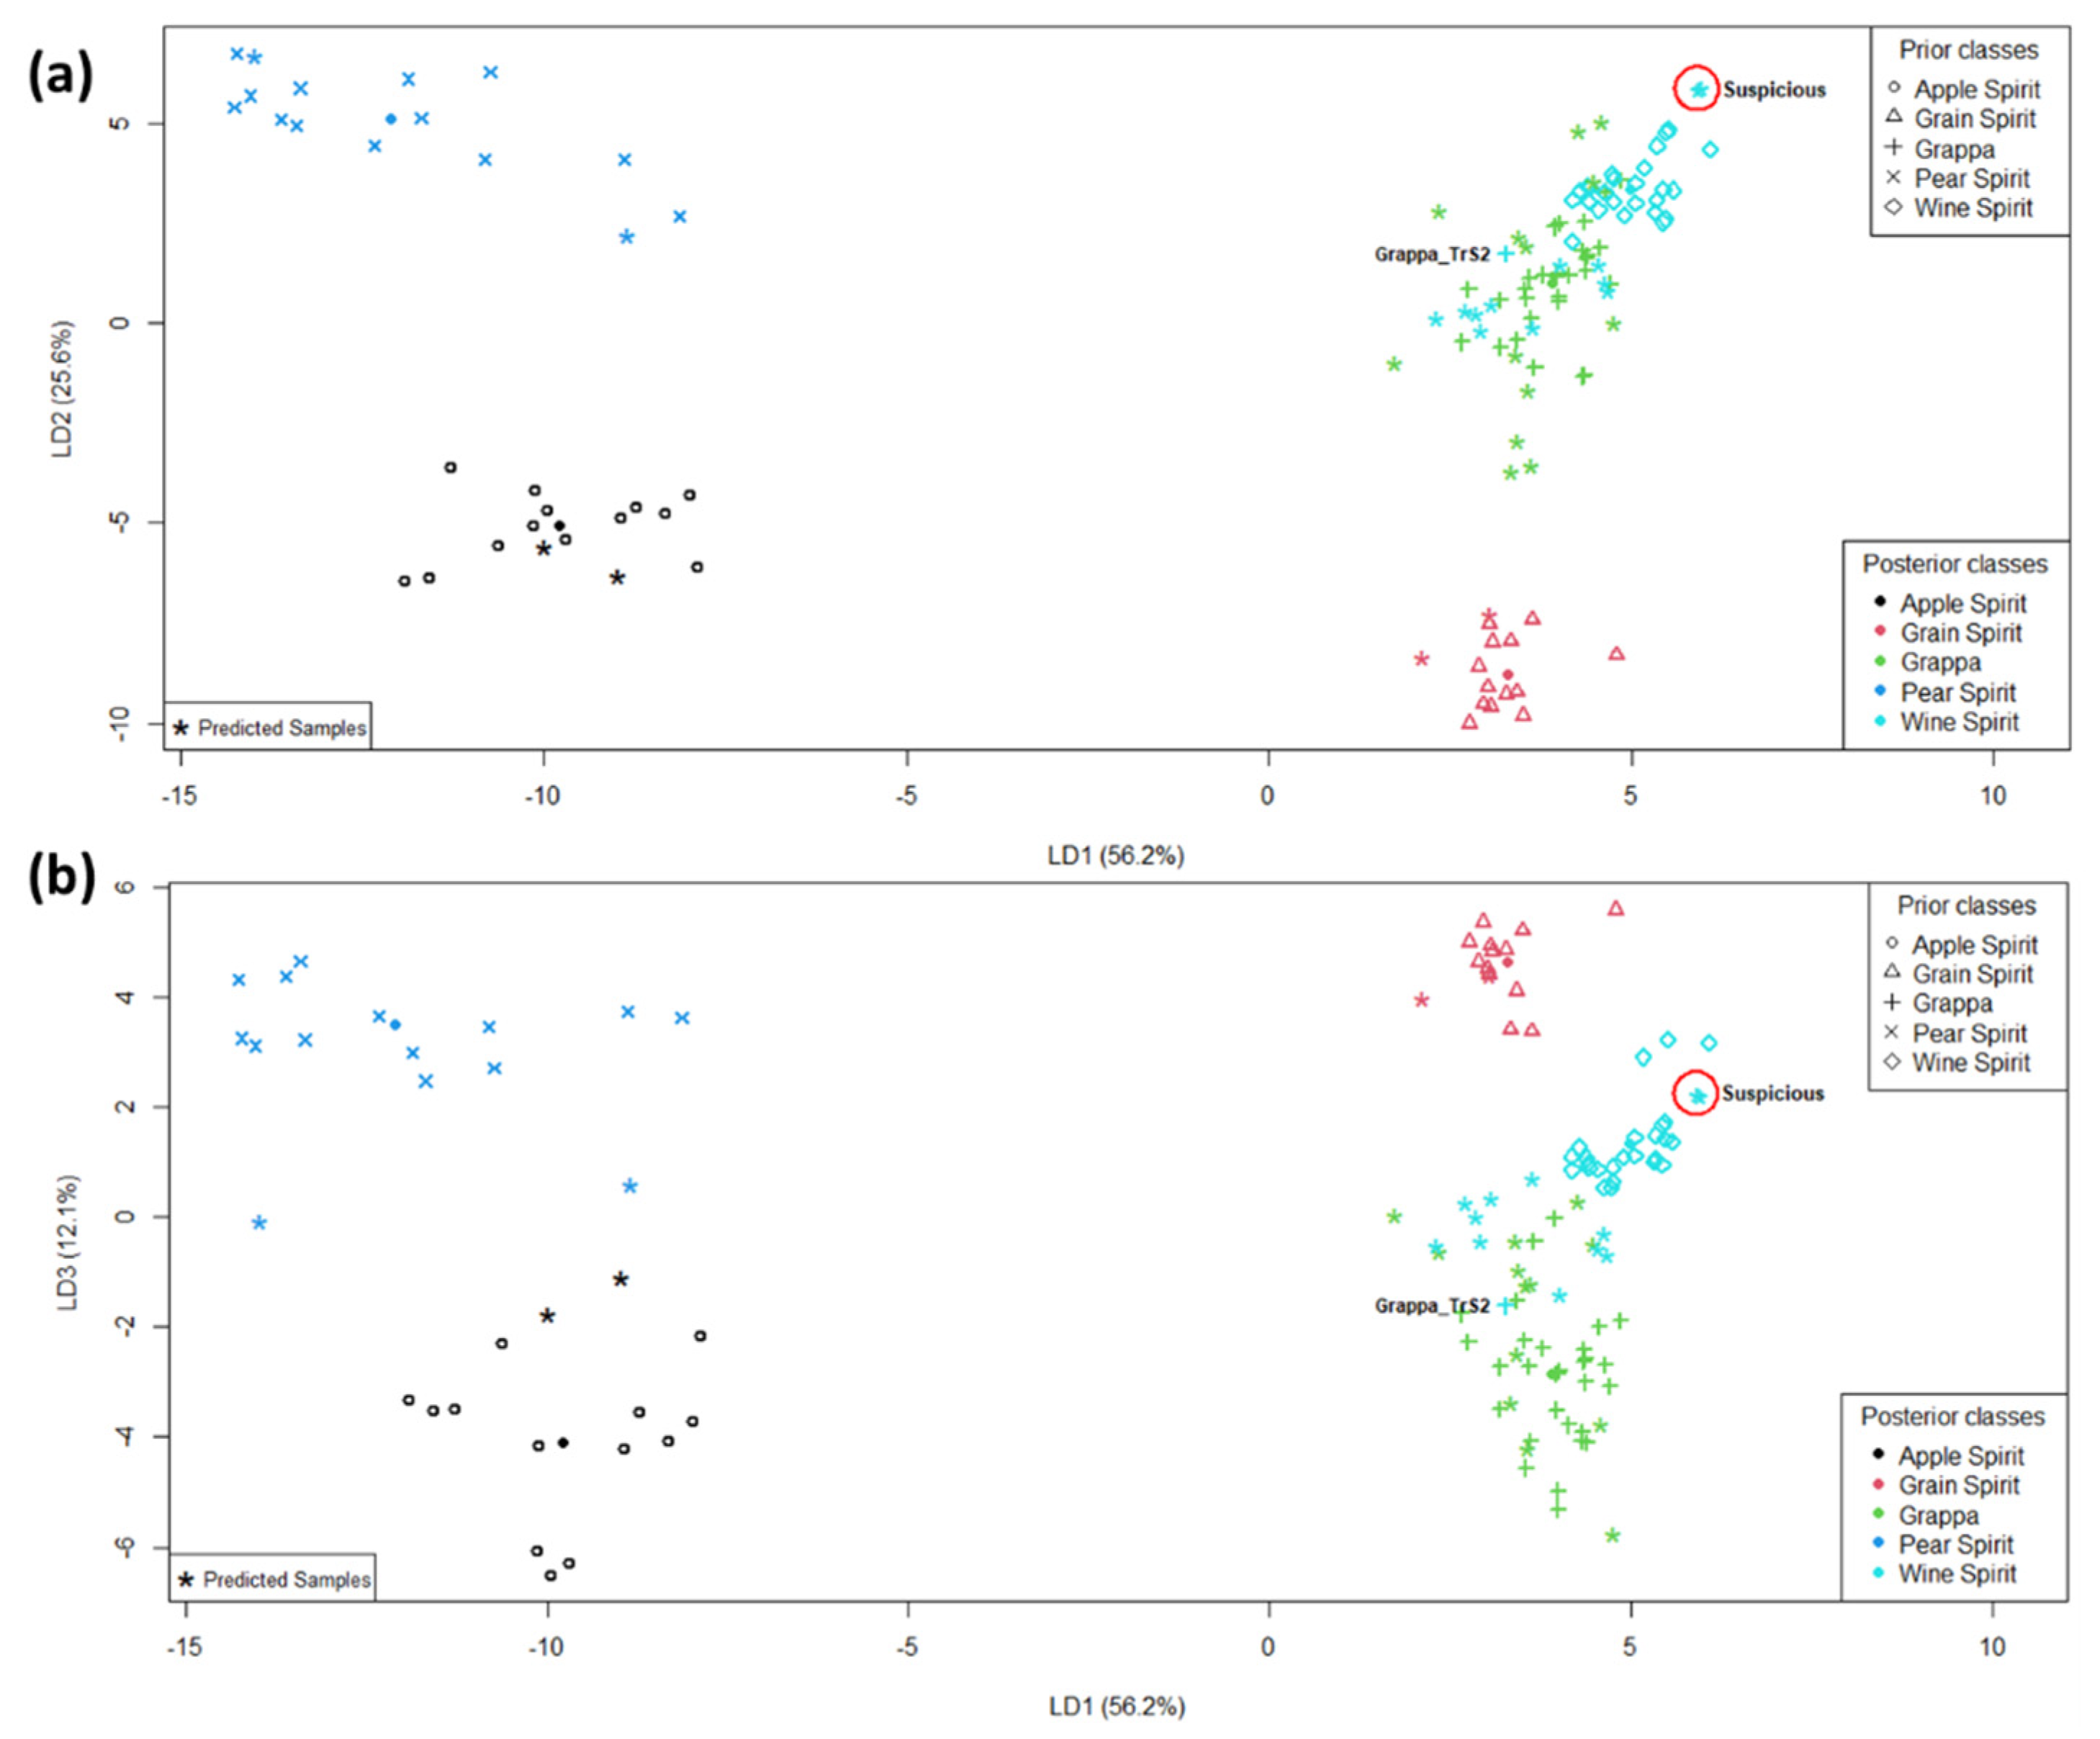
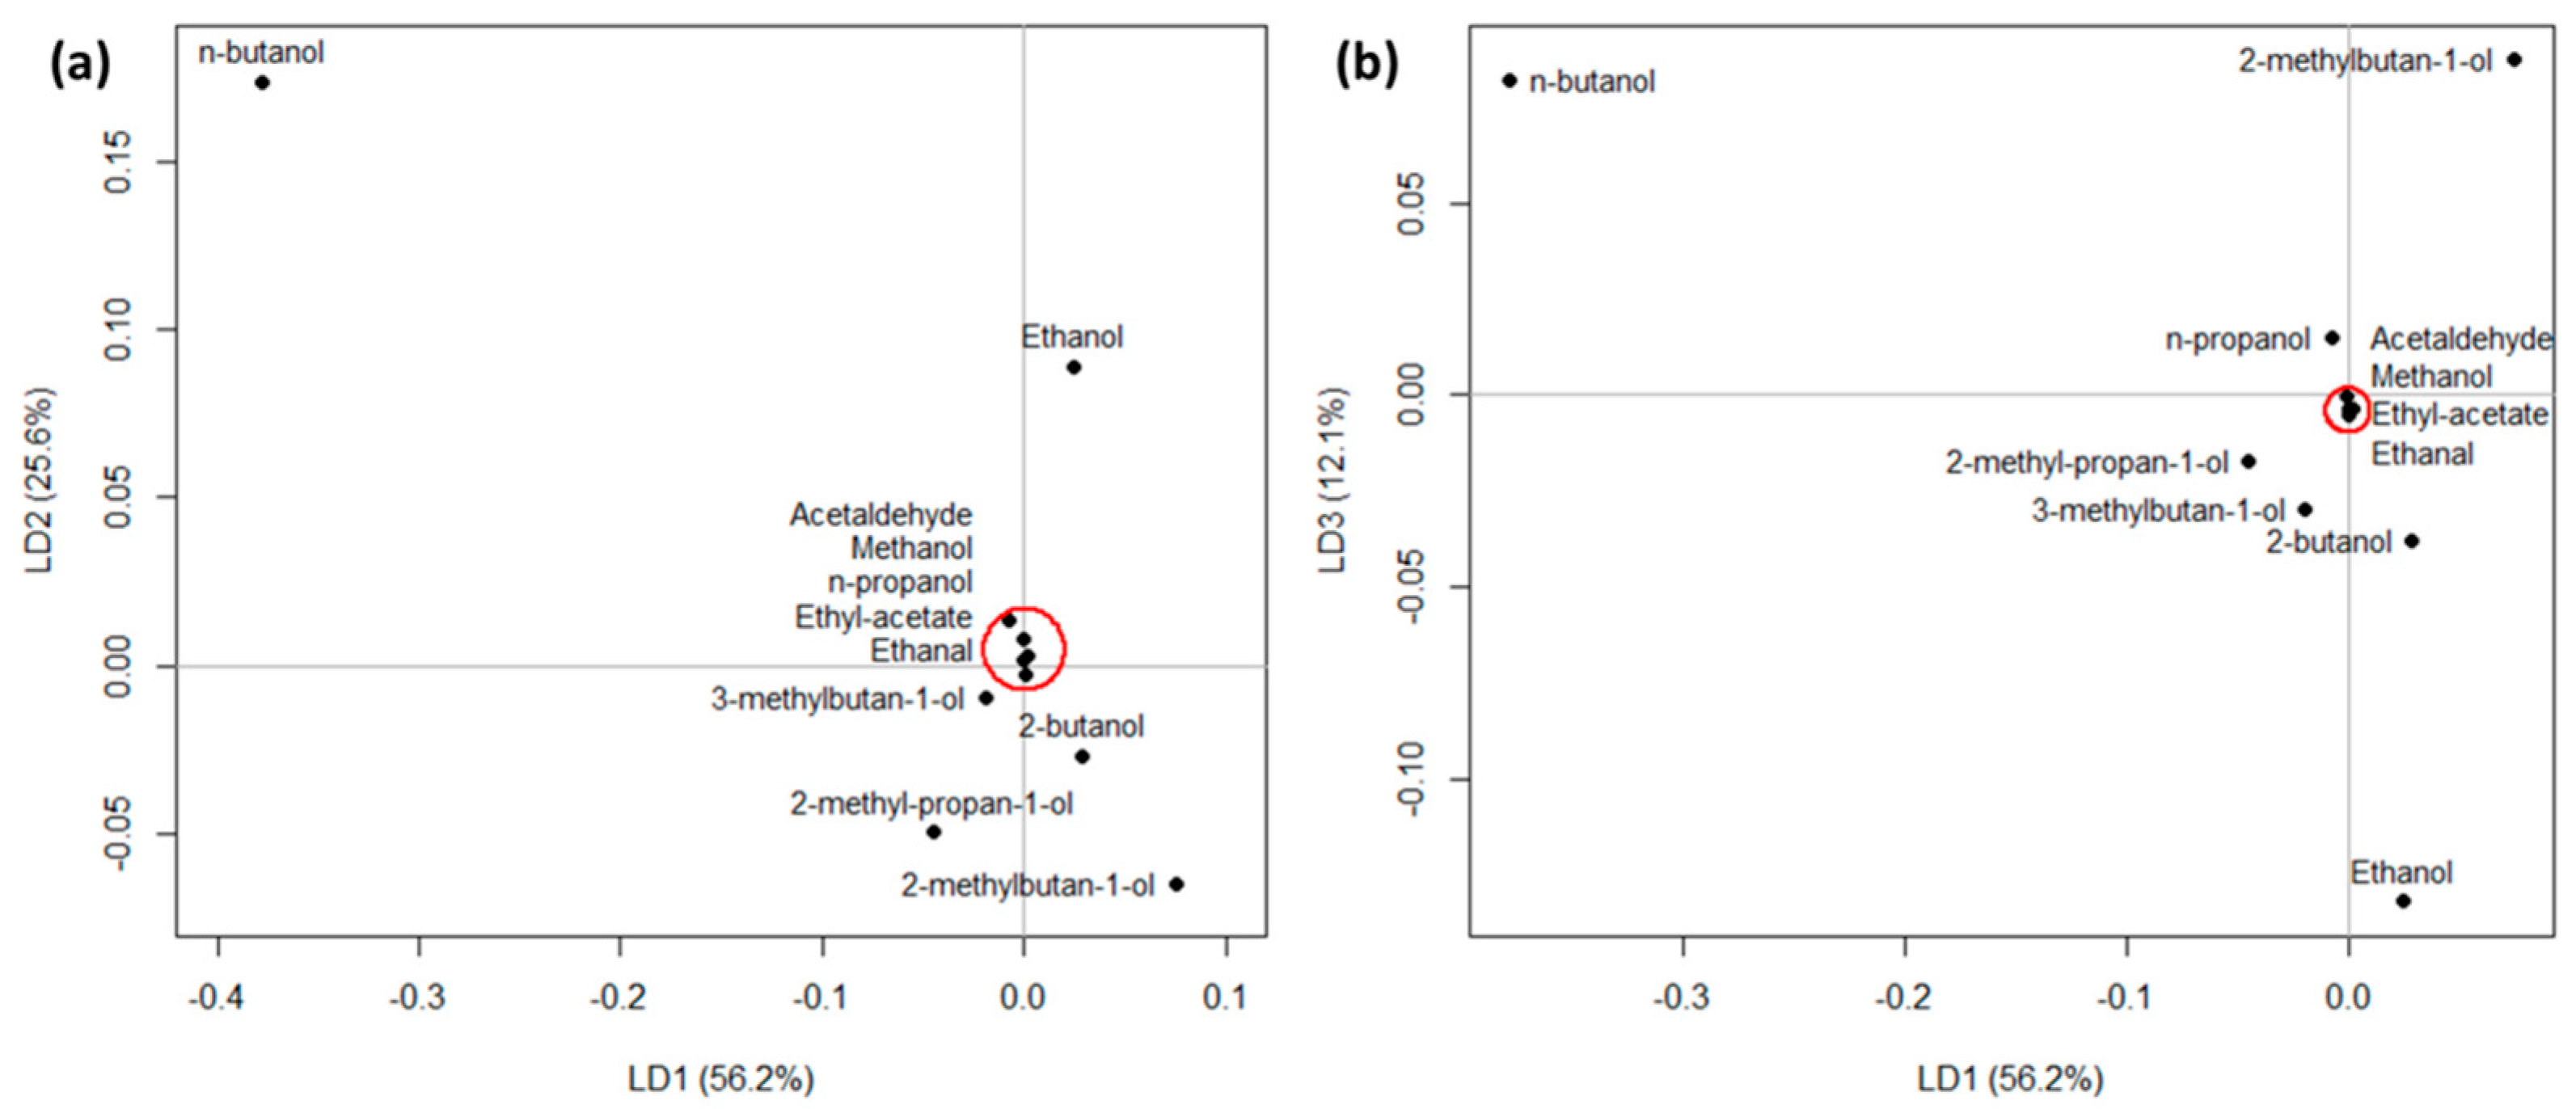
The bottles seized by the Italian Customs and Monopolies Agency showed, even at the sight, some differences with respect to the original of the brand normal grappa bottles requested and supplied by the manufacturer (Figure 1), thus raising the suspicion that the product was counterfeit in some way.
The color of the suspicious samples was, indeed, darker than the original one, which is amber and typical of aged grappa (Figure 1a). The aroma was also less intense and devoid of the fruity and spicy notes found in the original samples.
The plug of the suspicious samples (Figure 1b) was 0.4 cm longer than that of the original sample and glue was present between the external wood crown and the cork part. Such glue was unevenly distributed and it could come in touch with the liquid product inside the bottle. The glue was absent in the original sample.
The level of the liquid inside the suspicious bottles (Figure 1c) was higher than that in the original sample.
Moreover, also the barcode, the batch number, and the excise stamp in the suspicious samples showed differences from the original one (not shown). In the barcode, a zero was missing as the third digit under the barcode with respect to the original sample, and the batch number was completely absent.
All these differences encouraged the use of chemical and statistical analysis to confirm an eventual fraud perpetrated by the producer of the suspicious samples.

3.2. LDA Model

The dataset of all samples was divided into three portions: the TrS, composed of 94 objects, the TeS, composed of 29 objects, and two objects representing the suspicious samples. All sets are described by eleven numeric variables (actual alcoholic strength by volume and 10 substances concentrations in g hL−1 of absolute alcohol quantified by GC-FID) and one category variable (spirit drink category). Five classes were represented: “grappa”, “apple spirit”, “grain spirit”, “pear spirit”, and “wine spirit”.
TrS samples were used to calculate an LDA model. This model achieved an excellent CV-NER of 98.9% with only one “grappa” sample misclassified as “wine spirit”. Therefore, sensitivity and specificity for all classes were 100% except for the sensitivity of “grappa”, which was 96.7%, and the specificity of “wine spirit”, which was 96.2% due to the misclassified sample.
TeS was then projected onto the LDA model. In this case, all samples were correctly classified into their true classes (NER = 100%). Finally, the suspicious samples were projected onto the LDA model, and these were classified as “wine spirit”.
Figure 2 shows the LDA-model discriminant plot of both LD1 vs. LD2 (Figure 2a) and LD1 vs. LD3 (Figure 2b). In this figure, symbols represent the true class of each object, while colors represent the CV-predicted classes. Therefore, if an object is well classified by CV, its symbol and color indicate the same class. Asterisks represent the TeS samples and are colored as the class to which they are assigned. The red circle highlights the suspicious samples. Figure 2a shows that almost all classes are well discriminated in the model because the centroids (symbolized by full dots, ●) are far from each other. The only exceptions are the “grappa” (+ symbol) and “wine spirit” (◊ symbol) classes which are almost superimposed. This similarity is not surprising, because wine spirit is produced by distillation of wine, while grappa is produced by distillation of grape marc [3], which is the residual of grapes after winemaking. Therefore, these spirits have a common origin from grapes, thus similarity between them (at least in the considered variables) is possible, while the other categories considered in this work are produced from grain and fruits. Figure 2b, in which the third discriminant axis (LD3) is considered, on the contrary, shows good discrimination also of “grappa” and “wine spirit” classes. In both cases, it can be seen that the suspicious samples (almost overlapped in the graphs) are projected in a region closer to the centroid of the “wine spirit” class than to the “grappa” class, indicating a net similarity with the former class, rather than with the latter. For comparison, in Figure 2 also the sample misclassified by CV (labeled as “grappaTrS2”) has been highlighted. Such sample is misclassified into the “wine spirit” class; however, it lies in a region close to both classes in both graphs (Figure 2a,b), thus its classification may be considered uncertain.
Figure 3 shows the LDA-variables loadings, also in this case for both LD1 vs. LD2 (Figure 3a) and LD1 vs. LD3 (Figure 3b). Due to the quadrants correspondence present between the discriminant plots in Figure 2 and the LDA-loadings plots in Figure 3, the most relevant variables for the discrimination can be evaluated. “Grappa” and “wine spirit” classes are mostly discriminated by ethanol (high positive LD2 value), 3-methylbutan-1-ol and 2-methyl-propan-1-ol (negative value of LD3). Fruit spirits (apple and pear), instead, are mostly discriminated by n-butanol, at a high negative LD1 value, while “grain spirit” seems mostly discriminated by 2-methylbutan-1-ol (negative LD2 and positive LD3 values).

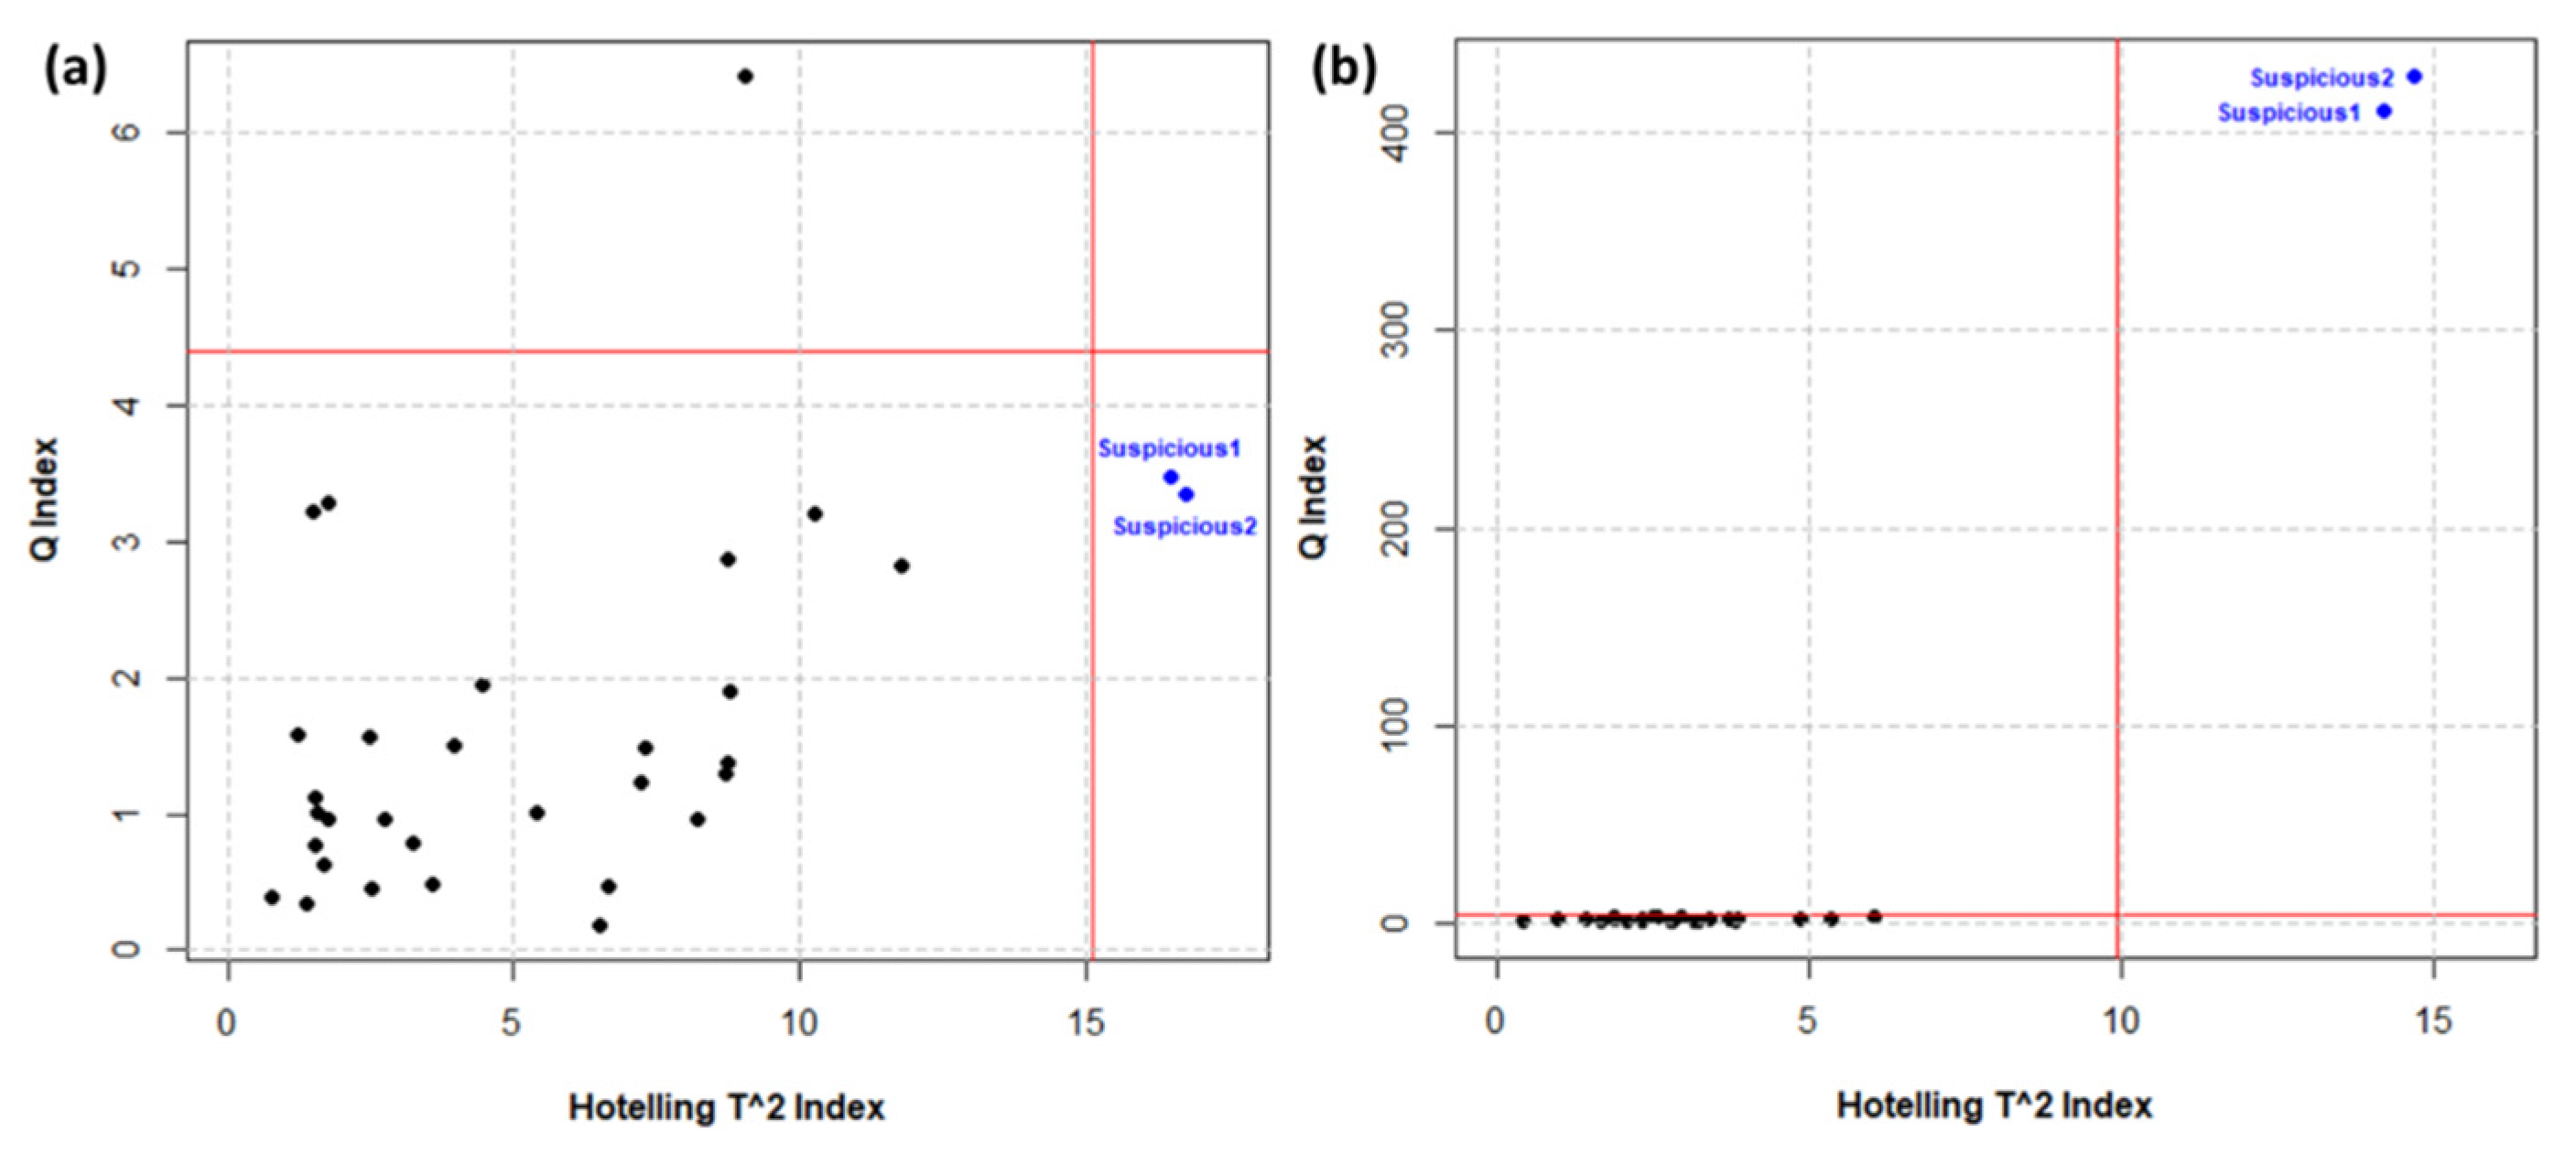
3.3. One-Class Classification by PCA

The intrinsic limit of LDA is that the model is forced to assign a projected sample to one of the classes used to compute the same model. However, an external sample may also belong to a class not considered in the model, making the LDA prediction not fully reliable. It is the case of the suspicious samples, which are classified as “wine spirit” by our LDA model, but are more similar to adulterated grappa samples, as discussed in Section 3.1.
Therefore, a further chemometric analysis was carried out by computing two PCA models for the TrS “grappa” and “wine spirit” samples and then projecting the suspicious ones onto these models. In this way, a sort of one-class classification (class modeling) was carried out, in order to check whether the suspicious samples may be really assigned to one of these classes or if they are unrelated to both. The membership to each class was evaluated in terms of Hotelling-T2 and Q indexes [27]. For such computations, five principal components (PCs) were used for the PCA “grappa” model and three for the “wine spirit” model, being the minimum PCs number that carried at least 80% of the total explained variance (85.3% for “grappa” and 81.8% for “wine spirit” models). Results (influence plots) are reported in Figure 4.
Figure 4 shows that the suspicious samples can be considered as not belonging to both classes because these lie outside the acceptability limits (the computations of which can be found in [27]) of both classes at significance level 0.05. In particular, it is outside the T2 limit of the “grappa” class (Figure 4a) and outside both the T2 and Q limits of the “wine spirit” class (Figure 4b). Therefore, these products cannot be simply considered wine spirits sold as grappa, because the one-class chemometric model neither recognizes them as belonging to the “wine spirit” class. This consideration, together with the fact that the suspicious sample is not far from the T2 limit of “grappa” class in Figure 4a, strengthens the hypothesis that such sample might be some kind of grape marc spirit that cannot be considered grappa (for example deriving from non-Italian marc) or that have been adulterated to illicitly increase the profit.
In general, the overshoot of the Q limit indicates a disproportion on a single or few variables between the projected sample and the group of the training samples, while the overshoot of the T2 limit indicates a general disproportion on several variables at the same time. The variables most influencing such overshoots can be evaluated by contribution plots, as reported in Figure 5 for the T2 and Q statistics of both models. From these plots, it can be seen that the acetaldehyde levels of the suspicious sample are considered “anomalous” by all models. The “grappa” model shows anomalous T2 levels (Figure 5a) in the suspicious sample also of methanol and 2-methylbutan-1-ol, and anomalous Q level (Figure 5c) of 3-methylbutan-1-ol. The “wine spirit” model, instead, shows anomalous T2 levels (Figure 5b) for actual alcoholic strength, ethyl-acetate, butan-2-ol, butan-1-ol, and 1,1-diethoxyethane, and anomalous Q levels (Figure 5d) in particular for methanol, 2-butanol, and 3-methylbutan-1-ol.

4. Conclusions

A chemometric model was created and validated with the aim of verifying the authenticity of two suspicious samples of a product labeled as “grappa”. In all, 123 spirit samples were analyzed to train and test the model. Samples were both grappa and other spirits as wine, grain, apple, and pear spirits. For the LDA-model test, both cross-validation and the projection of 29 of the analyzed samples (not used for the training phase) were applied, in both cases with a NER higher than 97%. The suspicious samples projected onto the LDA model were classified as “wine spirit”, demonstrating that they were different from the grappa samples used for the model training.
However, two further one-class modelization analyses carried out on the single classes, “grappa” and “wine spirit”, demonstrated that the suspicious samples were very different also from the wine spirit samples.
Therefore, the suspicious samples may probably be considered adulterated grappa samples rather than wine spirit samples sold as grappa.
Anyhow, chemometrics was successfully used as a rapid screening method to check a possible adulteration on a suspicious sample. It was not possible to identify which kind of adulteration was carried out on the sample; however, the presented model may be used as a test to evaluate whether an unknown sample complies with the training samples. Then, if compliance is not confirmed, the unknown sample can be subjected to other (often more expensive) analyses to try to understand, also, the kind of adulteration to which it was subjected. The model was applied only to evaluate “grappa” samples, but it can be used also for suspicious samples of the other tested spirits, and it can be easily extended to other spirit types by adding a congruous number of spirit samples to the training set.

Author Contributions

Conceptualization: S.A, A.Z. and D.M.; methodology: S.A.; software: S.A. and A.Z.; validation: S.A. and A.Z.; formal analysis: S.S., D.M. and M.L.; investigation: S.A.; resources: D.M.; data curation: S.A. and A.Z.; writing–original draft preparation: A.Z.; writing–review and editing: S.A., A.Z., S.S., M.L. and D.M.; visualization: S.A. and A.Z.; supervision: D.M., S.S. and M.L.; project administration, D.M. and S.S.; funding acquisition, D.M. All authors have read and agreed to the published version of the manuscript.

Funding

This research was funded by the University of Bologna (Funds for Selected Research Topics).

Data Availability Statement

Data are available under request from the authors.

Acknowledgments

The paper is published with the contribution of the Department of Excellence program financed by the Ministry of Education, University and Research (MIUR, L. 232 del 01/12/2016).

Conflicts of Interest

The authors declare no conflict of interest.

References

  1. Da Porto, C. Grappa: Production, sensory properties and market development. In Alcoholic Beverages; Woodhead Publishing: Sawston, UK, 2012; pp. 299–314. [Google Scholar]
  2. Decreto Del Presidente Della Repubblica 16 Luglio 1997, n. 297. 1997. Available online: https://www.gazzettaufficiale.it/atto/serie_generale/caricaDettaglioAtto/originario?atto.dataPubblicazioneGazzetta=1997-09-12&atto.codiceRedazionale=097G0340 (accessed on 12 August 2021).
  3. EU Regulation (EU) 2019/787 of the European Parliament. 2019. Available online: https://eur-lex.europa.eu/legal-content/EN/TXT/?uri=CELEX%3A32019R0787 (accessed on 12 August 2021).
  4. EU Commission Regulation (EC) 2870/2000. 2000. Available online: https://op.europa.eu/en/publication-detail/-/publication/792feac2-0f81-47db-8097-32c229a38650/language-en (accessed on 12 August 2021).
  5. Matias-Guiu, P.; Rodríguez-Bencomo, J.J.; Pérez-Correa, J.R.; López, F. Aroma profile design of wine spirits: Multi-objective optimization using response surface methodology. Food Chem. 2018, 245, 1087–1097. [Google Scholar] [CrossRef]
  6. Brereton, P.; Hasnip, S.; Bertrand, A.; Wittkowski, R.; Guillou, C. Analytical methods for the determination of spirit drinks. TrAC Trends Anal. Chem. 2003, 22, 19–25. [Google Scholar] [CrossRef]
  7. López-Vázquez, C.; Herminia Bollaín, M.; Berstsch, K.; Orriols, I. Fast determination of principal volatile compounds in distilled spirits. Food Control 2010, 21, 1436–1441. [Google Scholar] [CrossRef]
  8. Wiśniewska, P.; Śliwińska, M.; Dymerski, T.; Wardencki, W.; Namieśnik, J. Application of gas chromatography to analysis of spirit-based alcoholic beverages. Crit. Rev. Anal. Chem. 2015, 45, 201–225. [Google Scholar] [CrossRef]
  9. Flamini, R. Some advances in the knowledge of grape, wine and distillates chemistry as achieved by mass spectrometry. J. Mass Spectrom. 2005, 40, 705–713. [Google Scholar] [CrossRef]
  10. Charapitsa, S.; Sytova, S.; Kavalenka, A.; Sobolenko, L.; Shauchenka, Y.; Kostyuk, N.; Egorov, V.; Leschev, S.; Vetokhin, S.; Zayats, N.; et al. The Method for Direct Gas Chromatographic Determination of Acetaldehyde, Methanol, and Other Volatiles Using Ethanol as a Reference Substance: Application for a Wide Range of Alcoholic Beverages. Food Anal. Methods 2021 2021, 1, 1–13. [Google Scholar]
  11. Giannetti, V.; Mariani, M.B.; Marini, F.; Torrelli, P.; Biancolillo, A. Flavour fingerprint for the differentiation of Grappa from other Italian distillates by GC-MS and chemometrics. Food Control 2019, 105, 123–130. [Google Scholar] [CrossRef]
  12. Mayr Marangon, C.; De Rosso, M.; Carraro, R.; Flamini, R. Changes in volatile compounds of grape pomace distillate (Italian grappa) during one-year ageing in oak and cherry barrels. Food Chem. 2021, 344, 128658. [Google Scholar] [CrossRef] [PubMed]
  13. Giannetti, V.; Mariani, M.B.; Marini, F.; Torrelli, P.; Biancolillo, A. Grappa and Italian spirits: Multi-platform investigation based on GC–MS, MIR and NIR spectroscopies for the authentication of the Geographical Indication. Microchem. J. 2020, 157, 104896. [Google Scholar] [CrossRef]
  14. Majchrzak, T.; Wojnowski, W.; Wasik, A. Revealing dynamic changes of the volatile profile of food samples using PTR–MS. Food Chem. 2021, 364, 130404. [Google Scholar] [CrossRef]
  15. Gavage, M.; Delahaut, P.; Gillard, N. Suitability of high-resolution mass spectrometry for routine analysis of small molecules in food, feed and water for safety and authenticity purposes: A review. Foods 2021, 10, 601. [Google Scholar] [CrossRef] [PubMed]
  16. Valand, R.; Tanna, S.; Lawson, G.; Bengtström, L. A review of Fourier Transform Infrared (FTIR) spectroscopy used in food adulteration and authenticity investigations. Food Addit. Contam.-Part A Chem. Anal. Control. Expo. Risk Assess. 2020, 37, 19–38. [Google Scholar] [CrossRef]
  17. Winterová, R.; Mikulíková, R.; Mazáč, J.; Havelec, P. Assessment of the authenticity of fruit spirits by gas chromatography and stable isotope ratio analyses. Czech J. Food Sci. 2008, 26, 368–375. [Google Scholar] [CrossRef] [Green Version]
  18. Schiavone, S.; Marchionni, B.; Bucci, R.; Marini, F.; Biancolillo, A. Authentication of Grappa (Italian grape marc spirit) by Mid and Near Infrared spectroscopies coupled with chemometrics. Vib. Spectrosc. 2020, 107, 103040. [Google Scholar] [CrossRef]
  19. Esslinger, S.; Riedl, J.; Fauhl-Hassek, C. Potential and limitations of non-targeted fingerprinting for authentication of food in official control. Food Res. Int. 2014, 60, 189–204. [Google Scholar] [CrossRef]
  20. Melucci, D.; Zappi, A.; Bolelli, L.; Corvucci, F.; Serra, G.; Boi, M.; Grillenzoni, F.-V.; Fedrizzi, G.; Menotta, S.; Girotti, S. Checking syrup adulteration of honey using bioluminescent bacteria and chemometrics. Eur. Food Res. Technol. 2019, 245, 315–324. [Google Scholar] [CrossRef]
  21. Morozzi, P.; Zappi, A.; Gottardi, F.; Locatelli, M.; Melucci, D. A quick and efficient non-targeted screening test for saffron authentication: Application of chemometrics to gas-chromatographic data. Molecules 2019, 24, 2602. [Google Scholar] [CrossRef] [Green Version]
  22. Food and Drug Administration (FDA). Analytical Procedures and Methods Validation for Drugs and Biologics Guidance for Industry; FDA: Rockville, MD, USA, 2015.
  23. Kelly, J.; Chapman, S.; Brereton, P.; Bertrand, A.; Guillou, C.; Wittkowski, R. Gas Chromatographic Determination of Volatile Congeners in Spirit Drinks: Interlaboratory Study. J. AOAC Int. 1999, 82, 1375–1388. [Google Scholar] [CrossRef] [PubMed] [Green Version]
  24. McLachlan, G.J. Discriminant Analysis and Statistical Pattern Recognition; Wiley: Hoboken, NJ, USA, 2004; ISBN 0471691151. [Google Scholar]
  25. Bro, R.; Smilde, A.K. Principal component analysis. Anal. Methods 2014, 6, 2812–2831. [Google Scholar] [CrossRef] [Green Version]
  26. Stone, M. Cross-Validatory Choice and Assessment of Statistical Predictions. J. R. Stat. Soc. 1974, 36, 111–147. [Google Scholar] [CrossRef]
  27. Brereton, R. One-class classifiers. J. Chemom. 2011, 25, 225–246. [Google Scholar] [CrossRef]
  28. Bylesjo, M.; Rantalainen, M.; Cloarec, O.; Nicholson, J.K.; Holmes, E.; Trygg, J. OPLS discriminant analysis: Combining the strengths of PLS-DA and SIMCA classification. J. Chemom. 2006, 20, 341–351. [Google Scholar] [CrossRef]
  29. Venables, W.N.; Ripley, B.D. Modern Applied Statistics with S 4th; Springer: Berlin/Heidelberg, Germany, 2002; Volume 53, ISBN 0387954570. [Google Scholar]
  30. Leardi, R.; Melzi, C.; Polotti, G. CAT (Chemometric Agile Tool). Available online: http://www.gruppochemiometria.it/index.php/software/19-download-the-r-based-chemometric-software (accessed on 19 July 2021).
Figure 1. Main visual differences between the suspicious sample (always on the left) and the original one (on the right): (a) color; (b) plug; (c) level of the liquid.
Analytica 02 00010 g001
Figure 2. LDA discriminant plot, (a) LD1 vs. LD2; (b) LD1 vs. LD3. Symbols represent true classes and colors represent CV-predicted classes. Asterisks indicate projected TeS samples. Full dots (●) represent class-centroids. The red circle indicates the two suspicious samples (almost totally overlapped).
Analytica 02 00010 g002
Figure 3. LDA-loadings plots for (a) LD1 vs. LD2; (b) LD1 vs. LD3. The names of the molecules inside the red circles are reported outside the circles.
Analytica 02 00010 g003
Figure 4. One-class classification influence plots of the suspicious samples onto PCA models of (a) “grappa” and (b) “wine spirit” samples. Black points represent the TrS samples, blue points the suspicious ones. Red lines are the acceptability limits for T2 and Q statistics at a significance level of 0.05.
Analytica 02 00010 g004
Figure 5. Upper part: T2-contribution plots of one of the suspicious samples projected onto (a) “grappa” and (b) “wine spirit” models. Lower part: Q-contribution plots of one of the suspicious samples projected onto (c) “grappa” and (d) “wine spirit” models. Red lines indicate the normalized acceptability limits at a significance limit of 0.05. Contribution plots of the second suspicious sample are almost identical to the showed ones.
Analytica 02 00010 g005
Publisher’s Note: MDPI stays neutral with regard to jurisdictional claims in published maps and institutional affiliations.

