Article

Analysis of Acetylcholinesterase Activity in Cell Membrane Microarrays of Brain Areas as a Screening Tool to Identify Tissue Specific Inhibitors

by
Bárbara Rienda
1,
Ane Elexpe
1,2,
Tarson Tolentino-Cortez
1,
Marina Gulak
3,
Cristina Bruzos-Cidón
2,
María Torrecilla
2,
Egoitz Astigarraga
1 and
Gabriel Barreda-Gómez
1,*
1
Research and Development Division, IMG Pharma Biotech, 48160 Derio, Spain
2
School of Medicine and Nursing, University of the Basque Country UPV/EHU, 48940 Leioa, Spain
3
Cruz Roja Hospital, 48001 Bilbao, Bizkaia, Spain
*
Author to whom correspondence should be addressed.
Analytica 2021, 2(1), 25-36; https://doi.org/10.3390/analytica2010003
Submission received: 18 February 2021 / Revised: 17 March 2021 / Accepted: 18 March 2021 / Published: 23 March 2021

Abstract

:
Acetylcholinesterase (AChE) is responsible for hydrolyzing the acetylcholine neurotransmitter, bringing an end point to cholinergic neurotransmission. Thus, AChE is the primary target of a wide spectrum of compounds used as pesticides, nerve agents or therapeutic drugs for neurodegenerative diseases such as Alzheimer’s disease (AD). This enzyme is heterogeneously distributed in the brain showing different activity depending on the nervous region. Therefore, the aim of this work is to report a novel technology that enables the simultaneous determination of tissue specific AChE activity, as well as the analysis and screening of specific inhibitors, by using cell membrane microarrays. These microarrays were composed of cell membranes, isolated from 41 tissues, organs and brain areas, that were immobilized over a slide, maintaining the functionality of membrane proteins. To validate this platform, demonstrating its usefulness in drug discovery as a high throughput screening tool, a colorimetric protocol to detect the membrane-bound AChE activity was optimized. Thus, rat cortical and striatal AChE activities were estimated in presence of increased concentrations of AChE inhibitors, and the donepezil effect was assessed simultaneously in 41 tissues and organs, demonstrating the major potential of this microarray’s technology.

Graphical Abstract

1. Introduction

Acetylcholinesterase (AChE) is responsible for degrading the acetylcholine neurotransmitter into choline and acetic acid, bringing an end point to cholinergic neurotransmission. This enzyme is heterogeneously distributed in the brain showing different activity depending on the nervous region. For this reason, AChE is the primary target of a wide spectrum of compounds used as pesticides, nerve agents or therapeutic drugs for neurodegenerative diseases. Concretely, AChE is the main therapeutic target in Alzheimer’s disease (AD), where inhibition of this enzyme attempts to compensate the cholinergic system deficits reported not only in AD but also in other diseases such as Parkinson’s disease or Myasthenia gravis [1,2,3].
Several approaches have been developed to study AChE activity and to test the inhibitory capacity of AChE inhibitors including colorimetric [4,5], spectrophotometric [6,7], fluorometric [8,9,10,11], radiometric [12,13], or electrochemical techniques [14,15,16,17]. Among them, the most commonly used technologies are based on the photometric Ellman’s method, which consists of measuring the increase in yellow color produced from thiocholine, generated from the hydrolysis of the acetylthiocholine by cholinesterases when it reacts with dithiobisnitrobenzoate ion [6]. This method has been adapted to microtiter plates for inhibitor screening, but the amount of sample required limits their use with specific brain areas involved in the AChE physiological effects. In an attempt to adapt to array scale, Monton and co-workers developed an AChE microarray to test inhibitory drugs of the soluble AChE by immobilizing this enzyme in a sol-gel derived silica [18]. However, in vivo, the major isoform of AChE is anchored to the membrane [19] and its activity depends on the tissue where it is expressed. Considering that membrane bound proteins are one of the main pharmacological targets, strategies to develop microarrays of functional membrane proteins are of notable interest. In this work, we describe a biotechnological platform based on cell membrane microarrays (CMMs). In this sense, a cell membrane microarray (CMM) has been successfully used in the study of membrane proteins not only at expression level but also for functional activity [20,21]. As the whole membrane is printed onto these CMMs, the integrity of the proteins remains stable for long periods of time, mainly due to the conservation of the lipid environment [22,23]. Moreover, regional distribution of cholinesterase and specific lipids has been described using CMMs [22].
Therefore, we seek to adapt cell membrane microarrays to a simple and sensible colorimetric assay, used in histochemical studies for cholinesterase (ChE) detection, based on the reduction of ferricyanide to ferrocyanide and the combination of the latter with Cu+2 ions to form brown insoluble copper ferrocyanides [24]. This miniaturized biotechnology platform enables not only enormously reduction in the amount of sample towards the nano-scale, but also determination of AChE activity and the effect of its potential inhibitors in numerous tissues simultaneously using only a single assay, which in turn results in reducing reagents and drugs consumption. To demonstrate its utility, in a single assay, the inhibitory potency of donepezil on AChE activity was estimated in 41 rat tissues revealing the major potential of this novel technology. In addition, relative ChE and AChE activities were quantified in cerebral cortex and striatum CMMs; the half-maximal inhibitory concentration (IC50) of the ChE inhibitors tacrine and physostigmine, first generation drugs for AD symptomatic treatment, donepezil and galanthamine, second generation drugs, and paraoxon, the active metabolite of parathion, an organophosphorus insecticide, were also quantified. In this sense, in vivo and in vitro exposure to a wide range variety of organophosphates in cell models increases the production of reactive oxygen species (ROS) [25,26]. Furthermore, the presence of superoxide formation has been observed in vitro in Human salivary gland (HSG) cells treated with paraoxon [27]. As some of the main proteins involved in the ROS formation are in cell membrane, the effect of paraoxon on the NADH oxidoreductase was studied in rat hippocampus, striatum and thalamus.

2. Experimental Section

2.1. Tissue Samples and Reagents

The cell membrane fraction was obtained from tissues and organs of a pool of 10 male Sprague Dawley rats (250–300 g) purchased from Harlan (Barcelona, Spain). All animals were treated in accordance with institutional guidelines and Directive 86/609/EEC. The rats were deeply anesthetized with a ketamine/xylazine cocktail (60 mg/kg of Ketamine-HCl and 5 mg/kg Xylazine-HCl i.p.), 2 mL of blood was extracted and rats were decapitated. Brain areas and peripheral tissues of interest were quickly removed and stored at −80 °C. During dissection tissues were maintained at 4 °C to avoid cell membrane protein denaturation and subsequent functionality loss.
All chemicals were purchased from Sigma-Aldrich (San Luis, MO, USA), including the ChE inhibitors tetraisopropyl pyrophosphoramide (Iso-OMPA), 9-amino-1,2,3,4-tetrahydroacridine hydrochloride hydrate (tacrine), eserine (physostigmine), galanthamine hydrobromide from Lycoris sp. (galanthamine), donepezil hydrochloride monohydrate (donepezil) and paraoxon. The inhibitors were all dissolved in distilled water except physostigmine, which is insoluble in water, and was therefore dissolved in dimethyl sulfoxide.

2.2. Cell Membrane Microarrays Fabrication

The microarrays were composed of a collection of membrane homogenates isolated from different rat tissues and organs. Briefly, the cell membrane fraction was isolated from the tissues of interest and homogenates were prepared based on the protocol reported by Barreda-Gómez and co-workers with some modifications [28]. Tissue samples were homogenized using a Teflon-glass grinder (Heidolph RZR 2020, Schwabach, Germany) or a disperser (Ultra-Turrax® T10 basic, IKA, Staufen, Germany) in 20 volumes of homogenized buffer (1 mM EGTA, 3 mM MgCl2, and 50 mM Tris-HCl, pH 7.4) supplemented with 250 mM sucrose. The crude homogenate was subjected to a 1500× g centrifugation (AllegraTM X 22R centrifuge, Beckman Coulter, Brea, CA, USA) for 5 min at 4 °C, and the resultant supernatant was centrifuged at 18,000× g (Microfuge® 22R centrifuge, Beckman Coulter, Brea, CA, USA) for 15 min (4 °C). The pellet was washed in 20 volumes of homogenized buffer and re-centrifuged under the same conditions. The tubes were finally decanted and the pellets were frozen at −80 °C, except for one aliquot which was used to determine the protein concentration. Protein concentration was measured by the Bradford method [29] and adjusted to the required concentrations.
For microarray development, membrane aliquots of the rat brain areas studied were resuspended in assay buffer (0.1 mM PBS) supplemented with the crosslinker at a concentration of 10 µg/µL [30,31]. An amount of 20 µI of each sample was placed in each microwell of a 96-well plate according to the microarray design. Microarrays were printed by a contact microarrayer (SpotBot®3 microarrayer, Arrayit, Sunnyvale, CA, USA) placing 3 replicates of each sample (7 nL/spot), into microscope preactivated glass slides [30,31]. The printing was carried out using SMP15 pins under controlled humidity (relative humidity 60%) at 4 °C. After the spotting, microarrays were stored at −20 °C in a desiccator.
The immobilization of the membranes to the support was checked by using an adapted protocol of the Bradford method [29]. For this purpose, 2 microarrays were thawed and rehydrated in 50 mM Tris-HCl buffer (pH 7.4) for 15 min at room temperature. Then, the microarrays were incubated with coomassie blue staining for 60 min at room temperature, washed twice in 50 mM Tris-HCl buffer (pH 7.4) for 5 min and dipped in distilled water. The images were acquired and analyzed determining the homogeneity of the microarrays printed.

2.3. ChE Activity Detection

ChE activity was detected by adapting the methodology reported by Karnovsky and Roots [24]. CMMs were dried for 60 min, and then incubated at room temperature with the reaction medium prepared in 0.1 M Tris-maleate buffer pH 6 containing 5 mM sodium citrate, 3 mM cupric sulfate, 5 mM potassium ferrocyanide and 2.3 mM acetylthiocholine iodide substrate. The incubation medium was protected from light to avoid substrate degradation. The selective butyrylcholinesterase (BuChE) irreversible inhibitor, Iso-OMPA (0.1 mM) was added to the reaction buffer to determine AChE activity. Lastly, the inhibitors were added at the required concentrations. When physostigmine was tested, 0.5% bovine serum albumin, a protein stabilizer, was also added to the reaction medium. The reaction was discontinued by washing with 0.1 M Tris-maleate buffer pH6 (2×). To assess the effect of pralidoxime, CMMs were incubated with 1 µM paraoxon in the presence of increasing concentrations of pralidoxime.

2.4. Data Normalization

The protein content of membrane homogenates was measured with the Coomassie brilliant blue protein-binding method [29] using bovine serum albumin as standard. After printing membrane homogenates on the slides, protein concentration was recalculated using Bradford methods adapted to cell membrane microarrays. Briefly, CMMs were dried for 15 min and incubated in 50 mM Tris-HCl buffer (pH 7.4) for 15 min. CMMs were subsequently incubated in Coomassie brilliant blue solution for 60 min at room temperature, washed in 50 mM Tris-HCl buffer for 15 min (2×) and dried at room temperature. Slides were scanned and quantified as reported below. The protein determinations were used to normalize ChE and AChE activities.

2.5. Image Processing

A Leica DM500 microscope and Leica ICC50 HD camera were coupled to the capturing software LAS EZ 2.0.0. Microphotographs were captured with the same light parameters and the final image was assembled with the software Adobe Photoshop CS5 (Adobe Systems Incorporated, Mountain View, CA, USA).

2.6. Data Analysis and Determination of IC50 Values

CMMs were scanned using a scanner (Epson Perfection V750 Pro) and quantified using the software ScanAlyze (Stanford University, Stanford, CA, USA). Data were processed with GraphPad Prism 5.00 (GraphPad Software, San Diego, CA, USA). To determine IC50 values, CMMs were incubated with increasing concentration of the inhibitors tested to inhibit 20% to 80% of AChE activity, ranging from 1 nM to 10 mM. The data were obtained by non-linear regression of the logarithm of the inhibitor concentration (M) versus the percentage of remaining AChE activity. Correlation analysis was carried out by the Pearson test. A p ≤ 0.05 was considered significant. Data are presented as mean ± SEM.

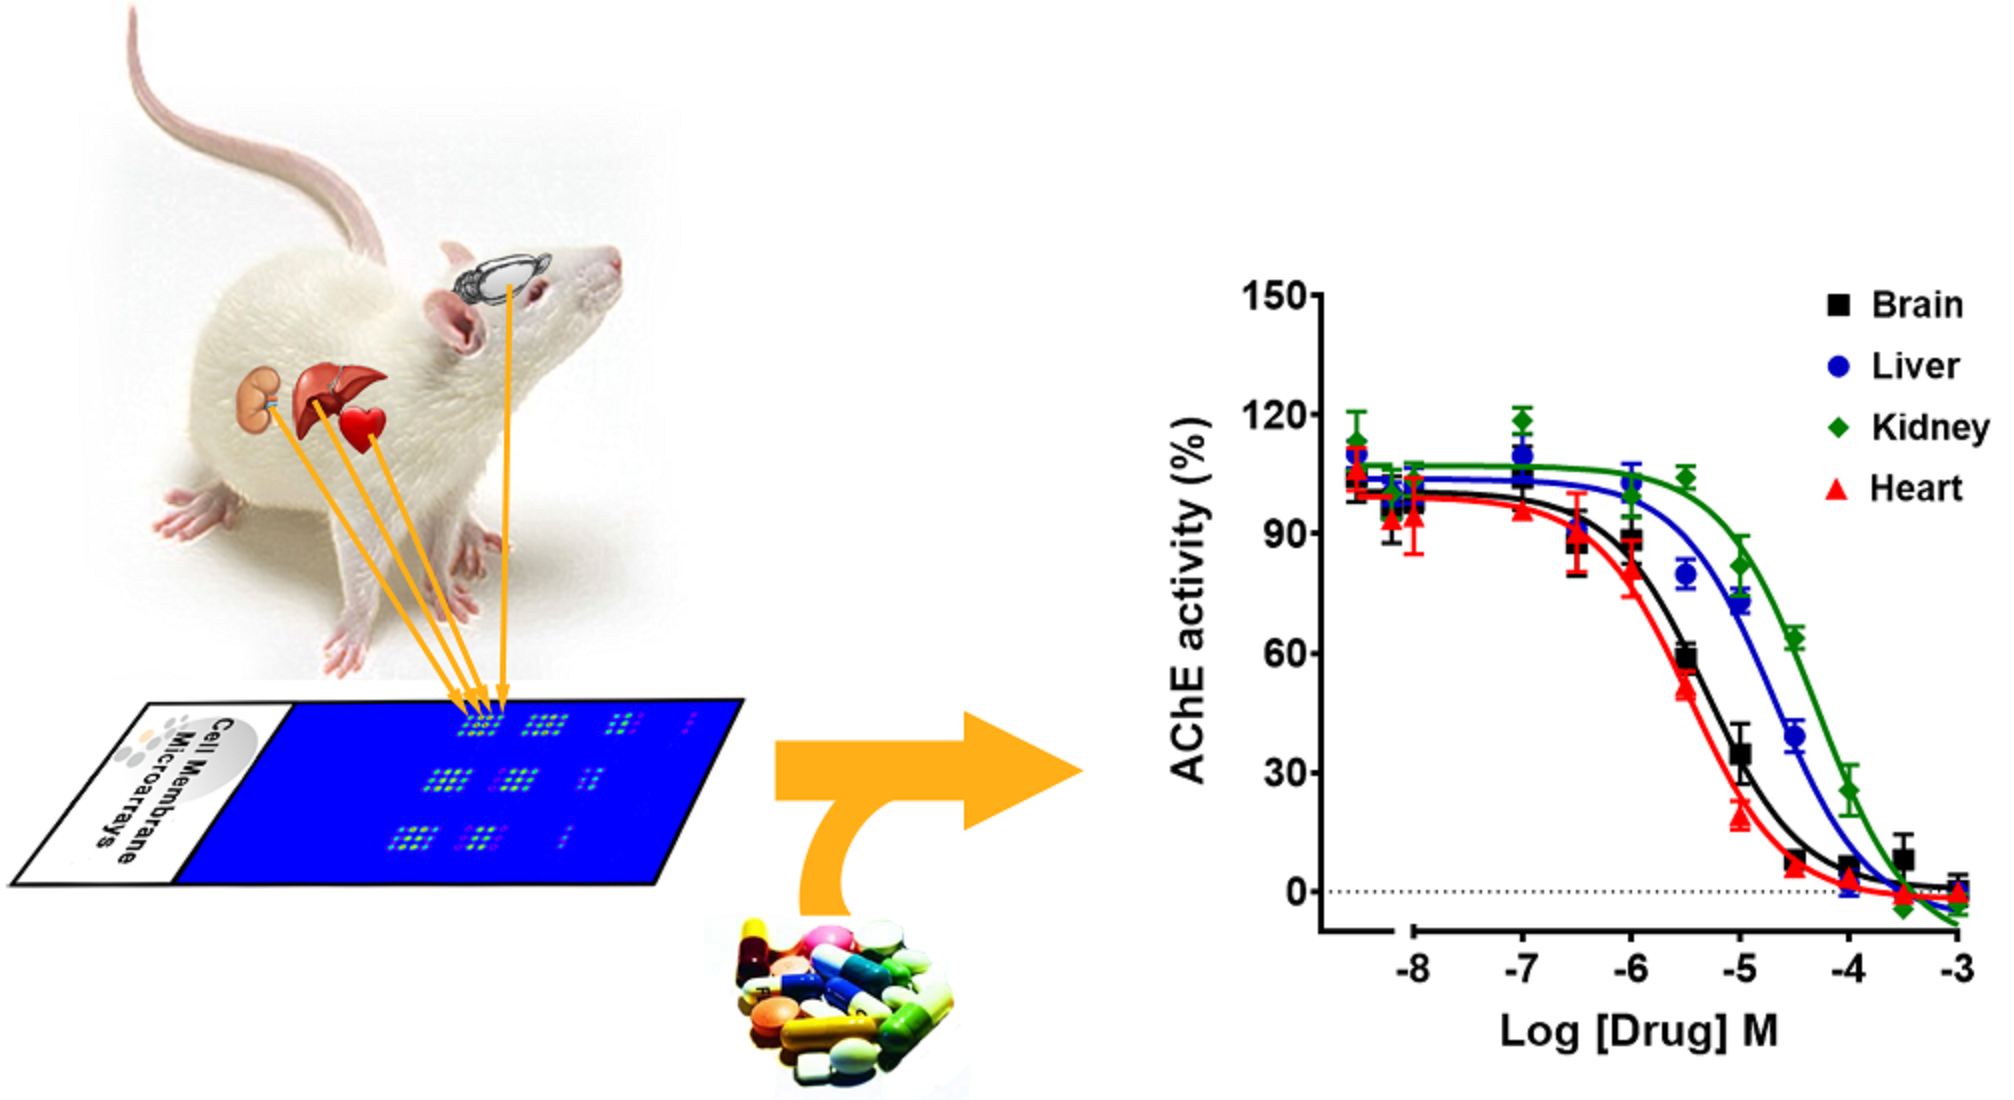
3. Results and Discussion

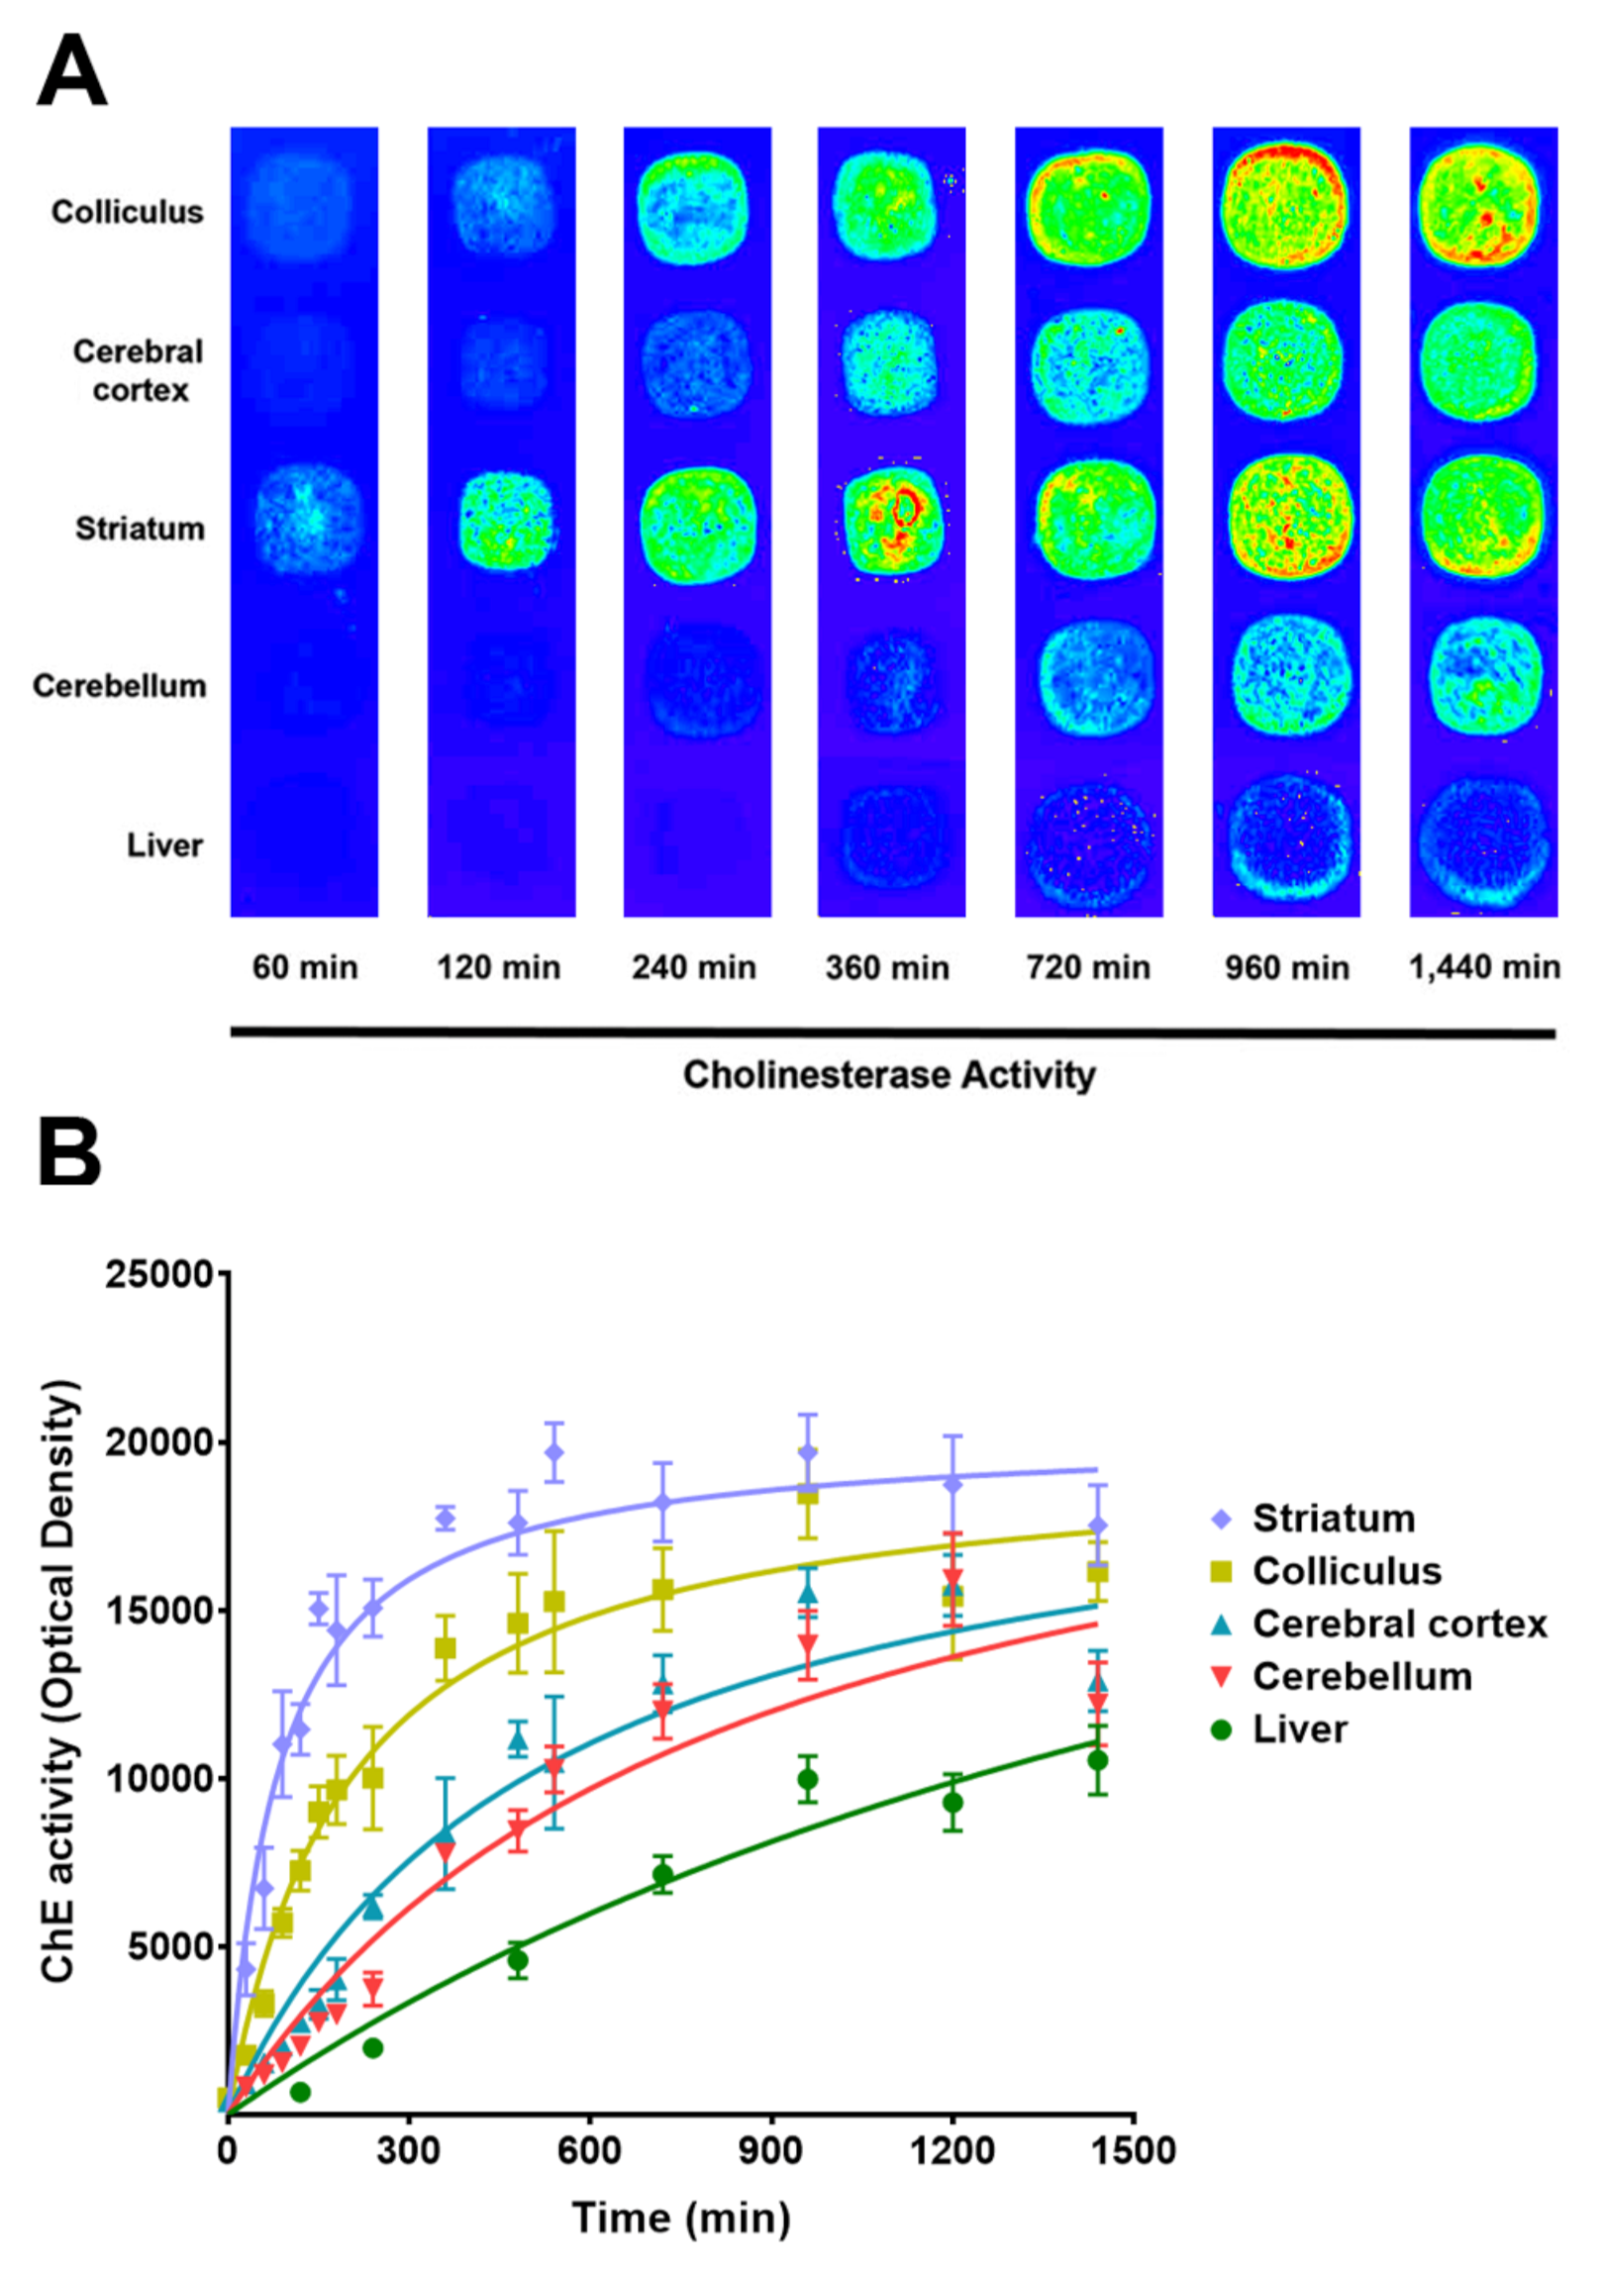
3.1. Protocol Optimization to Detect ChE and AChE Activity in Cell Membrane Microarrays

We modified and optimized the traditional histochemical methodology implemented by Karnovsky and Roots for AChE localization in tissue sections [24] to detect membrane-bound ChE and AChE activity in the CMM. In this method, thiocholine is enzymatically released from acetylthiocholine, reducing ferricyanide to ferrocyanide which precipitates by cupric ion and citrate as cupric ferrocyanide, Cu2+Fe2+(CN)6, known as Hatchett’s brown. To achieve this aim, ChE activity was tested at different pH in CMMs consisting of membranes isolated from the cerebral cortex, striatum, cerebellum and the liver. At pH 7.4, an increase in the deposition of unspecific precipitates and a decrease in ChE activity compared to the same assay performed at pH 6 were recorded (Figure S1, Supporting Information), which is congruent with previous results described for light microscopy in tissue sections [24]. Therefore, pH 6 was selected to perform the following experiments.
CMMs obtained from cerebral cortex, striatum, colliculus, cerebellum and liver were subsequently incubated at different times (from 30 min to 20 h) with the reaction medium to determine the best time to establish the maximal enzymatic activities of ChE. This activity increased over time without reaching equilibrium within 20 h of assessment in the cerebral cortex, cerebellum, and liver (Figure 1). As the unspecific deposition was increased over time, the optimal incubation time chosen to obtain the best signal/noise ratio was 16 h. These data were consistent with those obtained from similar experiments performed in membrane homogenates and quantified by colorimetric assays using a spectrophotometer (Figure S1, Supporting Information), in contrast with the 0.5 to 2 h proposed for tissue sections [32]. This discrepancy could be because of the fact that the protocol was optimized to detect AChE activity not only in nervous, but also in peripheral tissues, where its activity is lower [33]. In this context, the membranes isolated from liver, where ChE activity is mainly because of BuChE [34,35] showed a little activity at two hours compared with that obtained from nervous tissue, in which AChE is principally responsible for ChE activity [36,37,38].

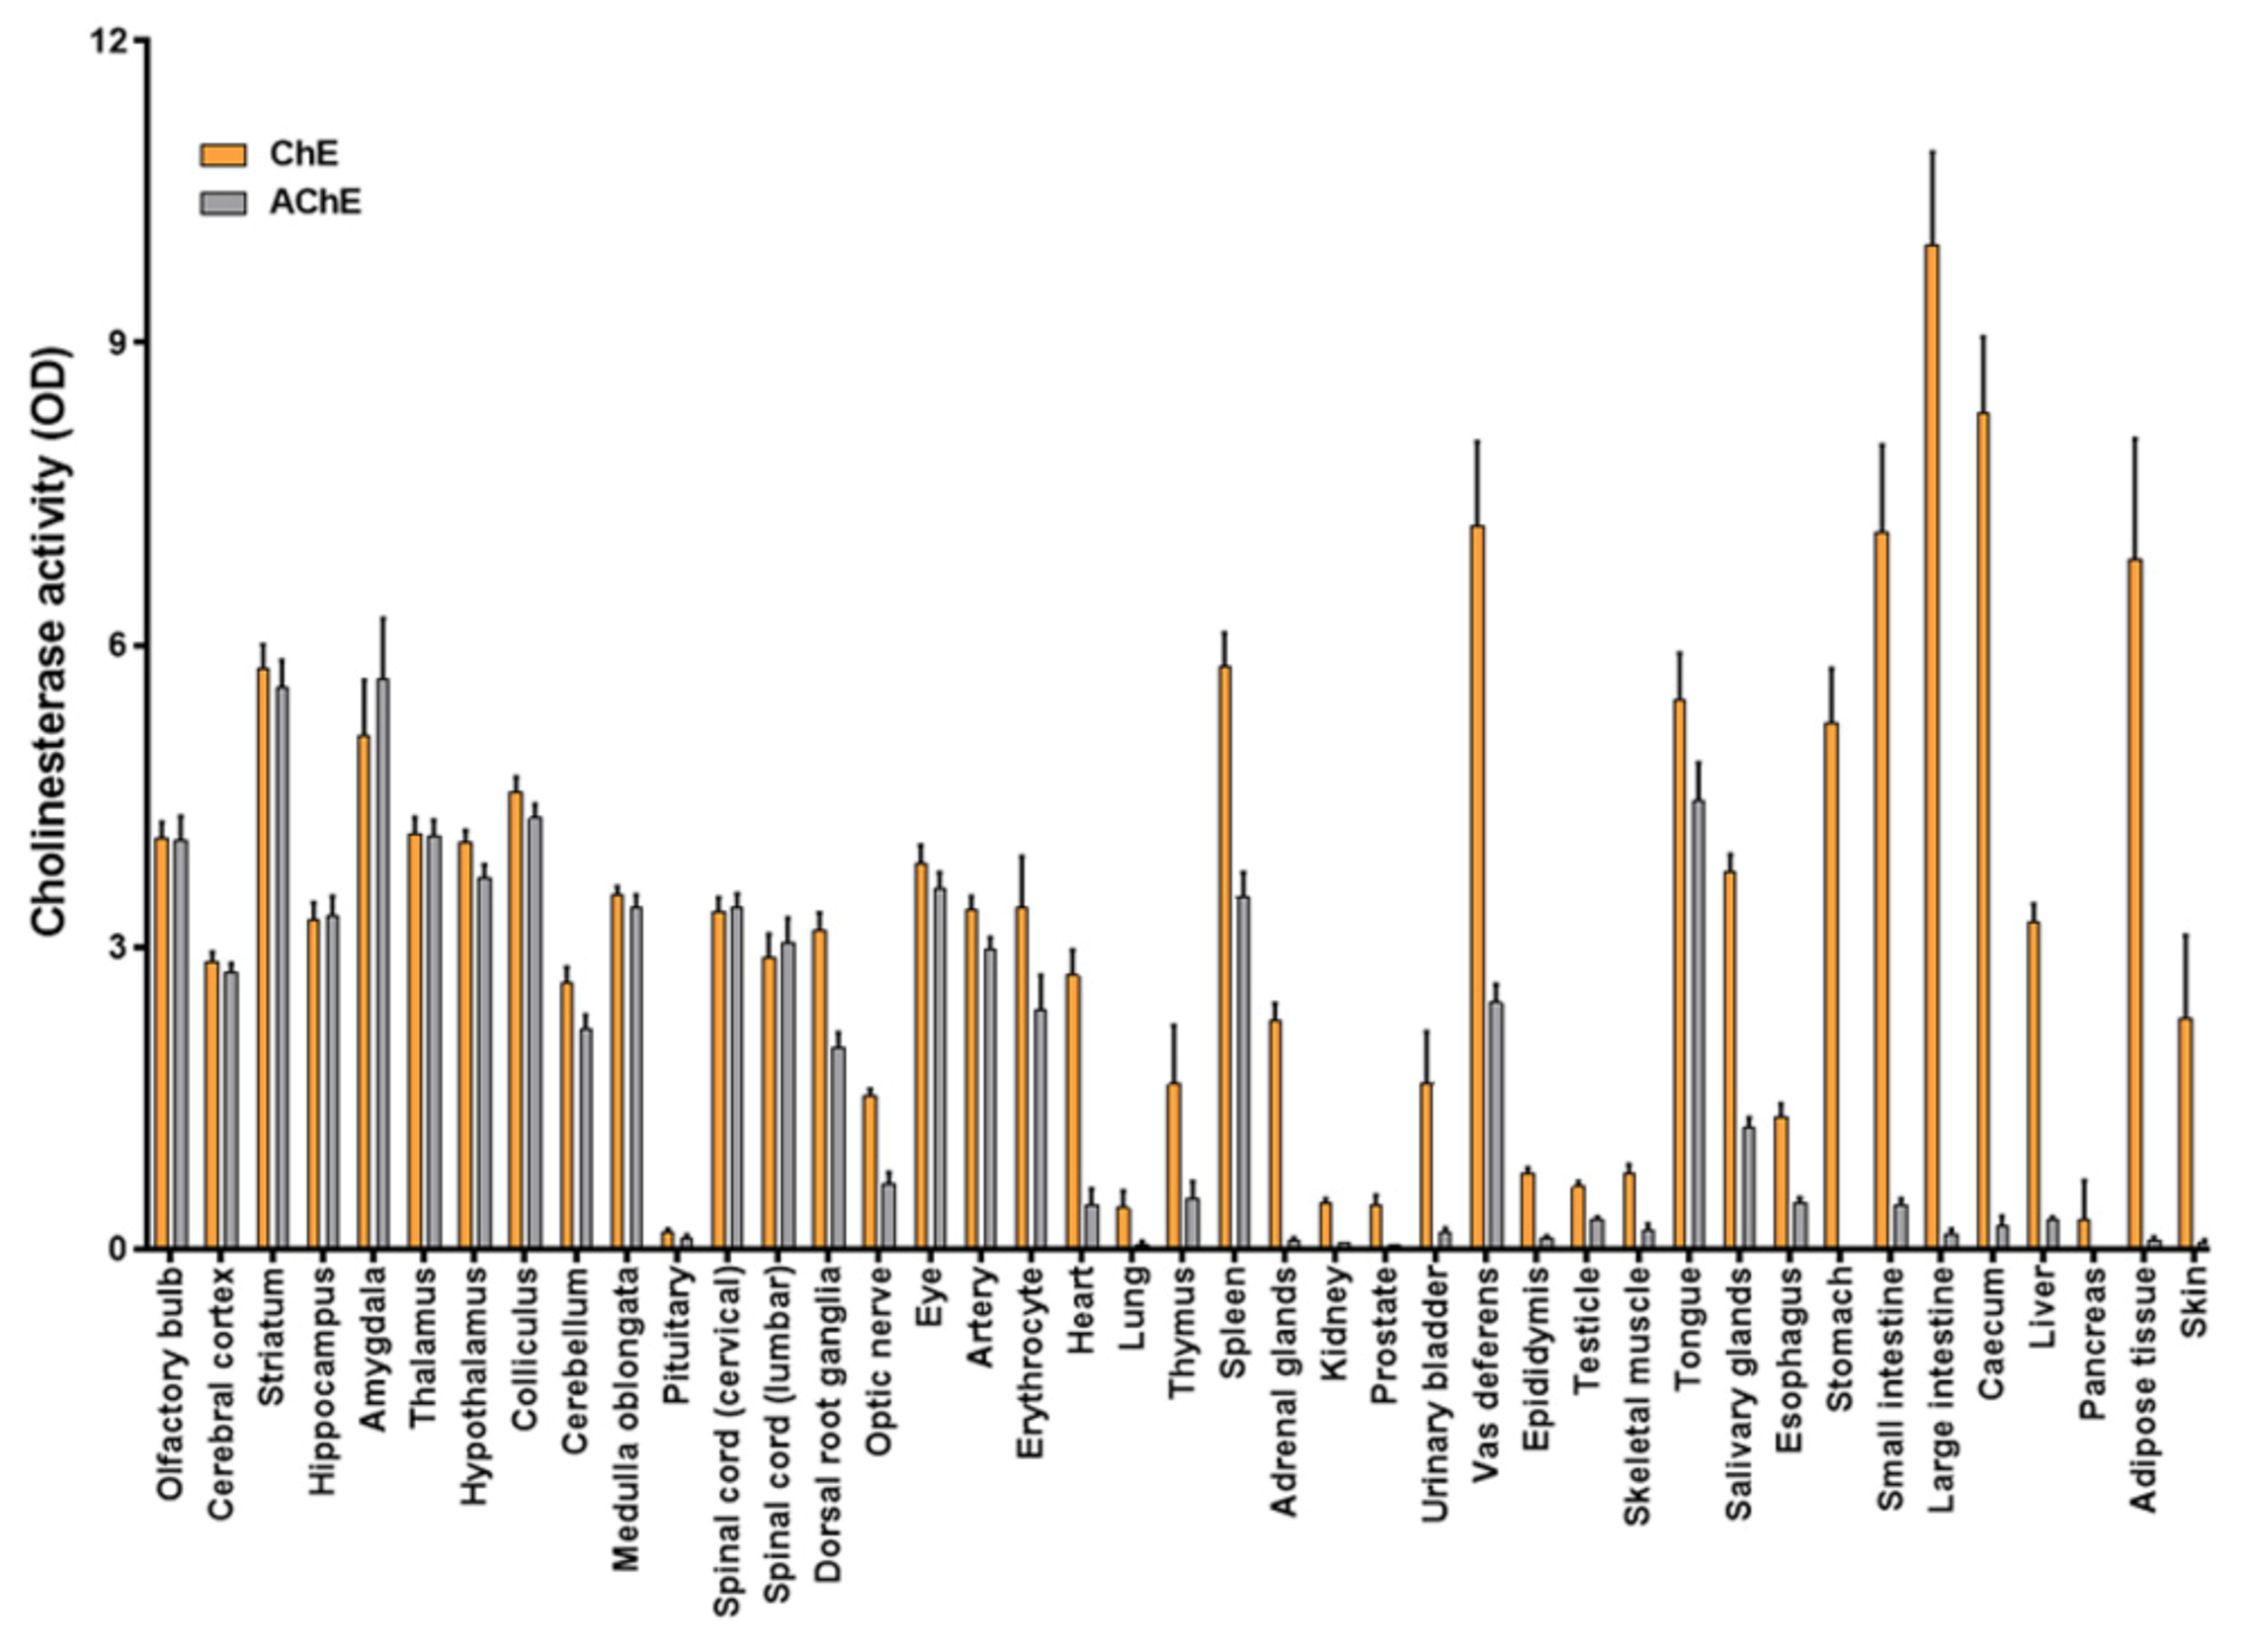
3.2. Determination of ChE and AChE Activities in a Collection of Rat Tissues Using CMMs

ChE and AChE activities were determined in CMMs consisting of membranes isolated from 41 different rat tissues and organs spotted in triplicate in a single miniaturized assay. The optical density obtained in each tissue was normalized by total protein using a cell membrane microarray printed with increasing concentrations of membranes isolated from the cerebral cortex (from 17.5 to 87.5 ng of protein) as the internal control. Maximal ChE activities were obtained in gastrointestinal tract organs, adipose tissue and skin, followed by other organs such as the brain, heart and liver, while the highest AChE activities were found in brain areas (Figure 2). The enzyme most responsible for this activity in these peripheral tissues appeared to be BuChE, while it was AChE in the brain and other peripheral tissues such as arteries, erythrocytes, tongue, vas deferens and spleen, as indicated by the slight inhibition produced by iso-OMPA (Figure S2). These results are in accordance with the distribution of the activity of these ChE enzymes previously reported by other authors [33,39,40,41], although BuChE activity could be underestimated in our assays because of the fact that we use acetylthiocholine as substrate, which is much more specific for AChE than for BuChE [42,43].
To validate these results, the same experiment was replicated in membrane homogenates of the cerebral cortex, spleen, salivary glands, small intestine, heart, adipose tissue and pancreas, using a spectrophotometer to quantify. Good correlations were obtained for both enzymatic activities: ChE (r = 0.8460, p < 0.05) and AChE (r = 0.9028, p < 0.01) (Figure S3). Furthermore, the enzymatic activities determined using CMMs correlated with that described by Shih using Ellman´s method (r = 0.8380, p < 0.001) for ChE [29] and by Das and co-workers (r = 0.9409, p < 0.001) for the detergent-soluble fraction of AChE [41]. Several studies described that AChE activity is mainly detected in nervous tissues, being in the minority in peripheral tissues such as heart [40]. In this sense, higher activity has been detected in the basal ganglia of the brain, where striatum is the major area. Other brain regions such as cerebral cortex present an important AChE activity but less than basal ganglia [44,45]. This distribution is consistent with the activity and expression determined in the tissues and brain areas included in CMMs (Figure 2 and Figure S4).

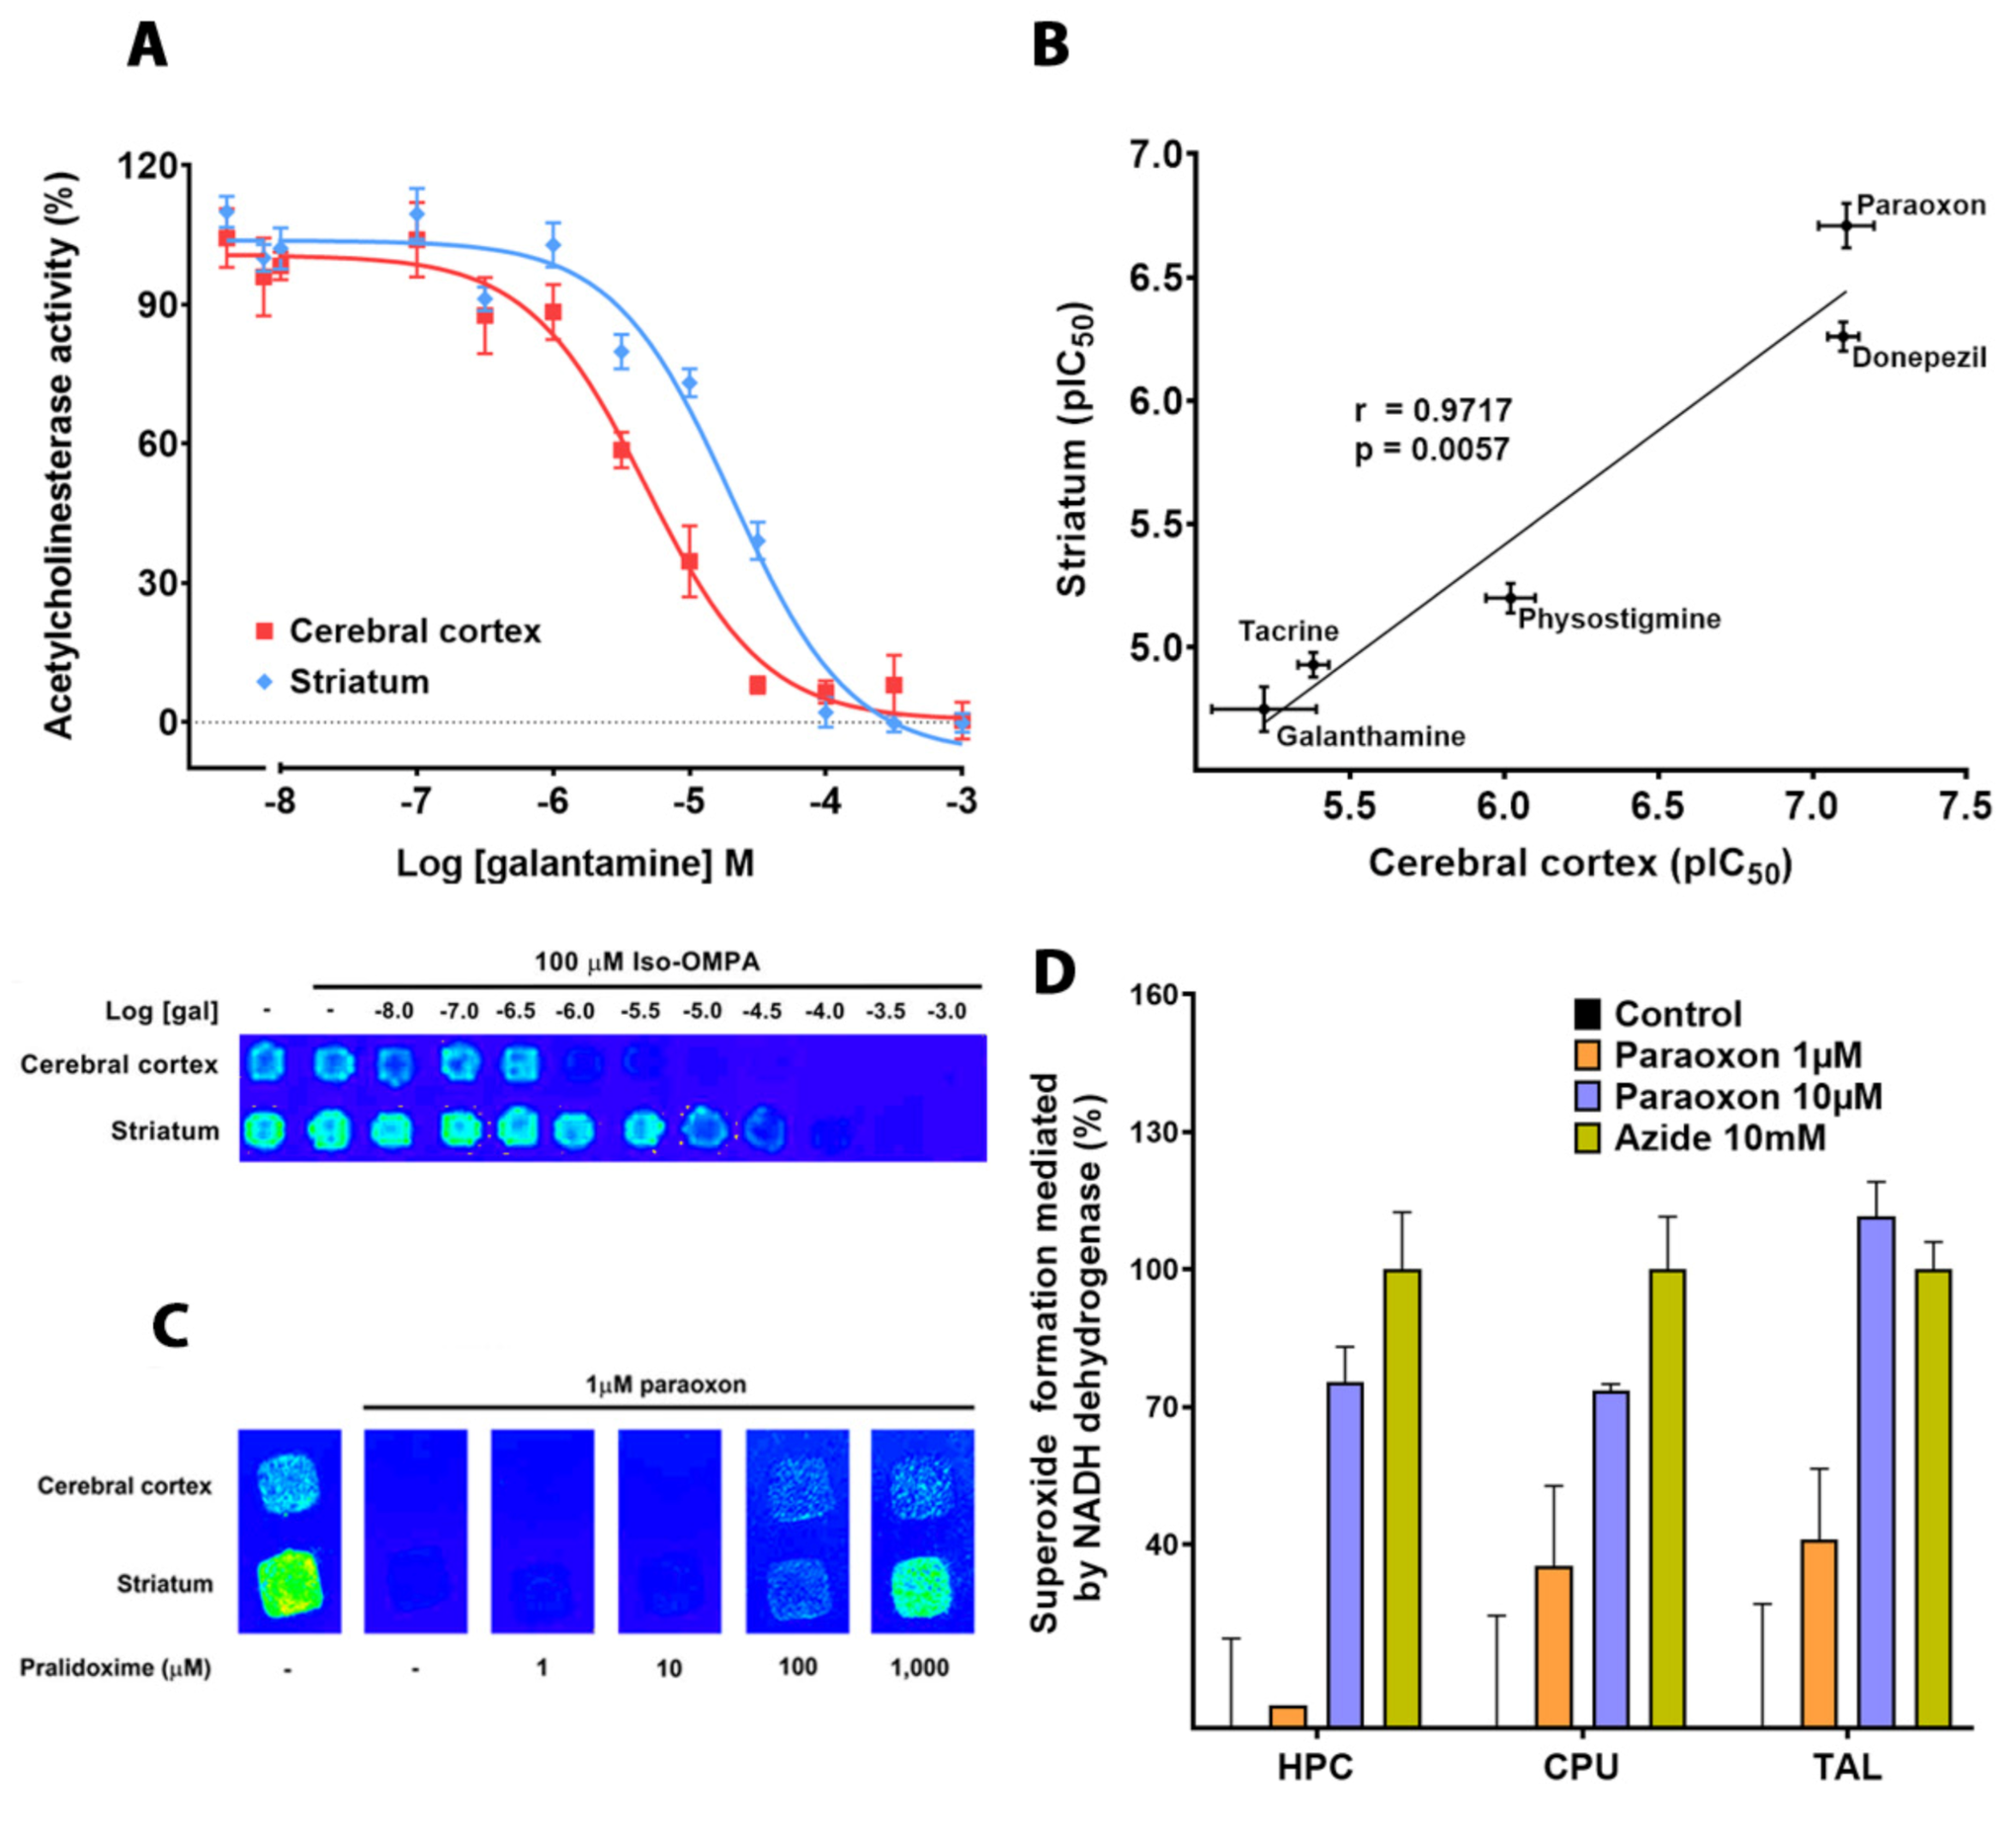
3.3. Effects of Donepezil on AChE Activity Using CMMs

To demonstrate the usefulness of this platform in the assessment of potency of AChE inhibitors, CMMs made of membrane homogenates isolated from 41 rat organs and tissues were incubated with increasing concentrations of donepezil, a non-competitive reversible AChE inhibitor, in presence of 0.1 mM Iso-OMPA. Donepezil concentration–response curves with IC50 values between 52 nM and 1260 nM were thus simultaneously obtained depending on the tissue. In this context, donepezil revealed the highest inhibition of AChE activity in the dorsal root ganglia, while the lowest was in the amygdala (Table 1). This tissue-specific effect could be due to the different AChE isoforms, in addition to anchoring partners or the lipid composition [19,46,47]. IC50 values quantified in some areas of the rat brain such as cerebral cortex (79 ± 9 nM) were similar to those obtained by Snape and co-workers in whole brain (33 ± 12 nM) using Ellman’s method [48]. Nevertheless, some authors reported lower IC50 values for donepezil probably because their studies refer to the whole brain or because experiments were performed in different species [46,49]. Noteworthily, this novel methodology enables, in a single miniaturized assay, the pharmacological characterization of the primary targets of a test compound in multiple tissues and organs, due to the low amount of sample required.

3.4. Inhibition of AChE Activity by Different Drugs Using Striatal and Cortical CMMs

To demonstrate that this technology provides results that are comparable with those obtained by conventional techniques, the effect of several known inhibitors on AChE activity was tested. To that end, CMMs made of cortical and striatal membranes were incubated in the reaction buffer reported previously to determine AChE activity in the absence and presence of increasing concentrations of the active metabolite of the organophosphorus insecticide parathion (paraoxon), as well as of drugs used to treat AD (tacrine, physostigmine, galanthamine and donepezil). All drugs tested produced concentration–response curves in both kinds of brain tissues, with IC50 values in the micromolar range. Although the inhibition observed in the cerebral cortex was higher than in the striatum, the IC50 quantified for each drug showed good correlation in both tissues (Figure 3). In this context, paraoxon was the most potent drug in inhibiting AChE in both brain areas, showing very low IC50 values, followed by donepezil, physostigmine, tacrine and galantamine as other authors have previously reported [37,38,47,49,50,51,52,53]. The IC50 determined for all drugs analyzed in both brain areas, using CMMs, presented good correlation (r = 0.9717; p < 0.01) even if the inhibition observed in the cerebral cortex was higher than in the striatum, probably because of the action on the tetrameric (G4) forms of AChE [51]. Furthermore, the inhibition induced by paraoxon was partially obviated by pralidoxime, an oxime usually used to counteract the toxic effects of organophosphorates or nerve agents [54] (Figure 3).
Once the inhibitory effect was determined in cortex and striatum, we studied whether paraoxon, in addition to inhibiting the AChE, was also responsible for the production of ROS by NADH oxidoreductases. For this purpose, the Karnovsky and Roots protocol was modified, using NADH and decylubiquinone as substrates and cofactor, in order to evaluate the ROS formation using a tetrazolium salt. We dried the CMM for 30 min and then we incubated the membranes with phosphate buffer 5 mM, decylubiquinone 50 µM, nitroblue tetrazolium chloride 0.05 mg/mL, azide 10 mM and different concentrations of paraoxon. We observed that paraoxon induced a concentration dependent increase in reactive oxygen species in cerebral areas like hippocampus, striatum and thalamus (Figure 3). Thus, the ROS stress induced by paraoxon could also be involved in the toxic effect of this insecticide on specific brain regions (Figure 3).

4. Conclusions

In summary, we propose a novel platform based on CMMs obtained from a tissue collection to estimate membrane-associated AChE activity and to screen compounds that act through membrane-bound cholinesterases, in a single miniaturized assay. Several attempts have been performed to quantify AChE activity and to screen AChE ligands in serum samples, membrane homogenates or AChE-enriched solutions with high sensibility and reproducibility [4,5,6,7,8,9,10,11,12,13,14,15,16,17]. However, these methods are optimized to soluble AChE and require the addition of detergent to study the membrane-bound AChE, which can alter the lipid environment in addition to enzyme structure and function. By contrast, CMMs are developed specifically to study membrane proteins using a protocol that immobilizes membranes isolated from different tissues and maintains the membrane environment and the functionality of the proteins [30]. This feature is important for screening AChE inhibitors because the action of these drugs varies among tissues, depending on the expression of AChE isoforms, anchoring partners or the lipid composition [19,46,47]. Therefore, the CMM-based biotechnological platform developed in this work can be considered a robust miniaturized assay for the screening of AChE ligands in multiple rat tissues. We demonstrate its utility for studying ChE, and in particular AChE activity levels, and the action exerted by different drugs on these enzymes in multiple rat organs and tissues simultaneously, with the main advantage that the amount of sample is significantly less than that required by conventional techniques. This characteristic enables the inclusion of precious tissues that could not otherwise be studied because of difficulty in the procurement, scarcity or high cost. This biotechnological platform also reduces the amount of drug candidate required to perform the assay, as well as generated residues, resulting in time and cost saving. The versatility of this methodology enables inclusion of membranes isolated from different sources, thereby facilitating the study of AChE in different species as well as under several pathologic conditions. Moreover, other membrane-bound enzymes may further extend the applicability of this approach, such as the study of the NADH dehydrogenase complex in different diseases such as depression [55,56].

Supplementary Materials

The following are available online at https://www.mdpi.com/2673-4532/2/1/3/s1, Figure S1: False color representative images of cholinesterase activity determined at different pH in cell membrane microarrays consisted of rat membranes homogenates isolated from striatum, cerebral cortex cerebellum and liver (A). An increase in the deposition of unspecific precipitates and a decrease in the cholinesterase activity were observed at pH 7.4 in comparison with the same assay performed at pH 6. Correlation between cholinesterase activities quantified using the spectrophotometer or cell membrane microarrays in rat membrane homogenates isolated from cerebral cortex (B) and liver (C). Data are mean ± SEM values from 3 experiments performed in different CMM, Figure S2: Cholinesterase effects of specific inhibitors of BuChE and AChE on the rat colliculus. Sagittal sections (A) and cell membrane microarrays (B) were incubated in absence or in presence of 100 µM Iso-OMPA alone or together with 100 µM galantamine. Note the decrease in the colorimetric signal evoked by the AChE inhibitor, galantamine, on sagittal tissue sections and cell membranes microarrays of rat colliculus, Figure S3: Correlation between cholinesterase (A) and acetylcholinesterase (B) activities quantified using the spectrophotometer or CMM in rat membrane homogenates isolated from cerebral cortex, spleen, salivary glands, heart, pancreas, small intestine and adipose tissue. Data are mean ± SEM values from 3 experiments performed in different CMM, Figure S4: Representative images of the fluorescent immunodetection of AChE using rat cell membrane microarrays (A) and the graphic representation of the AChE signal (B). Cell membrane microarray consisted of increasing amount of membrane preparation isolated from a pool of striatum, cerebellum and heart of Sprage Dawnley rats (n = 10). The protocol used was as follows. Microarrays were incubated with the blocking buffer (PBS, 0.3% triton and 1:200 Normal Goat Serum) for 30 min before adding the anti-AChE mouse monoclonal antibody (ref: MAB304, Merck Millipore) at 1:200 dissolved in blocking buffer. After 1 h at room temperature, microarrays were revealed with the secondary antibody goat anti-mouse Alexa Fluor 555 (Abcam) at 1:200 in the blocking buffer. Finally, microarrays were rinsed with PBS for 10 min, and the fluorescence was quantified using a ChemiDoc MP imaging system. Nonspecific immunoreactivity was determined in the absence of the primary antibody.

Author Contributions

All authors had full access to all the data in the study and take responsibility for the integrity of the data and the accuracy of the data analysis. Study concept and design: G.B.-G. Acquisition of data: A.E., B.R., T.T.-C. and G.B.-G. Analysis and interpretation of data: B.R., M.G., A.E. and G.B.-G. Drafting of the manuscript: all authors. Critical revision of the manuscript for important intellectual content: all authors. Statistical analysis: B.R., E.A. and G.B.-G. Obtained funding: E.A. and G.B.-G. Study supervision: all authors. All authors have read and agreed to the published version of the manuscript.

Funding

The Spanish Ministry of Economy and Competitiveness (Innpacto program: IPT-2011-1205-010000), and the Basque Government Department of Economic Development, sustainability and environment (Etorgai program: ER-2011/00015, Bikaintek program: 48-AF-W2-2019-7).

Institutional Review Board Statement

Animal care and research protocols were carried out according to guidelines approved by the Institution’s Ethical Committee following Spanish Legislation (RD 1201/2005) and the internationally accepted directives (86/609/EEC).

Informed Consent Statement

Not applicable.

Data Availability Statement

The data that support the findings of this study are available from the corresponding author, Gabriel Barreda-Gómez, upon reasonable request.

Conflicts of Interest

The authors declare no conflict of interest.

References

  1. Bartus, R.T.; Dean, R.L., 3rd; Beer, B.; Lippa, A.S. The cholinergic hypothesis of geriatric memory dysfunction. Science 1982, 217, 408–414. [Google Scholar] [CrossRef]
  2. Perry, E.K.; Curtis, M.; Dick, D.J.; Candy, J.M.; Atack, J.R.; Bloxham, C.A.; Blessed, G.; Fairbairn, A.; Tomlinson, B.E.; Perry, R.H. Cholinergic correlates of cognitive impairment in Parkinson’s disease: Comparisons with Alzheimer’s disease. J. Neurol. Neurosurg. Psychiatry 1985, 48, 413–421. [Google Scholar] [CrossRef] [Green Version]
  3. Pohanka, M. Cholinesterases, a target of pharmacology and toxicology. Biomed. Pap. Med. Fac. Univ. Palacky Olomouc Czech Repub. 2011, 155, 219–229. [Google Scholar] [CrossRef] [Green Version]
  4. Wang, M.; Gu, X.; Zhang, G.; Zhang, D.; Zhu, D. Continuous colorimetric assay for acetylcholinesterase and inhibitor screening with gold nanoparticles. Langmuir 2009, 25, 2504–2507. [Google Scholar] [CrossRef]
  5. Li, Y.; Bai, H.; Li, C.; Shi, G. Colorimetric Assays for Acetylcholinesterase Activity and Inhibitor Screening Based on the Disassembly—Assembly of a Water-Soluble Polythiophene Derivative. ACS Appl. Matter Interfaces 2011, 3, 1306–1310. [Google Scholar] [CrossRef]
  6. Ellman, G.L.; Courtney, K.D.; Andres, V., Jr.; Feather-Stone, R.M. A new and rapid colorimetric determination of acetylcholinesterase activity. Biochem. Pharmacol. 1961, 7, 88–95. [Google Scholar] [CrossRef]
  7. Hay, D.L.; Ibrahim, G.F.; Horacek, I. Rapid acetylcholinesterase screening test for neural tube defect. Clin. Chem. 1983, 29, 1065–1069. [Google Scholar] [CrossRef]
  8. Guilbault, G.G.; Kramer, D.N. Fluorometric system employing immobilized cholinesterase for assaying anticholinesterase compounds. Anal. Chem. 1965, 37, 1675–1680. [Google Scholar] [CrossRef]
  9. Wang, M.; Gu, X.; Zhang, G.; Zhang, D.; Zhu, D. Convenient and continuous fluorometric assay method for acetylcholinesterase and inhibitor screening based on the aggregation-induced emission. Anal. Chem. 2009, 81, 4444–4449. [Google Scholar] [CrossRef]
  10. Shen, X.; Liang, F.; Zhang, G.; Zhang, D. A new continuous fluorometric assay for acetylcholinesterase activity and inhibitor screening with emissive core–shell silica particles containing tetraphenylethylene fluorophore. Analyst 2012, 137, 2119–2123. [Google Scholar] [CrossRef]
  11. Liao, D.; Chen, J.; Zhou, H.; Wang, Y.; Li, Y.; Yu, C. In situ formation of metal coordination polymer: A strategy for fluorescence turn-on assay of acetylcholinesterase activity and inhibitor screening. Anal. Chem. 2013, 85, 2667–2672. [Google Scholar] [CrossRef]
  12. Winteringham, F.P.; Disney, R.W. Radiometric assay of acetylcholinesterase. Nature 1962, 195, 1303. [Google Scholar] [CrossRef] [PubMed]
  13. Kikuchi, T.; Okamura, T.; Arai, T.; Obeta, T.; Fukushi, K.; Irie, T.; Shiraishi, T. Use of a novel radiometric method to assess the inhibitory effect of donepezil on acetylcholinesterase activity in minimally diluted tissue samples. Br. J. Pharmacol. 2010, 159, 1732–1742. [Google Scholar] [CrossRef] [PubMed] [Green Version]
  14. Potter, P.E.; Meek, J.L.; Neff, N.H. Acetylcholine and choline in neuronal tissue measured by HPLC with electrochemical detection. J. Neurochem. 1983, 41, 188–194. [Google Scholar] [CrossRef]
  15. Durand, P.; Thomas, D. Use of immobilized enzyme coupled with an electrochemical sensor for the detection of organophosphates and carbamates pesticides. J. Environ. Pathol. Toxicol. Oncol. 1984, 5, 51–57. [Google Scholar] [PubMed]
  16. Du, D.; Tao, Y.; Zhang, W.; Liu, D.; Li, H. Oxidative desorption of thiocholine assembled on core–shell Fe3O4/AuNPs magnetic nanocomposites for highly sensitive determination of acetylcholinesterase activity: An exposure biomarker of organophosphates. Biosens. Bioelectron. 2011, 26, 4231–4235. [Google Scholar] [CrossRef]
  17. Cuartero, M.; Ortuño, J.A.; García, M.S.; García-Cánovas, F. Assay of acetylcholinesterase activity by potentiometric monitoring of acetylcholine. Anal. Biochem. 2012, 421, 208–212. [Google Scholar] [CrossRef]
  18. Monton, M.R.; Lebert, J.M.; Little, J.R.; Nair, J.J.; McNulty, J.; Brennan, J.D. A Sol Gel-Derived Acetylcholinesterase Microarray for Nanovolume Small-Molecule Screening. Anal. Chem. 2010, 82, 9365–9373. [Google Scholar] [CrossRef] [PubMed]
  19. Hicks, D.; John, D.; Makova, N.Z.; Henderson, Z.; Nalivaeva, N.N.; Turner, A.J. Membrane targeting, shedding and protein interactions of brain acetylcholinesterase. J. Neurochem. 2011, 116, 742–746. [Google Scholar] [CrossRef]
  20. Manuel, I.; Barreda-Gómez, G.; González de San Román, E.; Veloso, A.; Fernández, J.A.; Giralt, M.T.; Rodríguez-Puertas, R. Neurotransmitter receptor localization: From autoradiography to imaging mass spectrometry. ACS Chem. Neurosci. 2015, 6, 362–373. [Google Scholar] [CrossRef]
  21. Hebert-Chatelain, E.; Desprez, T.; Serrat, R.; Bellocchio, L.; Soria-Gomez, E.; Busquets-Garcia, A.; Pagano Zottola, A.C.; Delamarre, A.; Cannich, A.; Vincent, P.; et al. A cannabinoid link between mitochondria and memory. Nature 2016, 539, 555–559. [Google Scholar] [CrossRef] [PubMed]
  22. Fernández, R.; Garate, J.; Tolentino-Cortez, T.; Herraiz, A.; Lombardero, L.; Ducrocq, F.; Rodríguez-Puertas, R.; Trifilieff, P.; Astigarraga, E.; Barreda-Gómez, G.; et al. Microarray and Mass Spectrometry-Based Methodology for Lipid Profiling of Tissues and Cell Cultures. Anal. Chem. 2019, 91, 15967–15973. [Google Scholar] [CrossRef] [PubMed]
  23. Pereiro, X.; Fernández, R.; Barreda-Gómez, G.; Ruzafa, N.; Acera, A.; Araiz, J.; Astigarraga, E.; Vecino, E. Comparative lipidomic analysis of mammalian retinal ganglion cells and Müller glia in situ and in vitro using High-Resolution Imaging Mass Spectrometry. Sci. Rep. 2020, 10, 20053. [Google Scholar] [CrossRef]
  24. Karnovsky, M.J.; Roots, L. A” direct-coloring” thiocholine method for cholinesterases. J. Histochem. Cytochem. 1964, 12, 219–221. [Google Scholar] [CrossRef]
  25. Glutekin, F.; Ozturk, M.; Akdogan, M. The effect of organophosphate insecticide chlorpyrifos-ethyl on lipid peroxidation and antioxidant enzymes (in vitro). Arch. Toxicol. 2000, 74, 533–538. [Google Scholar] [CrossRef]
  26. Gupta, J.; Datta, C.; Sarkar, A.; Sengupta, D. 1992. Effect of malathion on antioxidant defense system in human fetus—An in vitro study. Indian J. Exp. Biol. 1992, 30, 352–354. [Google Scholar] [PubMed]
  27. Prins, J.M.; Chao, C.K.; Jacobson, S.M.; Thompson, C.M.; George, K.M. Oxidative stress resulting from exposure of a human salivary gland cells to paraoxon: An in vitro model for organophosphate oral exposure. Toxicol In Vitro 2014, 28, 715–721. [Google Scholar] [CrossRef] [Green Version]
  28. Barreda-Gómez, G.; Giralt, M.T.; Rodríguez-Puertas, R. Methods to measure g-protein-coupled receptor activity for the identification of inverse agonists. Methods Enzymol. 2010, 485, 261–273. [Google Scholar]
  29. Bradford, M.M. A rapid and sensitive method for the quantitation of microgram quantities of protein utilizing the principle of protein-dye binding. Anal. Biochem. 1976, 72, 248–254. [Google Scholar] [CrossRef]
  30. Rodríguez Puertas, R.; Barreda Gómez, G.; Giralt Rué, M.T.; Fernández Pastor, B. Method of Quantifying the G Protein-Coupled Receptor (GPCR)/G Protein Coupling Using a Cell Membrane Array. Patent WO/2007/012688, 1 February 2007. [Google Scholar]
  31. Rodríguez Puertas, R.; Barreda Gómez, G.; Fernández González, J.A.; Astigarraga Arribas, E. Method for the Surface Treatment of Solid Substrates. Patent WO/2008/012391, 31 January 2008. [Google Scholar]
  32. Tago, H.; Kimura, H.; Maeda, T.J. Visualization of detailed acetylcholinesterase fiber and neuron staining in rat brain by a sensitive histochemical procedure. Histochem. Cytochem. 1986, 34, 1431–1438. [Google Scholar] [CrossRef]
  33. Shih, T.M. Comparison of several oximes on reactivation of soman-inhibited blood, brain and tissue cholinesterase activity in rats. Arch. Toxicol. 1993, 67, 637–646. [Google Scholar] [CrossRef]
  34. Mack, A.; Robitzki, A. The key role of butyrylcholinesterase during neurogenesis and neural disorders: An antisense-5′ butyrylcholinesterase-DNA study. Prog. Neurobiol. 2000, 60, 607–628. [Google Scholar] [CrossRef]
  35. Lassiter, T.L.; Marshall, R.S.; Jackson, L.C.; Hunter, D.L.; Vu, J.T.; Padilla, S. Automated measurement of acetylcholinesterase activity in rat peripheral tissues. Toxicology 2003, 186, 241–253. [Google Scholar] [CrossRef]
  36. Ord, M.G.; Thompson, R.H. Pseudo-cholinesterase activity in the central nervous system. Biochem. J. 1952, 51, 245–251. [Google Scholar] [CrossRef] [Green Version]
  37. Milatovic, D.; Dettbarn, W.D. Modification of acetylcholinesterase during adaptation to chronic, subacute paraoxon application in rat. Toxicol. Appl. Pharmacol. 1996, 136, 20–28. [Google Scholar] [CrossRef] [PubMed]
  38. Goh, C.W.; Aw, C.C.; Lee, J.H.; Chen, C.P.; Browne, E.R. Pharmacokinetic and pharmacodynamic properties of cholinesterase inhibitors donepezil, tacrine, and galantamine in aged and young Lister hooded rats. Drug Metab. Dispos. 2011, 39, 402–411. [Google Scholar] [CrossRef] [PubMed] [Green Version]
  39. Edwards, J.A.; Brimijoin, S. Divergent regulation of acetylcholinesterase and butyrylcholinesterase in tissues of the rat. J. Neurochem. 1982, 38, 1393–1403. [Google Scholar] [CrossRef]
  40. Li, B.; Stribley, J.A.; Ticu, A.; Xie, W.; Schopfer, L.M.; Hammond, P.; Brimijoin, S.; Hinrichs, S.H.; Lockridge, O. Abundant tissue butyrylcholinesterase and its possible function in the acetylcholinesterase knockout mouse. J. Neurochem. 2000, 75, 1320–1331. [Google Scholar] [CrossRef]
  41. Das, A.; Dikshit, M.; Nath, C. Profile of acetylcholinesterase in brain areas of male and female rats of adult and old age. Life Sci. 2001, 68, 1545–1555. [Google Scholar] [CrossRef]
  42. Tecles, F.; Cerón, J.J. Determination of whole blood cholinesterase in different animal species using specific substrates. Res. Vet. Sci. 2001, 70, 233–238. [Google Scholar] [CrossRef]
  43. Grigoryan, H.; Halebyan, G.; Lefebvre, B.; Brasme, B.; Masson, P. Mechanism of hydrolysis of dicholine esters with long polymethylene chain by human butyrylcholinesterase. Biochim. Biophys. Acta 2008, 1784, 1818–1824. [Google Scholar] [CrossRef]
  44. Kita, T.; Hata, T.; Higashiguchi, T.; Itoh, E.; Kawabata, A. Changes of total acetylcholine content and the activity of related enzymes in SART (repeated cold)-stressed rat brain and duodenum. Jpn. J. Pharmacol. 1986, 40, 174–177. [Google Scholar] [CrossRef] [PubMed] [Green Version]
  45. Paxinos, G.; Watson, C.R.; Emson, P.C. AChE-stained horizontal sections of the rat brain in stereotaxic coordinates. J. Neurosci. Methods 1980, 3, 129–149. [Google Scholar] [CrossRef]
  46. Rakonczay, Z. Potencies and selectivities of inhibitors of acetylcholinesterase and its molecular forms in normal and Alzheimer’s disease brain. Acta Biol. Hung. 2003, 54, 183–189. [Google Scholar] [CrossRef] [PubMed]
  47. Chen, V.P.; Luk, W.K.; Chan, W.K.; Leung, K.W.; Guo, A.J.; Chan, G.K.; Xu, S.L.; Choi, R.C.; Tsim, K.W. Molecular assembly and biosynthesis of acetylcholinesterase in brain and muscle: The roles of t-peptide, FHB domain, and N-linked glycosylation. Front. Mol. Neurosci. 2011, 4, 36. [Google Scholar] [CrossRef] [Green Version]
  48. Snape, M.F.; Misra, A.; Murray, T.K.; De Souza, R.J.; Williams, J.L.; Cross, A.J.; Green, A.R. A comparative study in rats of the in vitro and in vivo pharmacology of the acetylcholinesterase inhibitors tacrine, donepezil and NXX-066. Neuropharmacology 1999, 38, 181–193. [Google Scholar] [CrossRef]
  49. Ogura, H.; Kosasa, T.; Kuriya, Y.; Yamanishi, Y. Comparison of inhibitory activities of donepezil and other cholinesterase inhibitors on acetylcholinesterase and butyrylcholinesterase in vitro. Methods Find. Exp. Clin. Pharmacol. 2000, 8, 609–613. [Google Scholar] [CrossRef]
  50. Thomsen, T.; Kaden, B.; Fischer, J.P.; Bickel, U.; Barz, H.; Gusztony, G.; Cervos-Navarro, J.; Kewitz, H. Inhibition of acetylcholinesterase activity in human brain tissue and erythrocytes by galanthamine, physostigmine and tacrine. Eur. J. Clin. Chem. Clin. Biochem. 1991, 29, 487–492. [Google Scholar] [CrossRef] [Green Version]
  51. Zhao, Q.; Tang, X.C. Effects of huperzine A on acetylcholinesterase isoforms in vitro: Comparison with tacrine, donepezil, rivastigmine and physostigmine. Eur. J. Pharmacol. 2002, 455, 101–107. [Google Scholar] [CrossRef]
  52. Geerts, H.; Guillaumat, P.O.; Grantham, C.; Bode, W.; Anciaux, K.; Sachak, S. Brain levels and acetylcholinesterase inhibition with galantamine and donepezil in rats, mice, and rabbits. Brain. Res. 2005, 1033, 186–193. [Google Scholar] [CrossRef]
  53. Albuquerque, E.X.; Pereira, E.F.; Aracava, Y.; Fawcett, W.P.; Oliviera, M.; Randall, W.R.; Hamilton, T.A.; Kan, R.K.; Romano, J.A., Jr.; Adler, M. Effective countermeasure against poisoning by organophosphorus insecticides and nerve agents. Proc. Natl. Acad. Sci. USA 2006, 103, 13220–13225. [Google Scholar] [CrossRef] [PubMed] [Green Version]
  54. Kuca, K.; Hrabinova, M.; Soukup, O.; Tobin, G.; Karasova, J.; Pohanka, M. Pralidoxime—The gold standard of acetylcholinesterase reactivators—Reactivation in vitro efficacy. Bratisl. Lek Listy. 2010, 111, 502–504. [Google Scholar]
  55. Ferrari, F.; Villa, R.F. The Neurobiology of Depression: An Integrated Overview from Biological Theories to Clinical Evidence. Mol. Neurobiol. 2017, 54, 4847–4865. [Google Scholar] [CrossRef] [PubMed]
  56. Umeno, A.; Biju, V.; Yoshida, Y. In vivo ROS production and use of oxidative stress-derived biomarkers to detect the onset of diseases such as Alzheimer’s disease, Parkinson’s disease, and diabetes. Free Radic Res. 2017, 51, 413–427. [Google Scholar] [CrossRef] [PubMed]
Figure 1. FalsePseudocolor representative images of cholinesterase activity determined at different times in cell membrane microarrays (CMMs) consisting of rat membrane homogenates isolated from colliculus, cerebral cortex, striatum, cerebellum and liver (A), and the time course curves of cholinesterase (ChE) activity obtained after quantifying each spot (B). Data are mean ± SEM values from 3 experiments performed in different CMMs.
Analytica 02 00003 g001
Figure 2. Distribution of ChE and acetylcholinesterase (AChE) activities in the central nervous system and peripheral tissues of male Sprague Dawley rats. CMMs used in the assay consisted of a collection of 41 rat tissues spotted in triplicate, where each spot corresponds to a pool of membranes isolated from 10 animals. Data are expressed as mean ± SEM (standard error of mean) values from 3 experiments performed in different CMMs.
Analytica 02 00003 g002
Figure 3. (A) False Pseudocolor representative images and the corresponding response curves of AChE activity determined in the cerebral cortex and striatum of male Sprague Dawley rats, using CMMs incubated with different galantamine concentrations. (B) Correlation of half-maximal inhibitory concentrations, represented as the negative logarithm (pIC50), quantified for different AChE ligands in both brain areas. Note that pIC50 determined for each drug in each tissue present good correlation, revealing the robustness of this methodologic platform for screening AChE inhibitors. Data are mean ± SEM values from 3 experiments performed in different CMMs. (C) False Pseudocolor representative images of AChE activity determined in CMMs of membranes isolated from rat cerebral cortex and striatum in the absence or presence of paraoxon (1 µM) and pralidoxime at increasing concentrations. Note that 1 mM pralidoxime partially avoids paraoxon-induced inhibition. (D) Superoxide formation mediated by mitochondrial NADH oxidoreductase in presence of different concentrations of paraoxon on rat hippocampus, striatum and thalamus. Sodium azide 10 mM was used as positive control.
Analytica 02 00003 g003
Table 1. Catalytic activity of AChE, the ratio vs. total ChE activity and the Log half-maximal inhibitory concentration (IC50) value obtained for donepezil were determined for different organs and tissues of male Sprague Dawley rats, using CMMs. AChE activity was normalized by protein amount and expressed in arbitrary units (OD). Data are mean ± SEM values from three experiments performed in different CMMs. ND: not determined.
AChE ActivityAChE/ChE
(%)
Log IC50
Donepezil
Olfactory bulb4.06 ± 0.2499 ± 7−6.76 ± 0.05
Cerebral cortex2.75 ± 0.0996 ± 4−7.10 ± 0.05
Striatum5.57 ± 0.2897 ± 6−6.26 ± 0.06
Hippocampus3.32 ± 0.18102 ± 8−6.87 ± 0.07
Amygdala5.66 ± 0.61111 ± 17−5.90 ± 0.03
Thalamus4.10 ± 0.1699 ± 5−6.56 ± 0.03
Hypothalamus3.69 ± 0.1391 ± 4−6.93 ± 0.03
Colliculus4.28 ± 0.1494 ± 4−6.87 ± 0.03
Cerebellum2.19 ± 0.1482 ± 7−7.20 ± 0.05
Medulla oblongata3.40 ± 0.1297 ± 4−6.85 ± 0.05
Pituitary0.11 ± 0.0369 ± 26ND
Spinal cord (cervical)3.05 ± 0.24105 ± 12−6.72 ± 0.05
Spinal cord (lumbar)3.39 ± 0.14101 ± 6−6.91 ± 0.02
Dorsal root ganglia2.00 ± 0.1563 ± 6−7.28 ± 0.07
Optic nerve0.65 ± 0.1143 ± 7−7.25 ± 0.08
Eye3.59 ± 0.1593 ± 6−6.20 ± 0.06
Artery2.98 ± 0.1288 ± 5−7.12 ± 0.05
Erythrocyte2.38 ± 0.3470 ± 14−6.77 ± 0.10
Heart0.45 ± 0.1516 ± 6ND
Lung0.04 ± 0.0410 ± 10ND
Thymus0.50 ± 0.1731 ± 15ND
Spleen3.50 ± 0.2461 ± 5−7.46 ± 0.06
Adrenal glands0.08 ± 0.033 ± 1ND
Kidney0.06 ± 0.0012 ± 1ND
Prostate0.05 ± 0.0011 ± 2ND
Urinary bladder0.16 ± 0.059 ± 4ND
Vas deferens2.45 ± 0.1834 ± 5−7.47 ± 0.09
Epididymis0.11 ± 0.0214 ± 3ND
Testicle0.30 ± 0.0249 ± 5ND
Skeletal muscle0.20 ± 0.0526 ± 8ND
Tongue4.46 ± 0.3782 ± 10−7.42 ± 0.06
Salivary glands1.20 ± 0.1132 ± 3−7.49 ± 0.10
Esophagus0.46 ± 0.0535 ± 5ND
StomachNDNDND
Small intestine0.44 ± 0.066 ± 1ND
Large intestine0.15 ± 0.052 ± 1ND
Caecum0.24 ± 0.093 ± 1ND
Liver0.30 ± 0.029 ± 1ND
PancreasNDNDND
Adipose tissue0.08 ± 0.041 ± 1ND
Skin0.06 ± 0.033 ± 2ND
Publisher’s Note: MDPI stays neutral with regard to jurisdictional claims in published maps and institutional affiliations.

