1. Introduction
The liver plays a pivotal role in the regulation of metabolic homeostasis through inter-organ crosstalk by secreting proteins, termed ‘hepatokines’, into the systemic circulation [
1]. Given the well-characterised links between elevated liver fat and altered peripheral metabolism, the connection among hepatokines, insulin sensitivity, and glucose metabolism has received significant interest. Studies have shown that circulating hepatokines are associated with adiposity and elements of metabolic syndrome, whilst recent research demonstrates that hepatokines are sensitive to acute perturbations in energy balance, including overnutrition [
2], energy deficit, and exercise [
3].
Leukocyte cell-derived chemotaxin-2 (LECT2) is one hepatokine that has received significant attention, owing to its purported roles in immune function and metabolic health [
4]. In 2014, a seminal study demonstrated that circulating LECT2 is associated with obesity and directly promotes insulin resistance in skeletal muscle [
5]. LECT2 has also been shown to directly promote insulin resistance and inflammation in adipocytes [
6], representing a potential link between elevated liver fat and adipose tissue insulin resistance. More recent studies have found that LECT2 may also connect liver fat and the initiation of hepatic inflammation and fibrogenesis [
7,
8,
9]. A recent discovery in proteomics has also identified an association between LECT2 and drug-induced liver injury [
10], potentially related to the enhancement of lipopolysaccharide-stimulated activation of tissue macrophages and hepatic inflammation. Collectively, these data highlight LECT2 as a novel therapeutic target, particularly in the context of obesity-related metabolic diseases, such as type 2 diabetes (T2DM) and metabolic dysfunction-associated steatotic liver disease (MASLD).
Within the hepatokine literature, a developing body of evidence has focused on its interaction with exercise [
3]. This is because exercise influences energy balance and improves many aspects of cardiometabolic health, including insulin sensitivity. Researchers are keen to determine whether an exercise–hepatokine interaction may contribute to the therapeutic effects of exercise. In rodents (C56BL/6J mice), three hours of exhaustive aerobic exercise reduced circulating LECT2 concentrations as well as hepatic LECT2 mRNA and protein expression [
5]. The researchers mechanistically linked this response to hepatic adenosine monophosphate-activated protein kinase (AMPK) activation, which inhibits hepatic LECT2 [
5,
11]. Hepatic AMPK activation may suppress LECT2 production in response to ‘intense’ exercise, with beneficial consequences for skeletal muscle and adipose tissue insulin sensitivity.
More recently, other studies in humans did not observe a reduction in circulating LECT2 concentrations in response to acute bouts of exercise. In the first study, circulating LECT2 did not respond to moderate-intensity exercise in either lean individuals or individuals with overweight/obesity [
12]. Similarly, after plasma volume correction, circulating LECT2 concentrations were no different after energy expenditure-matched moderate- and high-intensity exercise in healthy adults [
13]. These discrepant results could be related to species differences between rodents and humans, but may also be related to the healthy phenotype of participants in the human studies. Specifically, circulating LECT2 concentrations were low in these populations; therefore, it is possible that further reductions with acute exercise may not be possible.
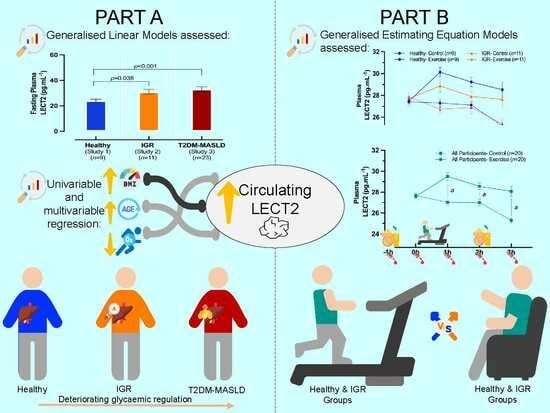
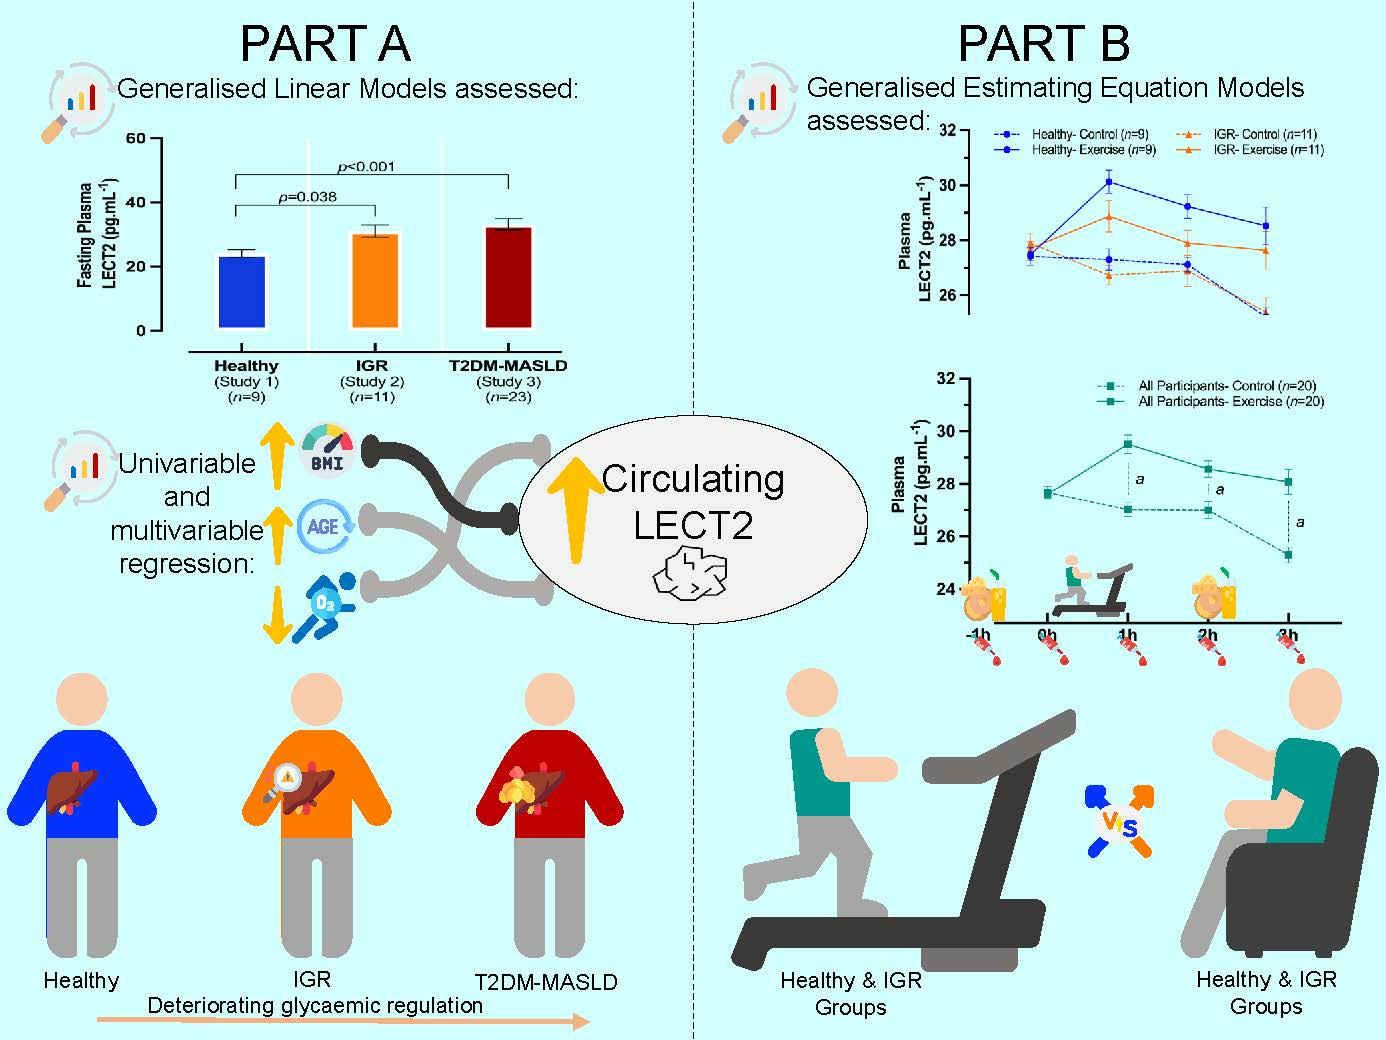
The present study had two aims. Firstly, by combining data from three experimental studies, we compared circulating LECT2 concentrations among healthy individuals, individuals with impaired glycaemic regulation (IGR) and individuals with T2DM. Secondly, we characterised the effects of acute, moderate-intensity aerobic exercise on circulating LECT2 concentrations in healthy individuals and individuals with IGR. We hypothesised that circulating LECT2 concentrations would be higher in the groups with IGR, and that acute exercise would suppress circulating LECT2 concentrations in this group, but not in those with normal glycaemic regulation.
2. Materials and Methods
2.1. Ethical Approval
Data for this study were pooled from three experimental studies, conducted within the National Institute for Health and Care Research (NIHR) Leicester Biomedical Research Centre at Loughborough University (Study 1) and the Leicester Diabetes Centre (Study 2, clinical trials: ISRCTN12337078; Study 3, clinical trials: NCT04004273). Data from Studies 2 and 3 were published previously [
14,
15]. Ethical approval was provided by the local University (Study 1: 2022-11020-11438) and NHS research ethics committees (Study 2: 15-EM-0259; Study 3: 18-EM-0161). All studies were conducted in accordance with the Declaration of Helsinki (2013) [
16], and written informed consent was obtained for each participant before their participation.
2.2. Participant Recruitment and Eligibility
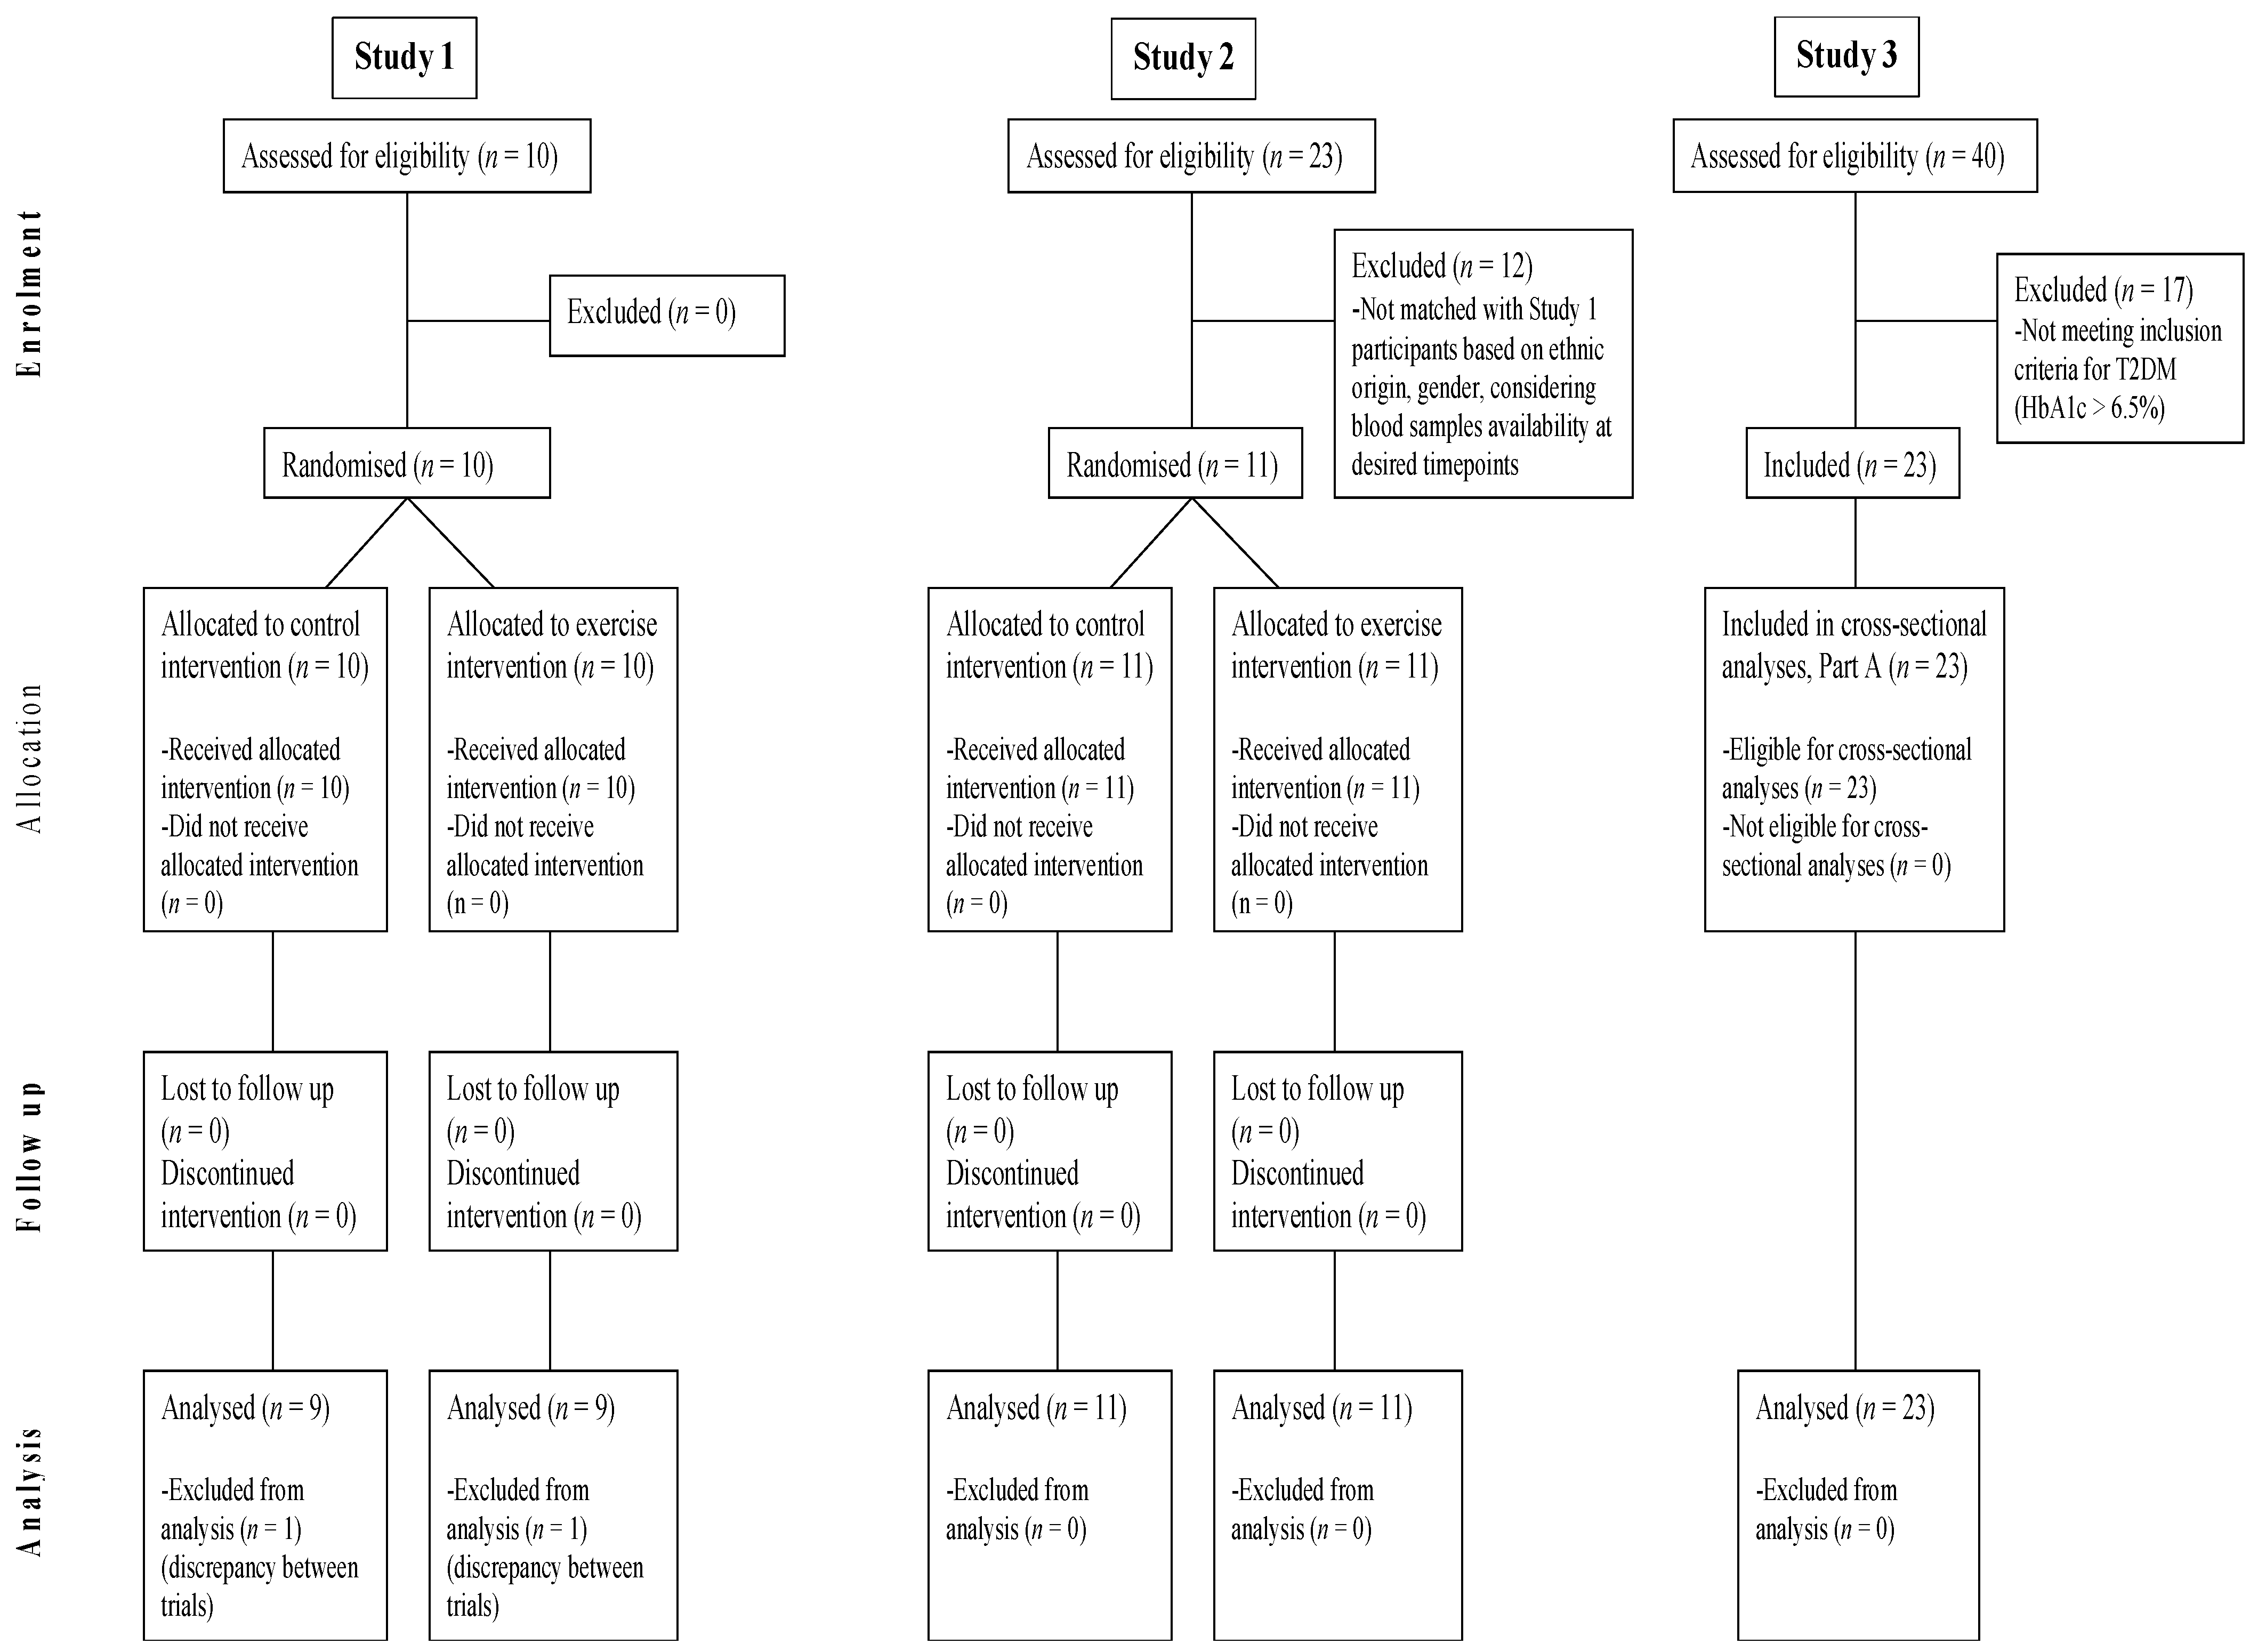
In total, 44 participants across the three studies were included in this analysis, as shown in the Modified CONSORT Flow Diagram (
Figure 1). Primary care services, existing research databases, community groups, weight management services, social media, and word-of-mouth were used to recruit study volunteers. Detailed information on the different study inclusion and exclusion criteria can be found in
Table S1. Briefly, Study 1 recruited healthy (free of any diagnosed chronic metabolic diseases) men and women, aged 18–40 years, with body mass index (BMI) values of ≥18.5 and <30 kg·m
−2. Study 2 recruited men and women with IGR (2 h glucose between 7.8 and 11.1 mmol·L
−1 after an oral glucose tolerance test or HbA1c between 5.70 and 6.49%), aged 50–74 years, with BMI values of ≥27.5 kg·m
−2 (or ≥25.0 kg·m
−2 if of South Asian ethnicity). Study 3 included men with T2DM (defined as glycated haemoglobin levels ≥ 6.5%) and clinically elevated liver fat (≥5.56%, assessed via magnetic resonance spectroscopy), aged 30–75 years, with BMI values of ≥27.0 and ≤45.0 kg·m
−2 (or ≥23.0 kg·m
−2 and ≤45.0 kg·m
−2 if of South Asian ethnicity). In Studies 1 and 2, participants were not taking any glucose-lowering medications, while in Study 3, the participants with T2DM were managing their condition with metformin or lifestyle modification only. In Study 1, participants were recreationally active, but not trained, whereas in Studies 2 and 3, participants were inactive, defined as not undertaking regular purposeful physical activity. Participants were weight-stable in the 6 months before enrolment and were not taking part in any dietary interventions for weight loss. All participants from Study 1 were included in both Part A and Part B. From the total 23 participants in Study 2, 11 individuals (48%) were included based on ethnicity, gender, and availability of blood samples at key timepoints, and were included in Part A and Part B of the present study. In Study 3, out of the total 40 participants, 23 (58%) individuals with T2DM, identified as those with HbA1c > 6.5%, were included in Part A.
2.3. Study Design
This study comprised two parts. Part A was a cross-sectional comparison among three groups of men and women, including the following: (1) a group with healthy participants (Study 1), (2) a group with IGR (Study 2), and (3) a group with T2DM and MASLD (T2DM-MASLD). Part B included participants from Study 1 and Study 2 and involved an acute randomised crossover trial, in which participants completed a moderate-intensity exercise trial and a control trial in a counterbalanced fashion. Random allocation was conducted by the investigators using an online number generator to determine whether participants would be assigned to the exercise or control trial first.
Part A
Data obtained from the baseline assessment visits of all three studies were used in this cross-sectional analysis. Following confirmation of eligibility and informed consent, fasting blood samples (primary outcome), body mass, height, and waist circumference (secondary outcomes) were measured to the nearest 0.1 kg, 0.1 cm, and 0.5 cm, respectively. Body fat percentage (secondary outcome) was estimated via bioelectrical impedance analysis using the SECA (Seca Ltd., Hamburg, Germany; Study 1) and TANITA (TBE 611, Tanita, West Drayton, UK; Studies 2 and 3) scales. All participants completed a health screen questionnaire and then underwent a maximal incremental treadmill exercise test to determine their peak oxygen uptake (VO2peak, secondary outcome), using breath-by-breath indirect calorimetry of expired gases (METALYZER 3B; Cortex Biophysik GmbH, Leipzig, Germany). Participants in Studies 2 and 3 were also assessed by a cardiac nurse, who obtained resting electrocardiogram and blood pressure measurements to confirm participants’ suitability to exercise. These outcomes were also monitored during the associated VO2peak tests.
In Studies 2 and 3, starting with a self-selected walking speed at a 0% gradient, a ramp-based incremental protocol (+1% gradient per minute) was used until participants reached volitional exhaustion, or additional VO
2peak criteria were met [
14]. Identical procedures were undertaken in Study 1, except the test commenced at a higher speed (light jog). VO
2peak was determined by identifying the maximum oxygen uptake reached after calculating a 30s rolling average. For the acute exercise trial, data obtained at sub-maximal stages were used to calculate the running speed required to elicit 65% of VO
2peak for each participant [
13].
Part B
Participants in Studies 1 and 2 then completed the two following acute experimental trials in a randomised, counterbalanced order, lasting around five hours each in total: an exercise trial (30 min at 65% of VO
2peak) and a control trial (rest). At least one week separated the two trials to eliminate any potential carryover effects. For standardisation purposes, participants were asked not to consume alcohol and perform any vigorous physical activity within 48 and 72 h, respectively. Participants also recorded the amount of food and drink they consumed in the two days before their first experimental visit and replicated this before the next visit. A schematic of the experimental trials is presented in
Figure S1.
Participants were asked to arrive at the laboratory at ~800 h having fasted since the prior evening (~2200 h). After confirming willingness to continue and standardisation across trials, participants rested for at least 30 min. At ~900 h, an intravenous cannula was inserted into an antecubital vein, and the first venous blood sample was collected (−1 h), followed by drawing venous blood samples at 0 h, 1 h, 2 h, and 3 h (primary outcome).
Standardised breakfast and lunch meals were provided at −1 h and 2 h, respectively, which participants were asked to consume within 15 min. The meals were calculated based on baseline body weight (8 kcal per kg of body weight), and the same foods were consumed in both trials. The foods provided included a white bagel, full-fat cheddar cheese, full-fat margarine, orange juice and fruit jelly, containing 59.7% carbohydrates, 22.2% fat and 18.1% protein.
Participants rested in the laboratory throughout the trials to prevent any confounding effect of physical activity, except for the exercise trial, in which participants engaged in 30 min of moderate-intensity aerobic exercise (between 0 h and 1 h). Exercise bouts were performed on a treadmill at 65% of VO2peak. The treadmill speed required to elicit the desired exercise intensity was calculated individually using bivariate linear regression from the VO2peak test data obtained at the baseline assessment visit. Periods of 5 min warm-up and cool-down were performed before and after the exercise period, respectively, with the start time of the warm-up staggered in order for the cool-down period to finish 5 min prior to the blood sample at 1 h.
2.4. Blood Sampling and Biochemical Analysis
Venous blood samples were collected into pre-chilled EDTA monovettes (Sarstedt, Leicester, UK) and centrifuged for 10 min at 3500 rpm and 4 °C for plasma isolation. Immediately, plasma was apportioned into 0.5 mL aliquots and stored at −80 °C for later analyses. Plasma concentrations of LECT2 were measured at each timepoint using an enzyme-linked immunosorbent assay (BioVendor, Brno, Czech Republic). Inter-assay variation was limited by analysing all samples collected from the same participant on the same plate. The mean within-batch coefficient of variation for LECT2 was 4.7%.
2.5. Statistical Analysis
All statistical analyses were performed using commercially available statistical software (IBM SPSS Inc., Chicago, IL, USA; version 28.0). Statistical significance was determined with a probability (p) value < 0.05. Baseline characteristics were summarised for the whole cohort and stratified by study group. The distribution of the data for the whole cohort and individual study groups were assessed with Shapiro–Wilk tests and visual inspection of histograms. Participant characteristics are presented as mean ± standard deviation (SD) for normally distributed data (p > 0.05), median (interquartile range (IQR)) for non-normally distributed data (p ≤ 0.05) and number (percentage) for categorical data. It was not possible to perform a sample size calculation, as a portion of the data used in this study consists of previously collected secondary data.
Part A
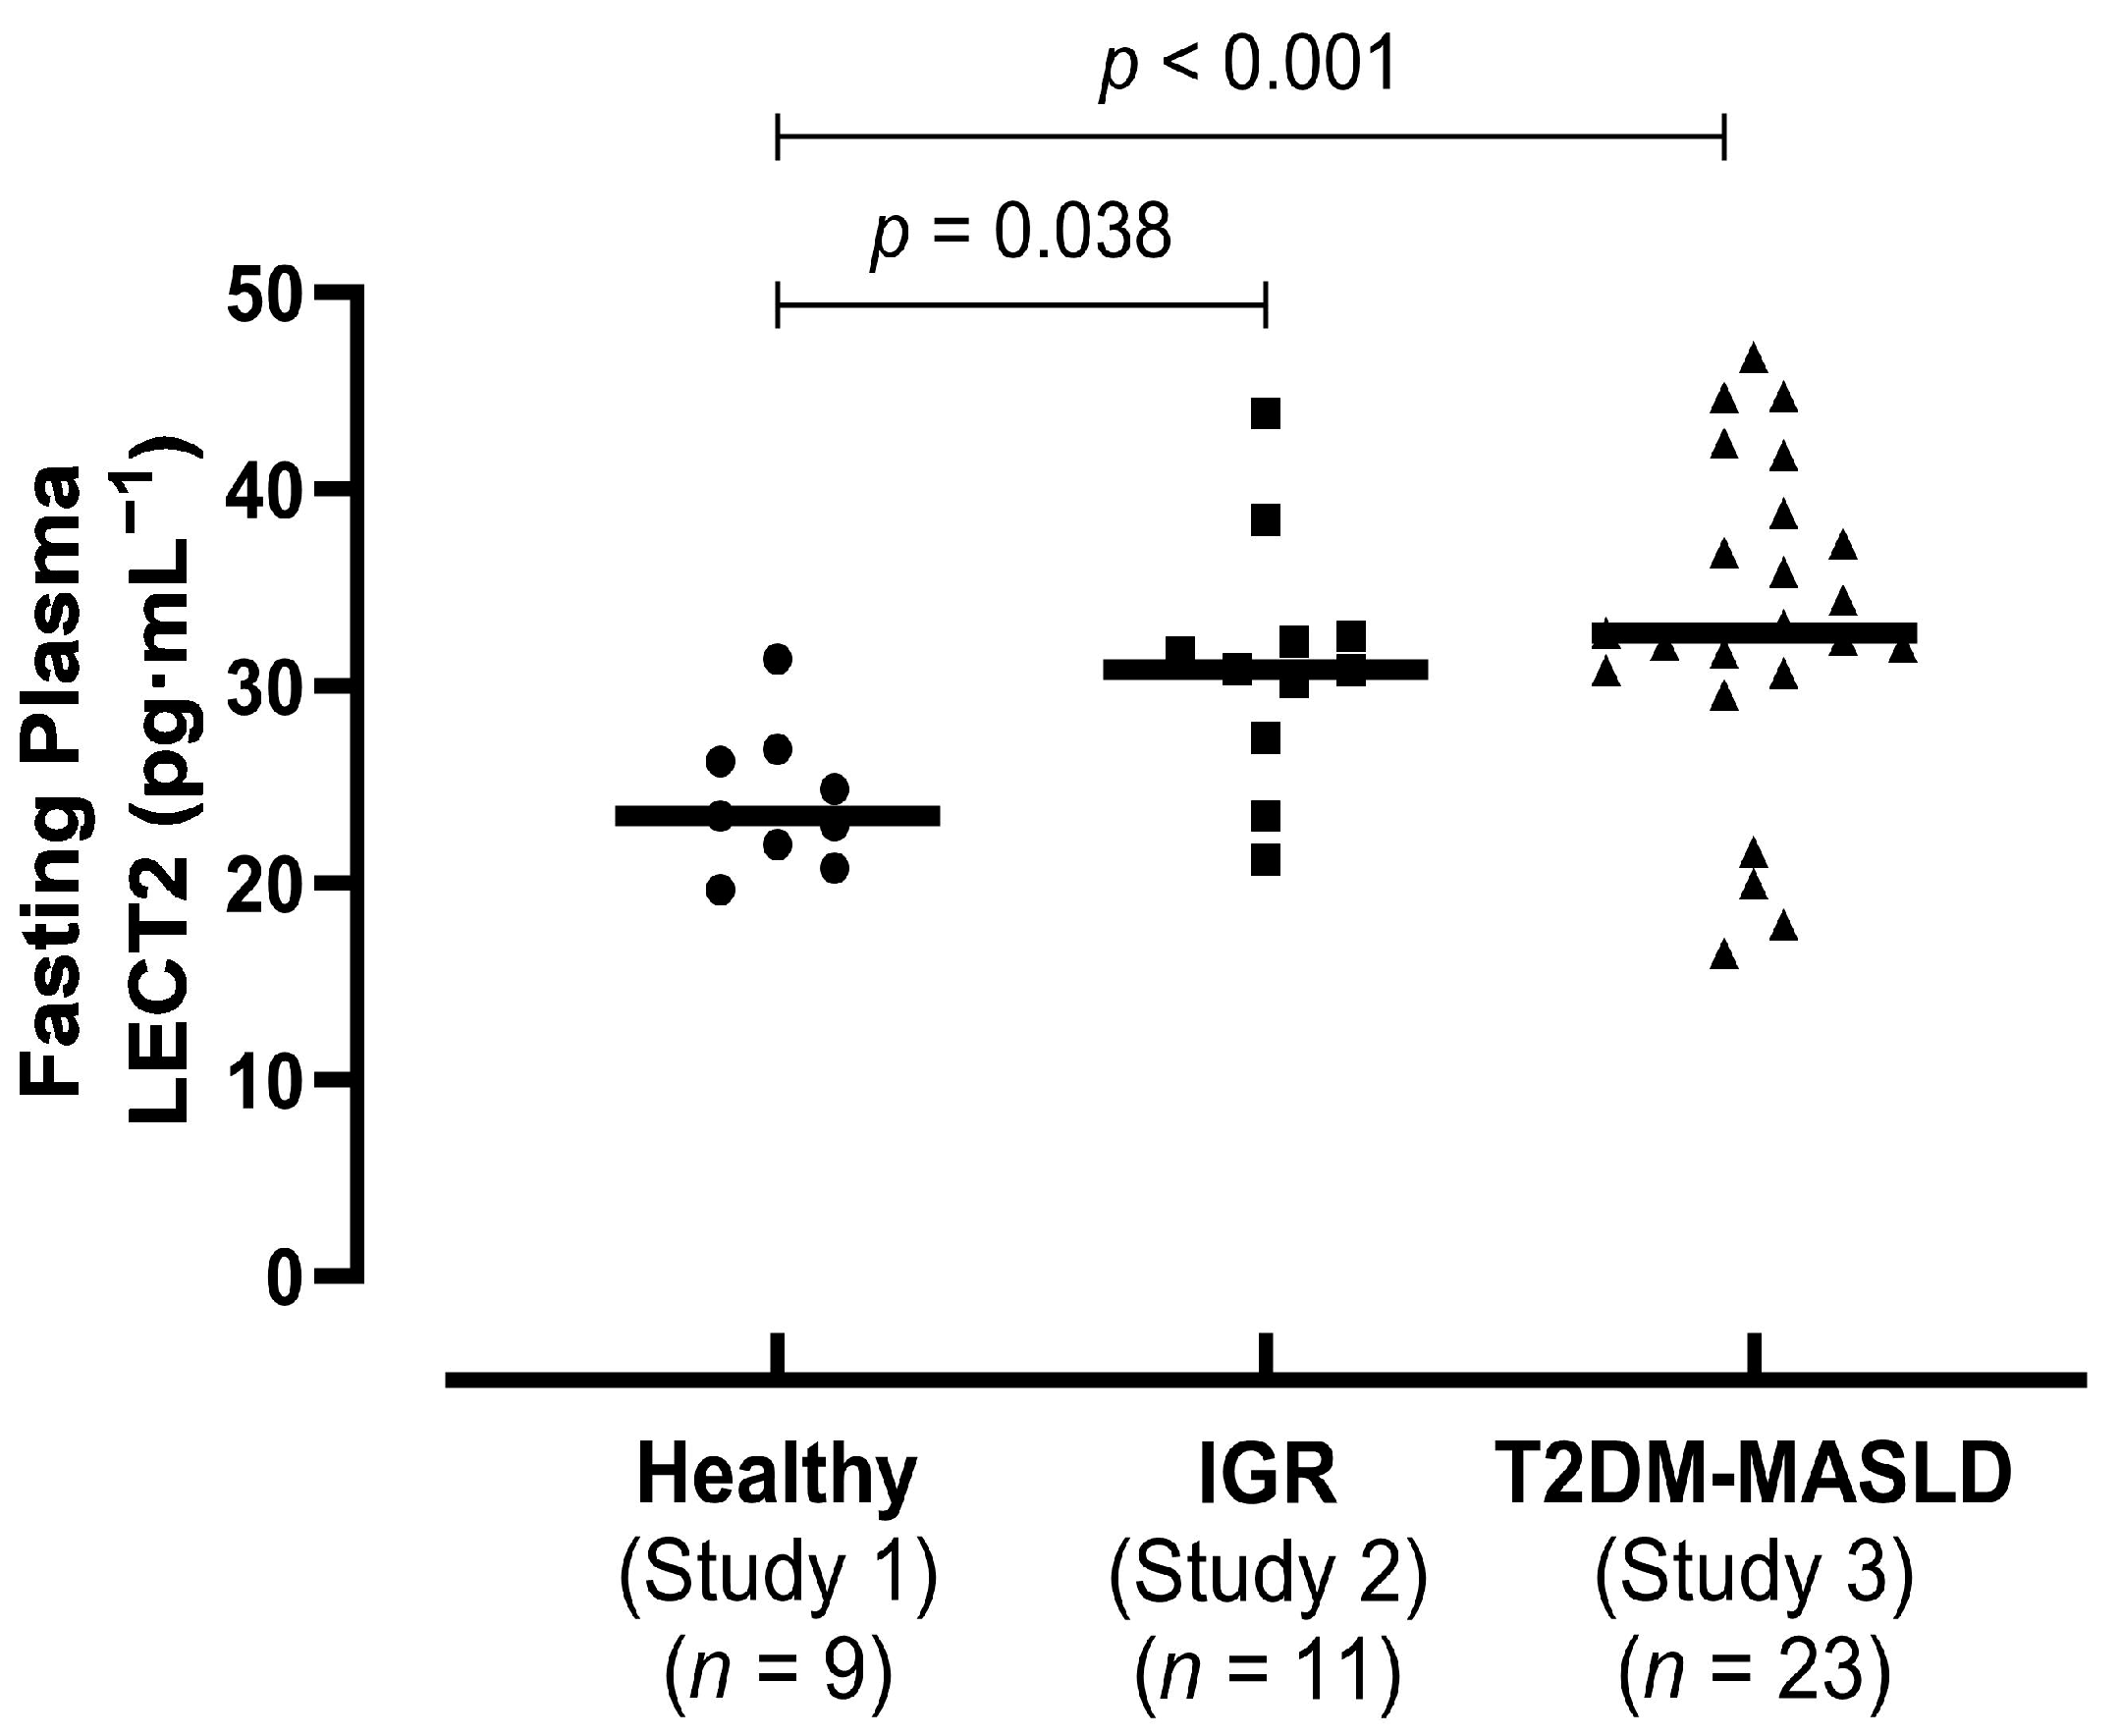
Generalised linear models (GLMs) were used to assess the differences among the different sub-cohorts (Studies 1, 2, and 3; factors) in plasma LECT2 concentrations (primary outcome variable) and other participant characteristics (secondary outcomes). A normal distribution and an identity link function were used for waist circumference and body fat, while a gamma distribution and identity link function were used for all other variables, due to their right-skewed distributions. Where a significant main effect of group (study) was observed, post hoc analyses were performed by conducting pairwise comparisons with a Bonferroni adjustment for multiple comparisons. Univariable linear regression models were performed separately for candidate predictor variables (age, sex, BMI, body fat, and VO2peak) to examine their individual relationships with LECT2. The variables significantly associated with LECT2 were subsequently entered into a multivariable linear regression model to determine the strongest predictors of plasma LECT2 concentrations.
Part B
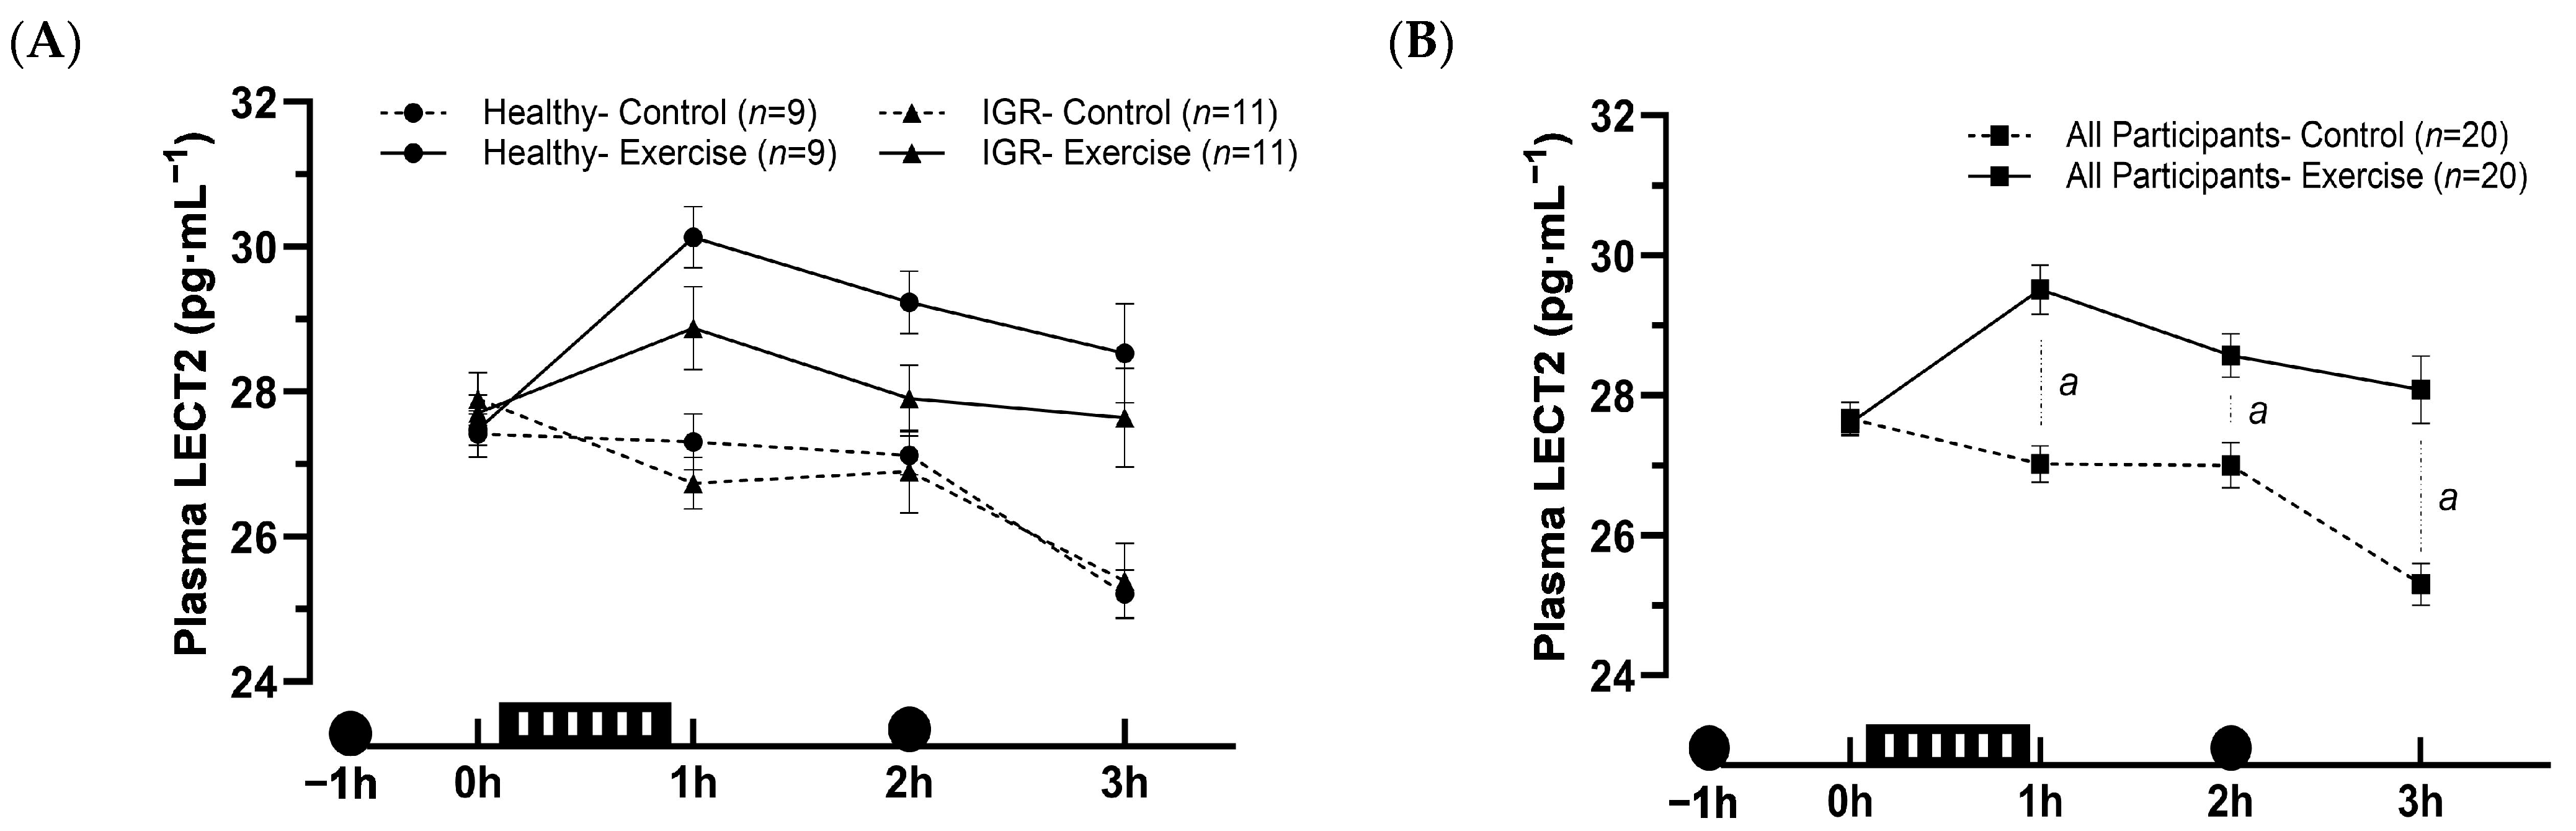
Generalised estimating equation (GEE) models with a gamma distribution, identity link function, and exchangeable correlation matrix were used to assess differences in LECT2 responses to the exercise and control trials among study groups (primary outcomes). The three-way GEE model was performed with two within-participant factors (trial and timepoint) and one between-participant factor (group). Furthermore, the model was adjusted for the pre-exercise (−1–0 h) LECT2 area under the curve (AUC), calculated using the trapezium rule. The main effects of trial, timepoint, and group were inspected, and the three-way interaction among trial, timepoint, and group was assessed to identify differences in LECT2 responses after the exercise and control trials between healthy individuals and those with IGR. When the three-way interaction analysis was not significant, the two-way interaction between trial and time was used to examine the LECT2 response to exercise in the two groups combined. Where the two-way interaction was significant, further post-hoc pairwise comparisons were conducted, with a Bonferroni correction for multiple comparisons to identify the specific timepoints where differences occurred.
4. Discussion
The aim of this study was to compare circulating levels of LECT2 in individuals with varying degrees of glycaemic regulation and to investigate the effects of acute exercise on circulating LECT2 concentrations. We found that circulating LECT2 concentrations are higher in individuals with IGR and individuals with T2DM and MASLD, compared to healthy lean individuals, with BMI being a leading predictor. Additionally, contrary to our hypothesis and previous rodent studies, acute moderate-intensity aerobic exercise increased circulating LECT2 concentrations in humans for up to 3 h post-exercise.
Previous research has shown that individuals with overweight and obesity have higher circulating LECT2 concentrations compared to those with healthy weight [
12]. Similarly, circulating LECT2 is greater in individuals with T2DM versus those without T2DM [
17], as well as in individuals with MASLD compared to those without MASLD [
18]. The cross-sectional analyses in this study are consistent with these data, as circulating levels of LECT2 were greater in the groups with IGR and T2DM-MASLD versus healthy individuals.
Interestingly, in our study, we found no differences in circulating LECT2 concentrations between the groups with IGR and T2DM-MASLD. This was somewhat unexpected, as we hypothesised that circulating LECT2 would be higher in the group with T2DM-MASLD, given the greater metabolic dysfunction present in these individuals. Specifically, the group with T2DM-MASLD had poorer glycaemic regulation, and all individuals possessed liver fat percentage values above the diagnostic threshold for MASLD (≥5.56%, determined with magnetic resonance imaging). We have previously reported that liver fat is independently (positively) associated with circulating LECT2 concentrations in a non-clinical community population [
19]. It would be expected that liver fat would be lower on average within the group with IGR versus the group with T2DM-MASLD; however, we cannot confirm this notion, as liver fat data were not available for the group with IGR in the present study. Importantly, though, BMI and body fat were similar between the groups with IGR and T2DM-MASLD, each of which has previously been linked with circulating LECT2. With our regression analysis also showing that BMI was the leading predictor of LECT2 in our diverse sample, it, therefore, seems that anthropometric indices have a dominant influence on circulating LECT2, rather than metabolic parameters. Alternatively, given the subtle visual difference between the groups with IGR and T2DM-MASLD, it is also possible that inadequate statistical power may explain the lack of significant difference between these study groups.
Previous research identified visceral fat as the strongest predictor of circulating LECT2 in a sample of middle-aged and elderly Japanese men [
20]. Conversely, in our regression analysis, waist circumference was not related to circulating LECT2, whereas BMI, age, and cardiorespiratory fitness were associated with circulating LECT2. It is possible that the lack of association with waist circumference in our sample is due to waist circumference being an indirect marker of central adiposity, whereas it was previously measured directly via magnetic resonance imaging.
Notably, in our study, the strongest relationship with circulating LECT2 concentrations was found to be that of BMI. This relationship is consistent with rodent data, in which circulating LECT2 has been shown to increase with fat mass following an obesogenic diet and also responds dynamically to weight cycling (repeated positive and negative energy balance) [
5]. Moreover, we have previously shown in humans that circulating LECT2 is elevated after 3 days of high-fat overfeeding, with further rises detected by day 7 [
2]. These data imply that an increase in circulating LECT2 may be a metabolic consequence of a chronic energy surplus. Mechanistically, this effect appears to be related to hepatic AMPK activation, which responds to perturbations in energy balance and negatively regulates hepatic LECT2 production [
5,
21].
In the second part of our study, we found that circulating levels of LECT2 were elevated after an acute bout of moderate-intensity aerobic exercise; however, these responses were similar between healthy individuals and those with IGR. Importantly, this response was unrelated to haemoconcentration, suggesting a genuine stimulatory effect of exercise. This response contrasted with our hypothesis, in which we stipulated that circulating levels of LECT2 would be suppressed by exercise, particularly in individuals with IGR. In a previous rodent study, circulating LECT2 was suppressed after an acute bout of exercise [
5]. The contrasting response may be because the bout of exercise in the rodent study was more extreme, as it lasted three hours and was exhaustive in nature. Notably, in the rodent study, this stimulus was sufficient to upregulate hepatic AMPK, which the authors demonstrated to negatively regulate hepatic LECT2 expression in additional experiments. Our exercise bout may not have elicited this response, particularly as the exercise was less extreme and performed in the fed state. However, it cannot be discounted that species differences in LECT2 metabolism may also be implicated.
The failure of acute exercise to suppress circulating LECT2 in humans is consistent with two of our previous non-clinical studies [
12,
13] where circulating LECT2 responses to exercise were examined in healthy individuals and those with overweight/obesity. The purpose of the present study was to extend these findings, particularly by scrutinising exercise responses in a population who were likely to have elevated circulating LECT2 concentrations. In our first study, circulating LECT2 concentrations were elevated in people with overweight/obesity, but were not modified by acute moderate-intensity exercise. In our second study, circulating LECT2 was elevated immediately on cessation of moderate- and high-intensity exercise bouts, but values were no different versus the control 1 h post-exercise. Furthermore, transient elevation was not apparent after adjusting LECT2 concentrations for plasma volume changes, implying that the elevation was due to haemoconcentration. It is not clear why LECT2 was elevated in the present study, but not previously, but discrepancies could be related to fed versus fasted responses, different ELISA assays, and/or the additional inclusion of female participants in the present study. Moreover, the mechanism underpinning this response is not known, and further mechanistic studies are needed to understand this response. Alternatively, the increase in circulating LECT2 may be triggered by an exercise-activating transcription factor-4 (ATF4)-mediated enhancement of hepatic LECT2 gene expression [
22,
23].
Notable strengths of this study include the assimilation of data from diverse participant groups, as well as the strict adherence to standardisation procedures prior to and during the exercise intervention. Key limitations include the omission of potentially relevant data from Part A within this study, such as liver fat and directly measured visceral fat. The limited sample size is also a consideration for both parts of this study. In particular, with no formal power calculation performed a priori, it is possible that a larger sample size would be needed to detect potentially small differences between the group with IGR versus that with T2DM-MASLD.
In conclusion, this study demonstrated that circulating LECT2 concentrations are elevated in individuals with IGR and T2DM compared to healthy individuals, with BMI being an important predictor. This finding supports previous research and confirms that circulating LECT2 levels differ among individuals with varying degrees of glycaemic regulation/metabolic dysfunction versus healthy individuals. Furthermore, contrary to previous rodent and human studies, we found that acute exercise induces an increase in circulating LECT2 concentrations, rather than a suppression. This study not only expands our understanding of the acute regulation of LECT2, but also highlights the need for further investigation into the impact of different acute and chronic exercise interventions on LECT2 physiology in humans, with additional scrutiny of responsible mechanisms.

 ,
, 


