1. Introduction
Superalloys are a category of alloys that were developed following World War II, primarily for their use in turbo-superchargers and aircraft gas turbine engines, which demanded an exceptional performance at elevated temperatures [
1,
2,
3,
4]. Over time, the application of these alloys has extended to various other critical sectors, including land-based gas turbines and rocket engines, as well as in chemical, petroleum, and nuclear-power plants, where they have become indispensable.
Alloy X-750 is a precipitation-hardened Ni-Cr-Fe superalloy with an iron content specified as lying within the range of 5–9 wt%. It is known for its very good corrosion resistance and high strength at high temperatures, making it an ideal choice for use in nuclear power plants. Thus, for more than three decades, it has been extensively used for various applications, including springs, bolts, welds, and spacer grids used to hold the fuel material in boiling water reactors (BWRs). However, the harsh BWR environment, characterized by high-temperature water, radiolysis products, and corrosive electropotential, exposes Alloy X-750 to uniform corrosion and mass loss. Thus, corrosion resistance is one of the primary properties that is required to be screened for these materials. However, tests of X-750 in water or steam simulating reactor conditions are scant, and most of these investigations are directed towards material degradation through stress corrosion cracking [
5,
6,
7,
8,
9,
10], while there are only a few reports focusing on its uniform corrosion [
11,
12,
13].
To mitigate corrosion, the X-750 alloy typically undergoes a pre-treatment, consisting of a heat treatment at 700 °C for 20 h. This pre-treatment results, besides the development of strengthening γ′-Ni
3(Ti,Al) precipitates, in the formation of a thin layer of a protective oxide scale. Studies of this oxide have revealed that it comprises a NiFe
2O
4 spinel (trevorite) layer growing on top of a Cr
2O
3 layer [
11]. However, it is possible that this protective oxide layer is consumed or damaged during the operation in the reactor core and that a bare metal would be exposed. It is thus essential to also understand the corrosion behavior of the alloy in the non-pre-oxidized condition.
Previous investigations of non-pre-oxidized alloy X-750 exposed to a simulated BWR environment showed that the oxide scale consisted of more than one layer. Chen et al. demonstrated that the scale formed on the alloy with 7.5 wt% Fe exposed to a simulated BWR environment for 840 h consisted of trevorite crystals formed on top of a duplex inner oxide of NiCrO
3 and NiO [
12]. Our previous work on the evolution of the oxide scale on non-pre-oxidized alloy X-750 with 8 wt% Fe (8Fe) exposed to simulated BWR conditions for periods ranging from 2 to 840 h revealed that the oxide scale starts as a bi-layered structure of blocky NiFe
2O
4 crystals on a Ni- and Cr-rich oxide layer. After longer exposure times, it develops into a penta-layered configuration (NiFe
2O
4, Ti-rich mixed spinel, NiO, Cr-enriched oxidized metal, and oxidized metal). Moreover, porosity was observed within the scale after short exposures, but eventually, the voids were filled [
13].
It is known that the iron content in Ni-Cr-Fe alloys alters the material corrosion performance in a pressurized water reactor (PWR) water environment [
14]. Thus, given the fairly wide range of iron content in the specification of X-750, it is important to scrutinize the influence of this element on the oxidation performance in a simulated BWR environment. Here, we are presenting the results of an investigation in which we studied non-pre-oxidized alloy X-750 with a low iron content, 5 wt% Fe (5Fe), primarily using electron microscopy. Our approach is similar to that used in reference [
13]. A comparison between the 5Fe and 8Fe materials is made in the discussion part.
2. Materials and Methods
The chemical composition of the investigated alloy is shown in
Table 1. The samples were taken from the spacer grid production. The material had been solution-annealed for ~2 min in an inert atmosphere at 1075 °C, which resulted in a largely single-phase structure. However, small amounts of nitrogen were dissolved in the melt during manufacturing, which resulted in the formation of some titanium carbonitrides during processing. The samples had received a polishing and a pickling treatment, a procedure that removes surface inhomogeneities, such as composition gradients, residual oxides, etc. The industrial pickling process (proprietary) removes on average 1–2 µm of metal. The process parameters have been selected to prevent excessive preferential etching and, in particular, to avoid grain boundary attacks. Sample coupons measuring 20 × 20 × 0.3 mm
3 were cut from the strip, cleaned firstly in acetone and then in ethanol in an ultrasonic bath, and then dried for 30 min in an oven at 110 °C. They were then placed in a titanium-plated autoclave for exposure to high-temperature water. To prevent contamination, the autoclave pipelines and the hot parts of the loop were made of a titanium alloy. To replicate the conditions in a BWR, degassed ultra-pure water was pumped into the autoclave pipeline and then heated to 286 °C under a pressure of 80 bar. To simulate water radiolysis, a continuous addition of 500 ppb of H
2O
2 was made to the loop, and a water jet was set to impinge the specimens at 10 m/s. The autoclave setup was identical to that used in our previous work [
13] (see
Figure 1). Four different exposure times were chosen: 2, 24, 168 and 840 h. These specimens are henceforth referred to as 5Fe-2h, 5Fe-24h, 5Fe-168h and 5Fe-840h, respectively.
Prior to and following each exposure, an analytical balance with 0.1 mg precision was used to weigh the specimens. The accuracy of the weight gain measurement is estimated to be 10%, based on experience from other studies where multiple samples were used.
The specimen surface was analyzed with X-ray diffraction (XRD) at ambient temperature using a Siemens D5000 (Munich, Germany) diffractometer in a grazing incidence set-up (θ = 7.5°) in detector scan mode with a Göbel mirror and an energy dispersive detector. XRD analysis was performed over the 2θ range of 15–80°, with a step size of 0.009° and 2 s collection time per step using Cu-Kα (wavelength = 1.54 Å) radiation. After background subtraction and a Fourier smoothing, phases were identified using the DIFFRACplusEVA evaluation software package with SEARCH, using ICDD database 2014 for phase identification. Moreover, high-resolution XRD measurements were also carried out in a Bruker AXS D8 ADVANCE VARIO (Billerica, MA, USA) powder diffractometer using monochromatic Cu-Kα1 (1.5406 Å) to check for the possible presence of any other phases.
Top-view images of the specimens were taken with a scanning electron microscope (SEM) LEO Ultra 55 FEG-SEM (Carl Zeiss AG, Jena, Germany). A focused ion beam (FIB) combined with an SEM of type FEI Versa 3D FIB/SEM (Thermo Fisher Scientific Inc., Waltham, MA, USA) was utilized to create cross-sections and lift-out lamellas and to obtain the 3D structure of oxide in a slice-and-view experiment. An FEI Titan 80-300 TEM/STEM (Thermo Fisher Scientific Inc., Waltham, MA, USA) was employed to produce high-resolution images using high-angle annular dark field scanning transmission electron microscopy (HAADF-STEM). The energy dispersive X-ray (EDX) technique was used to obtain elemental maps (Oxford Instruments, Abingdon, UK).
3. Results
The mass changes of the 5Fe samples are presented in
Table 2. For all the exposure times, the mass change is negative, meaning that material is lost into the water.
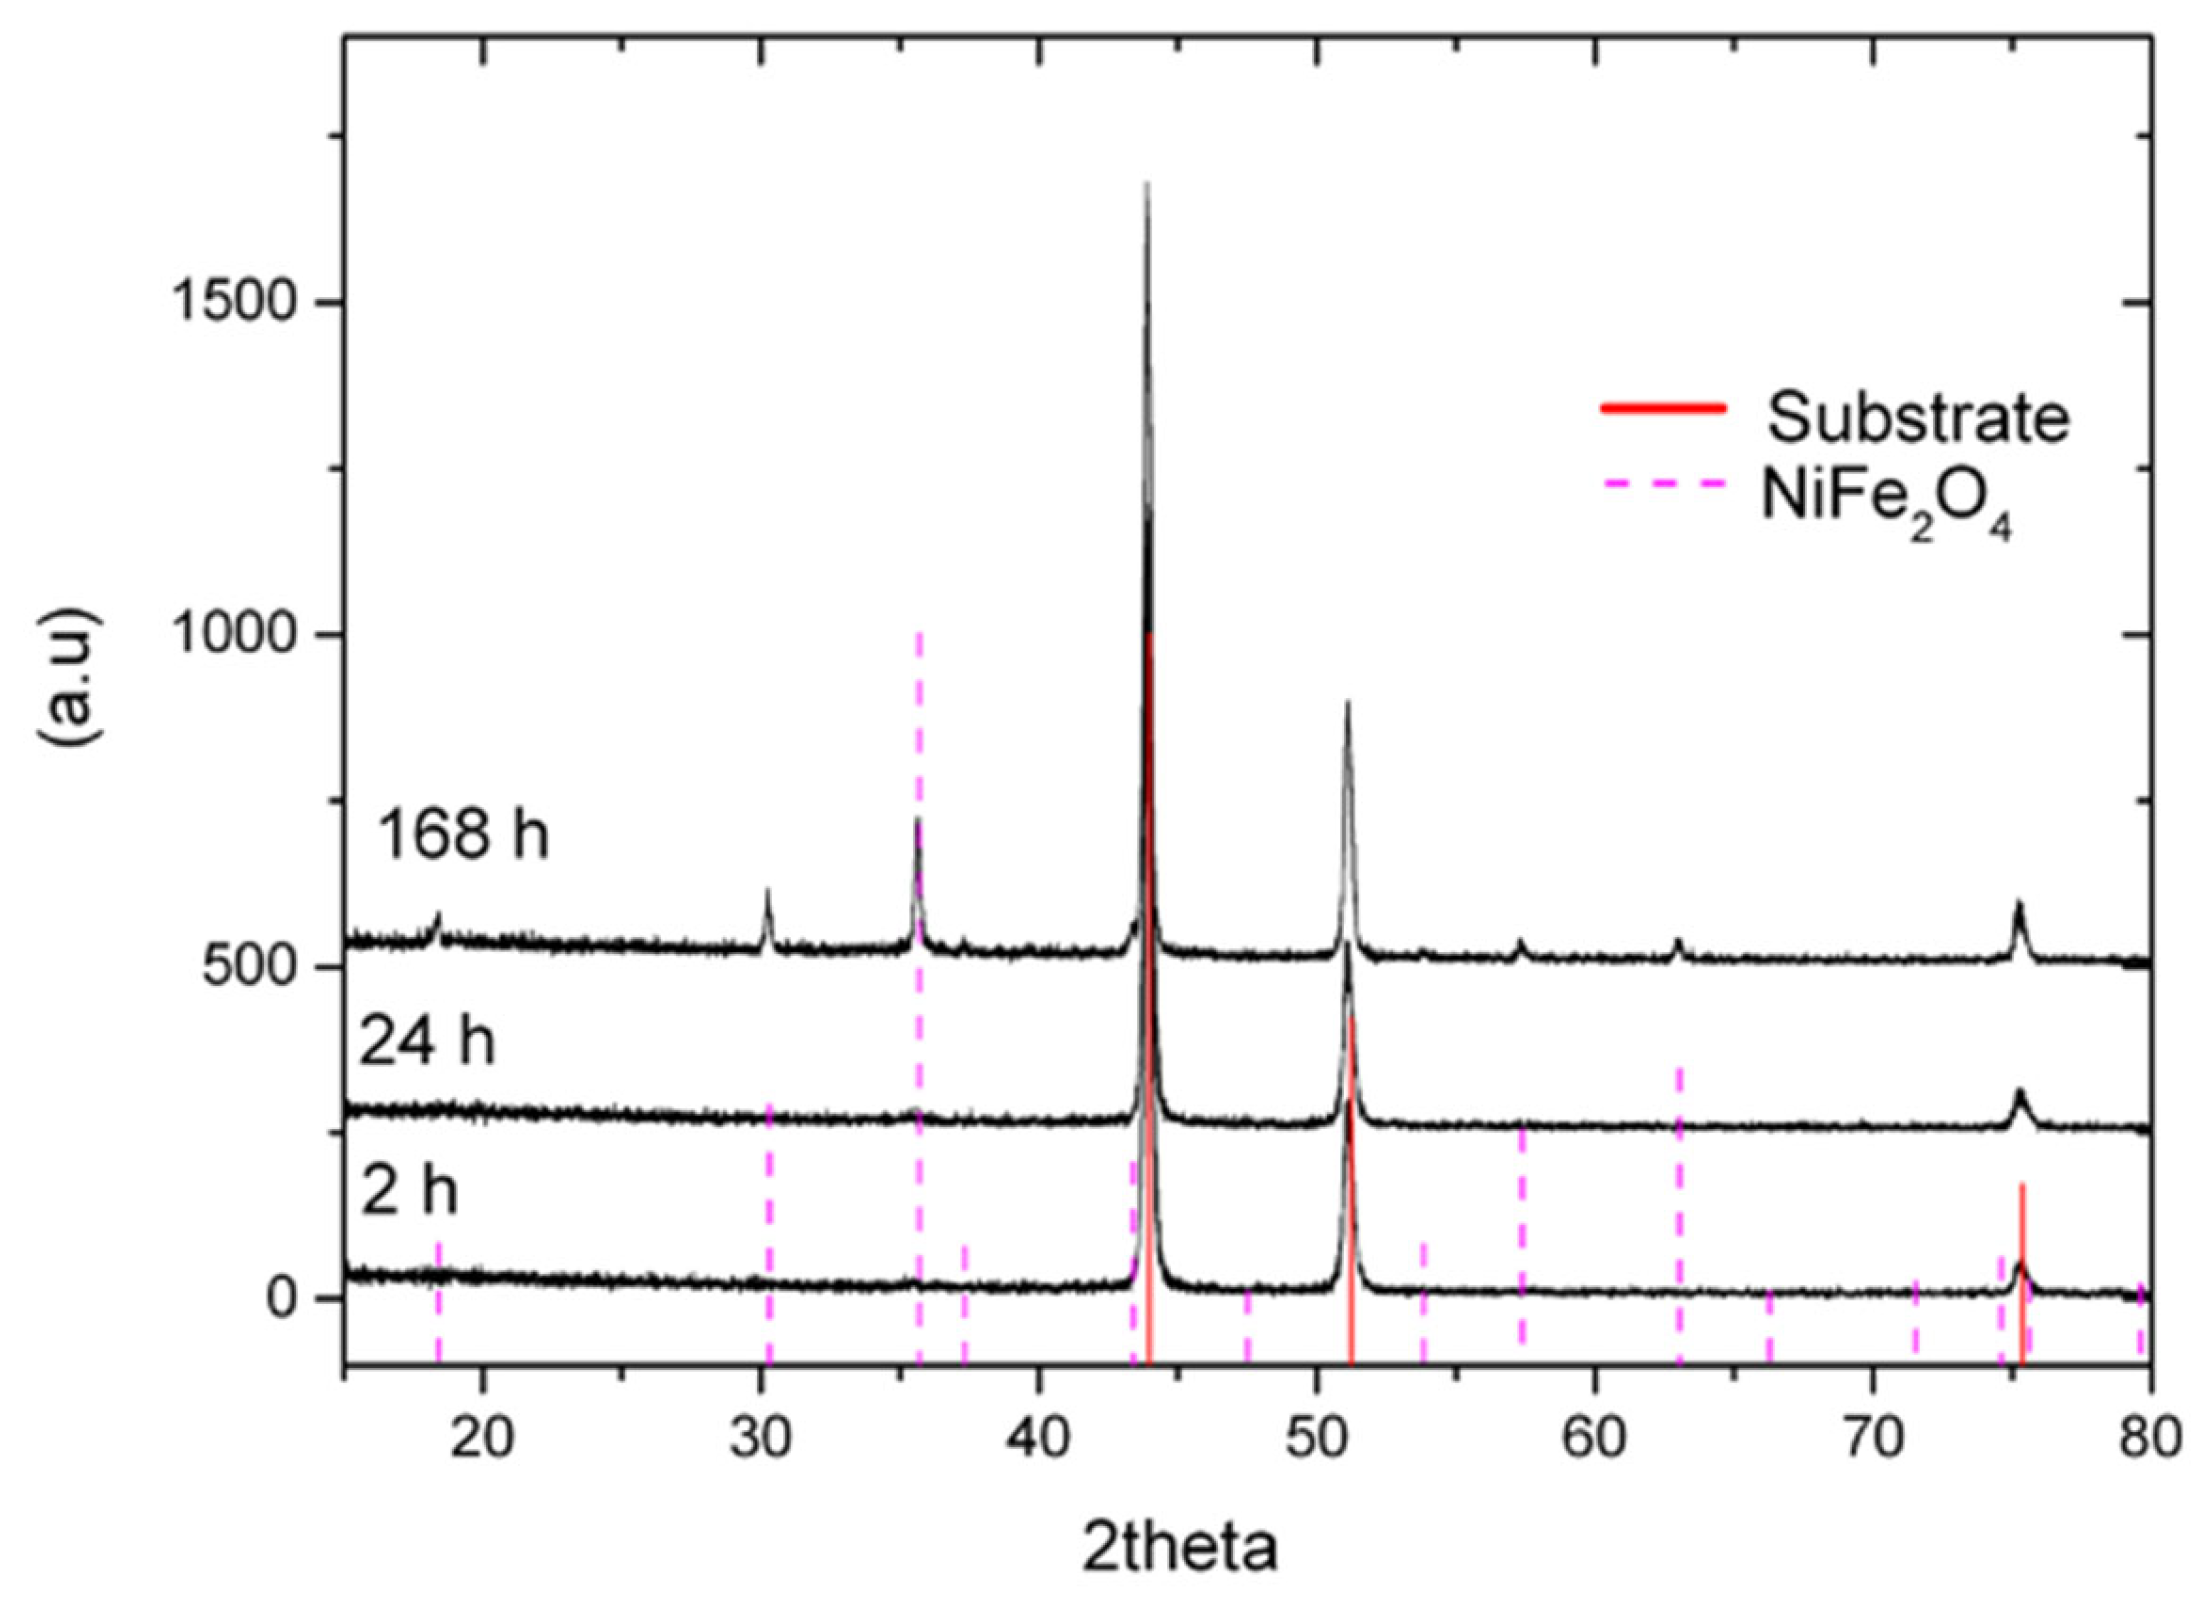
In
Figure 2, the results from XRD (using grazing incident measurements) of the specimens exposed for 2, 24 and 168 h are depicted with characteristic peaks for NiFe
2O
4 spinel (trevorite) evident only after the 168 h exposure. The same phases were identified by powder diffractometry.
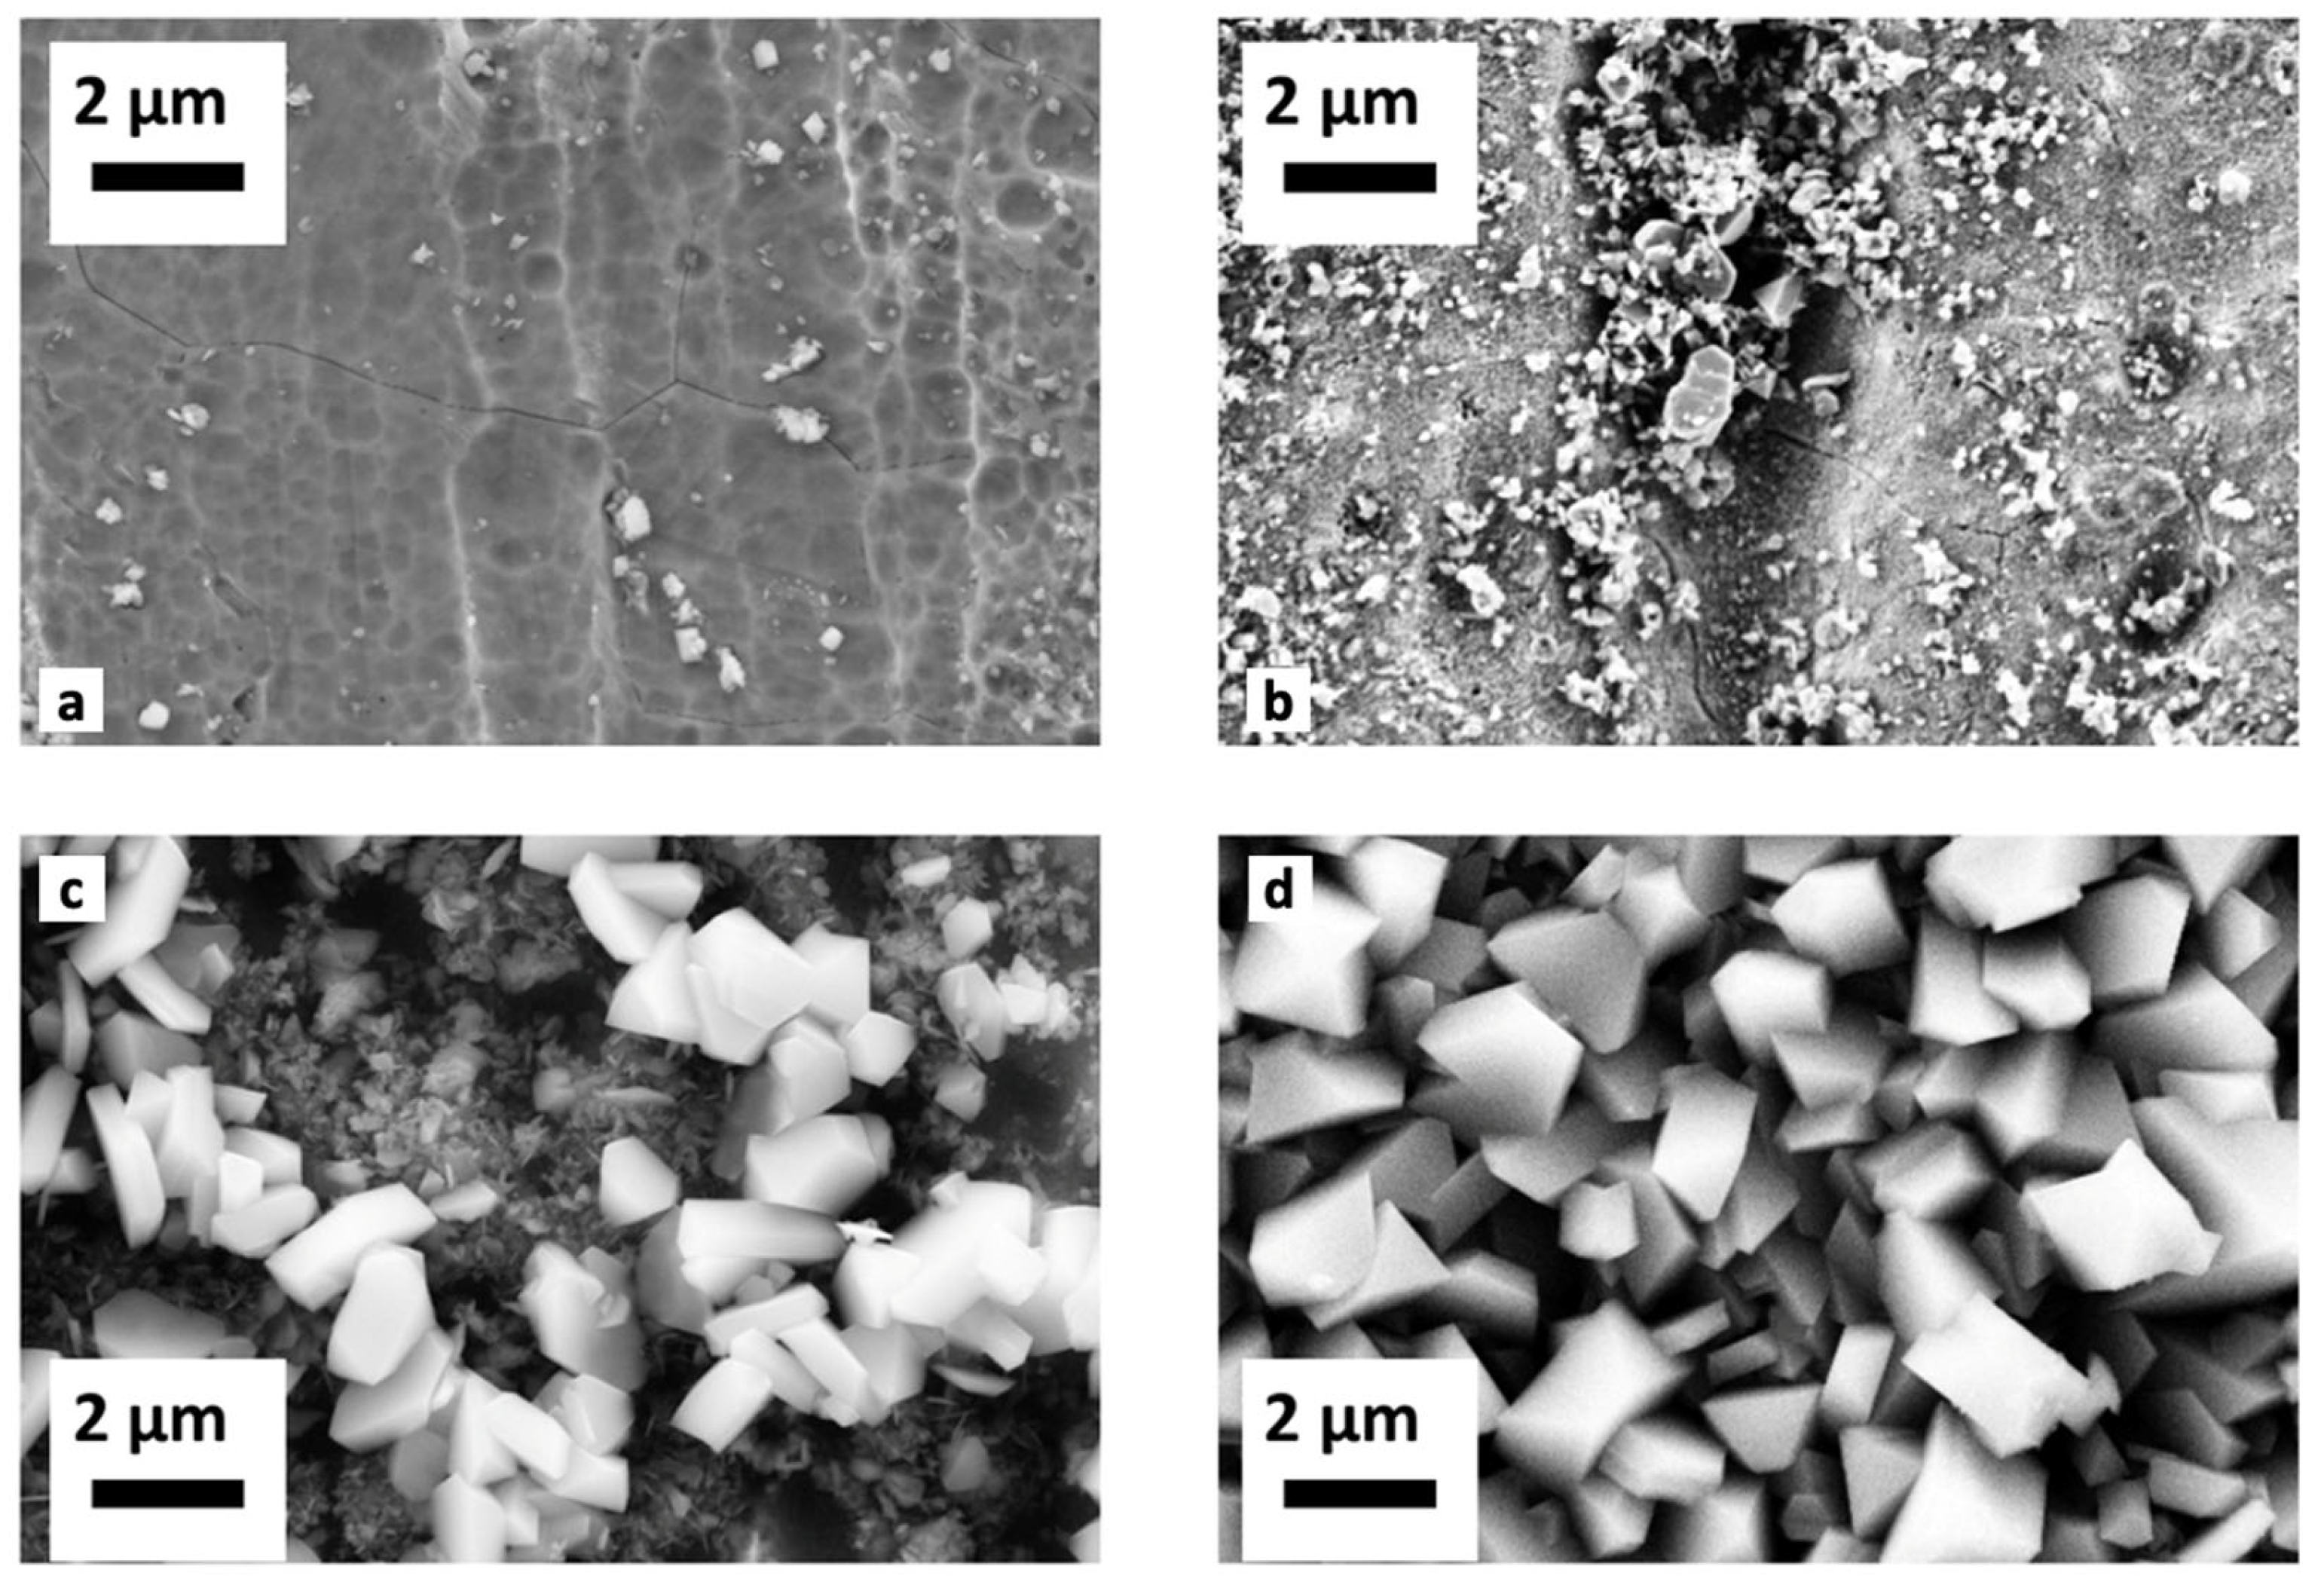
Top-view SEM images acquired with secondary electrons are presented in
Figure 3. The 5Fe-2h sample is covered with nano-sized particles (5–40 nm) with a coverage of about 3%, while on 5Fe-24h, oxide particles cover about 20% of the surface area. The crystal size varies, with sizes reaching up to 500 nm. On 5Fe-168h, two types of crystals are discernible, with large facetted crystals (0.5–1.5 μm) present on top of smaller ones. The coverage of the larger crystals is evaluated to be about 50%. Based on XRD analysis, it is assumed that the crystals are trevorite. The oxide layer beneath the spinels consists of crystals of different shapes: needle- and plate-like. Sample 5Fe-840h shows crystals fully covering the surface, and the crystal size reaches up to 2 μm.
From the FIB cross-sections displayed in
Figure 4, it is observed that on 5Fe-168h, the oxide–metal interface is porous, resulting in the oxide being attached to the metal only in a small fraction of the area. This made the preparation of FIB lift-out cross-sections for TEM very laborious. The oxide is 1.7 ± 0.2 μm thick, and from the cross-section, three layers can be distinguished: an outer layer made of trevorite, a middle layer made of plate-like oxide, and a continuous inner layer. After 840 h, the oxide is less porous and noticeably thicker, 2.7 ± 0.2 μm. From the image, the scale appears to consist of three layers: a thick and continuous trevorite layer, a middle layer consisting of smaller grains and an inner layer of fine-grained oxide.
To gain a better understanding, HAADF-STEM images were acquired, and images of the different specimens are presented in
Figure 5. The specimen 5Fe-2h has a few nano-particles embedded in the Pt layer (deposited as protection with FIB), while the trevorite is clearly present on the specimen 5Fe-24h.
Figure 5c shows the porous nature of the oxide on 5Fe-168h. Spinel crystals and needle-like crystals covering a fine-grained oxide layer approximately 200 nm thick can be distinguished. The investigation of 5Fe-840h shows, as expected from the FIB cross-section, that below the large spinel crystals, a layer of smaller crystals is present. Pores are still there, and an inner fine-grained oxide layer of approximately 500 nm (i.e., thicker than for the specimen 5Fe-168h) is visible.
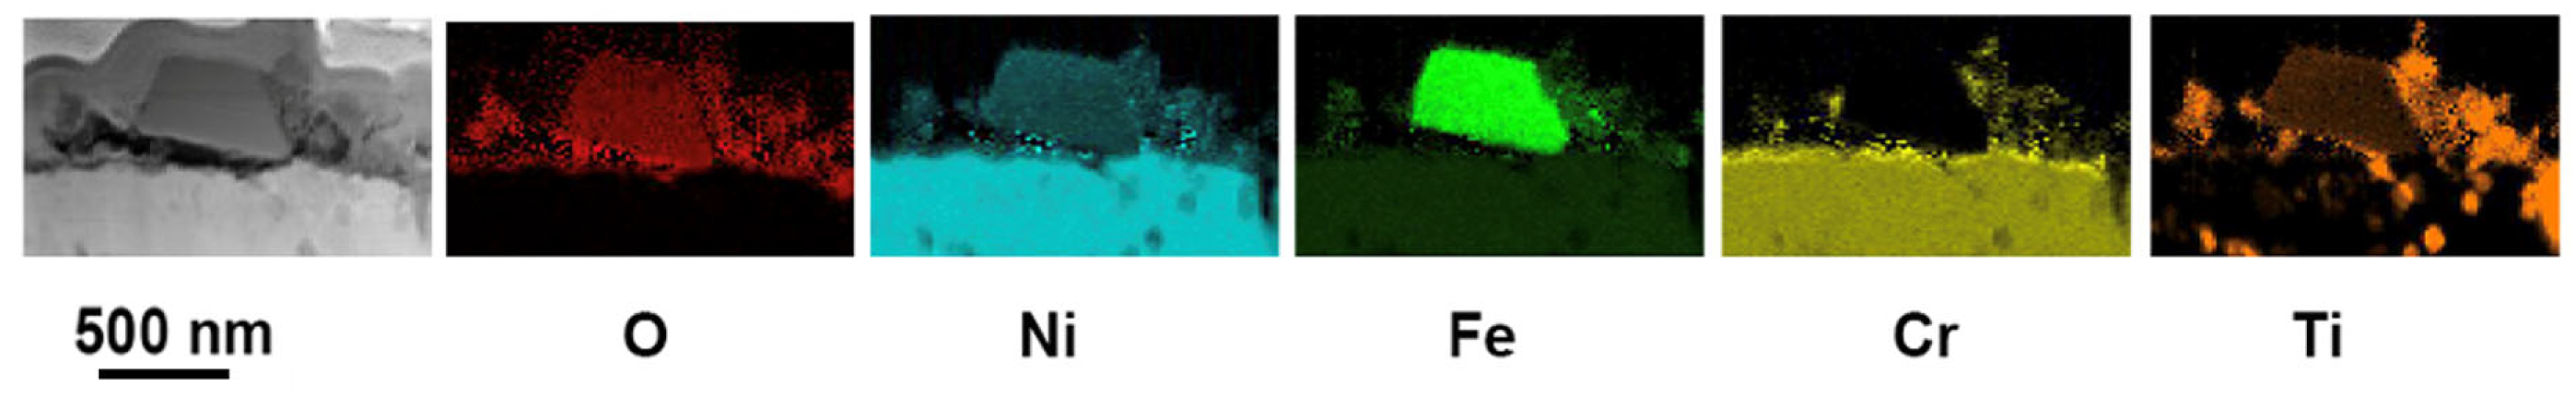
To obtain chemical information from the oxide scale for the different exposure times, STEM-EDX maps were acquired.
Figure 6 shows EDX maps of 5Fe-24h. After this exposure, the NiFe
2O
4 crystals are not stoichiometric, since the ratio between Ni and Fe is close to 1 (from quantitative spot analyses). Beneath the spinel crystals, a thin oxide layer rich in Cr and Ni can be observed. After 168 h, the oxide scale consists of three layers, as shown in
Figure 7. According to the EDX maps, there are plate-like crystals rich in Ni, Fe and Ti between the spinel layer and the fine-grained oxide. When the specimen has been exposed for 840 h, the EDX maps in
Figure 8 reveal a three-layer structure: trevorite in the upper part, NiO in the middle part and a fine-grained Ni- and Cr-rich oxide inner layer. The NiO inner layer is very porous; however, it is more adherent than in 5Fe-168h.
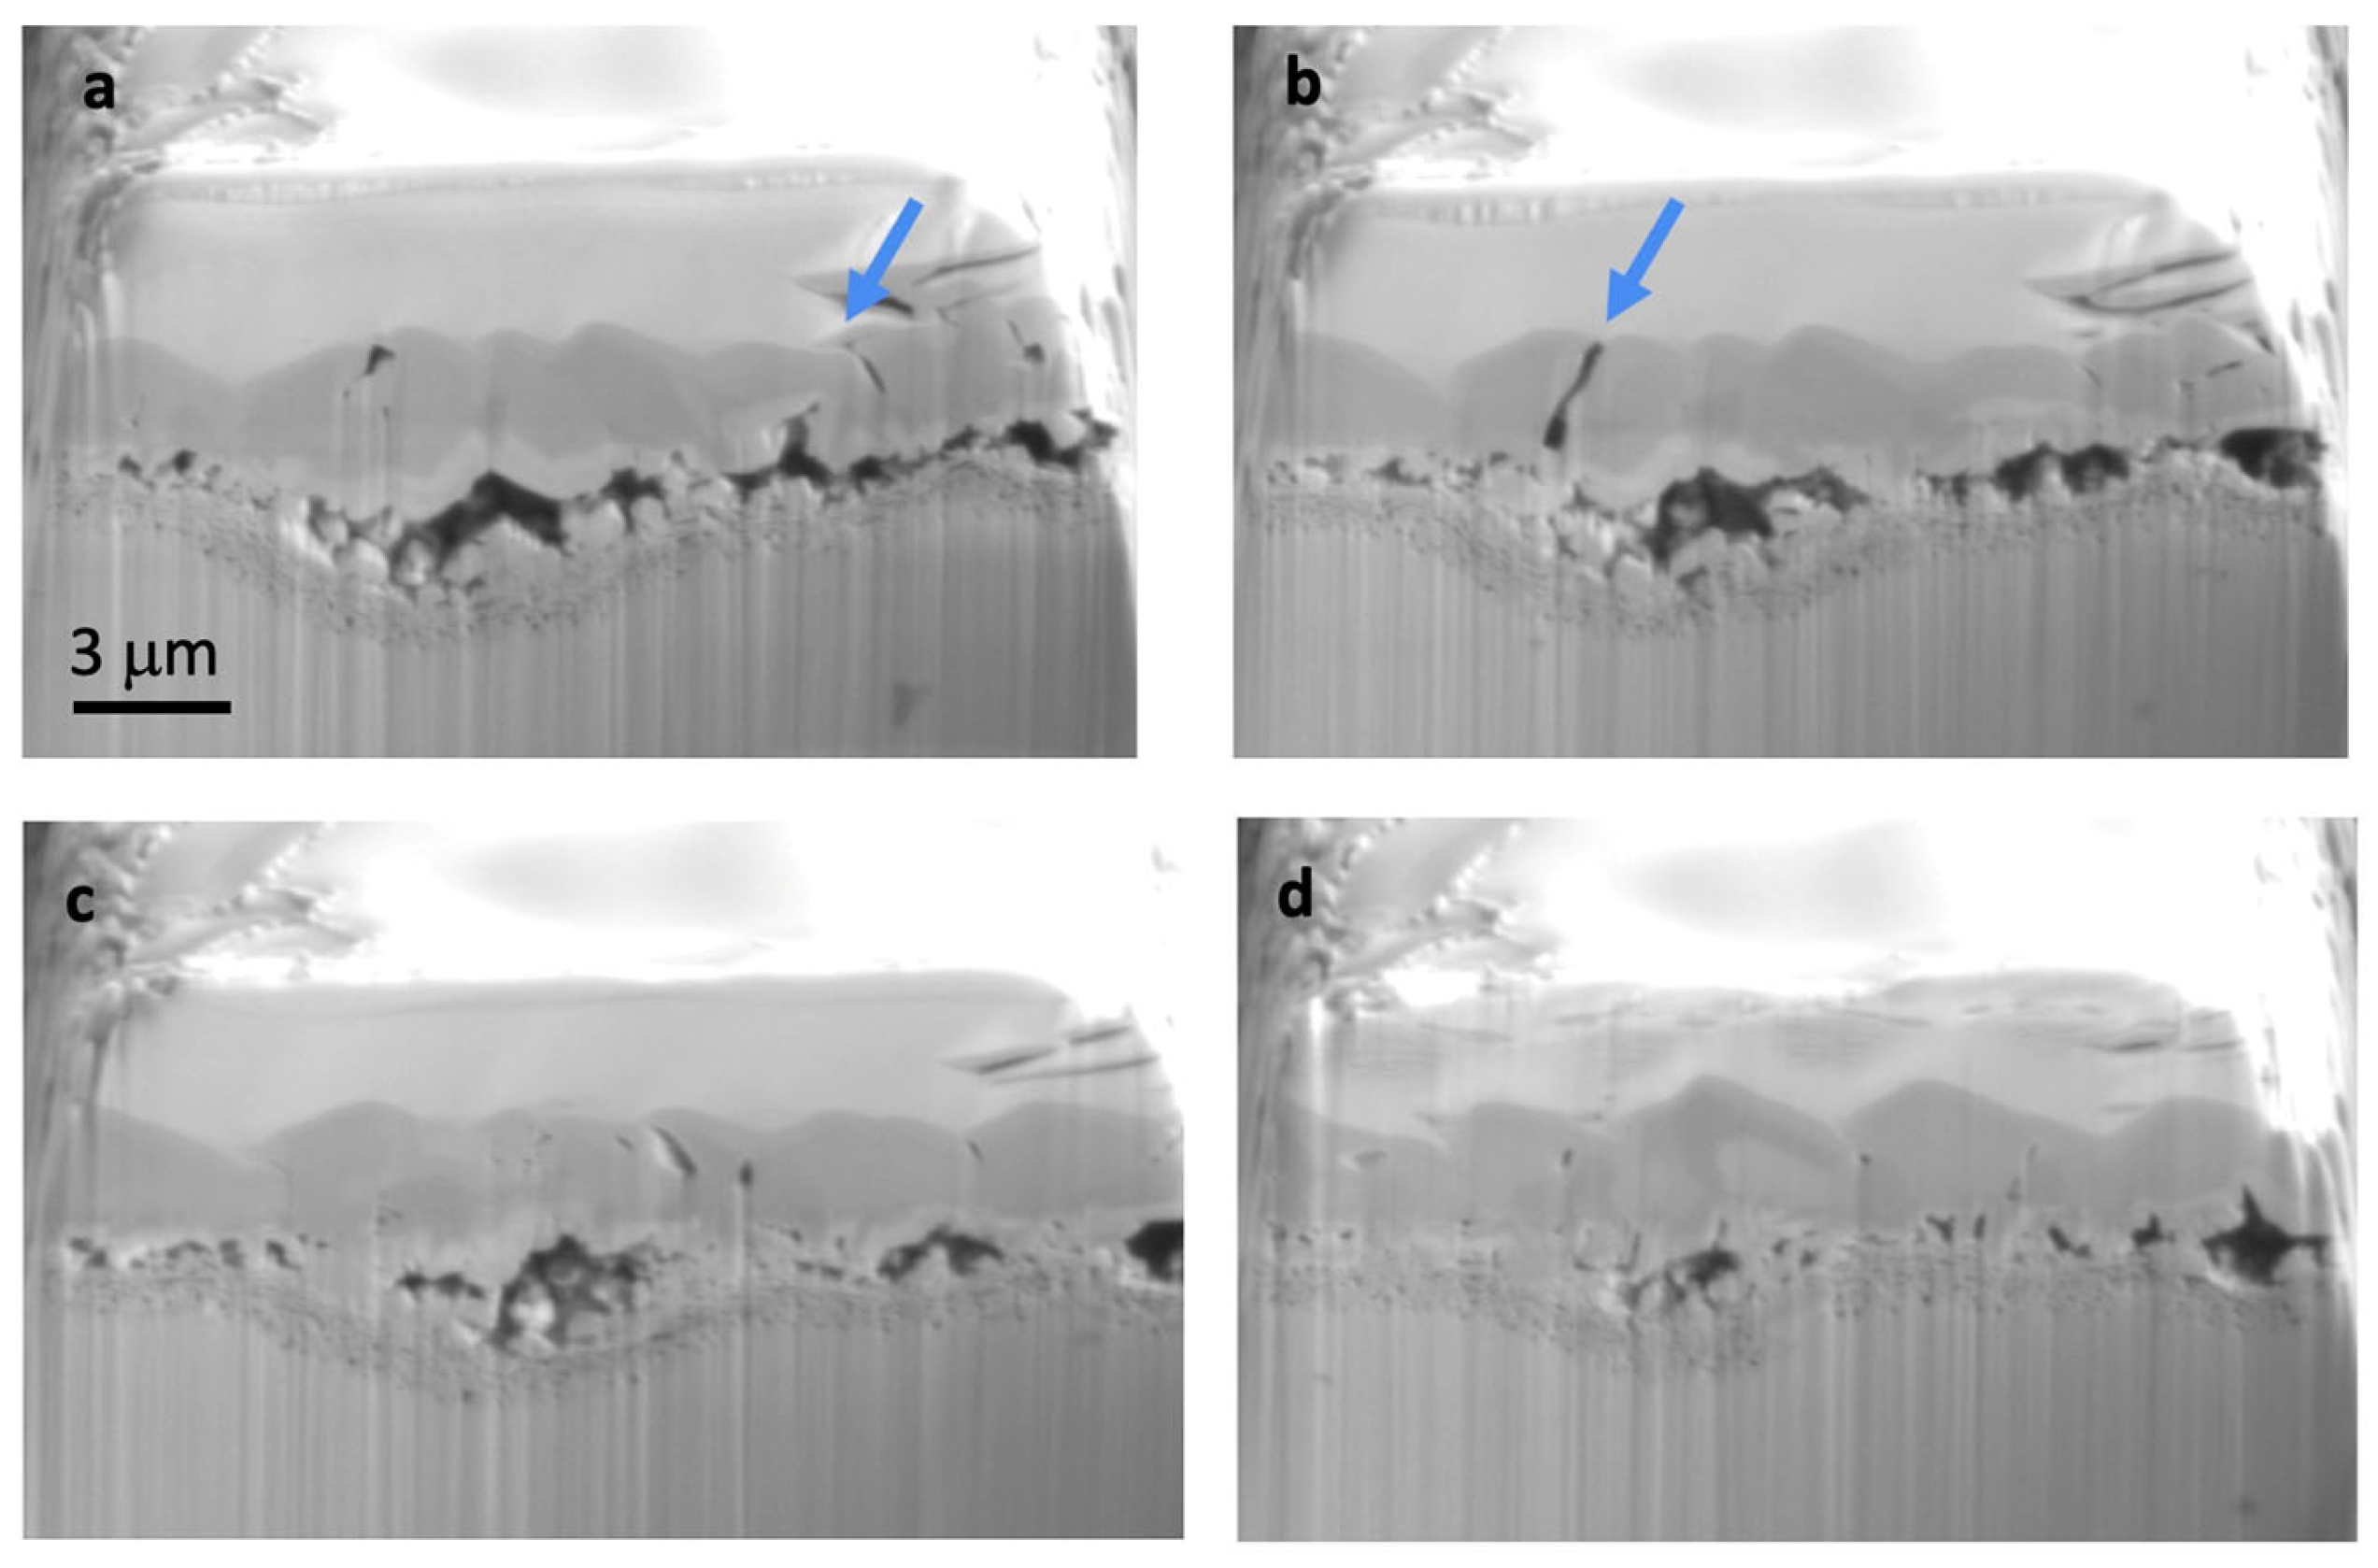
To examine the 3D structure of the voids present in the oxide scale, a slice-and-view experiment was conducted on the specimen 5Fe-840h. The aim was to determine whether the thick layer of trevorite is protective or if it contains void channels that allow water to easily access the metal.
Figure 9 shows a sequence of cross-sections of the examined volume. Some void channels are visible in the trevorite layer, indicating that water can penetrate through to the metal. However, some areas of the trevorite layer have a limited porosity. The middle layer’s porosity is very interesting, since the layer has large empty areas attached to the surface with only very small crystals. In other areas that are more adherent to the metal, many small pores are observed. These findings agree with the results of the TEM investigation and demonstrate the local porosity of the oxide scale.
4. Discussion
The purpose of this paper is to compare the X-750 specimens containing 5.4 wt% Fe with specimens containing 8.3 wt% Fe from our previous work [
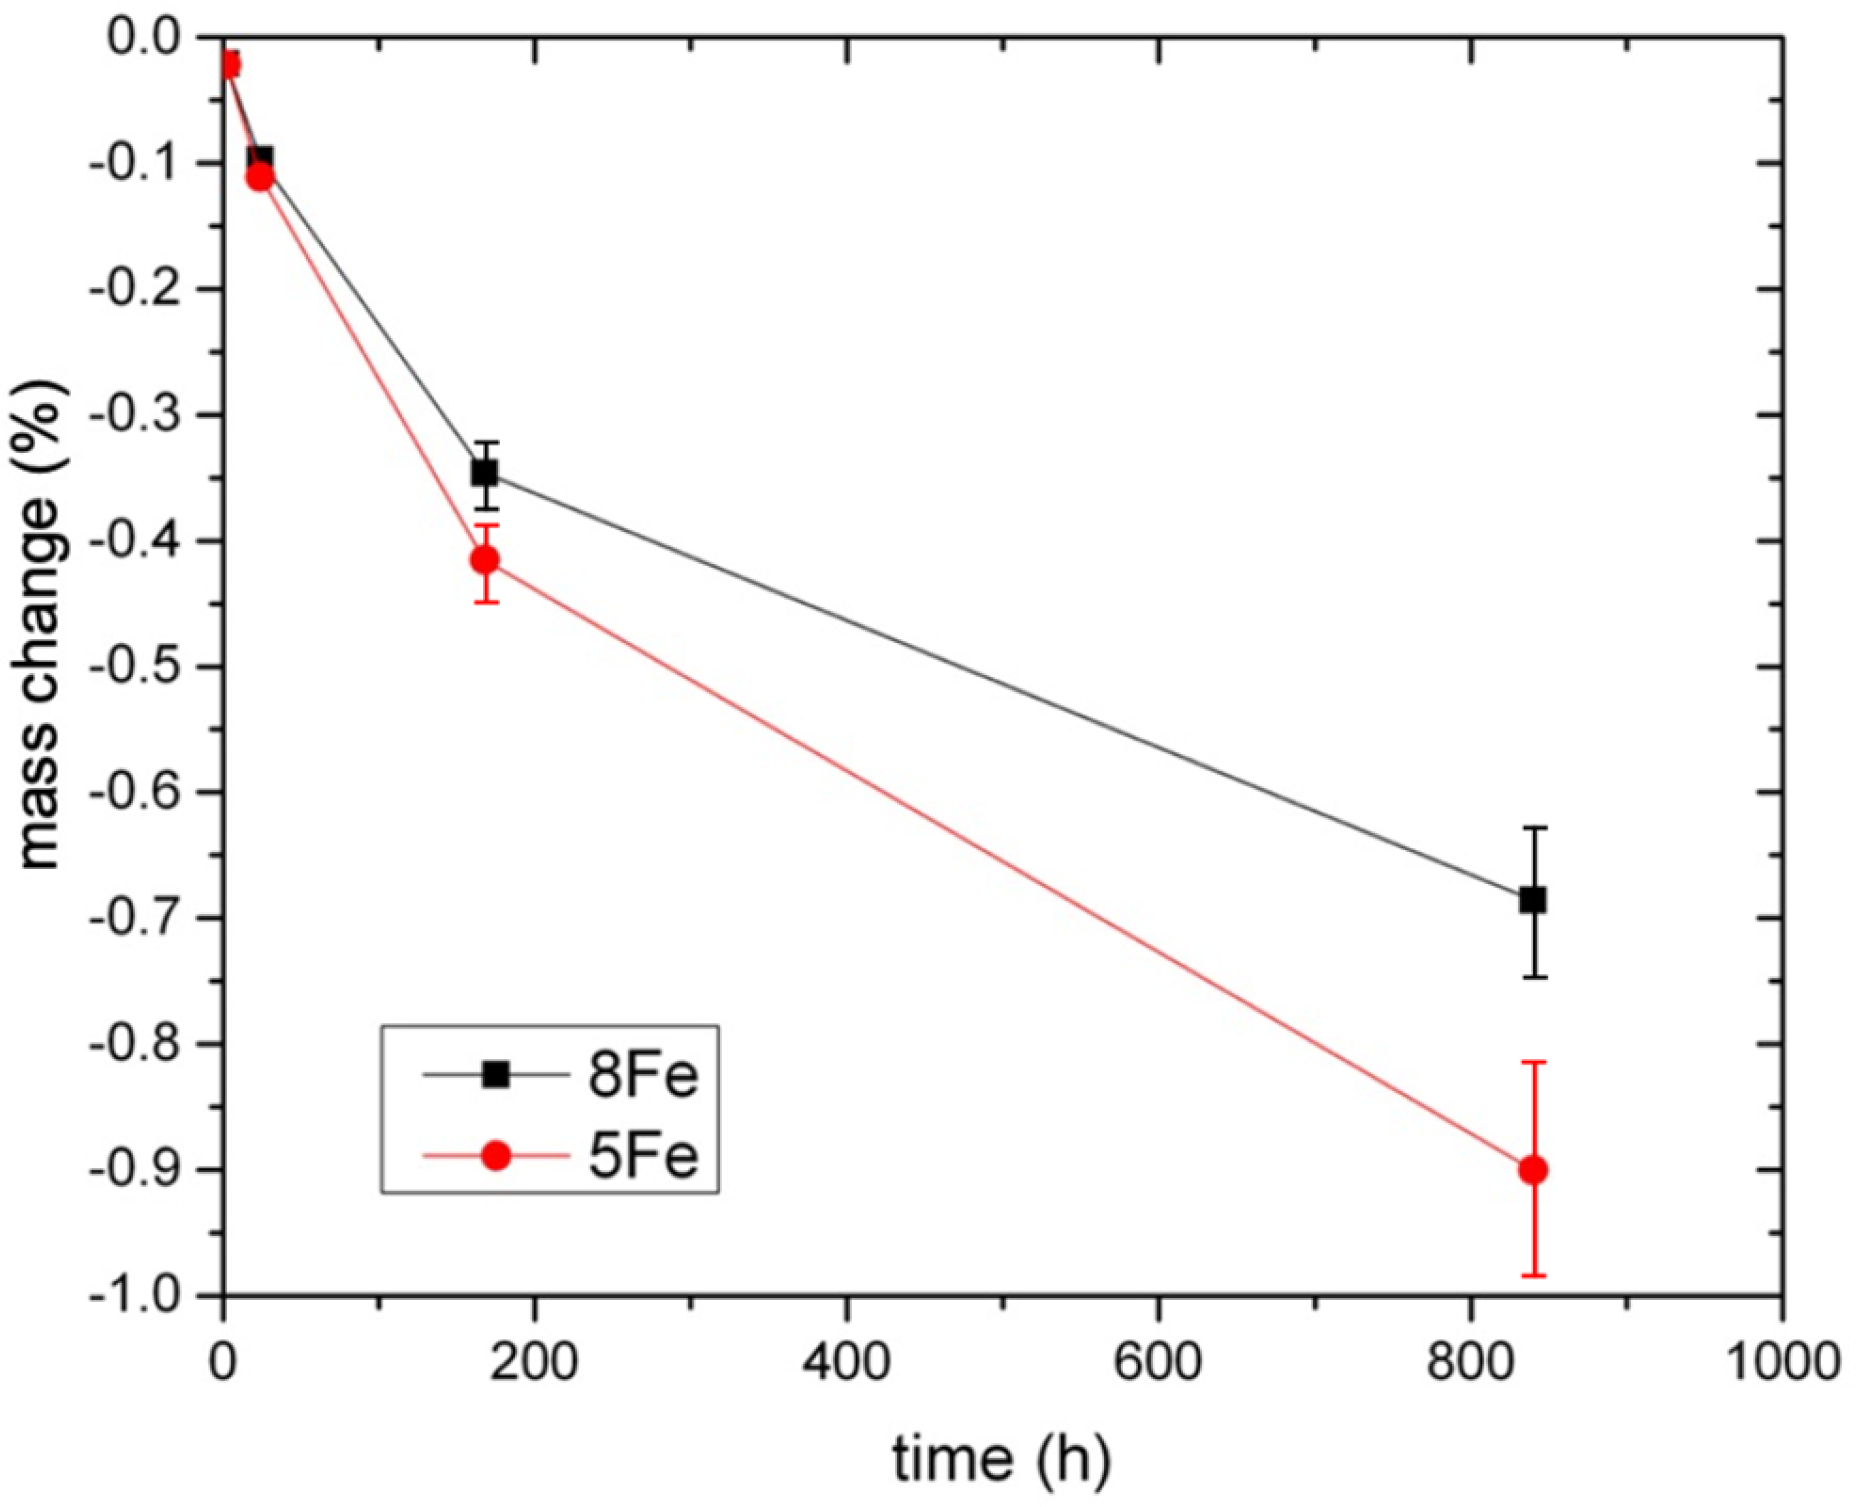
13] when exposed in a simulated BWR environment. The two Fe contents are close to the lower and higher end of the range in the specification of X-750, respectively. The weight change of the two materials is compared in
Figure 10, and the positive effect of having a higher Fe content is evident.
The observed oxide evolution of 5Fe is similar to that observed for 8Fe [
13], but the oxide on 5Fe was more porous and the adhesion was worse. The structure of the oxide scale is also comparable to that found in a study made on X-750 with 7.5 wt% Fe, where the oxide was relatively thick, with an outer layer of trevorite crystals of 7 μm and a duplex inner oxide of 0.8 μm of NiCrO
3 and NiO [
12]. However, the different flow velocity (18 m/s) used in that investigation makes it quite challenging to correlate the results with our findings.
The mass change results in
Figure 10 indicate that the two materials have comparable mass losses for short exposure times (2 and 24 h) but then begin to deviate. After 840 h, the 5Fe material has lost about 32% more mass. The mass loss suggests a degradation process involving the dissolution of metal ions with a concomitant oxide formation. An estimation of the dissolved metal thickness lost into the water was made based on the model presented previously [
13], which assumes that the mass after exposure equals the sum of the remaining metal mass and the oxide mass. Thus:
m(0) is the mass measured before the exposure,
m(
t) is the mass measured after the exposure,
m(
t)
metal is the mass of the metal left after exposure, and
m(
t)
oxide is the mass of the total oxide scale at time
t. The oxide mass is given by
m(
t)
oxide =
xoxide Aρoxide, where
ρoxide is the density of the oxide,
xoxide is the oxide thickness, and
A is the surface area of the test coupon. For the sake of simplicity, we have assumed that the oxide was composed of two layers for each exposure time: the outermost layer made of NiFe
2O
4 (with a density of 5.3 g/cm
3) [
15] and the innermost layer made of NiO (with a density 6.67 g/cm
3) [
16]. To calculate the thickness of the dissolved metal,
h, after a given exposure time
t, we use the following equation:
In the formula, the density of the alloy is
ρX750 = 8.2 g/cm
3, and
x is the measured average thickness from TEM image analysis. The factor 0.27 represents the mass fraction of oxygen if NiFe
2O
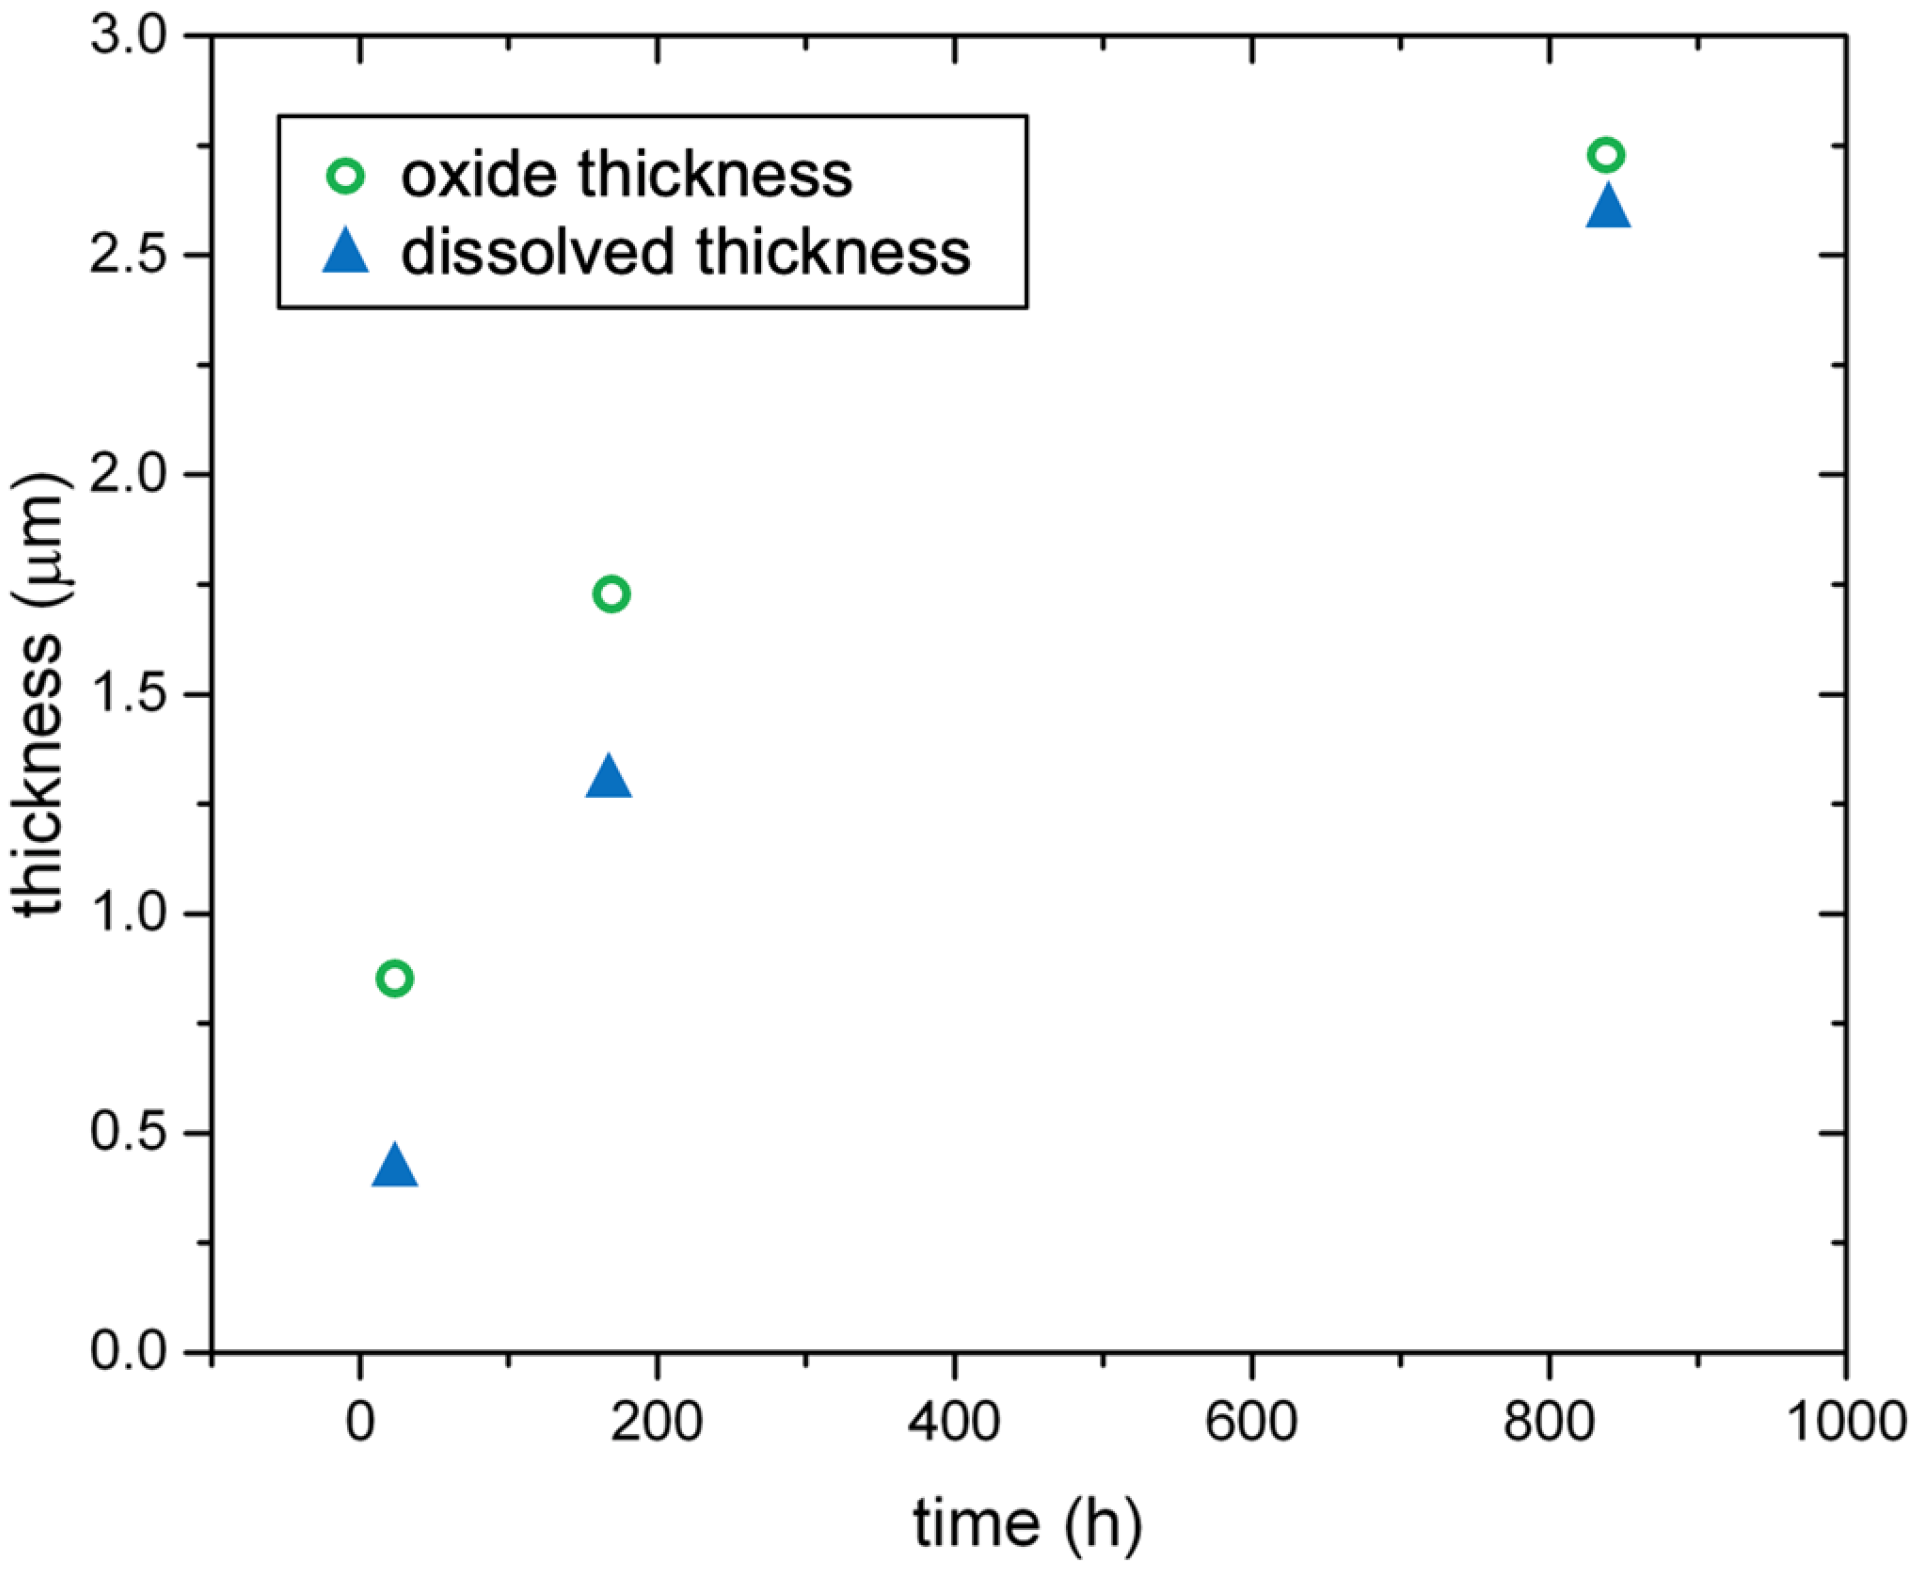
4 has an ideal composition, and 0.21 is the same factor if NiO has an ideal composition. In
Figure 11, the calculated dissolved thickness of the metal and the measured oxide thickness are presented for the 5Fe material as a function of the exposure time. The specimen exposed for 24 h dissolves about 0.4 μm, while an oxide of about 0.8 μm is found on the surface. After 168 h, 1.3 μm has been dissolved into the water, and an oxide of 1.7 μm has been built. When 840 h have passed, the metal thickness dissolved into the water reaches about 2.6 μm, and the oxide is 2.7 μm thick. In
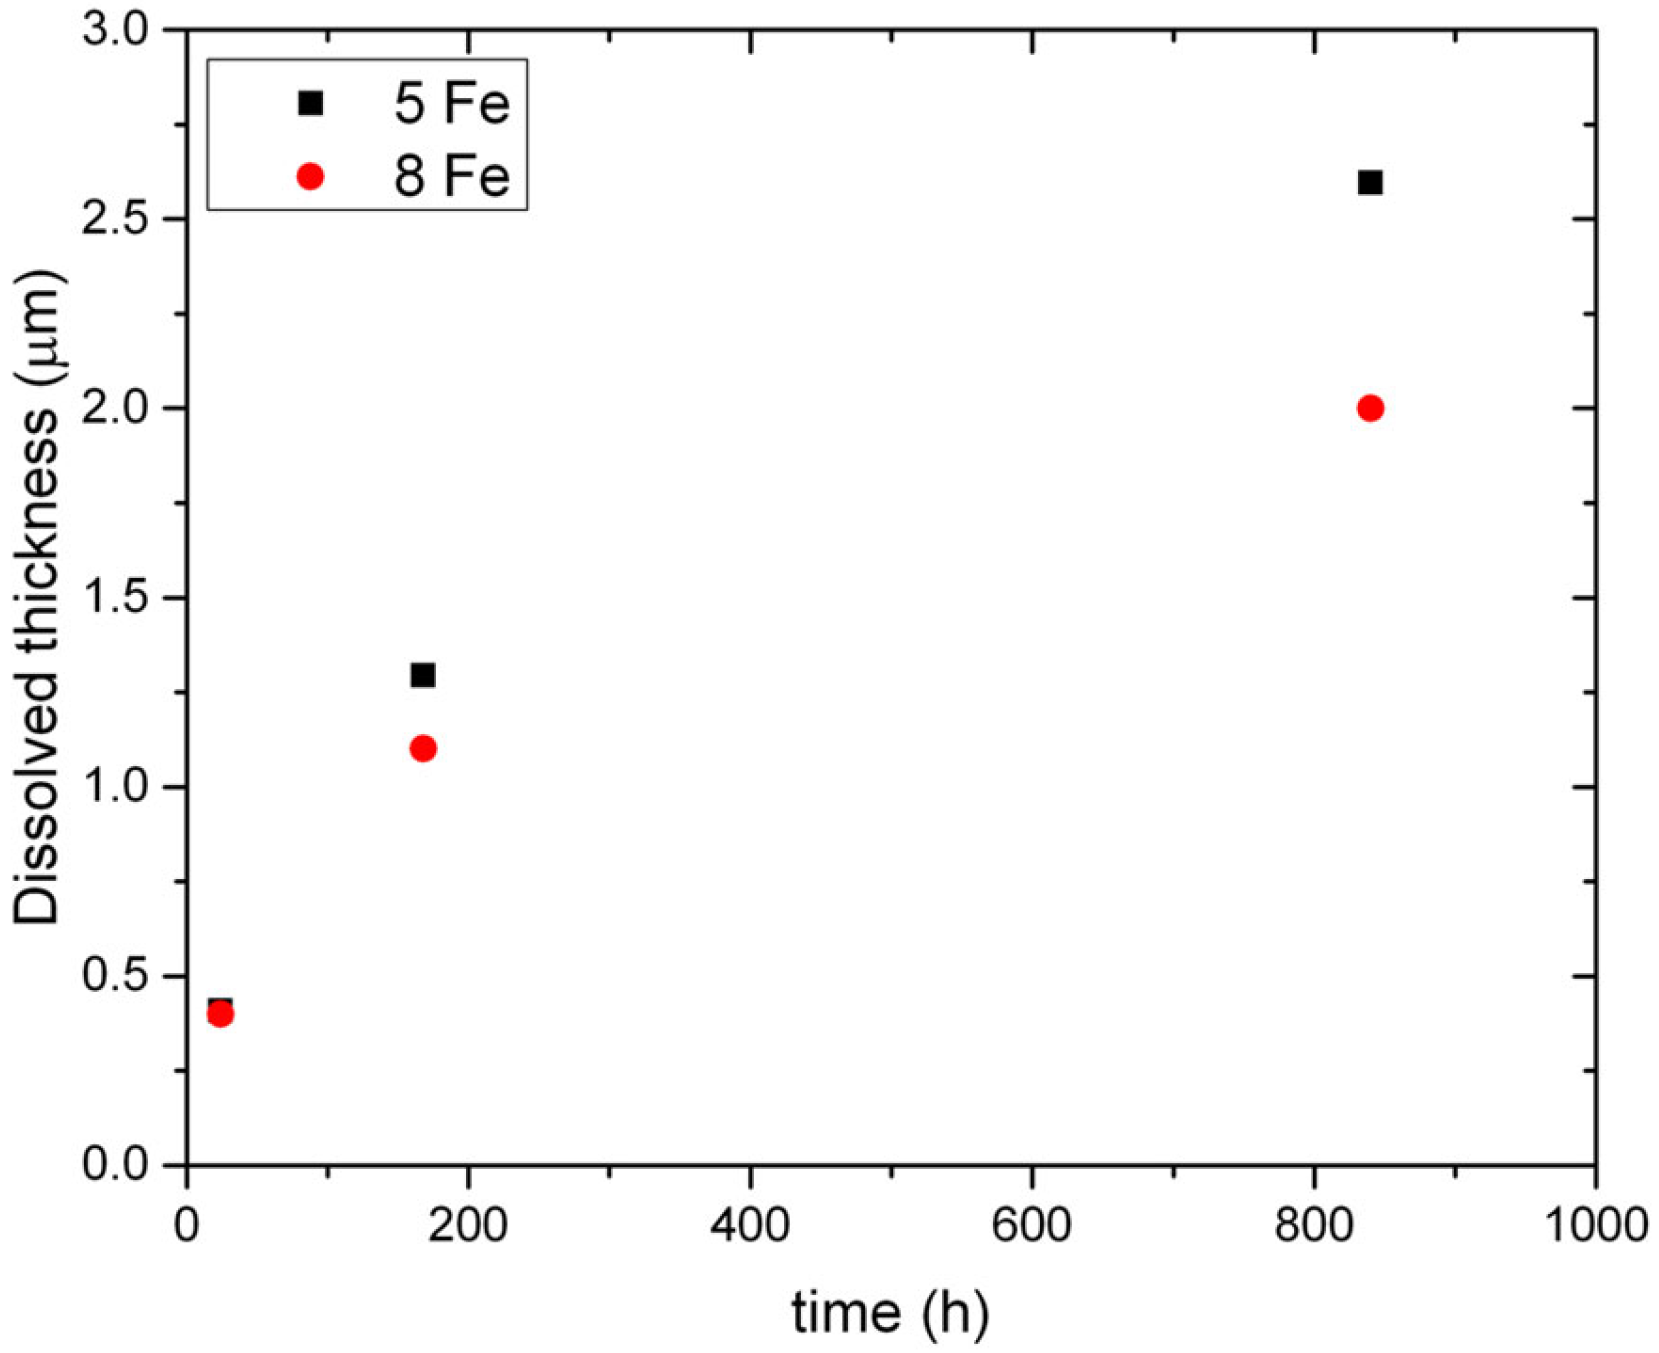
Figure 12, a comparison between the two materials with respect to the measured oxide thickness is presented, and the oxide formed on the 5Fe material is noticeably thicker after 840 h.
When comparing the dissolution rate of the two batches with different Fe contents, it is evident that the 5Fe material loses more metal after 840 h than 8Fe, as shown in
Figure 13. Calculations of the metal thinning are reported in
Figure 14. The metal thinning is calculated as:
This formula differs from Equation (1), which is used to calculate the dissolved thickness. Unlike Equation (1), this formula considers the total amount of thickness lost into the water without taking into account the oxygen rescaling resulting from the formation of the oxide. For instance, after 840 h, the metal thinning for 5Fe is 3.7 μm, while the corresponding dissolved thickness is 2.6 μm. This means that 1.1 μm of the metal that went into the water has re-precipitated to form the oxide scale.
From the curve fitting shown in
Figure 14, we observe that the metal thinning behavior seems to follow a sub-parabolic trend. The metal thinning for 5Fe and 8Fe, with metal thinning in μm and exposure time
t in hours, is given by:
The inset in
Figure 14 illustrates the derivative of the metal thinning. The metal thinning rate as a function of time tends to decrease with time, indicating that the metal thinning rate will eventually become constant. However, longer exposure times should be performed to verify this hypothesis.
5. Conclusions
This paper presents a study of the oxidation behavior of non-pre-oxidized Alloy X-750, containing 5.4 wt% Fe, in a simulated BWR environment, where samples were exposed to a water jet of 10 m/s. The results were compared to a previous study of a batch containing 8.3 wt% Fe. Both materials experienced mass loss during the autoclave exposures carried out for durations ranging from 2 to 840 h. The oxide growth was similar for both batches, beginning with trevorite nanoparticles after 2 h and progressing to a more complex oxide. After 840 h, the oxide consisted of an outer layer of NiFe2O4, a middle layer of NiO and a fine-grained inner layer rich in Ni and Cr. The oxide thickness of the two batches was quite similar until 168 h, after which time the oxide growth was faster for the 5Fe batch. Moreover, the oxide found on the 5Fe material was less adherent to the surface and more porous. Calculations indicate that both oxide growth and metal dissolution rates decrease over time, following a seemingly sub-parabolic pattern. These processes occur at a somewhat slower rate in the material with a higher Fe content (8.3 wt%), suggesting that Fe has a positive effect on the resistance to oxidation in BWR environments. Additionally, further research avenues (longer exposure times and higher Fe content) and potential advancements in this domain should be explored.


