1. Introduction
Over many years the ITER project has been making steady strides towards its design goal of demonstrating a controlled plasma operation in a power-plant-sized facility. With the complexity of ITER design—a multitude of interconnected engineering and diagnostic systems—the radiation environment has to be taken into consideration during the design phase. Neutronics responses play a key role in the design phase of various components not only for the operation phase but also after shutdown—and subsequently, decommissioning of the components. During the operation phase, planned shutdown to maintain or replace components is foreseen and personnel access conditions have to be carefully assessed. This is mainly due to the activation of materials during operation by the high energy neutrons from the deuterium-tritium (D-T) nuclear fusion reaction. After shutdown, activated components have to be stored or disposed of according to the regulatory waste classifications. Hence, activation analyses to estimate the expected levels of activation and provisional waste classification of different components is integral to the design.
ITER will host, in two of its Equatorial Ports (EP), two Test Blanket Systems (TBS) [
1] aiming at exploring the feasibility of tritium breeding via different concepts in the fusion environment, which is an essential requirement for future power plants to ensure tritium self-sufficiency. A TBS consists of a Test Blanket Module—Port Plug (TBM-PP) and its ancillary system. In turn, the TBM-PP consists of two TBM-Sets (or two Dummy-TBMs) and a TBM-Frame. The Dummy-TBMs are designed to replace the original TBM-Sets, should the latter become unavailable for operation. The Dummy-TBMs are then expected to provide the same shielding capability for the ancillary systems in the Port Interspace (PI) as the original ones. A TBS system with two Dummy-TBMs is the subject of the analysis in this paper, as is discussed later on in detail.
The original conceptual design of the TBM-PP was the subject of nuclear analysis [
2] that assessed the radiation fields—during operation—and the ShutDown Dose Rate (SDDR)—after shutdown—in the PI. The analysis focused on two configurations; a TBM configuration with the TBM-PP but without the Pipe Forest (PF) in PI and another configuration with the PF installed in the PI. Since then, the PF and the Bioshield Plug (BP) have both gone through an evolution of the design that necessitates a fresh evaluation of the radiation environment, which is the subject of this paper.
Figure 1 shows the CAD models of the PF and BP through its evolution over the years. In the forefront, the internals of the PF are shown, including the pipes, while in the background the full PF structure is shown. The model shown on the right—2021—is the most updated/evolved model of the PF and BP and is the one used in the analysis covered in this paper. More details on the different components of the model are elaborated on in
Section 2.
The PF is a skid structure mostly containing the high temperature and pressure piping network connected to the TBM-Sets. It constitutes a link bridging the TBP-PP—attached to the Vacuum Vessel (VV)—and the ancillary equipment unit anchored on the tokamak building. Therefore, it keeps integrity while accommodating the different behavior of each side in any normal or abnormal situation. The ITER operation has scheduled shutdowns (following each campaign) in order to allow for the TBM-PP removal that is imposed by the TBM research program, the PF then has to be replaced. This heavy operation requires personnel access to the area of the PP in order to perform the disconnection/reconnection of each pipe, electrical connections, and the overall shroud attachment. While developing the PF arrangement, 2019—
Figure 1—was the first configuration with a middle access corridor, pipes making a complete flexibility loop around the port cells axis and a first tentative activated-water Delay Tank (DT) concept. The DT was included in the design to lower the activity of water, from the Water Cooling System (WCS), passing through the BP so as to meet the radiation limits behind the BP in the Port Cell (PC). The 2021—
Figure 1—configuration has evolved by including a piping layout improvement to cope with the flexibility analysis requirements, better access for personnel/assisting robots, a more detailed DT design, and a reshaped central BP to match the peripheral BP design evolution.
The BP—formed by the bioshield wall, plug, and lid—is a 2 m thick concrete barrier separating the Tokamak structures/components from the personnel accessible areas in the Tokamak building. It is particularly meant for the radiation shielding. The bioshield wall includes openings to provide the interface access for the diagnostics, remote handling, plasma heating and fueling, plasma control and TBM, and vacuum pumping equipment as well as the equipment-cooling loops. A number of competing requirements then drive the design of the BP. Considering the particular case of the TBM port, the radiological requirements in the PC compete with that imposed by the Heating, Ventilation, and Air Conditioning (HVAC), water cooling, and TBM systems. The BP is composed of two parts: the central part which is meant for holding the TBM interfaces and the peripheral part which is fixed with the walls of the bioshield opening. The HVAC, WCS, and TBM requirements are satisfied by implementing the corresponding aperture of the openings through the central and the peripheral parts. The radiological requirements are satisfied by maintaining sufficient thickness of the shielding material—Borated Heavy Concrete (BHC); and by using labyrinths lined with the neutron moderating and absorbing material—Borated Silicone (BS)—to avoid the direct lines of sight for radiation streaming.
In
Section 2, the details of the neutronics model development are given. In
Section 3 and
Section 4, the results from the radiation transport during plasma operation are discussed, covering the neutrons filed in the PI and the performance of the BP—the effect of its evolution on the radiation levels in the PC. The results after shutdown are discussed in
Section 5 and
Section 6. Finally, conclusions from the current analysis and future perspective are given in
Section 7.
2. Neutronics Model
One of the most critical steps in the neutronics model development is the representation —conversion—of the CAD solid model in the input syntax of the radiation transport code of choice to perform radiation transport simulations. Because of the complexity often encountered in fusion facilities, Monte Carlo (MC) codes—MCNP [
4] is used in this paper—are the go-to choice. It is also essential that the developed model captures the complexity and details not just on a local/components level but also on a global/facility level. Two important aspects of the neutronics model are then needed: the retention of the design details on a local level—from the original CAD model—after conversion and the accurate representation of the fusion environment on a global level—considering the facility as a whole. The former is covered in
Section 2.1 and the latter in
Section 2.2.
2.1. Local Models
The process of representing the CAD geometry in the MCNP input syntax is cumbersome and manually prohibitive. It is often the case that dedicated codes are used to automate the conversion process. In this paper, the open-source automatic CAD-to-MCNP conversion code McCAD [
5,
6,
7] was used. The code supports conversion to the MCNP input syntax and has capabilities built in for void generation—in MC codes the space that does not belong to material cells has to be defined as void.
2.1.1. TBM-PP
The CAD model of the TBM-PP (with two Dummy-TBMs) was converted to MCNP input in a previous analysis [
2]. The developed heterogeneous model retained all the details of the internal cooling pipes, shielding, and thermal insulation. The homogenization was only limited to the bolts and nuts at the rear side of the TBM-PP that connect it to the VV. The bolts and nuts were simplified as homogeneous layers with the corresponding homogenized material mixtures assigned.
Figure 2 shows the CAD model of the TBM-PP with the three homogeneous layers highlighted. Since no changes has been implemented in CAD since its development, it was decided to adopt the developed MCNP model in the current analysis.
2.1.2. PF
The CAD model of the PF contains the central BP, pipes and their support, WCS DT, internal and external shielding candidates, shroud/structure, drain tank, Neutron Activation System (NAS) pipes, and the Integrated first wall Blanket/Edge localized mode—vertical stabilization coils/Divertor cooling system (IBED). The CAD model was first cleaned in ANSYS SpaceClaim [
8] from any intersections or overlapping in the components then prepared for conversion. The preparatory step included material assignment, simplification of pipes, and decomposition of solids. The simplification of pipes involved a reduction of tori bends to segments of cylinders. McCAD provides the capability to perform such simplifications, which retains the overall configuration/detail of the model. The decomposition of CAD geometry solids involved a reduction into their primitive sub-solids that are supported by MCNP and was also performed using McCAD. The external structure of the PF and the TBM-Frame are displayed in
Figure 3a.
Figure 3b,c show the internals of the PF and TBM-PP.
The converted model was then validated through cross checking of the volumes between CAD solids and the corresponding MCNP cells. The maximum deviation found was ∼0.8% due to simplification in two small components. The rest of components showed a deviation of ≤0.6%. Keeping in mind that all cells represent the decomposed solids and are of small volume, both deviation figures are considered acceptable by IO nuclear analysis standards/guidelines. The developed MCNP model of the PF—with the central BP—constitutes a total of 5424 cells, 6766 surfaces, and 9 assigned materials.
2.1.3. BP
The CAD as well as the developed MCNP models were provided by ITER Organization (IO) [
9].
Figure 4 shows a cross section of the BP at the mid-plane with all the components identified. As introduced in
Section 1, the new design includes ventilation openings with proper shielding and a higher level of detail of the different components of the BP. In the model, BHC (3.6 g cm
−3) is used as a filler and shielding material in the bulk of the BP. SS304 (7.93 g cm
−3) is used as a sleeve for the BHC in the peripheral and central parts. BS (1.59 g cm
−3) has also been added to the ventilation openings. The model was used as is without any modifications.
2.2. Global Model
In nuclear analysis of fusion facilities, high fidelity models are paramount to replicating the radiation environment and producing accurate nuclear responses that reflect the behavior of different components in the fusion environment. The isolated models of PF, BP, and TBM-PP—described in
Section 2.1.1–
Section 2.1.3—were integrated into EP no. 16 in the reference C-Model [
10,
11], an MCNP 40° sector model of the Tokamak facility. The generic neighboring port fillers in the C-Model were also replaced by proper local models [
12] that reflect the port environment in the Tokamak facility. Models of the port plugs for the Electron Cyclotron (EC) and Ion Cyclotron (IC) heating systems were integrated in the upper and equatorial ports. A model of the cryopumps was also integrated in the lower port.
Figure 5 shows an MCNP plot of the integrated C-Model, at the vertical mid-plane of EP no. 16.
2.3. Analysis Configurations
In this paper, two variations of the baseline model are used to perform comparative nuclear analyses. The configurations aim mainly at exploring different shielding options for the PF and BP. The optional shielding is explored since they provided practical solutions to mitigate any increased levels of radiation in the PI and also to meet the radiation requirement in the PC, behind the BP. The baseline configuration, described in the previous paragraph, is the fourth iteration over the many years of the TBM-PP, PF, and BP evolution. The configurations used in this analysis are referred to—henceforth—as C4, with C standing for configuration. The previous configurations are detailed in [
2], for C1 and C2, and [
3], for C3.
Since the TBM-PP model is designed to provide the shielding as the original TBM-Sets, it was used along with the PF and BP models to create a configuration to assess the performance of the PF and BP evolved designs. The baseline configuration, designated as C4RC, is a
Reference configuration with TBM-PP (with two Dummy-TBMs), water present in WCS, DT filled with water, LiPb present in the LiPb circuit, closed BP and maintenance corridor doors, and full thermal insulation of pipes passing through the BP. The other two variations are C4EI—with
External and
Internal PF shielding—and C4RD—which is a
Reference configuration but with shielding panels lining the BP
Dogleg where pipes pass, as highlighted in
Figure 4. Both shielding options are highlighted in
Figure 3b.
3. Fusion Neutrons Environment in PI (Plasma-ON Mode)
The global model described in
Section 2.2 was used to perform neutron transport simulations for the plasma-on mode, during plasma operation.
3.1. Source Description
A standard ITER D-T plasma neutron source—with a mean energy of
—is defined in the reference C-Model [
11], which corresponds to a D-T campaign with 500
of fusion power and a neutron production rate of 1.77 × 10
20 n/s. This translates to a source strength of 1.973 × 10
19 n/s for the 40° sector model, C-Model.
3.2. Baseline Configuration (C4RC)
Neutron transport simulations were performed using D1SUNED v3.1.4 code [
13] along with the FENDL3.1d nuclear cross section data library on MARCONI HPC cluster [
14,
15]. The neutron flux distribution in the PI was obtained over a superimposed 5 cm × 5 cm × 5 cm mesh. Variance Reduction (VR) techniques were implemented because of the heavy attenuation that neutrons suffer in traversing the TBM-PP and the BP. Weight Windows (WW) generated using ADVANTG [
16] were used to direct neutrons paths to the PI.
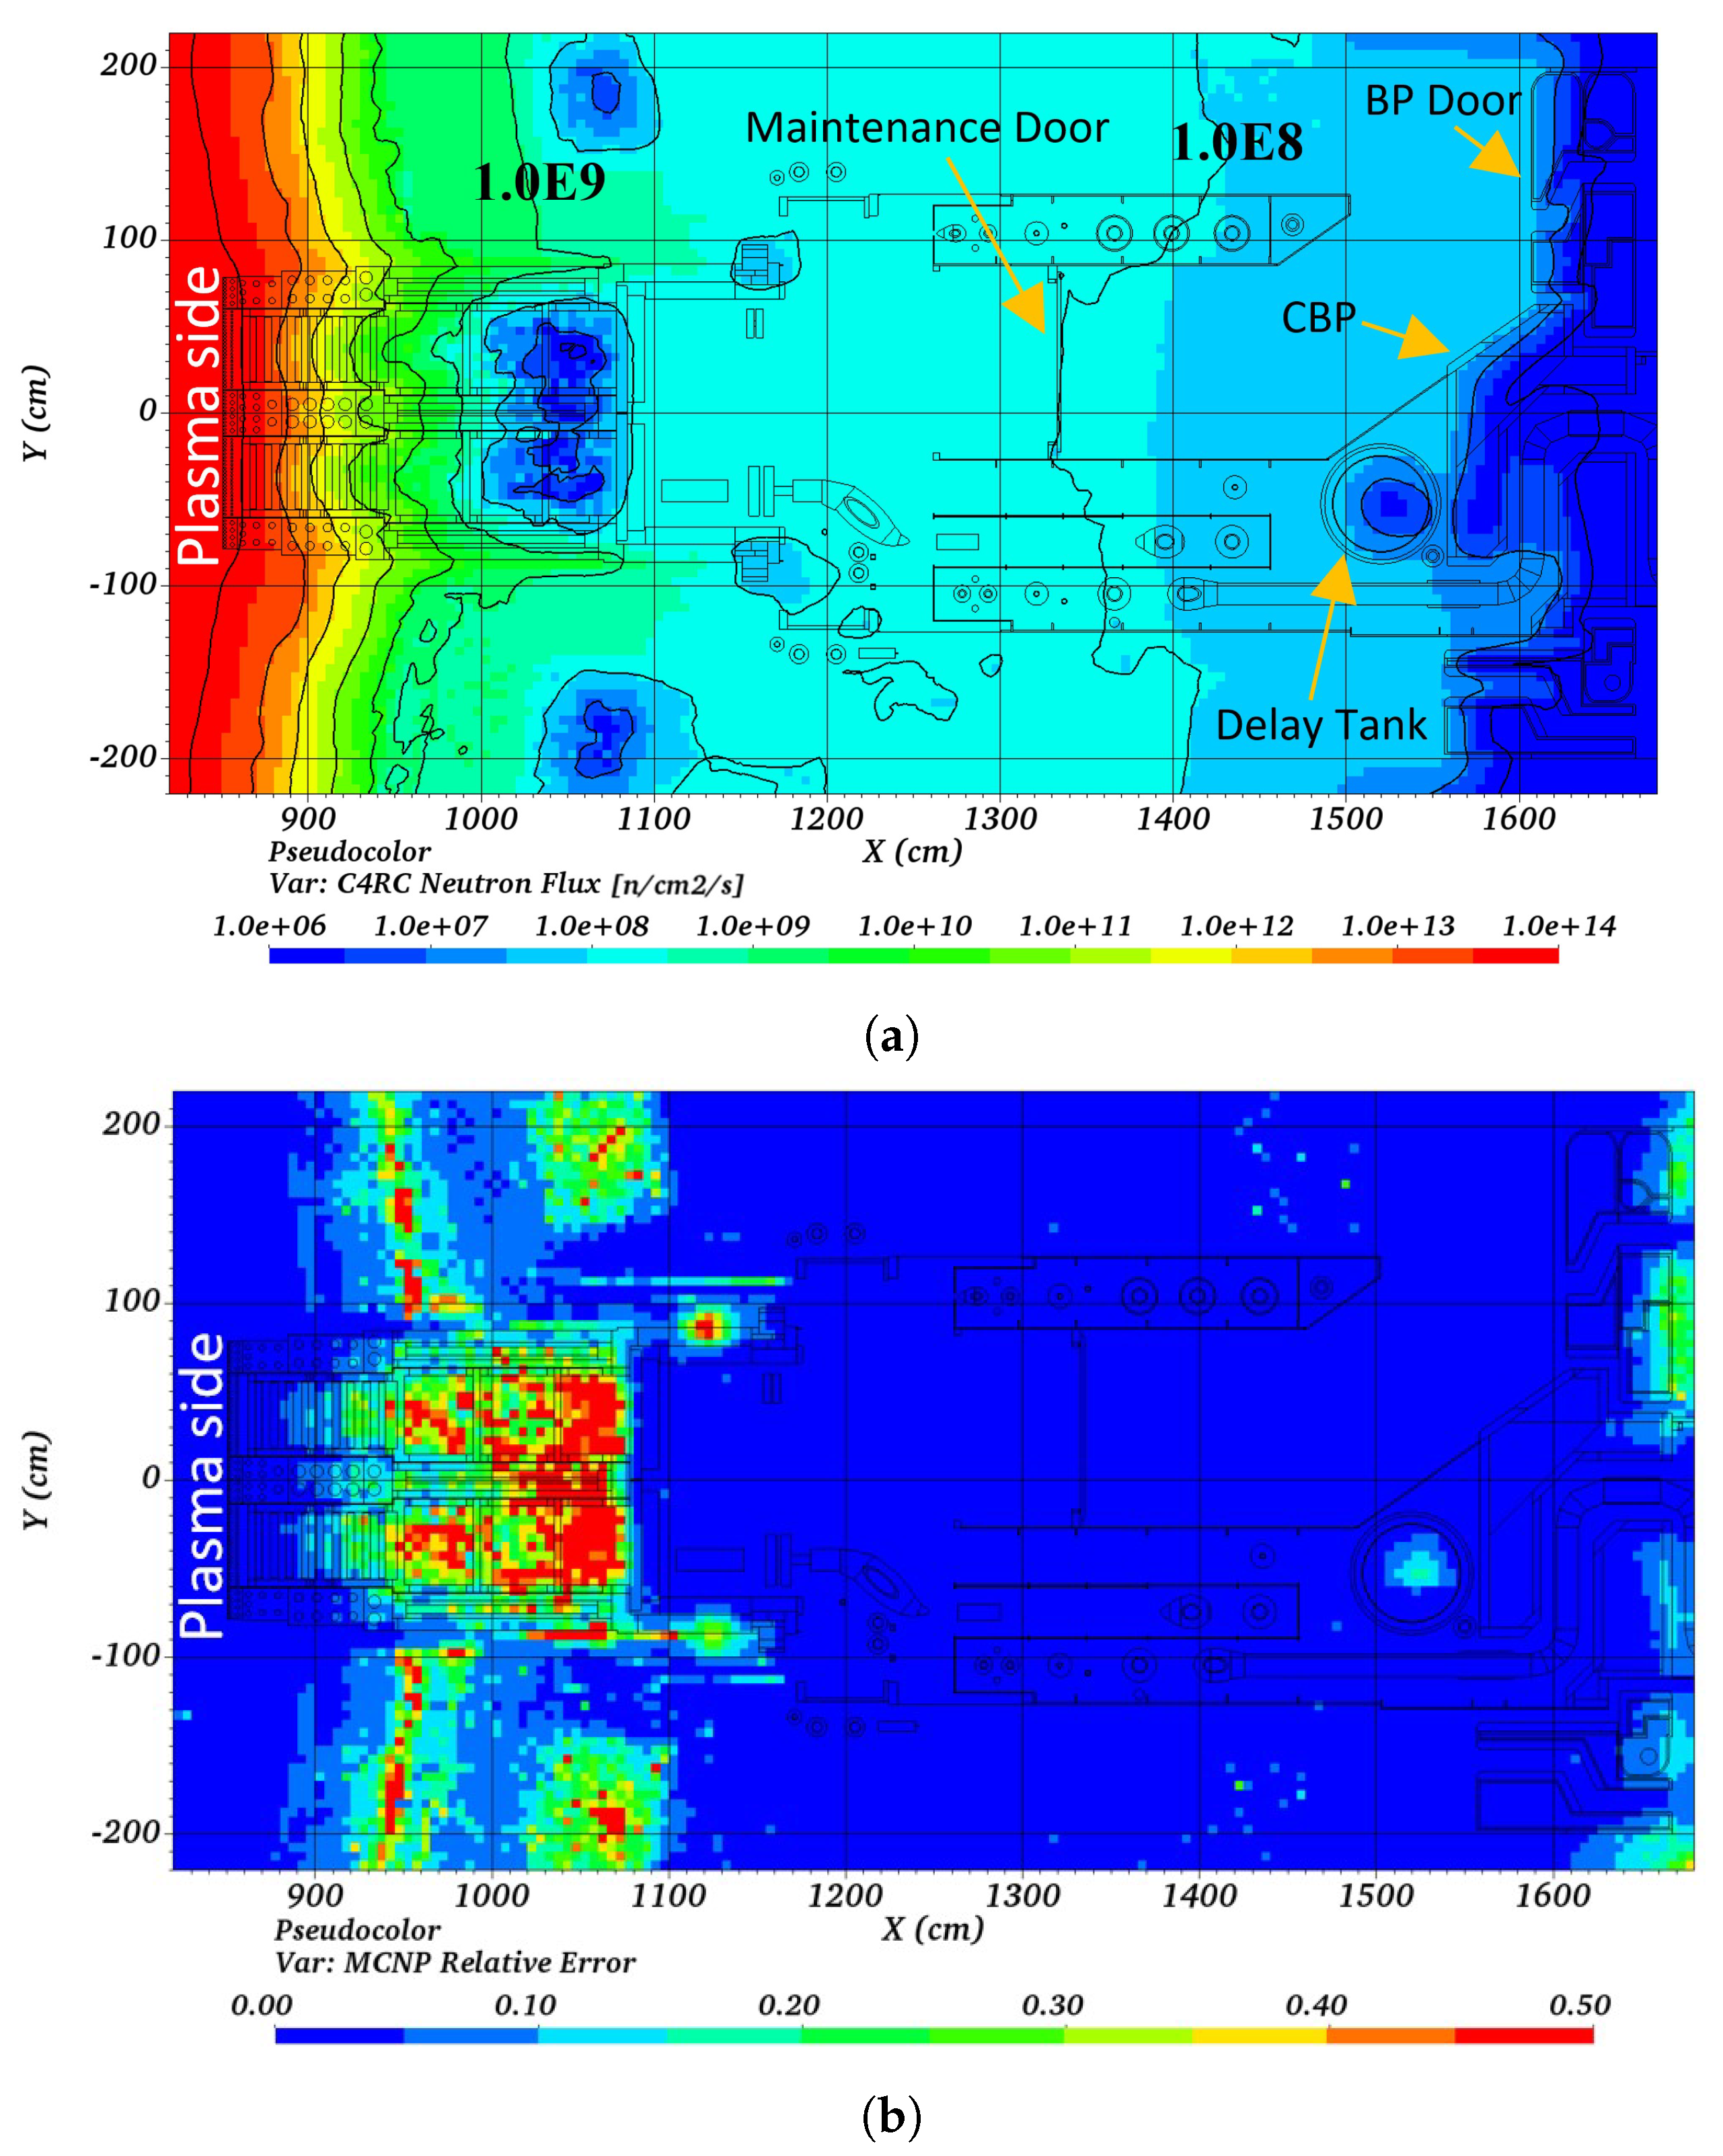
Figure 6a shows a mapping of the neutron flux in the PI for a planar section through EP no. 16 mid-plane. The MCNP Relative Error (Re) is shown in
Figure 6b. In the figure, it can be seen that the neutron flux is less than 1 × 10
8 n/cm
2/s inside the maintenance corridor from the maintenance door up to the BP, as indicated by the 1 × 10
8 n/cm
2/s contour line. The MCNP Re is less than 10% inside the maintenance corridor. However, it increases inside the TBM-PP due to the heavy neutron shielding because of the presence of water. Compared to the previous analysis, C3RA in [
3], the evolved model of the PF shows similar neutron flux distribution in the PI. However, there is a slight increase of ∼4 to 6% in the neutron flux in front of the maintenance door towards the interface between the TBM-PP and PF due to the displacement of the maintenance door to a location deeper inside the maintenance corridor.
3.3. Shielding (C4EI and C4RD)
As described in
Section 2.3 and highlighted in
Figure 3b, two options were considered for shielding in the PF and BP. The PF shielding—C4EI configuration—consists of 3 cm B
4C (2.52 g cm
−3) panels, except the ones covering the floor on the inside of the PF structure which are
cm thicker, installed on the inside and outside of the PF shroud and the flange. In comparison to C4RC,
Figure 7a shows a mapping of the relative decrease in percentage, voxel-wise, over the neutron flux mesh. The artifacts seen around the TBM-PP are statistical in nature, due to differences in convergence, and should be ignored. It can be seen that a reduction of 80% in the neutron flux behind the maintenance door and near the DT is achieved. A lower reduction of 60% to 80% can be seen broadly inside the maintenance corridor. A reduction of 40–60% at the interface between the PF and TBM-PP is mainly attributed to the flange shielding panels. The same level of reduction is seen near the BP door from the maintenance corridor side. These levels of reduction in the neutron flux inside the maintenance corridor are a clear manifestation of the efficacy of the PF shielding panels. This will not only reduce the activation of materials in the PF, but also will result in a subsequent reduction in the SDDR, as will be discussed in
Section 5.
The BP shielding option—C4RD configuration—consists of 5 cm B
4C (2.52 g cm
−3) panels lining the pipes pass through the BP dogleg, as highlighted in
Figure 3b and
Figure 4. This mainly impacts the neutron flux around and behind the BP. In comparison to C4RC,
Figure 7b shows a mapping of the relative decrease in percentage, voxel-wise, over the neutron flux mesh. It is obvious that the reduction in the neutron flux is limited to the BP region, ∼80%. This option is an efficient candidate in mitigating any high levels of neutron flux behind the central BP. In addition, noticing that in
Figure 7a, a reduction around the BP of about 40 to 60% is observed, combining both shielding options will reduce the neutron flux behind the BP to meet the limits imposed by the Radiation Maps (RadMap).
3.4. BP Performance (C4EI and C4RD)
The BP has been through a major evolution of the design. From the incorporation of ventilation openings in the peripheral part to a redesign of the central and permanent parts. This necessitates a re-evaluation of the nuclear responses behind the BP. Using the same global model, source definition, and WWs described in
Section 3.1 and
Section 3.2; the neutron flux distribution behind the BP was obtained. In
Figure 8a, a mapping of the total neutron flux behind the BP is shown. It can be seen that the region behind the BP experiences neutron flux levels lower than 1 × 10
5 n/cm
2/s except at few spots. The spots with a local maximum in the flux distribution correspond to the door hinge—top left, ventilation openings—middle right, clearance between the central BP and top inlet door—top center, and finally behind the central BP—middle. As is discussed later, all those can be addressed by the shielding options introduced in
Section 2.3 and
Section 3.3. The new design has successfully addressed the previous concerns [
3] of neutron streaming through the permanent part under the central BP.
Figure 8b shows the percentage decrease, voxel-wise, in the neutron flux behind the BP in comparison to the previous design—C3RA configuration [
3]. A reduction of 90% in the total neutron flux behind the BP is achieved with the new design. This is manifested in the mapping in
Figure 8a, where the neutron flux level around the permanent BP, center bottom, is lower than 1 × 10
4 n/cm
2/s.
Similar to the studies described in
Section 3.3, the efficacy of the two shielding options were assessed behind the BP. To assess the BP performance, the neutron flux was obtained at a—10 cm thick—central and peripheral tallies located at a distance of 30 cm behind the BP. The central tally occupies the space opposite to the central BP while the remaining extent to the port walls is covered by the peripheral tally, as shown in
Figure 9.
Considering the external and internal PF shielding option—C4EI configuration in
Section 2.3—it can be seen in
Table 1 that a reduction of ∼47% is achieved behind the central BP and 36% around the periphery. This could be related to the impact of the shielding enveloping the PF which not only help in blocking neutrons coming from the TBM-PP side, but also block the neutron-cross-talk between the neighboring EPs. Using shielding panels along the pipe pass in the central BP—C4RD configuration in
Section 2.3—is more efficient, compare
Figure 8a,c, in reducing the central tally by ∼63% but is less efficient on the periphery, as expected, compared to the PF shielding. It is then recommended, as was the conclusion in
Section 3.3, to mix both shielding options to benefit from a reduced radiation levels in the PC, both behind the central BP and around the periphery where the door hinges and clearances would not be efficient in shielding the neutrons.
The shielding material used in the BP shielding panels—configuration C4RD—differ from that used to line the ventilation openings, B
4C in the former and BS in the latter. Nuclear analysis was performed to assess the efficacy of matching the shielding material between the central and peripheral BP. A C4RD Variant configuration—C4RDV—was set up where the shielding panels along the pipe pass were assigned BS (1.59 g cm
−3). From
Table 1 it can be seen that a reduction of ∼3% behind the central BP is achieved compared to using B
4C. While not a significant reduction, it gives the design team the option to match the central BP pipe pass shielding with either the PF or the peripheral BP shielding materials.
4. Decay Neutrons Environment in PI (Plasma-ON Mode)
Water in the WCS will experience elevated levels of radiation as it flows through the pipes in the TBM-PP and PF. In addition to plasma neutrons, decay neutrons due to water activation has to be taken into consideration. Water is activated mainly due to 16O(n, p)16N and 17O(n, p)17N reactions; 16N decays by gamma emission; giving off (5%) and (68.8%). On the other hand, 17N decays by emitting neutrons with (6.9%), (49.8%), and (37.7%). Unlike plasma neutrons that originates in the plasma and suffers attenuation as it traverses the TBM-PP and PF, decay neutrons are emitted along the WCS pipes and DT in the PF and even behind the BP as pipes cross to the PC.
4.1. Source Description
In a previous analysis [
17], the average
17N activity in the TBM-PP cooling water during plasma operation was estimated as 7.0 × 10
5 Bq cm
−3. With the assumption that it represents the activity of water entering the PF, the decay neutron source in the PF was developed. The decay neutron source comprises two parts: pipes and DT. The neutron source in the pipes was developed by segmenting the hot leg pipe, the one carrying water from the TBM-PP to the PC, and assign to each segment a uniform average activity based on its inlet and exit activities. The water flow rate was assumed to be 6.0 × 10
3 cm
3 s
−1, corresponding to a mass flow rate of 4.2 kg s
−1 through the 6 cm diameter pipes. The activities assigned to the different segments are plotted in
Figure 10. The hot leg pipe carries water from the TBM-PP to the DT inlet where it branches into two smaller pipes serving as tank inlet, as shown in the left subfigure in
Figure 11. Water then exits the tank through a pipe that runs to the PC through the DT top.
As mentioned in
Section 1, the development of the DT was motivated by the necessity to reduce the activity of water before it crosses the BP to the PC. The current design of the DT increases the effective residence time of activated water to 33 s before exiting to the PC.
Figure 11 shows the velocity profile inside the DT. On the left of the figure, the DT CAD model is shown, where there are two inlets at the bottom of the tank and one outlet at the top. Fluid jets from the two bottom inlets impinge on each other and reduce the velocity of water significantly. Water then fills up the DT slowly till it reaches the top and leaves through the outlet pipe to the PC.
A 3D Computational Fluid Dynamics (CFD) analysis was performed using ANSYS Fluent [
18] to calculate the
17N activity distribution inside the DT. A steady state transport analysis was performed with a source term defining the decay of
17N. It was assumed that
17N follows the same path as the bulk of water. It can be seen from
Figure 12 that the
17N activity is concentrated mostly at the bottom—∼30% of the total DT activity. As can be seen in
Figure 10, the current design of the DT successfully reduces the
17N activities from 3.90 × 10
5 Bq cm
−3 at the inlet to 1.62 × 10
3 Bq cm
−3 at the outlet.
In order to produce the source term for MCNP, the DT was segmented in the axial direction, with additional annular segments at the bottom to capture the jet stream effect, and average activities were assigned to the segments. Both the distribution of activities in pipes and DT were then fed to a dedicated Python tool that produced the MCNP SDEF card. The total source strength, pipes + DT, was estimated to be 8.15 × 10¹⁰ n/s. It is worth noting that similar assumptions could be used to generate 16N decay gamma source distribution.
4.2. Neutron Flux in PI
Using the developed source definition, and D1SUNED code along with FENDLE3.1d, the neutron flux distribution in the PI was obtained over 5 cm × 5 cm × 5 cm mesh. Since it is likely that the BP shielding option will be adopted in the final PF design, it was decided to perform the neutron transport simulation on configuration C4RDV, described in
Section 3.4 where the BP dogleg shielding material matches that used in the peripheral BP.
Figure 13a shows a mapping of the total neutron flux in the PI at the EP no. 16 horizontal mid-plane. It is worth noting that no WWs were necessary and that the MCNP Re was less than 5% in the PI and behind the BP. It can be seen that the DT is the major source of decay neutrons in the WCS and that neutrons over-spill on the central BP and reach behind the BP. A mapping through the DT vertical mid-plane is shown in
Figure 13b. It is obvious that the majority of neutrons are emitted near the bottom of the tank, as described by the activity calculations in
Section 4.2.
The neutron flux was also obtained behind the BP at the central, peripheral, and full-extent tallies, and described in
Section 3.4 and
Figure 9.
Table 2 shows the values of the three tallies. It was found that, with the high resolution definition of the DT decay neutron source and using BP shielding, the values of the full-extent tally behind the BP satisfies the limit imposed by the RadMap requirement in the PC—6 × 10
4 n/cm
2/s.
5. Shutdown Dose Rate (Plasma-OFF Mode)
With the complexity of design encountered in ITER, maintenance has to be accounted for in the operation schedule. ITER is expected to have intermittent shutdowns, as dictated by the need to replace/maintain components and/or by the several test programs involved in ITER operation. This was highlighted, in
Section 1, by the need to replace the TBM-Frame and Dummies, and in turn the PF, following each campaign as required by the TBM program. The several operational campaigns [
19]—each spanning ∼2 years—include: a single First Plasma (FP), two pre-Fusion Plasma Operation (PFPO), and eight Fusion Plasma Operation (FPO).
During operation neutrons from the plasma impinge on the materials in the facility and cause transmutation of the nuclide activation. Assessment of the SDDR due to decay photons from activated materials is necessary for all potential sources. In this paper, two sources of SDDR are considered: activated components and residual activated LiPb. There is another source of SDDR, however small its contribution compared to the other two, caused by the Activated Corrosion Products (ACPs), which is not considered in this paper.
5.1. Irradiation Scenarios
ITER reference scenario for the TBM program is called the Short scenario [
20] and it encapsulates the first two FPO campaigns. It focuses on the irradiation of the TBM-Frame and TBM-Sets. The Short scenario spans 4 years of operation at different fusion powers. The scenario ends with 17 pulses at 500
and 3 pulses at 700
, each followed by a 3920
dwell time. The last three pulses account for an enhanced plasma operation beyond the nominal 500
mode. The FPO1 campaign spans 16 months, followed by 8 months of shutdown, and starts with a deuterium plasma, then moves to a D-T plasma with a gradual increase in tritium density. The schedule has planned shutdown times for disruption mitigation and commissioning of components for the different experiments. FPO2 is a similar campaign but with higher fusion powers and only D-T plasmas. While the Short scenario gives an outlook of the activation levels of TBM-PP and PF after two cumulative campaigns, the shorter scenarios—FPO1 and FPO2—give a refined assessment of the levels of activation to be expected during the maintenance operations after each campaign.
5.2. Activated Components
It is worth noting that during the photon transport step of the SDDR a drained out TBM-PP and PF were considered; the water in the WCS and LiPb in the LiPb circuit were voided via the material swapping capability in D1SUNED.
5.2.1. Short Irradiation Scenario
The D1SUNED code [
13] provides the capability to perform neutron and decay photon transport in a single run through the utilization of the Direct 1-Step (D1S) [
21] method for SDDR calculation. To calculate the SDDR, D1SUNED code was used along with its custom data library. Flux-to-dose-rate conversion factors—ICRP-74 [
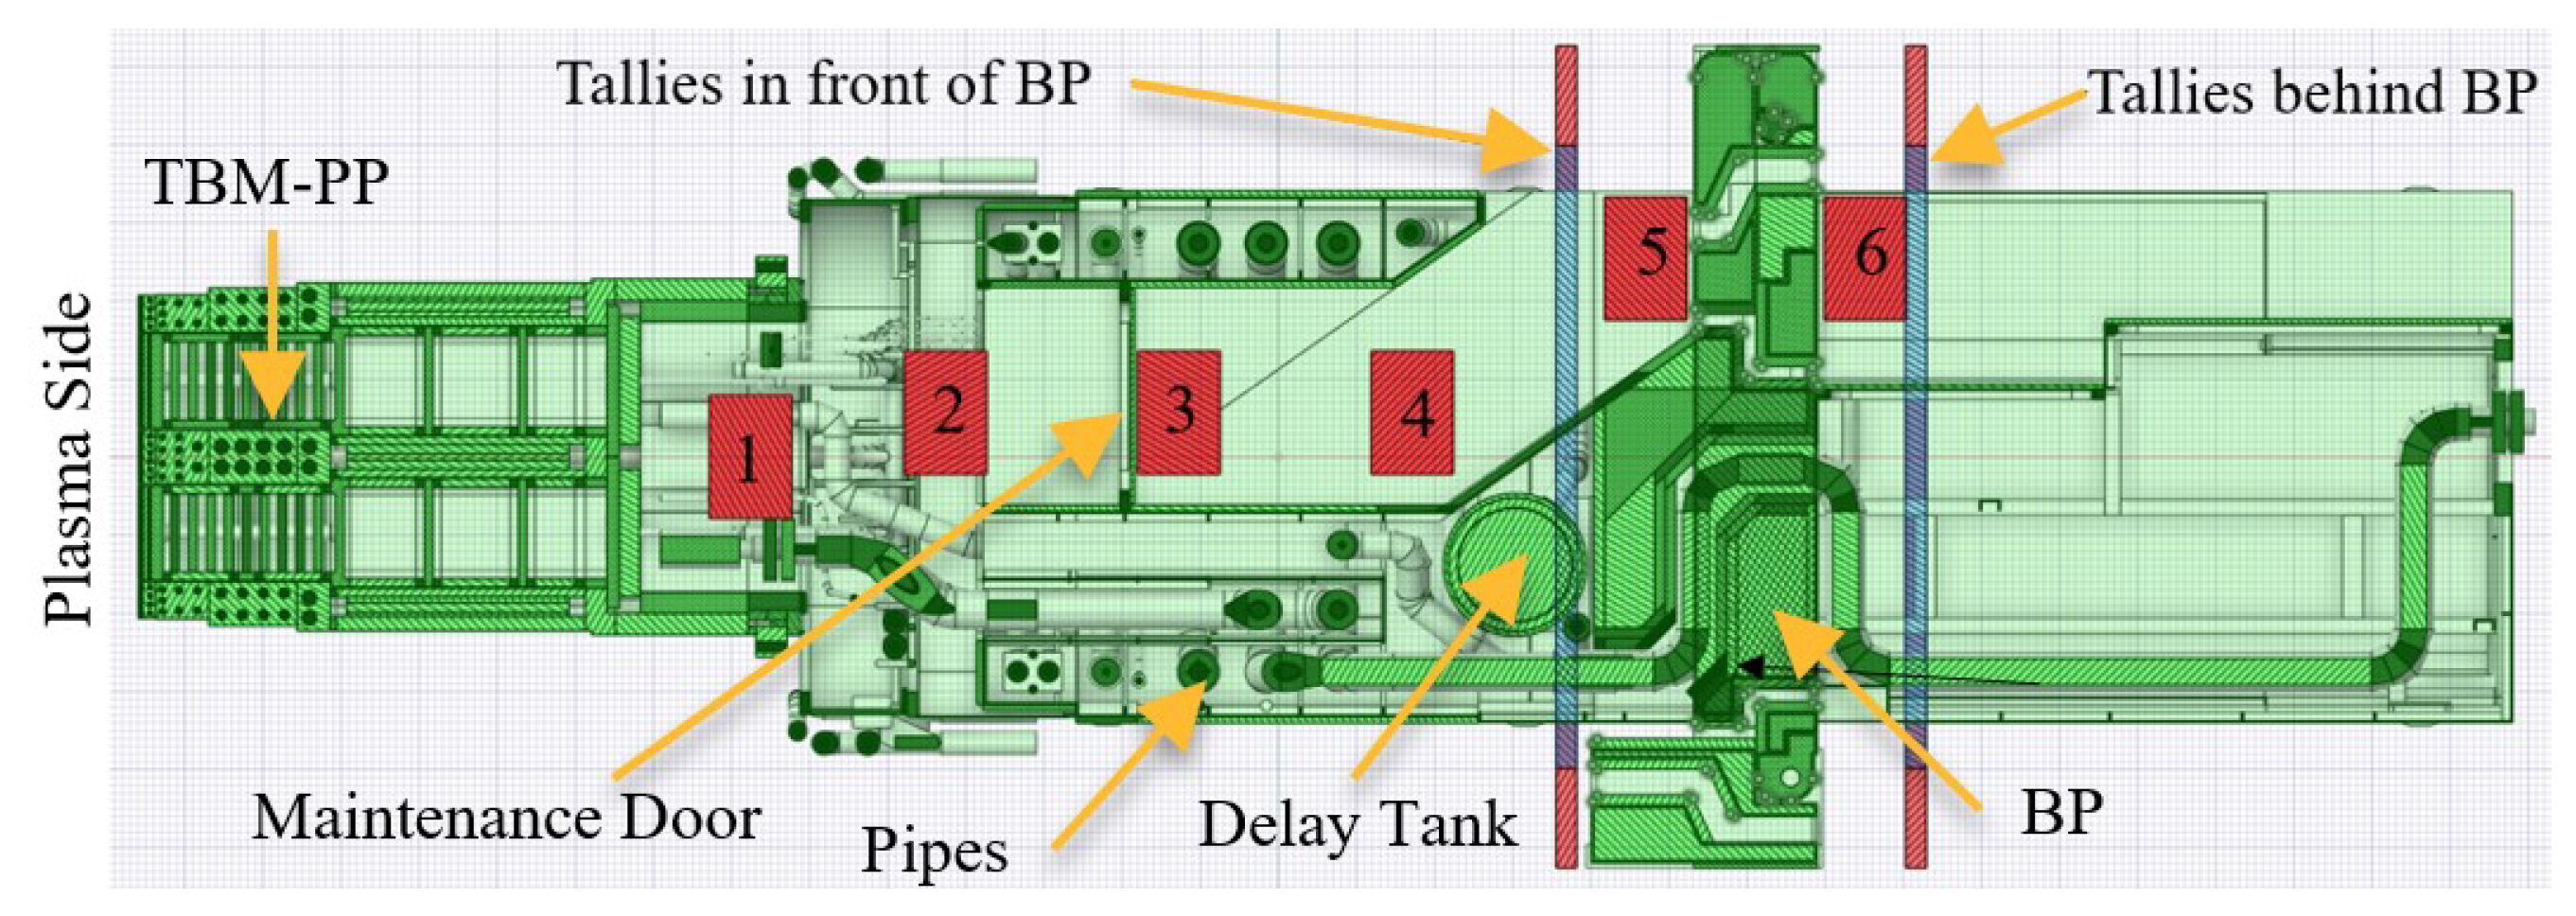
22]—were applied to obtain the SDDR at several cooling times. Weight Windows (WW) generated using ADVANTG were used to direct neutrons and decay photons paths to the PI. The SDDR distribution in the PI was obtained over a superimposed 5 cm × 5 cm × 5 cm mesh. It was also calculated at six localized human-sized tallies—40 cm × 60 cm × 190 cm—placed at the TBM-PP—PF interface, along the maintenance corridor, and behind the BP.
Figure 14 shows a cut through the mid-plane of the TBM-PP, PF, and BP combined CAD model with tallies locations identified; 1 to 6 inside the red squares.
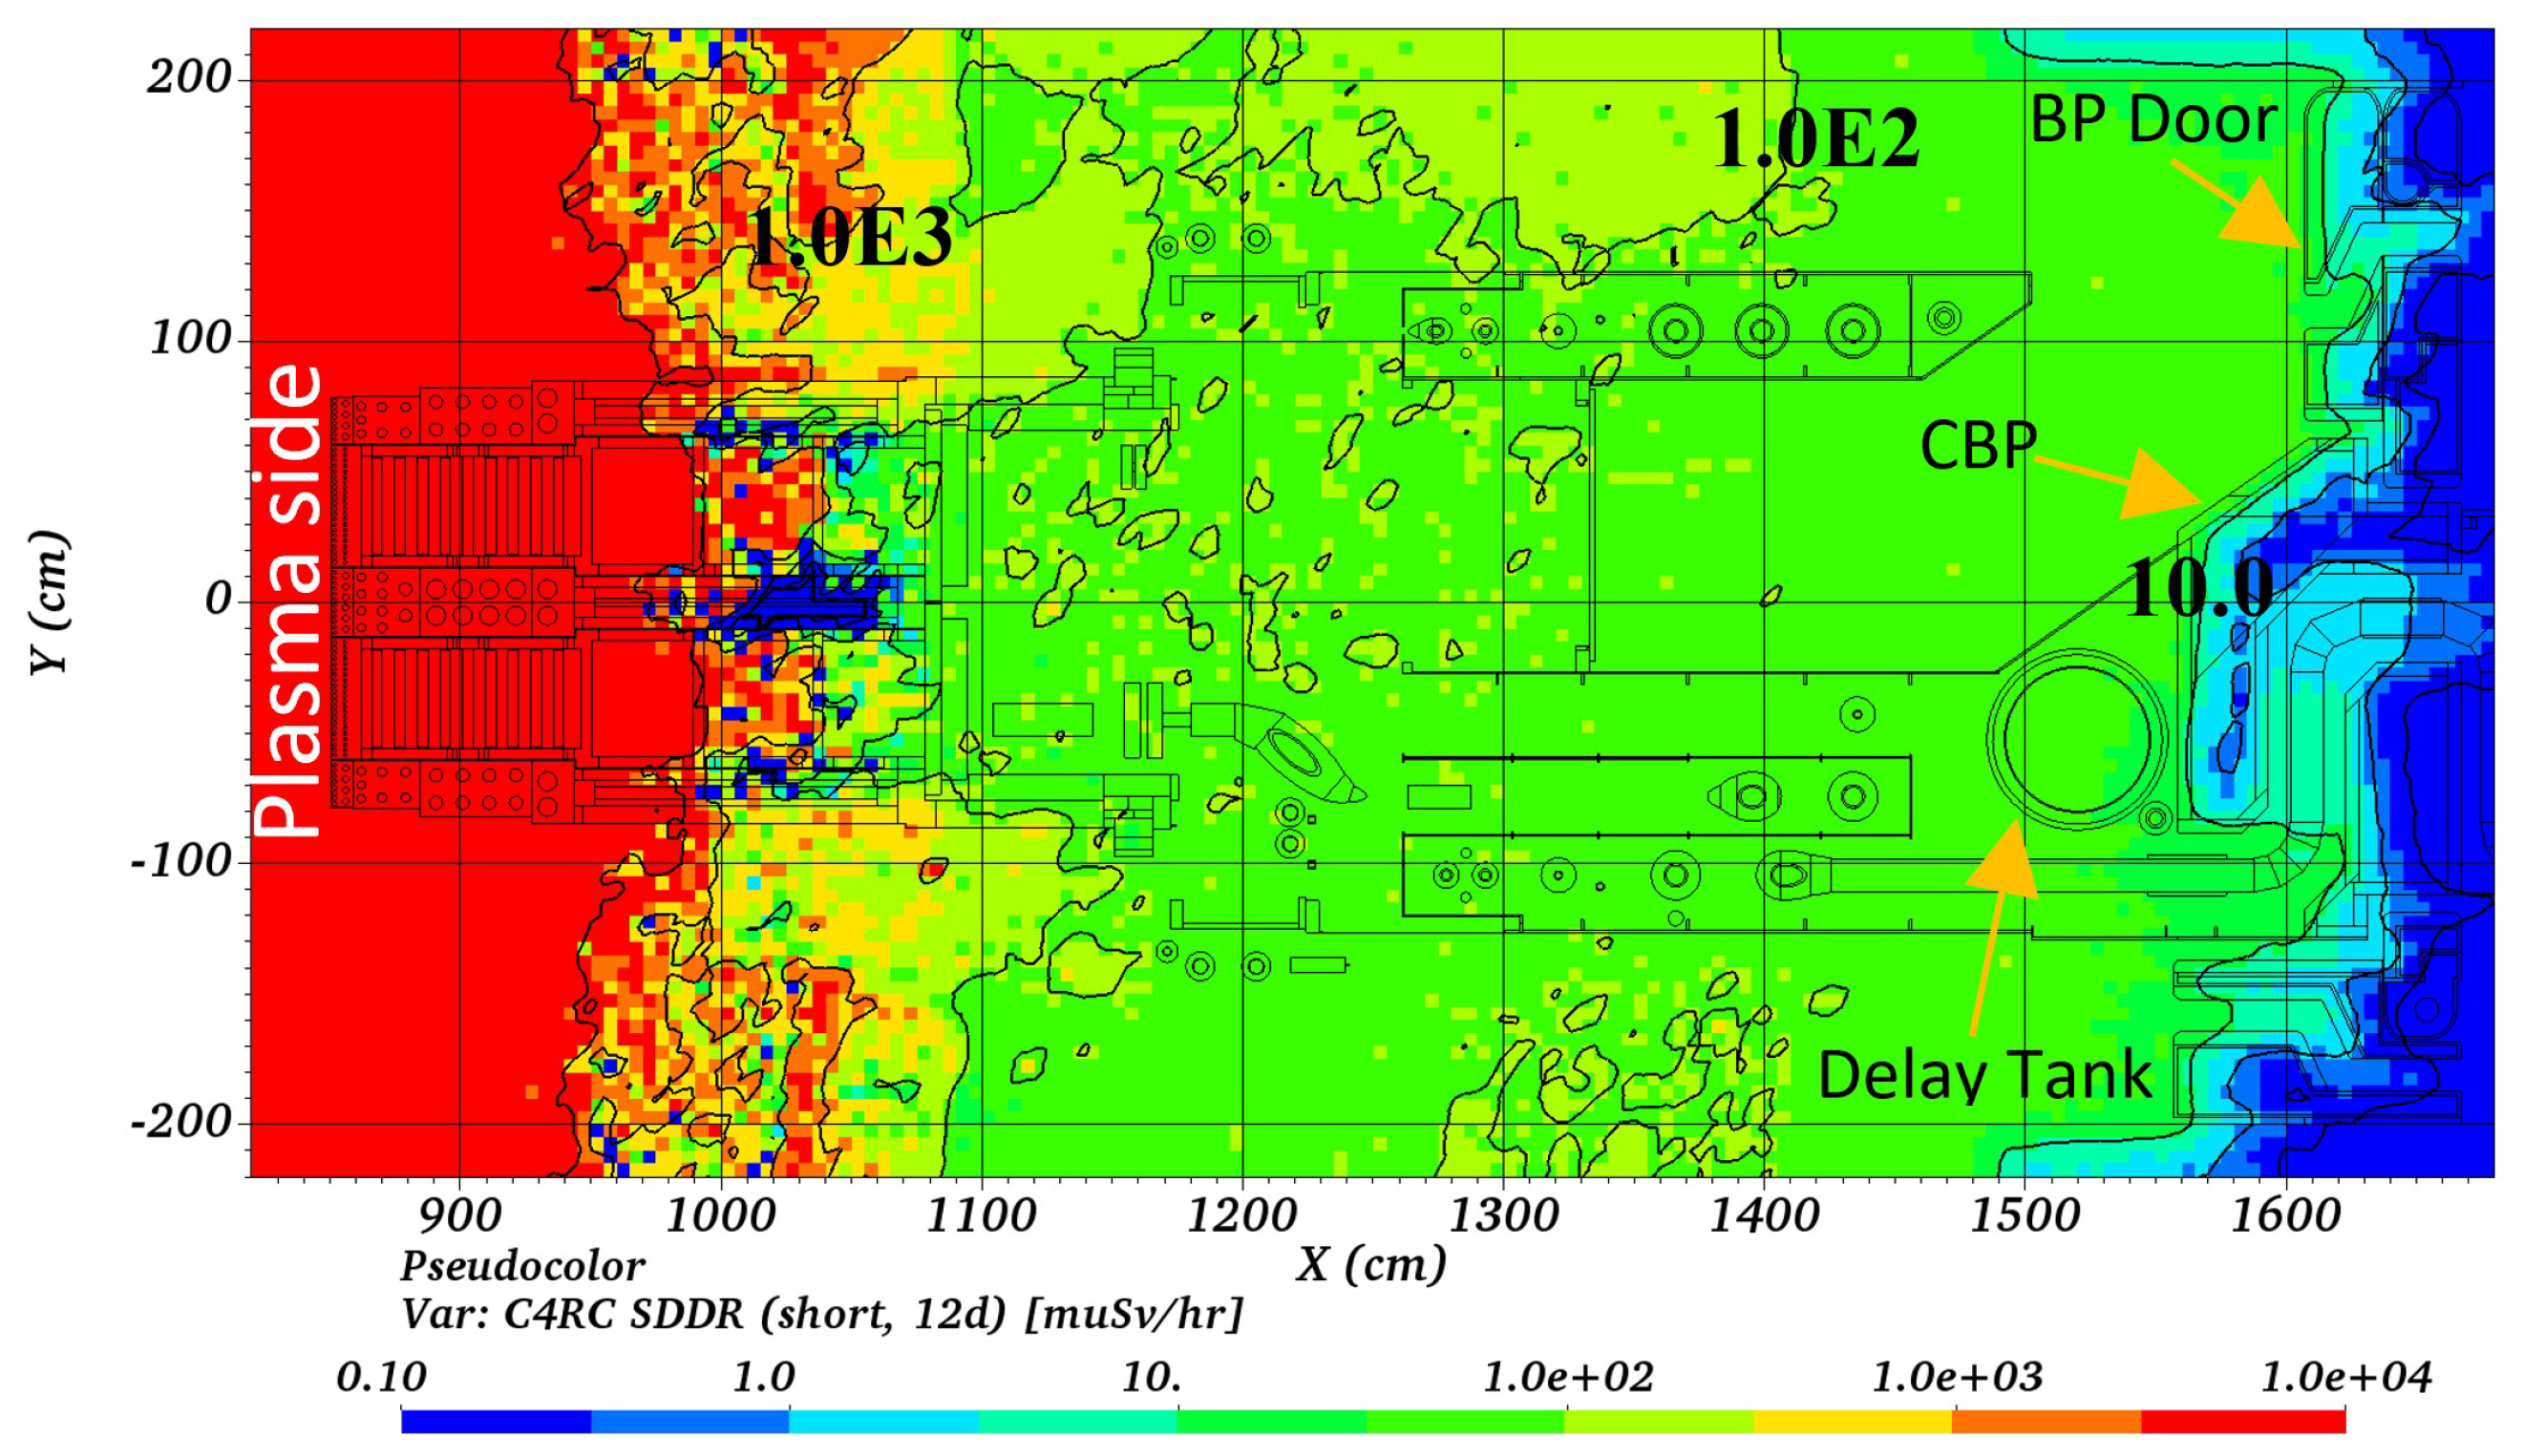
The SDDR was obtained for a 12 days of cooling time following the Short irradiation scenario using the baseline configuration, C4RC. A mapping of the SDDR is shown in
Figure 15 for a horizontal cross-section through EP no. 16 mid-plane. The MCNP Re in the PI is below 10%. It was found that the SDDR is less than 100
Sv/
in the PI, especially inside the maintenance corridor. As workers access in the maintenance corridor is foreseen, the SDDR was also obtained at the human-sized tallies, as listed in the C4RC column in
Table 3. At positions 1 and 2, the SDDR is high since those positions are exposed to the neutrons coming through the TBM-PP. Moving deeper inside the maintenance corridor, we see the PF shroud and the maintenance door provide some reduction in the neutrons from the TBM-PP and from neighboring ports as can be seen by the relatively lower SDDR levels at positions 3, 4, and 5.
The SDDR was also obtained for the two shielding options C4EI and C4RD, described in
Section 2.3 and
Section 3.3. In
Table 3, the efficacy of the external and internal PF shielding option—C4EI—is manifested in the reduction of the SDDR at all positions. At position 1 and 2, we see a reduction of ∼30% and 55%, respectively. This could be directly attributed to the flange and floor shielding panels. Inside the maintenance corridor—behind the door at positions 3, 4, and 5—we see higher reduction in the SDDR; ∼80%, 83% and 67%, respectively. This is the direct impact of the panels on the outside and inside of the PF shroud. If we consider the BP option—C4RD—we do not expect much of a change, if at all, except at position 5 and 6. This is due to the fact that the BP shielding impacts only the region behind the central BP and both positions 5 and 6 are located at the right BP door; away from the central BP where the shielding resides. The above results are then a direct attestation to the efficacy of the PF shielding option in reducing the SDDR in EP no. 16 and it supplement the conclusions from
Section 3.3.
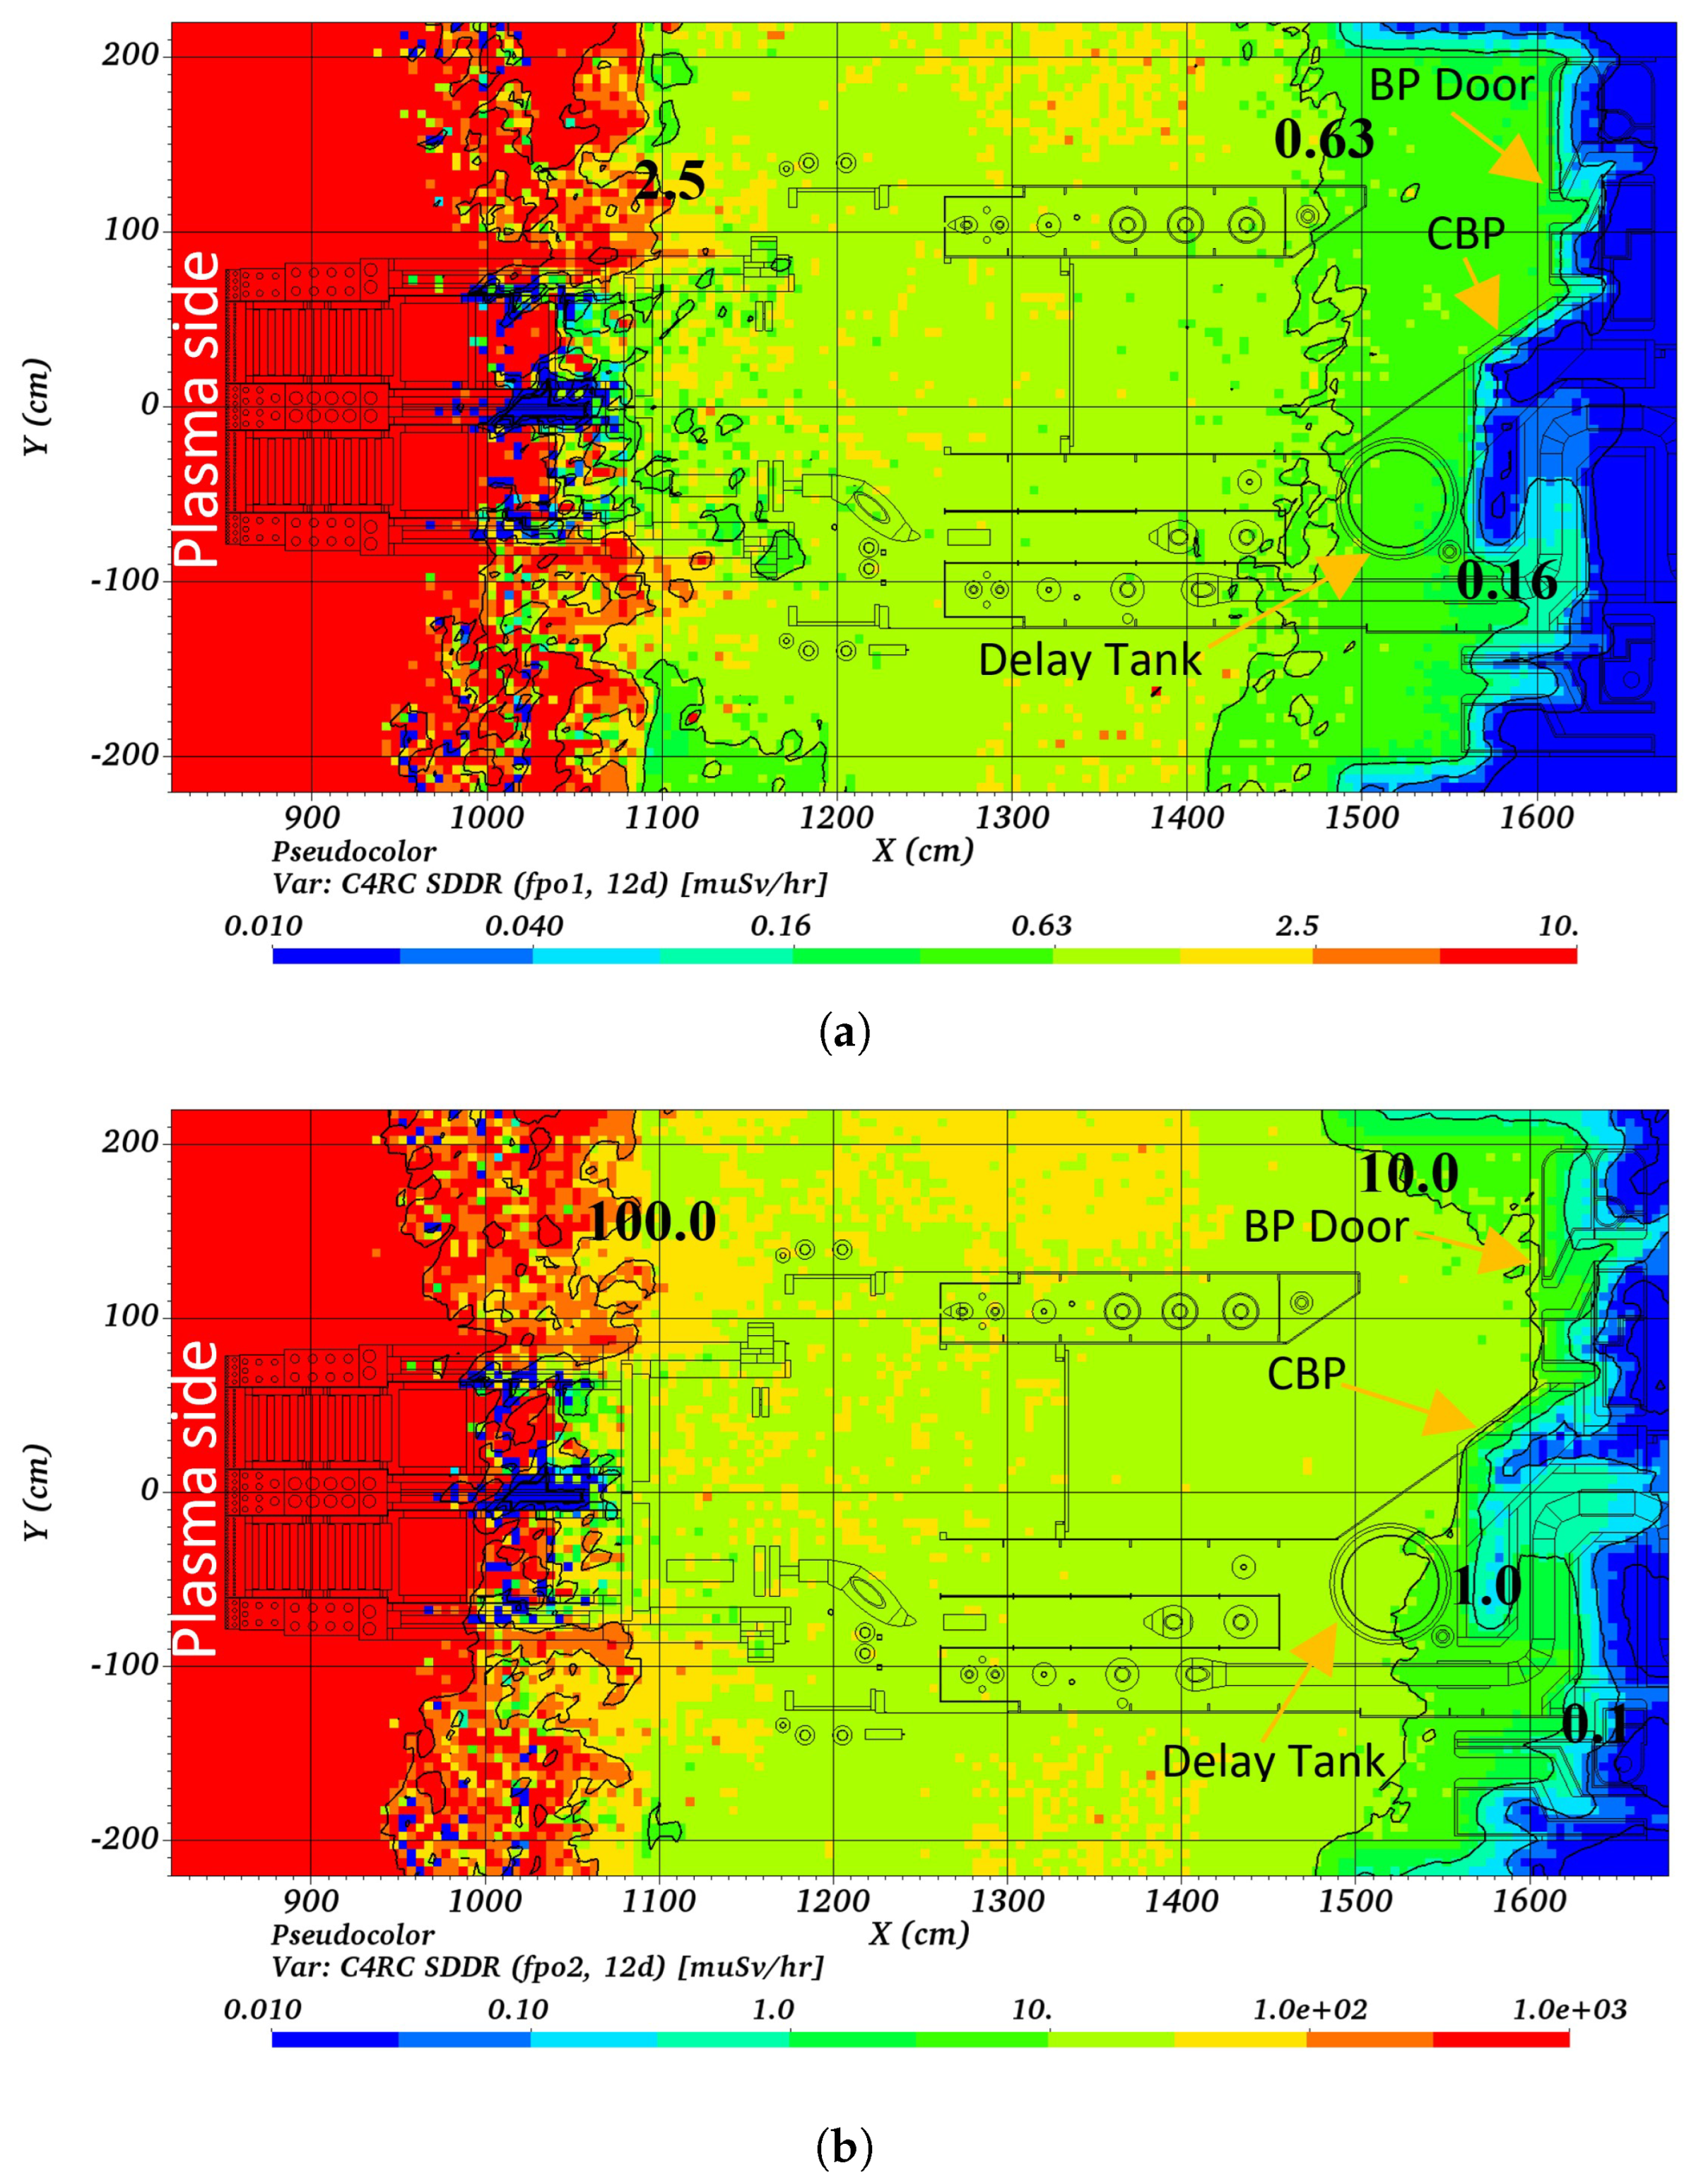
5.2.2. FPO1 and FPO2 Irradiation Scenarios
Motivated by the need for higher resolution SDDR maps that align with the operation campaigns, the SDDR was also obtained for the FPO1 and FPO2 scenarios.
Figure 16a shows a mapping of the SDDR at the EP no. 16 horizontal mid-plane at 12 days following the FPO1 scenario. Similar mapping for FPO2 is shown in
Figure 16b. Nuclear analyses for the different shielding options were also performed, the results of which are not presented in this paper, and a similar pattern in reduction of SDDR due to shielding was found as was the case for the Short scenario in
Section 5.2.1.
5.3. Residual Activated LiPb Source
In the 2021 analysis using the previous iteration of the PF and BP [
3], a detailed nuclear analysis of the contribution of a residual LiPb layer in the LiPb circuit after drainage was performed. While similar analyses were beyond the scope of the current analysis, an approximation to such contribution can be made for the baseline configuration—C4RC. It is imperative to keep in mind that the approximation to the LiPb contribution—to the SDDR in the PI—introduced below is just for scoping and does not necessarily reflect the final calculation of the SDDR contribution from residal LiPb in the PF. As a result, no safety or maintenance scheduling should be based off these estimations. By comparing the current global model C4RC—TBM-PP, PF, BP, and neighboring ports—with the previous baseline model C3RA [
3], it was deduced that the changes in the model were limited to the PF and BP. This meant that the TBM-PP and the neighboring port environment were unchanged. It is then a reasonable approximation to compare the SDDR at the six tally locations,
Figure 14, between C4RC and C3RA. By applying scaling factors—C4RC SDDR/C3RA SDDR—to the calculated SDDR due to a residual 0.1 mm LiPb layer at the tally locations in C3RA, the corresponding contributions can be calculated for C4RC. This again rests on the fact that the collective changes in the PF are reflected in the differences between the SDDR tally values between C3RA and C4RC.
Table 4 lists the contributions at the six tally locations in C4RC due to both the activated components, discussed in
Section 5.2, and the approximated contribution of a residual 0.1 mm layer of activated LiPb. The same conclusion derived in [
3] still holds for the current PF and BP design; the contribution due to a residual layer of LiPb after drainage should not be excluded from the overall estimation of SDDR in the PI. The total SDDR in the PI becomes larger than 100
Sv/
at the maintenance corridor up to the BP door.
6. Activation Analysis (Plasma-OFF Mode)
After functional usage, activated components have to be handled in the ITER Hot Cells or disposed of according to the regulatory Radioactive Waste (RW) classification. Hence, activation analyses to estimate the expected levels of activation and the provisional waste classification [
23] of the different components is integral to the design phase. In this paper, the nuclear inventory analysis code FISPACT-II [
24] was used along with the EAF2010 library. Activation calculations were performed for the baseline configuration C4RC using neutron spectra obtained at six different tally locations—constituting six radial divisions enveloping the TBM-PP, PF, and BP: TBM-PP was divided in the radial direction into three regions, the PF into two, and BP formed a single region. While parsing of the data provided by the nuclear analyses is still underway, it is important to give a glimpse of some of the key findings so far.
Considering the PF, results were obtained for the Short irradiation scenario—mentioned in
Section 5.1—that envelopes its operational life; the PF is to be replaced every Long Time Maintenance (LTM) and disposed of. The analysis results confirm that the total of the PF is classified as Type A—low level and short lived—RW, mainly due to the activation of the SS316L pipes and structures which constitute most of its mass, shown in
Figure 3a. However, the activation level of all thermal insulation and all PF parts closest to the BP is lower and would classify structures as TFA—very low level—RW. The results obtained for the PF activation after FPO1 and FPO2 irradiation scenarios—mentioned in
Section 5.1—show all PF to be classified as TFA RW. It is to be noted that the specific activities as calculated for C4RC are averaged over relatively large tally volumes—each radial division covers all of the area inside EP no. 16 up to the port walls in the toroidal and poloidal directions—and results of previous analysis, C3RA in [
3], are to be used for the RW classification for the parts after disassembly.
In addition to the RW classification determined by the specific activity and the RadioNuclides (RN) as listed in the IRAS criteria [
23], the total activity of RNs and masses of the PF parts are input for all handling processes of the PF in the ITER facility, and contribute to the source terms of the ITER safety demonstrations. Additional handling and RW considerations concern the level of tritium contamination due to the tritiated process fluid flows and the PF exposure to tritiated air atmosphere. Their impact is not discussed here, but is to be refined in the next step in the nuclear analyses.
7. Conclusions
In this paper, the current status of the evolution of the TBM-PP, PF, and BP was discussed. The analysis work started with developing the radiation transport models from CAD for the evolved design of the PF using the automatic conversion code McCAD. Along with models of the TBM-PP (with two Dummy-TBMs) and the BP, the PF model was integrated into EP no. 16 in a global Tokamak model with a proper representation of the neighboring port environment in ITER. The evolution to the PF design included an update of the PF shroud, routing of pipes in compliance with flexibility analysis requirements, a more detailed DT, and a revised central BP to match the evolution of the peripheral BP. On the BP side, the peripheral part has been revised by including more details in the door hinges, ventilation openings lined with shielding panels, and a revised permanent central part that addresses reducing neutron streaming while complying with the HVAC requirements.
The nuclear analysis revolved around two modes of operation: plasma-on and -off. Three configurations were considered: a baseline configuration (C4RC), a shielded PF configuration (C4EI), and a shielded BP configuration (C4RD). For the plasma-on mode, the neutron environment in the EP no. 16 was assessed. Fusion neutrons in the PI were found to be lower than 1 × 10⁸ n/cm2/s behind the maintenance door all the way up to the BP. PF shielding options proved efficient in reducing the neutron flux by about ∼80% behind the maintenance door and by ∼40% to 80% broadly in the PI. The impact of the BP shielding option was limited to the area behind the central BP, where a reduction of ∼80% was found. Two materials were tested as candidates for the BP shielding option, B4C (2.52 g cm−3) and Borated Silicone (1.59 g cm−3). The latter showed an increased reduction in the neutron flux over the former, so it is advised to match the BP along the pipe pass with that in the peripheral BP material.
The decay neutrons environment in PI from activated 17N was also assessed. The new design of the DT with two inlet pipes reduces the flow speed and achieves a 33 s residence time. This is beneficial for the PC as less activated water will be crossing the BP. The neutron flux in the PI was found to be less than 1 × 10⁵ n/cm2/s, but it goes up to 1 × 10⁶ n/cm2/s inside the tank. The neutron flux from both fusion and 17N decay neutrons was found to be lower than the limit imposed by the RadMaps behind the BP, 1 × 10⁴ n/cm/s.
For plasma-off mode, the SDDR due to activated components in the PI was assessed. For the baseline configuration (C4RC), the SDDR was found to be less than 100, 100, and 1 Sv/h at 12 days following the Short, FPO1, and FPO2 scenarios, respectively. The PF shielding options shows an efficacy in reducing the SDDR by at least 30% at the PF and TBM-PP interface and 60% for the maintenance corridor area behind the door all that way up to the BP door. An approximation to the contribution from a residual mm layer of LiPb was estimated to be about 50% that of activated components, raising the SDDR in the PI to above 100 Sv/h.
Activation analyses following the Short irradiation scenario—which encapsulates the life time of the PF—were performed and confirmed provisionally that the bulk of the PF is classified as type A—low level—RW mainly due to SS316L activation in the structures and piping system. The thermal insulation of pipes and parts of the PF structure closest to the BP experience even lower levels of activation and would be classified as type TFA—very low level—RW. Further analyses are still underway to extend the obtained results to the individual components level.
The full suite of nuclear analyses discussed in the paper along with the previous analysis in [
3] lead to the initial approval of the current design in the Preliminary Design Review (PDR) meeting that took place earlier this year. It then ushers the way for the TBM-PP, PF, and BP designs to mature through the upcoming phase of the final design.
Author Contributions
Writing—original draft preparation, M.H., D.L., B.-Y.K., J.-P.M., E.P., J.S. and J.G.v.d.L.; writing—review and editing, M.H., D.L., B.-Y.K., J.-P.M., E.P., J.S. and J.G.v.d.L.; supervision, D.L. and B.-Y.K.; project administration, D.L. and B.-Y.K. All authors have read and agreed to the published version of the manuscript.
Funding
This work was funded by the ITER Organization (IO) under contract IO/19/CT/4300001953. The views and opinions expressed herein do not necessarily reflect those of IO.
Data Availability Statement
Data supporting the current analysis is a property of ITER Organization (IO) and can only be obtained through after approval. For inquiry and requests please contact
[email protected].
Acknowledgments
This work was carried out using an adaption of the C-model, which was developed as a collaborative effort between: AMEC Co (International), CCFE (UK), ENEA Frascati (Italy), FDS Team of INEST (PRC), ITER Organization (France), QST (Japan), KIT (Germany), UNED (Spain), University of Wisconsin-Madison (USA), and F4E (Europe).
Conflicts of Interest
The authors declare no conflict of interest.
References
- Giancarli, L.M.; Ahn, M.Y.; Bonnett, I.; Boyer, C.; Chaudhuri, P.; Davis, W.; Dell’Orco, G.; Iseli, M.; Michling, R.; Neviere, J.C.; et al. ITER TBM Program and associated system engineering. Fusion Eng. Des. 2018, 136, 815–821. [Google Scholar] [CrossRef]
- Leichtle, D.; Weinhorst, B.; Travleev, A.; Lu, L.; Fischer, U.; Kim, B.Y.; van der Laan, J. Progress in nuclear analyses of the ITER TBM Port Plug with Dummy TBMs. Fusion Eng. Des. 2019, 146, 1574. [Google Scholar] [CrossRef] [Green Version]
- Harb, M.; Leichtle, D.; Kim, B.Y.; Martins, J.P.; van der Laan, J.G.; Bergman, J.; Polunovskiy, E.; Serikov, A. Scoping Nuclear Analyses of Shielding Options and Shutdown Dose Rate Contributions in ITER TBSs. Fusion Sci. Technol. 2022, 1–15. [Google Scholar] [CrossRef]
- X-5 Monte Carlo Team. MCNPTM—A General Monte Carlo N-Particle Transport; Code Overview and Theory Version 5 Vol. I; Report LAUR-03-1987; Los Alamos National Laboratory: Los Alamos, NM, USA, 2003. [Google Scholar]
- Lu, L.; Fischer, U.; Pereslavtsev, P. Improved algorithms and advanced features of the CAD to MC conversion tool McCAD. Fusion Eng. Des. 2014, 89, 1885–1888. [Google Scholar] [CrossRef]
- Harb, M.; Wegmann, C.; Fischer, U. McCAD v1.0L An Improved CAD to MCNP Interface Library. Trans. Am. Nucl. Soc. 2020, 122, 613–616. [Google Scholar]
- McCAD-Library v1.0. 2022. Available online: https://github.com/inr-kit/McCAD-Library (accessed on 30 June 2022).
- ANSYSTM. SpaceClaim 2022 R1. 2022. Available online: https://www.ansys.com/products/3d-design/ansys-spaceclaim (accessed on 30 June 2022).
- Polunovskiy, E. Scoping Nuclear Analysis for CDR Design of BSP EP16, IDM Ref. 4T977V; Internal Document; ITER Organization (IO): Saint-Paul-lez-Durance, France, 2021. [Google Scholar]
- Leichtle, D.; Colling, B.; Fabbri, M.; Juarez, R.; Loughlin, M.; Pampin, R.; Polunovskiy, E.; Serikov, A.; Turner, A.; Bertalot, L. The ITER tokamak neutronics reference model C-Model. Fusion Eng. Des. 2018, 136, 742. [Google Scholar] [CrossRef]
- Polunovskiy, E. C-Model R181031 Model Document, IDM ref. XETSWC; Internal Document; ITER Organization (IO): Saint-Paul-lez-Durance, France, 2019. [Google Scholar]
- Sauvan, P.; (Universidad Nacional de Educación a Distancia, Madrid, Spain). Generic C-Model with Integrated Neighboring Ports of EP 16. Personal Communication, 2019. [Google Scholar]
- Sauvan, P.; Juárez, R.; Pedroche, G.; Alguacil, J.; Catalan, J.P.; Ogando, F.; Sanz, J. D1SUNED system for the determination of decay photon related quantities. Fusion Eng. Des. 2020, 151, 111399. [Google Scholar] [CrossRef]
- Iannone, F.; Bracco, G.; Cavazzoni, C.; Coelho, R.; Coster, D.; Hoenen, O.; Maslennikov, A.; Migliori, S.; Owsiak, M.; Quintiliani, A.; et al. MARCONI-FUSION: The new high performance computing facility for European nuclear fusion modelling. Fusion Eng. Des. 2017, 129, 354–358. [Google Scholar] [CrossRef] [Green Version]
- MARCONI Super Computer in CINECA. Available online: https://wiki.u-gov.it/confluence/display/SCAIUS/HPC+User+Guide (accessed on 30 June 2022).
- Mosher, S.W.; Johnson, S.R.; Bevill, A.M.; Ibrahim, A.M.; Daily, C.R.; Evans, T.M.; Wagner, J.C.; Johnson, J.O.; Grove, R.E. ADVANTG—An Automated Variance Reduction Parameter Generator; ORNL/TM-2103/416; Oak Ridge National Laboratory: Oak Ridge, TN, USA, 2013. [Google Scholar]
- van der Laan, J.; (ITER Organization (IO), Saint-Paul-lez-Durance, France). Average Production Rates of Nitrogen Isotopes in the TBM-PP. Personal Communication, 2019. [Google Scholar]
- ANSYSTM Fluent 2022 R1. 2021. Available online: https://www.ansys.com/products/fluids/ansys-fluent (accessed on 30 June 2022).
- Taylor, N. EXP-283-T7 Review of ITER Irradiation Scenario and Pre-DT Radiation Conditions, IDM Ref. 2KL7XA; Fusion for Energy (F4E) Internal Document: Barcelona, Spain, 2020. [Google Scholar]
- van der Laan, J. Short Scenario for PBS-56 Nuclear Analyses, IDM ref. VDY96F; ITER Organization (IO) Internal Document: Saint-Paul-lez-Durance, France, 2017. [Google Scholar]
- Valenza, D.; Iida, H.; Plenteda, R.; Santoro, R.T. Proposal of shutdown dose estimation method by Monte Carlo code. Fusion Eng. Des. 2001, 55, 411–418. [Google Scholar] [CrossRef]
- Conversion Coefficients for Use in Radiological Protection against External Radiation; ICRP Publication 74, No. 3/4, 26; Elsevier: New York, NY, USA, 1996.
- van der Laan, J.; (ITER Organization (IO), Saint-Paul-lez-Durance, France). Provisional Waste Classification and IRAS Parameter Calculation Criteria. Personal Communication, 2019. [Google Scholar]
- Sublet, J.C.; Eastwood, J.W.; Morgan, J.G.; Gilbert, M.R.; Fleming, M.; Arter, W. FISPACT-II: An Advanced Simulation System for Activation, Transmutation and Material Modelling. Nucl. Data Sheets 2017, 139, 77–137. [Google Scholar] [CrossRef]
Figure 1.
PF and BP Evolution through 2018 [
2] (
Left), 2019 [
3] (
Middle), and 2021 (
Right).
Figure 1.
PF and BP Evolution through 2018 [
2] (
Left), 2019 [
3] (
Middle), and 2021 (
Right).
Figure 2.
CAD model of the TBM-PP.
Figure 2.
CAD model of the TBM-PP.
Figure 3.
(a) CAD Model of the TBM-PP and PF with exposed internals in (b,c).
Figure 3.
(a) CAD Model of the TBM-PP and PF with exposed internals in (b,c).
Figure 5.
Integrated PF, BP, and TBM-PP into C-Model.
Figure 5.
Integrated PF, BP, and TBM-PP into C-Model.
Figure 6.
(a) C4RC Total Neutron Flux [n/cm/s] and (b) MCNP Relative Error in PI.
Figure 6.
(a) C4RC Total Neutron Flux [n/cm/s] and (b) MCNP Relative Error in PI.
Figure 7.
Relative neutron flux reduction in PI due to (a) PF (C4EI) and (b) BP (C4RD) shielding.
Figure 7.
Relative neutron flux reduction in PI due to (a) PF (C4EI) and (b) BP (C4RD) shielding.
Figure 8.
(a) C4RC total neutron flux [n/cm/s] behind the BP, (b) relative decrease in comparison to previous design, and (c) C4RD total neutron flux [n/cm/s] behind the BP.
Figure 8.
(a) C4RC total neutron flux [n/cm/s] behind the BP, (b) relative decrease in comparison to previous design, and (c) C4RD total neutron flux [n/cm/s] behind the BP.
Figure 9.
BP tallies [
3].
Figure 9.
BP tallies [
3].
Figure 10.
17N Activities [Bq cm] in pipe segments.
Figure 10.
17N Activities [Bq cm] in pipe segments.
Figure 11.
Velocity profile of activated water inside the delay tank.
Figure 11.
Velocity profile of activated water inside the delay tank.
Figure 12.
17N Activity [Bq cm] in water inside the delay tank.
Figure 12.
17N Activity [Bq cm] in water inside the delay tank.
Figure 13.
(a) C4RDV 17N total neutron flux [n/cm/s] in PI and (b) through the delay tank.
Figure 13.
(a) C4RDV 17N total neutron flux [n/cm/s] in PI and (b) through the delay tank.
Figure 14.
Human-sized and BP tallies.
Figure 14.
Human-sized and BP tallies.
Figure 15.
SDDR [Sv/h] for the baseline configuration (C4RC) at 12 days following Short scenario.
Figure 15.
SDDR [Sv/h] for the baseline configuration (C4RC) at 12 days following Short scenario.
Figure 16.
SDDR [Sv/h] for the baseline configuration (C4RC) at 12 days following (a) FPO1 and (b) FPO2 scenarios.
Figure 16.
SDDR [Sv/h] for the baseline configuration (C4RC) at 12 days following (a) FPO1 and (b) FPO2 scenarios.
Table 1.
Total neutron flux [n/cm/s] (MCNP relative error) in BP tallies.
Table 1.
Total neutron flux [n/cm/s] (MCNP relative error) in BP tallies.
| | Central behind BP | Peripheral behind BP | Full-Extent behind BP |
|---|
| C4RC | 4.65 × 10⁴ (0.01) | 1.85 × 10⁴ (0.08) | 3.54 × 10⁴ (0.01) |
| C4EI | 2.45 × 10⁴ (0.01) | 1.18 × 10⁴ (0.06) | 1.95 × 10⁴ (0.01) |
| C4EI Reduction Relative to C4RC [%] | 47.29 | 36.27 | 45.01 |
| C4RD | 1.72 × 10⁴ (0.01) | 1.41 × 10⁴ (0.06) | 1.59 × 10⁴ (0.01) |
| C4RD Reduction Relative to C4RC [%] | 63.09 | 23.98 | 55.02 |
| C4RDV | 1.66 × 10⁴ (0.01) | 1.37 × 10⁴ (0.02) | 1.55 × 10⁴ (0.01) |
| C4RDV Reduction Relative to C4RD [%] | 3.13 | 2.74 | 3.00 |
Table 2.
Total neutron flux [n/cm/s] (MCNP relative error) in BP tallies (Plasma + 17N).
Table 2.
Total neutron flux [n/cm/s] (MCNP relative error) in BP tallies (Plasma + 17N).
| | Central behind BP | Peripheral behind BP | Full-Extent behind BP |
|---|
| Plasma | 1.66 × 10⁴ (0.0100) | 1.37 × 10⁴ (0.0200) | 1.55 × 10⁴ (0.0100) |
| 17N | 2.61 × 10⁴ (0.0001) | 8.27 × 10³ (0.0001) | 1.91 × 10⁴ (0.0001) |
| Sum | 4.27 × 10⁴ (0.0030) | 2.19 × 10⁴ (0.0140) | 3.46 × 10⁴ (0.0003) |
Table 3.
SDDR [Sv/h] (MCNP relative error) at 12 days following Short scenario.
Table 3.
SDDR [Sv/h] (MCNP relative error) at 12 days following Short scenario.
| Tally No. | C4RC | C4EI | C4RD |
|---|
| 1 | 85.59 (0.02) | 58.89 (0.03) | 87.32 (0.02) |
| 2 | 91.34 (0.01) | 39.63 (0.02) | 93.37 (0.01) |
| 3 | 79.38 (0.01) | 15.51 (0.02) | 79.49 (0.01) |
| 4 | 61.19 (0.02) | 10.39 (0.02) | 60.35 (0.01) |
| 5 | 36.92 (0.01) | 11.68 (0.02) | 35.78 (0.01) |
| 6 | 00.04 (0.06) | 00.02 (0.07) | 00.03 (0.03) |
Table 4.
Breakdown of C4RC SDDR [Sv/h] (calculated relative error) at 12 days following Short scenario.
Table 4.
Breakdown of C4RC SDDR [Sv/h] (calculated relative error) at 12 days following Short scenario.
| Position | 1 | 2 | 3 | 4 | 5 | 6 |
|---|
| Activated Components | 85.59 (0.02) | 91.34 (0.01) | 79.38 (0.01) | 61.19 (0.02) | 35.92 (0.01) | 00.04 (0.06) |
| Residual Activated 0.1 mm LiPb Layer | 48.06 (0.001) | 32.25 (0.001) | 35.22 (0.001) | 57.91 (0.001) | 31.91 (0.001) | 24.20 (0.001) |
| Sum | 133.66 (0.02) | 123.59 (0.01) | 114.60 (0.01) | 119.10 (0.02) | 67.82 (0.01) | 24.24 (0.06) |
| Disclaimer/Publisher’s Note: The statements, opinions and data contained in all publications are solely those of the individual author(s) and contributor(s) and not of MDPI and/or the editor(s). MDPI and/or the editor(s) disclaim responsibility for any injury to people or property resulting from any ideas, methods, instructions or products referred to in the content. |
© 2022 by the authors. Licensee MDPI, Basel, Switzerland. This article is an open access article distributed under the terms and conditions of the Creative Commons Attribution (CC BY) license (https://creativecommons.org/licenses/by/4.0/).


 ,
, 


