1. Introduction and Objectives
The research and development of the fusion breeding blanket (BB) in the EU are conducted by the ITER EU test blanket module (TBM) program and the DEMO work package breeding blanket (WPBB) program. These two programs are currently focusing their R&D activities on the two most promising BB concepts, namely the helium-cooled pebble bed (HCPB) and the water-cooled lithium lead (WCLL). The early (2008–2015) design [
1] of the European HCPB blanket features a breeding unit (BU) in the shape of a rectangular cuboid bounded at the sides by the stiffening-grid plates and at the front by the first wall that faces the fusion plasma. The breeder zone was placed in the middle part of the BU and contained between two U-shaped cooling plates. The cooling plates of both the stiffening grid and the breeding zone have a complex flow pattern and small cooling channels, leading to a large pressure drop and hence a large circulating power for the coolant, in addition to a lower efficiency of the power plant. To solve this problem and other issues, a new design of the BU (namely fuel-breeder pin) was introduced by the design team of the HCPB BB at the Karlsruhe Institute of Technology (KIT) in 2018. In the new design [
2], the breeding zone is confined by the first wall and the back plate and has a hexagonal layout of several pressure tubes (with inner diameter of 70 mm and thickness of 4 mm) connecting the first wall with the back plate in the radial direction. The fuel-breeder pins are inserted concentrically into the pressure tubes and also connected to the back plate. Each fuel-breeder pin has two concentric cylindrical claddings, namely the outer cladding (with inner diameter of 60 mm and thickness of 3 mm) and the inner cladding (with inner diameter of 16 mm and thickness of 6 mm). The volume between the two claddings is filled with the tritium breeder material (the biphasic lithium ceramic such as lithium ortho-silicate Li
4SiO
4 and lithium meta-titanate Li
2TiO
3) in form of a packed bed of pebbles. The coolant helium flows radially through the inner cladding and then makes a U-turn and flows into the annular cooling channel (gap between the outer cladding and the pressure tube). The associated analyses indicated that the fuel-breeder pin design has a pressure drop significantly lower than that produced by the previous BU design. More details about the design of the new HCPB breeding blanket and its fuel-breeder pin can be found in references [
3,
4].
Then, the next step was the decision to design and build a mock-up (MU) [
3] of the fuel-breeder pin for experimental investigation in order to address some key issues, the first of which was to investigate the heat transfer characteristics of the coolant annular gap under the HCPB operating conditions. In particular, the Reynolds numbers of this fuel-breeder pin place its coolant flow in the transitional regime between laminar and turbulent regimes. The past analyses found a high sensitivity of the results on the correlations used for this transitional regime. Second, further analyses such as stress analysis or behavior of the blanket under transient conditions would require reliable heat transfer correlations. Third, we wanted to study the possibility of enhancing the heat transfer of the annular gap by increasing its surface roughness. Afterwards, it was decided to test the fuel-breeder pin MU in the Helium Loop Karlsruhe (HELOKA) facility that can provide the relevant HCPB operating conditions (i.e., using helium at 300 °C temperature and 8 MPa pressure as a coolant for the pin MU).
The objectives of the present paper are: (i) integrating the pin MU into the HELOKA helium loop and building its experimental set-up with the required measurements and instrumentation, (ii) experimental testing of the pin MU under the relevant HCPB operating conditions, and (iii) using the experimental results to calculate the Nusselt numbers and make a comparison with the available Nusselt number correlations.
The contents of this paper are presented in the following sections as follows: (i) mock-up and experimental testing conditions including the test matrix, (ii) the experimental set-up that includes the mock-up manufacturing and integration in addition to the measurements and instrumentation, (iii) section of the experimental results that includes data processing and comparison with the correlations of Nusselt number, and then finally (iv) the paper is concluded with the conclusions.
2. Mock-Up and Experimental Testing Conditions
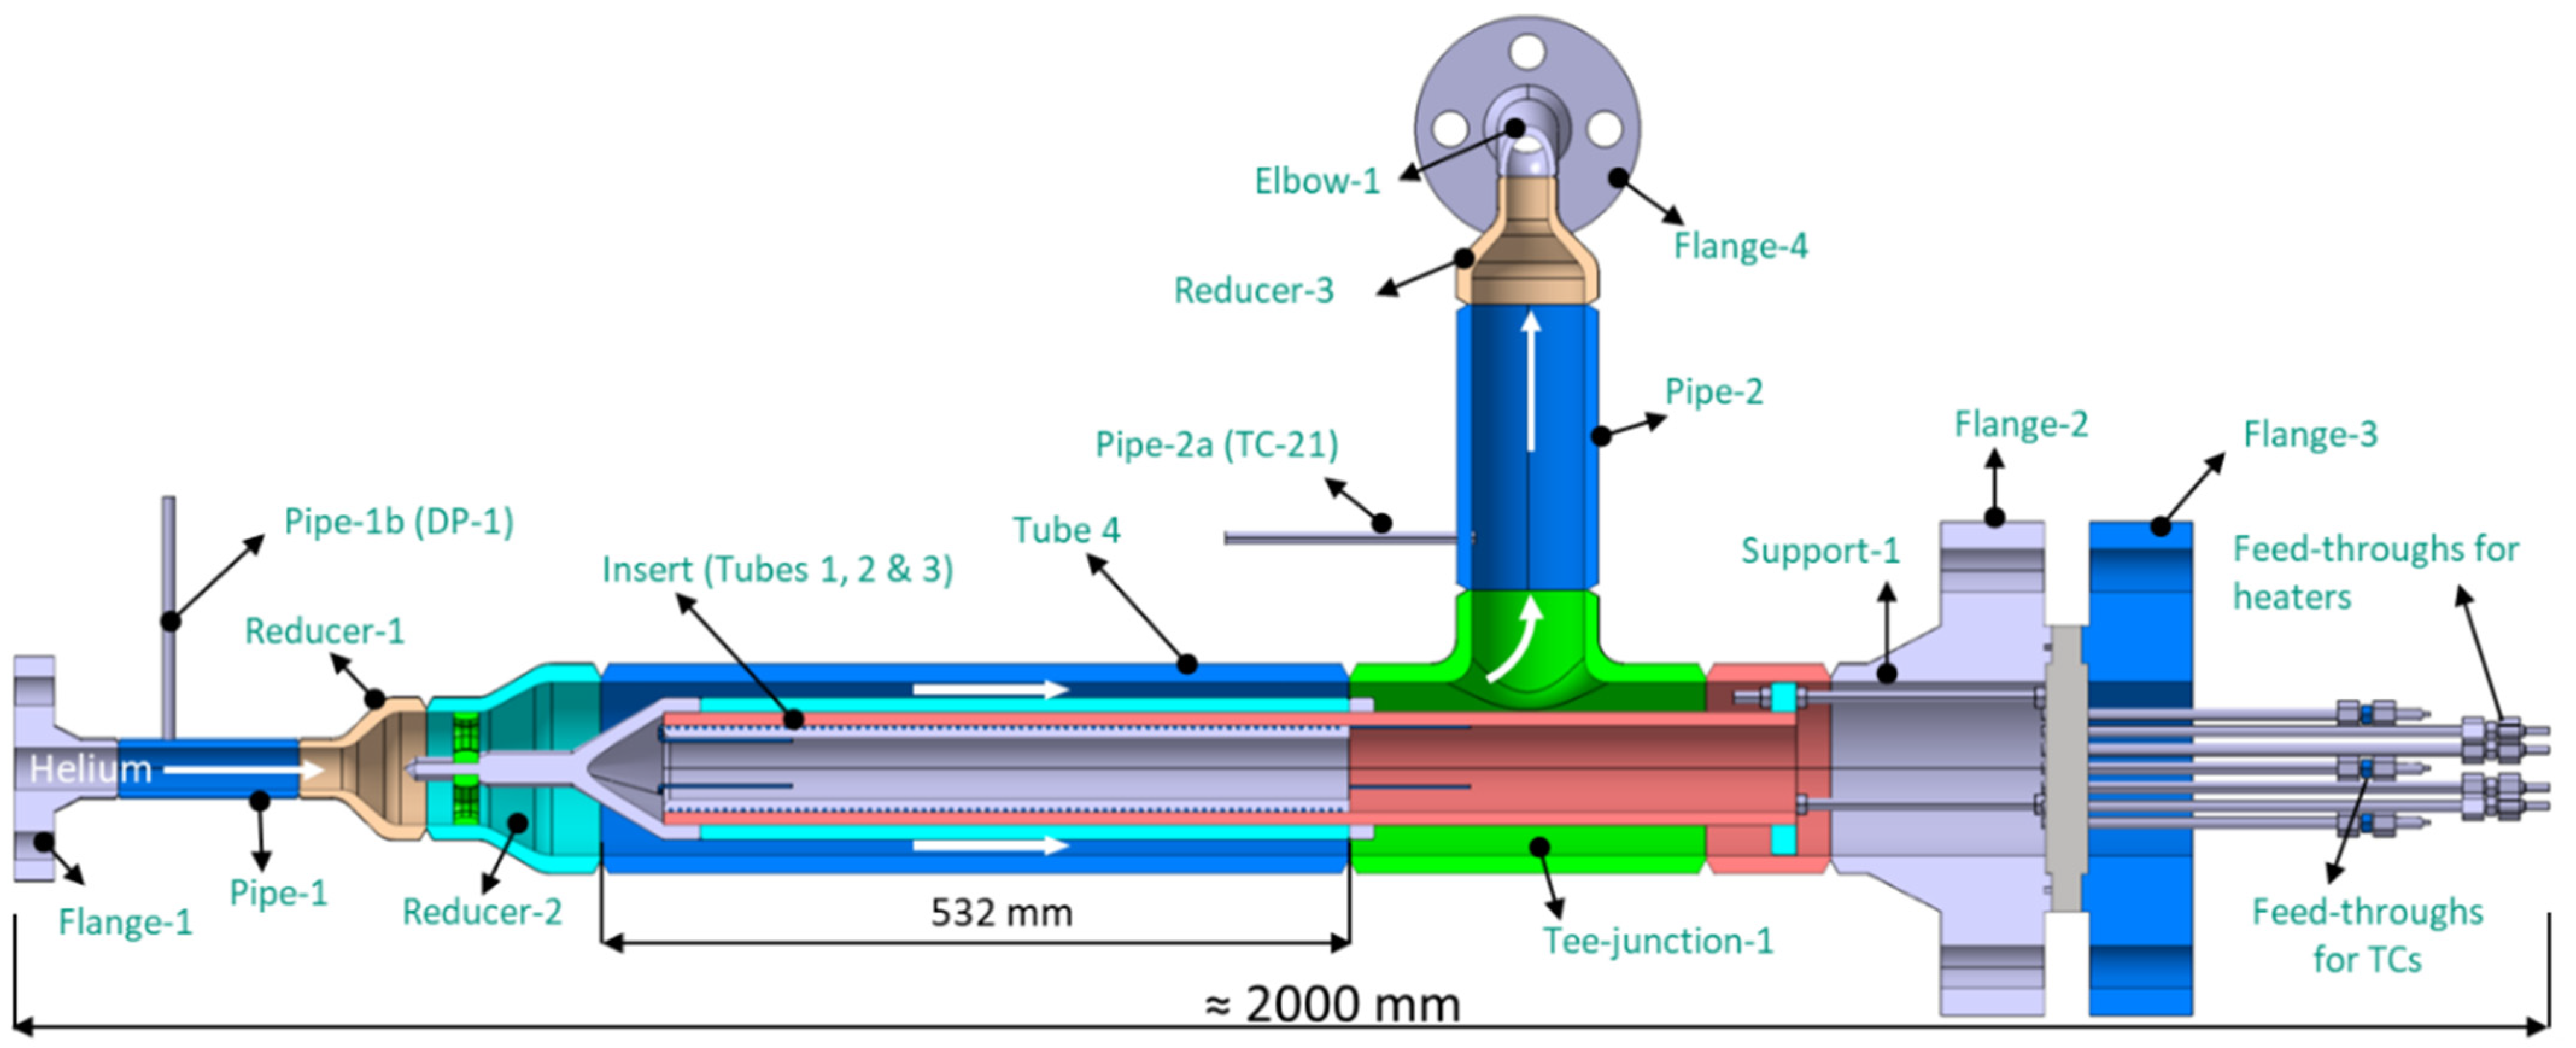
Figure 1 shows the CAD design of the pin MU. The MU was designed in a way that simulates the two fuel-breeder pin features: (i) annular gap for the coolant, and (ii) internal heating to simulate the BU heating. The MU consists mainly of four concentric tubes. Tube-1 and Tube-2 are made to enclose the required heaters while Tube-3 and Tube-4 are arranged to form the annular gap (15 mm) for the flowing coolant (helium). Tube-1 was manufactured with spiral grooves in order to accommodate the three coiled wire-form electric heaters. Tube-2 surrounds Tube-1 in a way such that it completes the assembly in a sandwich form; see
Figure 1. Tube-3 surrounds Tube-2 and is attached to it using tack welding, which allows the exchange of Tube-3. The surface roughness of the outer surface of Tube-3 is the parameter of interest to enhance the heat transfer; therefore, there are three different versions of Tube-3 with different levels of surface roughness. The assembly of the three concentric tubes 1, 2, and 3 together is called the insert. Tube-4 is part of the outer pressure vessel that contains everything and is designed to withstand a pressure up to 90 bar. Reduced activation ferritic–martensitic (RAFM) steel such as Eurofer is used as a structural material for the HCPB blanket; however, stainless steel 316L is used in the manufacturing of this mock-up for two reasons: (i) to reduce the total cost, because stainless steel 316L is cheaper than the expensive Eurofer steel, and (ii) this material change has no impact on the experimental results, which focus on the heat transfer and the Nusselt number. The relevant difference is the different thermal conductivities of both steels, but the experimental results are based on reaching a steady state; therefore, the impact is very small.
In the fuel-breeder pin of HCPB blanket, there is a stagnant helium gas gap between the beryllide Be
12Ti (as a neutron multiplier material) block and its corresponding pressure tube, which limits the heat transfer from the beryllide block to the tube. Therefore, the heat flux to the outer surface of the annular channel is comparably lower (about 10 times lower) than that of the inner surface. To simplify the assembly and exchanging of the mock-up inserts, only the inner side of the annular channel is heated. This simplification was considered to not affect the testing relevancy. Three electrical heaters are used to heat up the mock-up; each heater has a maximal power of 2 kW. It was calculated that the maximum required heating for this mock-up is 4 kW. The three heaters are in operation, but each one operates with reduced power in order to optimize their lifetime. The starts and ends of the heaters’ cables are routed out through six feedthroughs. Three power supplies are used to supply and control the electricity for the three heaters. The inlet pipe-1 has two small pipes: one to install a thermocouple and one as a pressure tap for a differential pressure sensor. Similarly, the outlet pipe-2 has two small pipes for another thermocouple and as a pressure tap for the same differential pressure sensor. Flange-2 and flange-3 allow: (i) the exchange of the insert, and (ii) closing the mock-up main body at the right end; see
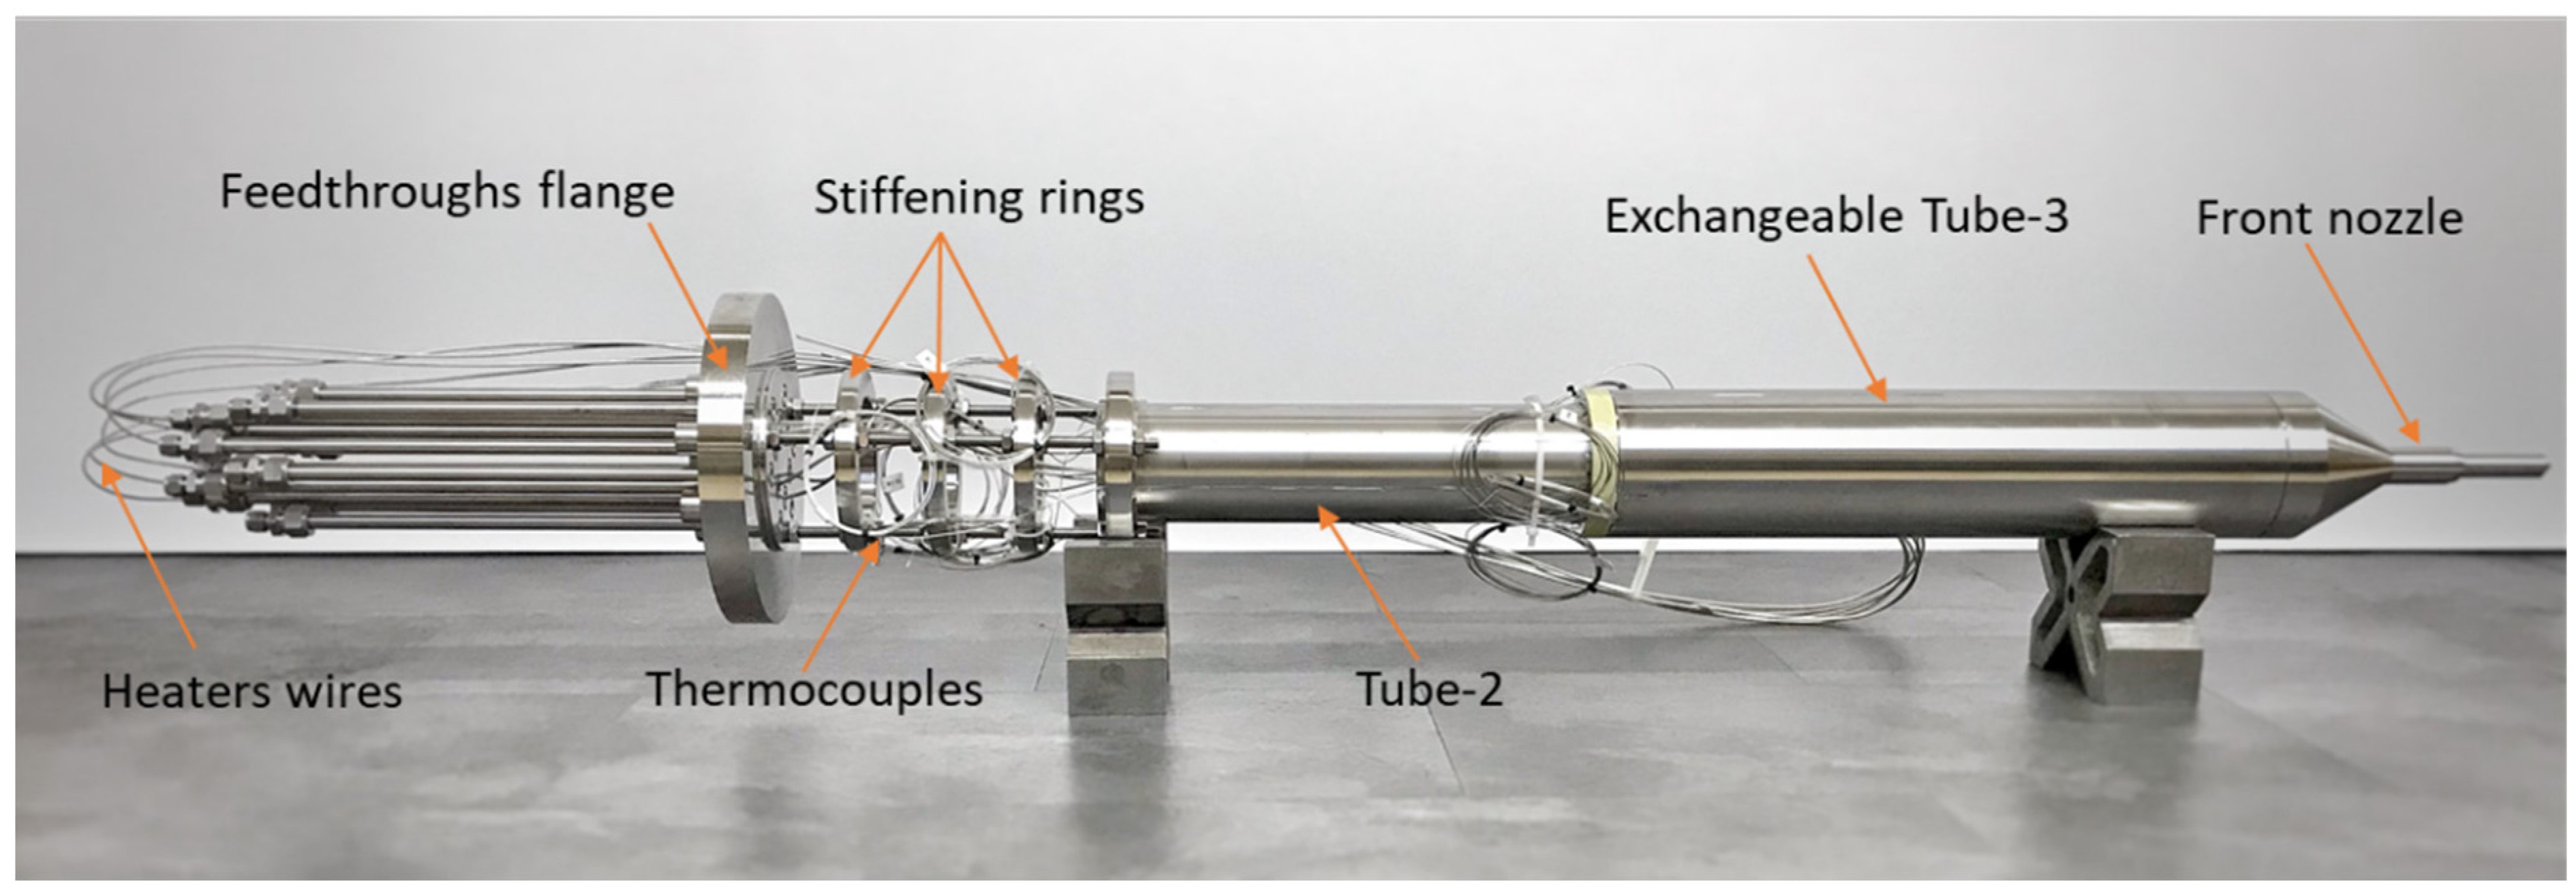
Figure 1. The grey flange (between flanges 2 and 3) hosts the feedthroughs required for the thermocouples and heater wires. Flange-1 and flange-4 are used to assemble the mock-up inlet and outlet pipes with the connection pipes, which lead to the helium loop pipes. The total length of the mock-up from the inlet flange-1 to the end-tip of the feedthroughs is about two meters. There are twenty-seven thermocouples installed inside and outside the mock-up to measure the temperatures at different locations; more information about these thermocouples is given later in the section of measurements and instrumentation. Each thermocouple is fixed and brazed in a groove (2.5 mm depth × 1.5 mm width) on the outer (or inner) surface of the tubes along the axial direction. All thermocouple wires are bundled and aligned inside or around Tube-2 and routed together to the feedthrough flange at the back side of the mock-up as shown in
Figure 2. More details about the pin MU design can be found in reference [
4].
It was planned to test the pin MU with three different inserts as follows: (i) the first insert with smooth surface roughness, (ii) the second insert with middle-rough surface roughness, and (iii) the third insert with high-rough surface roughness.
Figure 2 shows the assembly of the first insert with the other parts. In the first testing campaign (presented in this paper), the mock-up was tested with its first insert (smooth surface roughness) in HELOKA under the following HCPB blanket-relevant conditions: (i) inlet helium pressure of 80 bar, (ii) inlet helium temperature of 300 °C, and (iii) relevant helium mass flow rates (see test matrix). After finishing the first testing campaign, the first insert will be exchanged with the second insert and so forth for the third insert. The mock-up with each insert will be tested with different heating powers and mass flow rates as planned in the test matrix. The test matrix of the first testing campaign of the pin MU with the first insert (with smooth surface roughness) is given in
Table 1. There are twenty cases; each has a specific combination of helium mass flow rate (in gram per second) and heating power (in Watts). Each case was tested two times, hereafter referred to as the first and the second runs.
3. Experimental Set-Up
After the mock-up manufacturing was finished, its set-up was built by integrating it into the HELOKA helium loop, and then installing the relevant measurements and instrumentation. The mock-up manufacturing and integration into the helium loop are presented in the coming
Section 3.1, followed by a description of the set-up measurements and instrumentation in
Section 3.2.
3.1. Mock-Up Manufacturing and Integration
Concerning the mock-up assembly, it was foreseen to assemble the pin MU with three different inserts in order to test three different levels of surface roughness. The assembly of the first insert with the main body of the pin MU was successfully performed. The mock-up is a complex construction that should operate at high pressure and high temperature while being helium-tightly sealed. In addition, there are a significant number of feedthroughs, including thermocouples and the heaters. In particular, for the heaters, such feedthroughs have to also ensure electrical insulation. After the assembly, three procedures of the pressure qualification process were performed as follows: (i) classical pressure vessel qualification and pressure testing, (ii) dedicated qualification of the feedthroughs and the inlet/outlet flanges, and (iii) integral tightness testing with both pressure testing and dedicated leak tightness measurements. The total leakage from the whole mock-up assembly was within the range of 10−5 to 10−4 mbar·L/s at 80 bar helium.
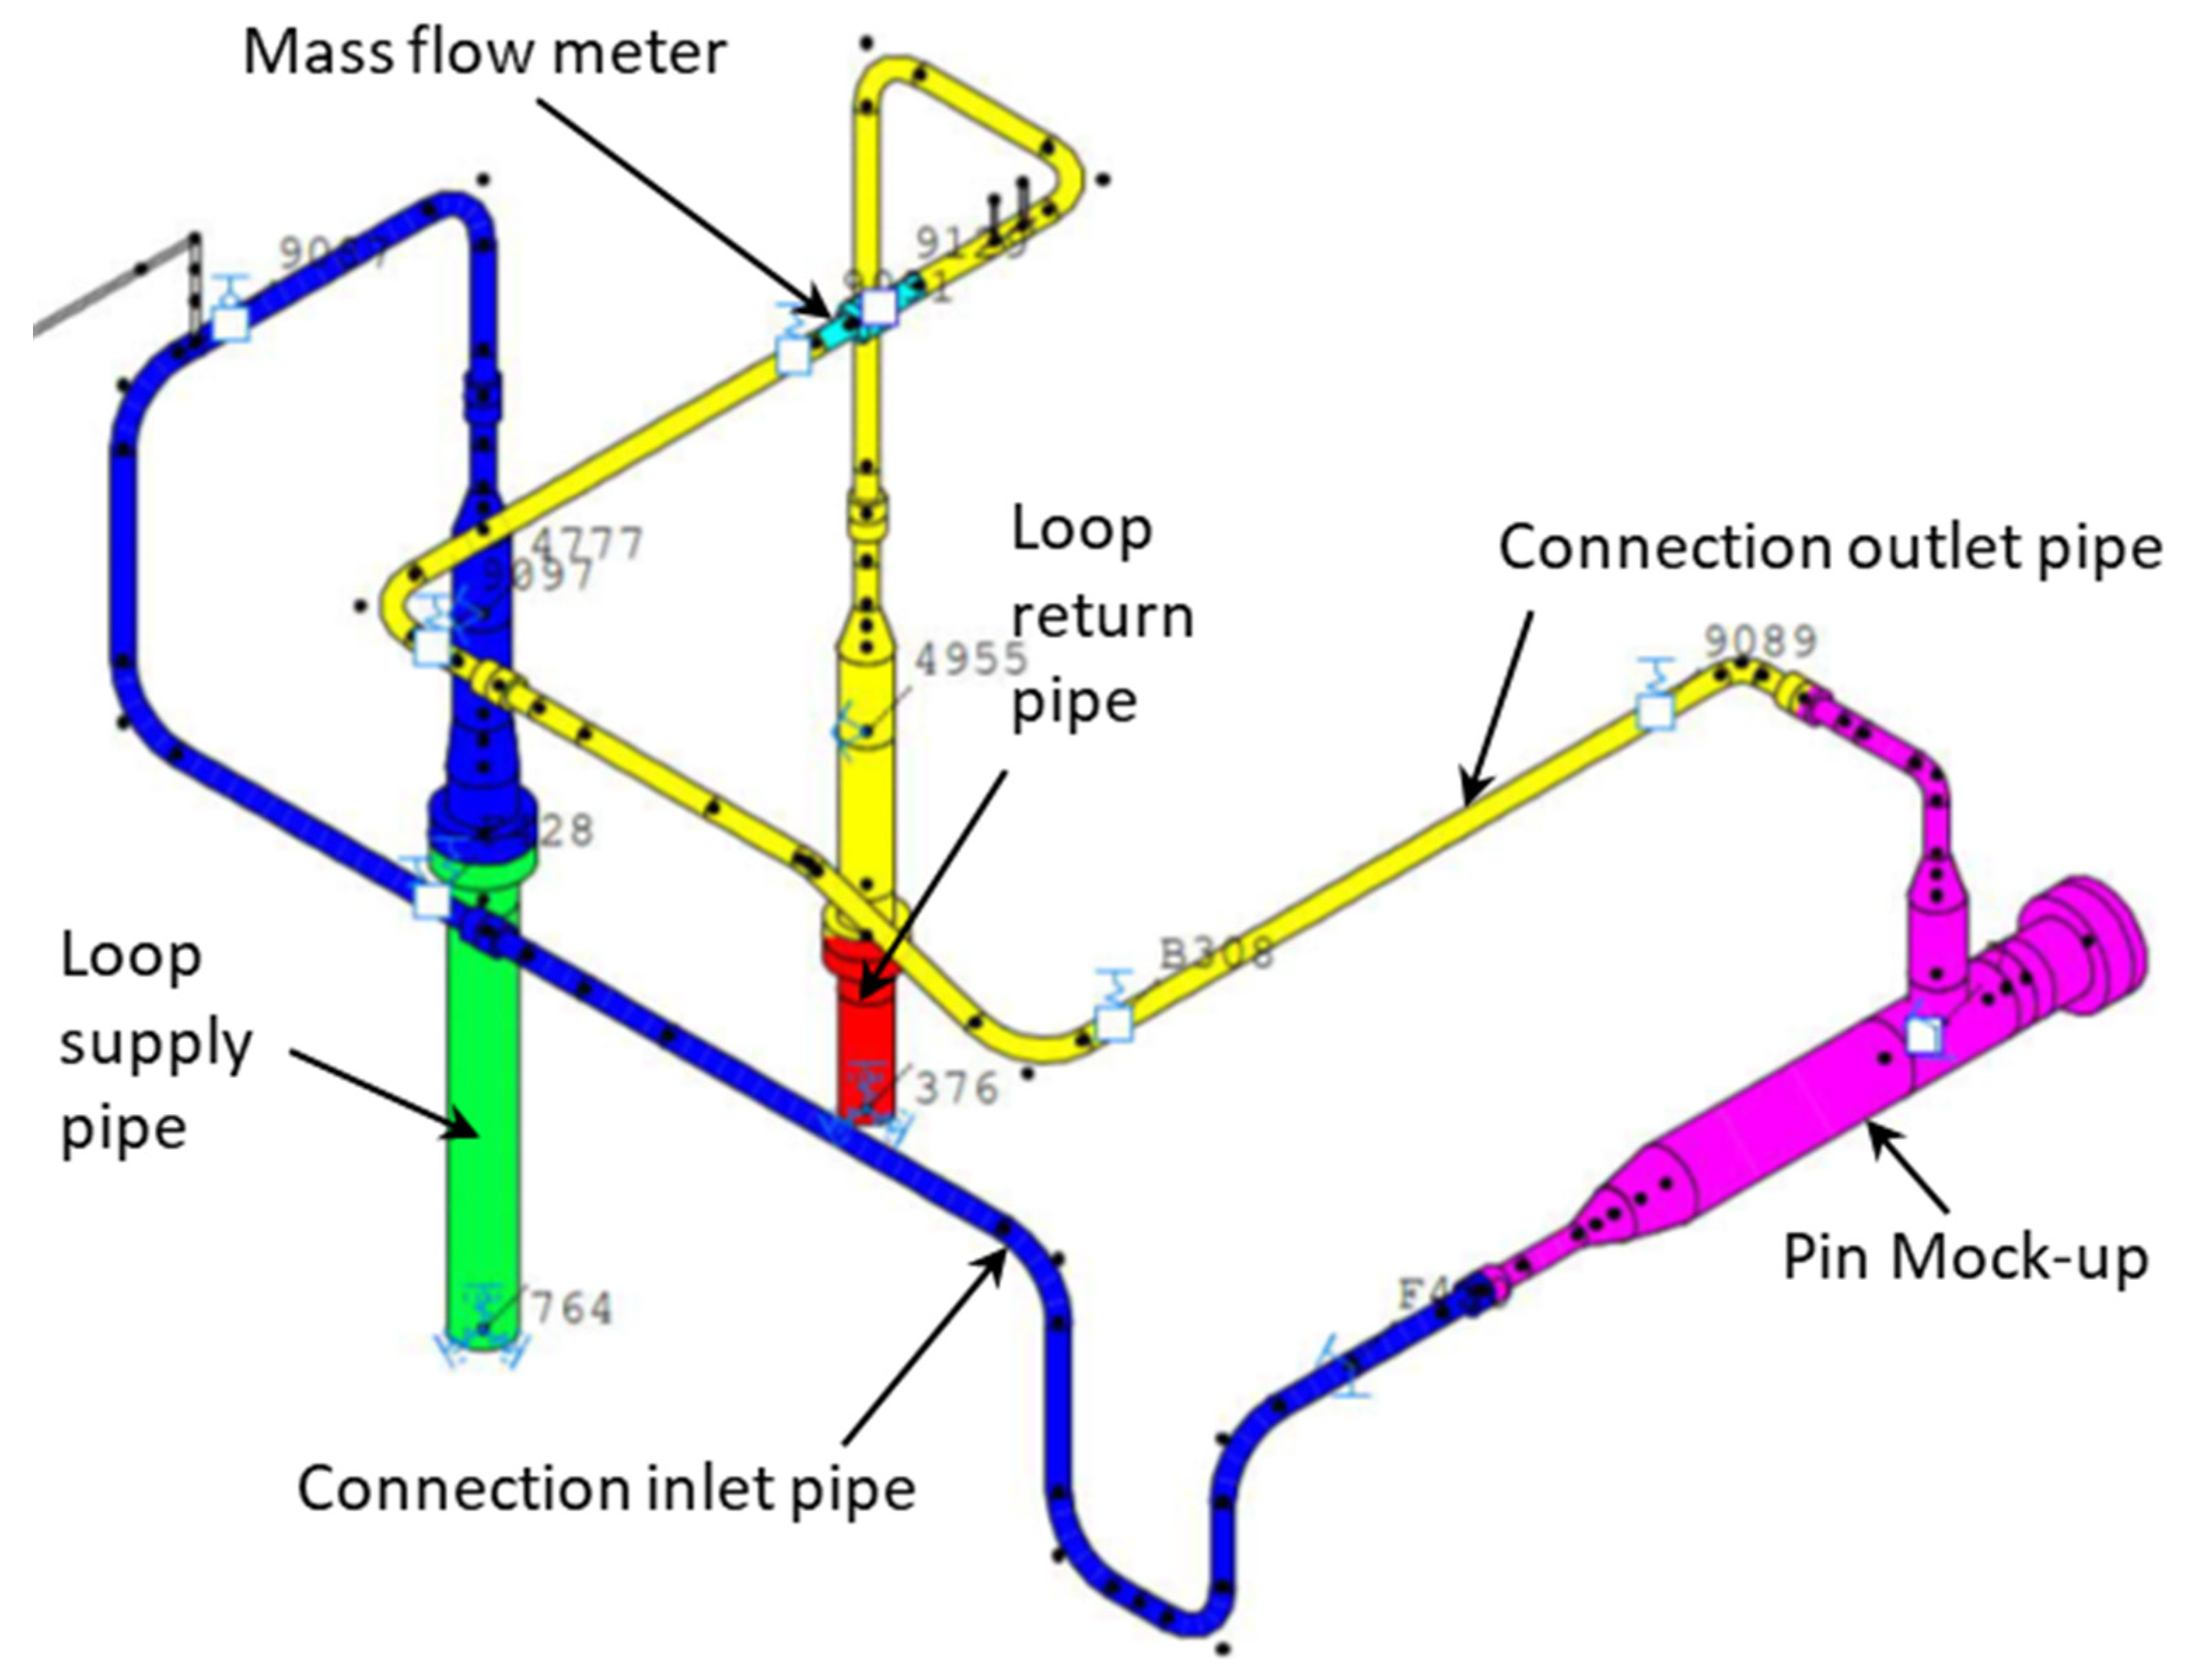
The next step was to integrate the mock-up into the helium loop using what is called the connection pipes, which connect the already-existing loop pipes with the inlet and outlet pipes of the pin MU as demonstrated in
Figure 3. The mock-up inlet and outlet pipes are assembled with the connection pipes by means of four flanges (DN 40 Class 2500). The connection pipes were designed to withstand a helium pressure of 110 bar and helium temperature up to 550 °C, the same as the design parameters of the HELOKA loop.
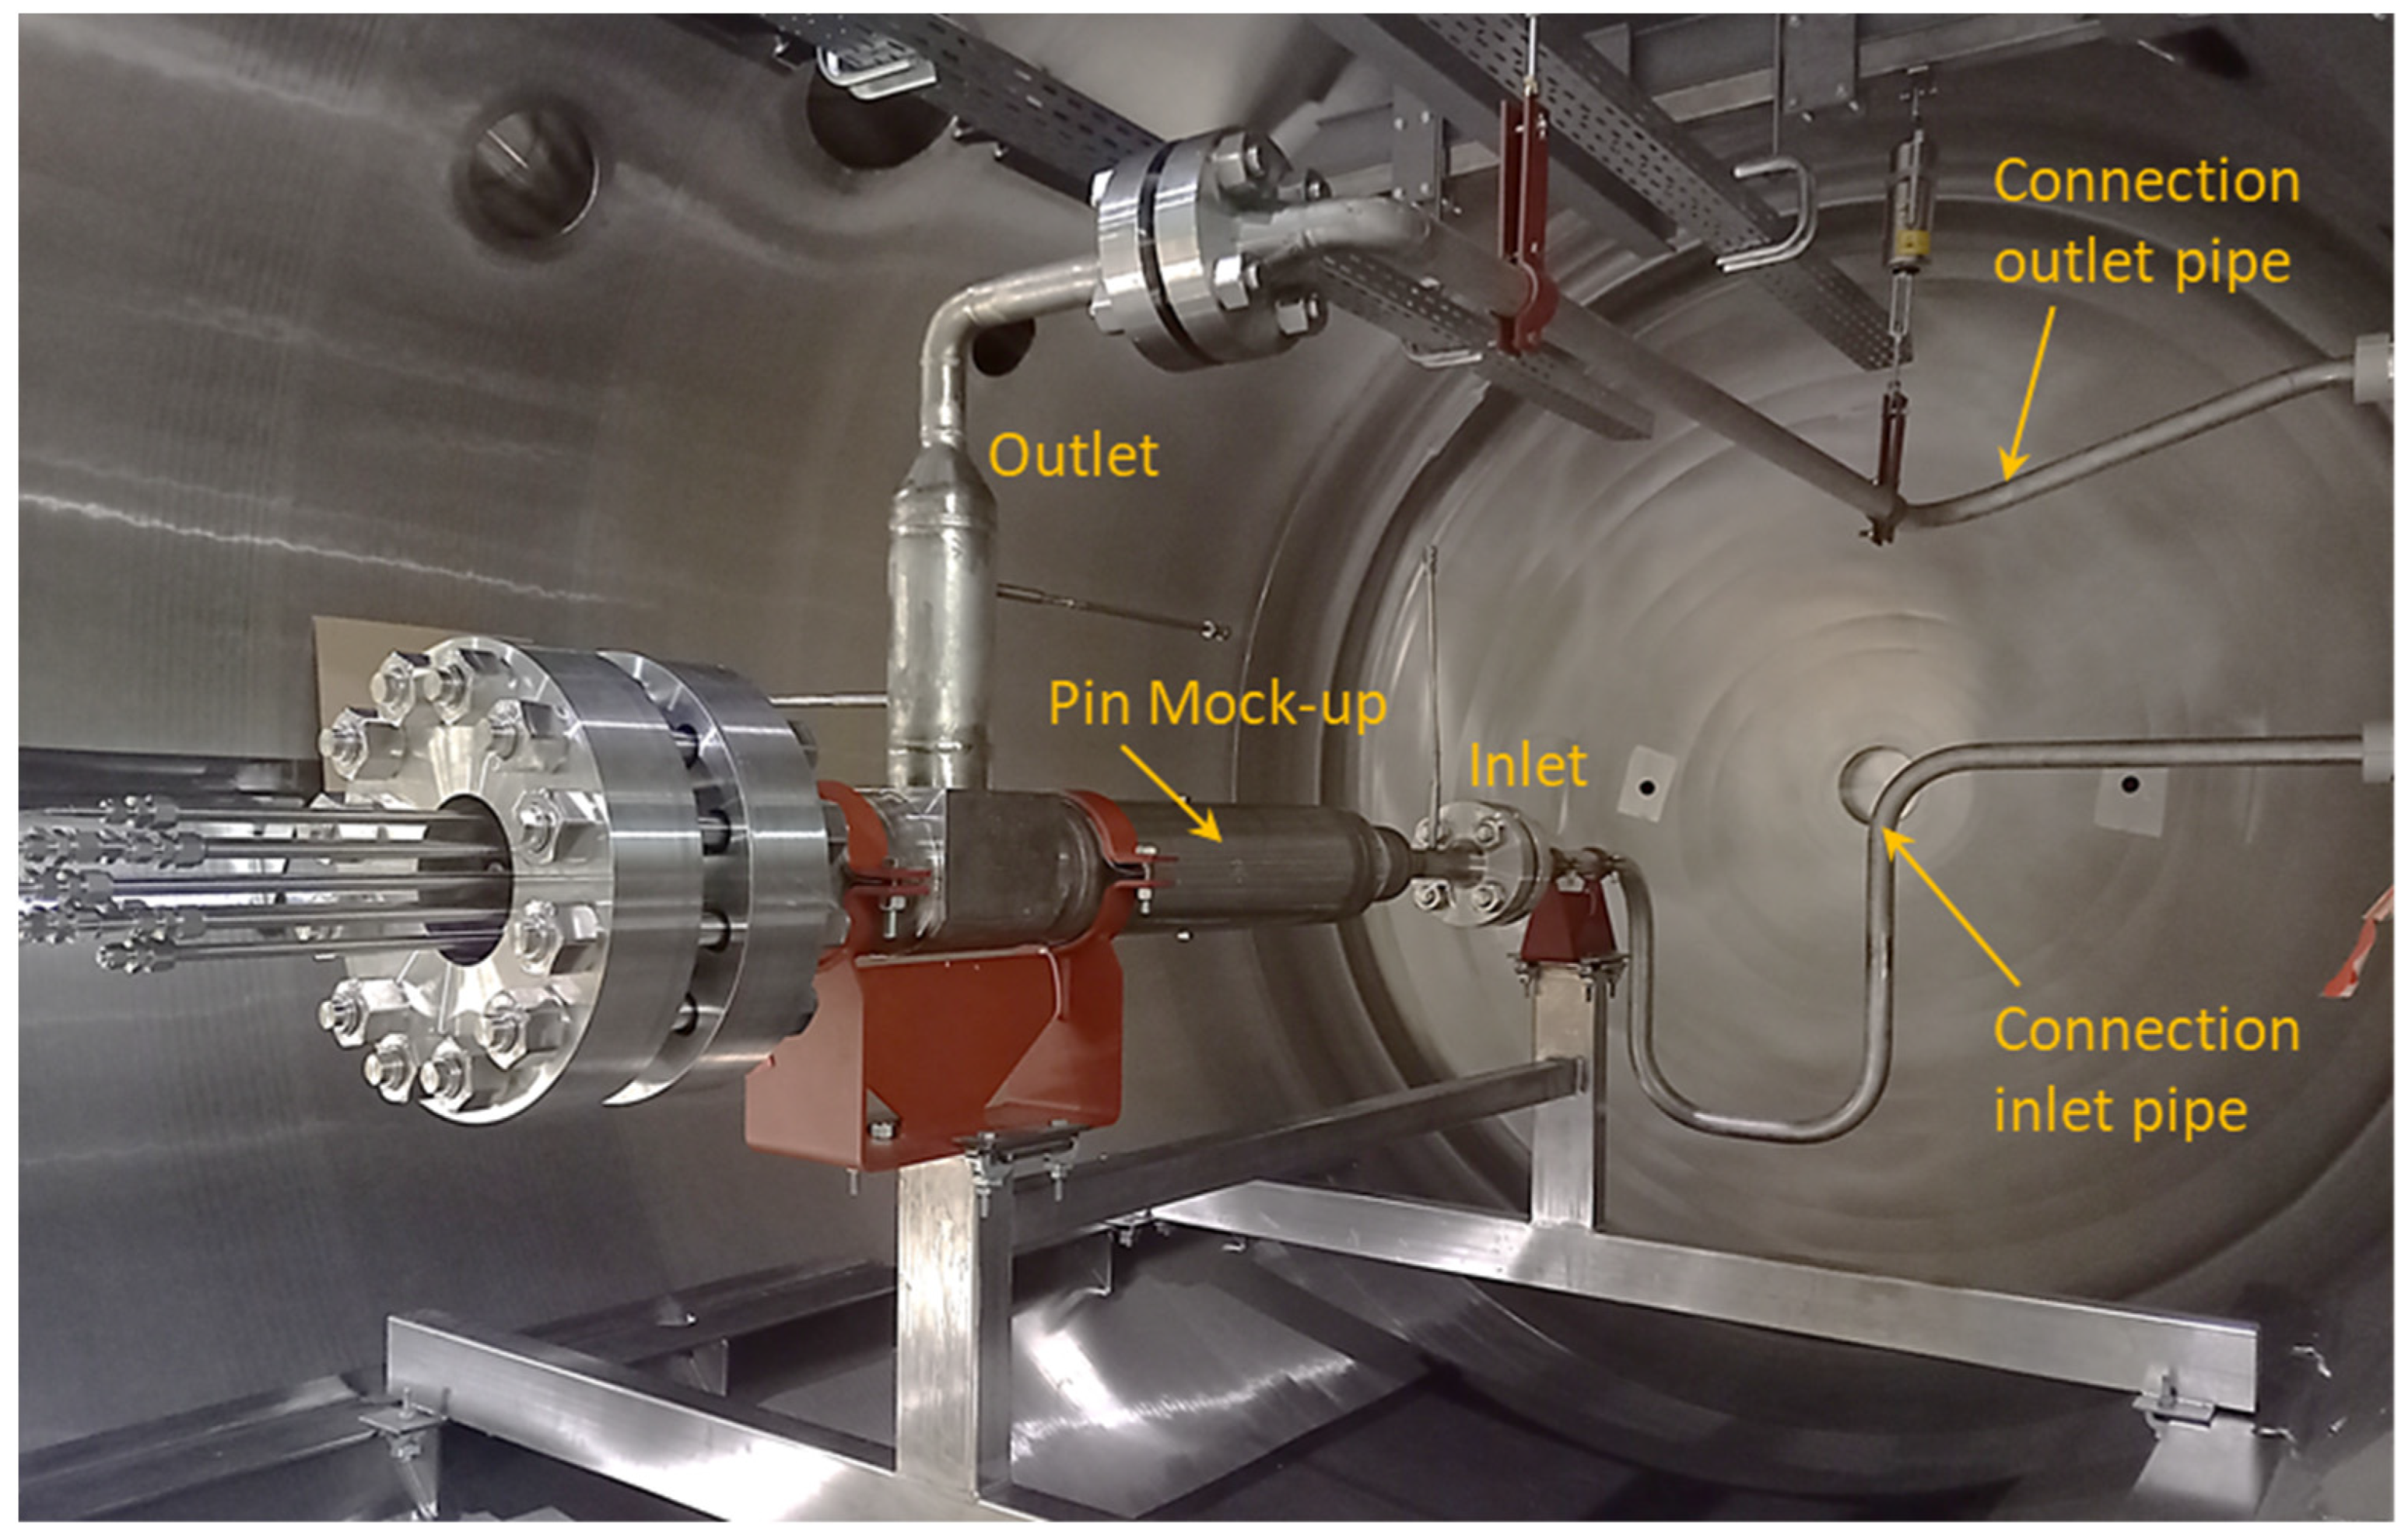
Figure 4 shows the pin MU installed already inside the vacuum vessel of the HELOKA Test
Section 1. Since the temperature of the inlet helium to the mock-up must be kept at 300 °C and the maximum temperature of the mock-up steel was estimated to be around 400 °C, a thermal insulation around the mock-up as well as the inlet and outlet pipes was implemented in order to maintain the mock-up at the required high temperatures and minimize the heat loss. The thermal insulation consists of three layers as follows from inside to outside: (i) a 25 mm layer of molded-pipe insulation sections, (ii) a 50 mm layer of wire-meshed mat of mineral wool, (iii) a 40 mm layer of mineral wool mat with one side of aluminum foil, and then (iv) a 0.5 mm cover of aluminum foil.
3.2. Measurements and Instrumentation
LabVIEW programming was implemented in the experimental set-up to perform the following tasks: (i) data acquisition of the temperature and pressure measurements in addition to the heaters’ powers, (ii) calculations of the helium density and the mass flow rate, (iii) control of the mock-up heaters by controlling their power supplies, and (iv) over-temperature protection implemented in software for every thermocouple. In addition, a set of five representative thermocouples were monitored using four temperature limiters (dedicate licensed SIL level 2) as a safety measure against any overheating. In the following sections, the different experimental measurements and their instrumentations are presented.
3.2.1. Temperature Measurements
There are twenty-five thermocouples (TCs) attached to the mock-up as summarized in
Table 2.
Figure 5 shows the layout of these TCs within the mock-up. The two TCs located at the mock-up inlet and outlet pipes are used to measure the inlet and outlet helium temperatures. The thermocouples have the following specifications: (i) type K and class 1 with tolerance ±1.5 °C for temperatures up to 375 °C and ±0.4% for temperatures between 375 and 1000 °C, (ii) sheath diameter of 1 mm and length of 2.5 m, and (iii) a temperature measuring range of −200 to 800 °C.
3.2.2. Pressure Measurements
Four pressure measurements were implemented for the pin MU set-up as follows:
The differential pressure between the outlet and the inlet of the mock-up. The differential pressure sensor is connected to the mock-up inlet Pipe-1b and outlet Pipe-2b via two pressure taps. This pressure sensor (Siemens SITRANS P420, München, Germany) has a measuring range of 0.1 to 20 mbar and its accuracy is 0.065%.
The differential pressure across the flow orifice, which is used for the measurement of the mass flow rate. The implemented differential pressure sensor (Siemens SITRANS P DSIII) has a measuring range of 6 to 600 mbar and its accuracy is 0.065%.
Absolute pressure measurement at the mock-up inlet Pipe-1b.
Absolute pressure measurement at the flow orifice P+ tap.
The absolute pressure sensor (DMP 320 by the company BD Sensors, Thierstein, Germany) used in the above two absolute pressure measurements has a range of 0 to 100 bar and its accuracy is 0.1% of the full-scale output, according to its manufacturer.
3.2.3. Measurement of Mass Flow Rate
The measurement of the mass flow rate was performed using a typical differential pressure flowmeter where a constriction (orifice) was introduced to create a pressure drop across the flowmeter. The flow orifice has the following features: (i) operating/maximum pressure is 80 bar/110 bar, (ii) operating temperature is 350 °C, and (iii) pressure drop range of 6 to 600 mbar. The helium mass flow rate was calculated by using the LabVIEW 2020 SP1 program and following the procedures of the International Standard ISO 5167-1 [
5]. This mass flow rate calculation required measurements from: (i) the differential pressure sensor, for measuring the orifice pressure drop, (ii) the absolute pressure sensor at the orifice inlet tap, and (iii) a thermocouple (type K and class 1) located downstream from the orifice. The last two measurements (absolute pressure and temperature) were used to calculate the helium density according to the Safety Standards of the Nuclear Safety Standards Commission KTA 3102.1 [
6]. The helium density was required for the mass flow rate calculation.
4. Experimental Results
As given before in the test matrix (see
Table 1), there are twenty cases, which can be divided into four groups; each group has almost the same mass flow rate but increasing input heaters power. For example, in the first group, cases 1 to 5 have similar mass flow rate (≈18–19 g/s) but the input power increases from 528 W (for case 1) to 1592 W (for case 5). Each case was tested two times (two runs); therefore, in some results figures, the tags of “1st-run” and “2nd-run” are given to the presented results. In the other figures, the mean (average) of the two runs was calculated and presented as a one value. All experimental results presented here are based on measurements taken and saved after reaching and maintaining a steady state condition. The following are more details of the steady state of the inlet helium conditions and steady state of all measured temperatures and pressures of the mock-up. For the inlet helium temperature, a steady state is assumed to be reached when the temperature is within 300 ± 1.5 °C over five minutes. Regarding the inlet helium pressure, the automatic pressure control system and the helium supply system in HELOKA work together to ensure that the helium pressure is within the required range (80 ± 0.5 bar absolute) during the experiment. For all mock-up measured temperatures, a steady state was achieved when the temperature change was equal to or less than ±1.5 °C in five minutes. The sampling (recording) rate in the LabVIEW program for the temperatures, absolute and differential pressures and mass flow rate was one reading per second.
At the start of the experimental campaign, the loop was filled with helium up to 60 bar at room temperature, because when the loop heater heats the helium to around 300 °C, its pressure reaches about 80 ± 0.5 bar absolute. At the beginning of each run, the following actions are performed: (i) the loop circulator is started and its speed is adjusted to achieve the required mass flow rate with the help of some controlling valves, (ii) the loop heater is turned on to heat the flowing helium to the required temperature of about 300 °C, and (iii) relevant controls and adjustments are made until reaching steady state conditions (80 ± 0.5 bar and 300 ± 1.5 °C) of the inlet helium.
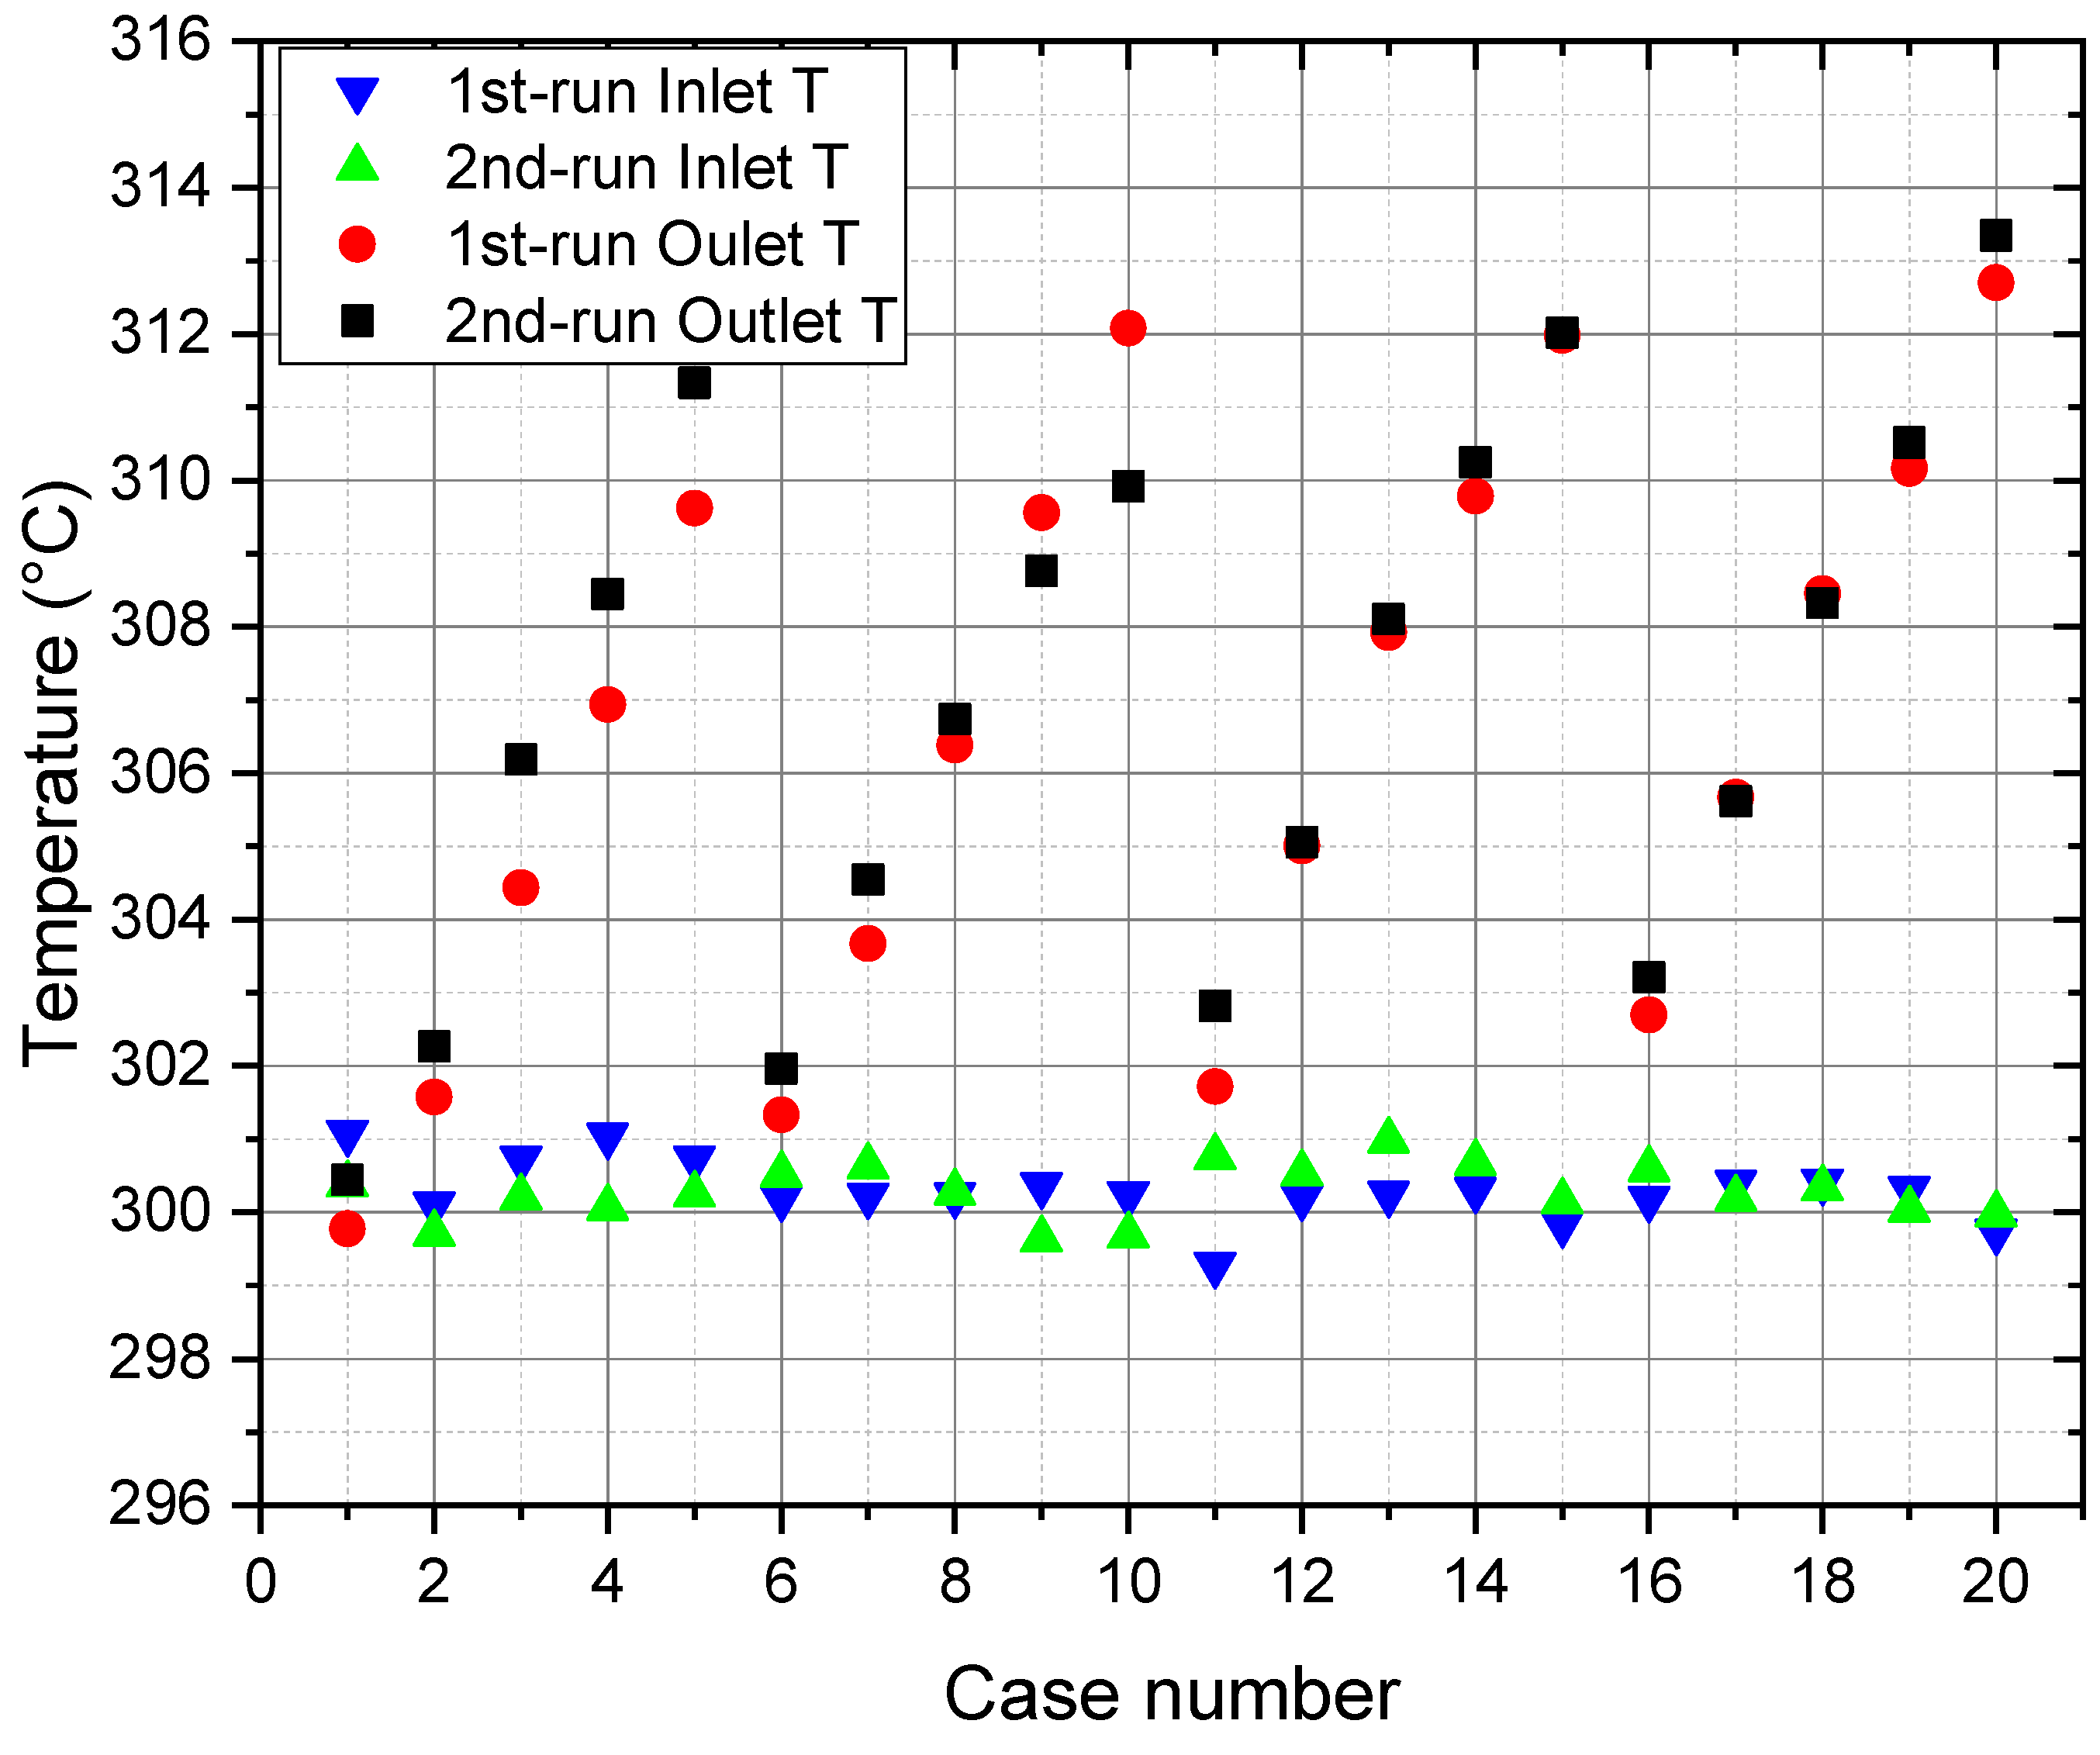
Figure 6 shows the measured inlet and outlet helium temperatures for the twenty cases, with each case having two values (corresponding to 1st-run and 2nd-run). Each temperature value given in this figure is the mean of many values (for example 900 readings coming from the product of 15 minutes times 60) recorded during the steady state time (range from 15 to 20 minutes) of each run. The thermocouples’ tolerance (accuracy) is ±1.5 °C for temperatures up to 375 °C. All helium inlet temperatures are within the target range of 300 ± 1.5 °C; therefore, the steady state condition of the helium inlet temperature in all experimental runs was well achieved. The values of helium outlet temperature follow the same trend of the input heater power, i.e., they increase gradually within each group of five cases as shown in
Figure 6. The increase in the helium temperature from the inlet to the outlet ranges from about 1 to 13 °C. The maximum increase (≈13 °C) in the helium temperature occurred in case 20, which also has the maximum heaters power of 3979 W. The similarity between values of 1st-run and 2nd-run in each case is generally very good, especially in the third and fourth groups, which have helium flow rates higher than those of the first and second groups.
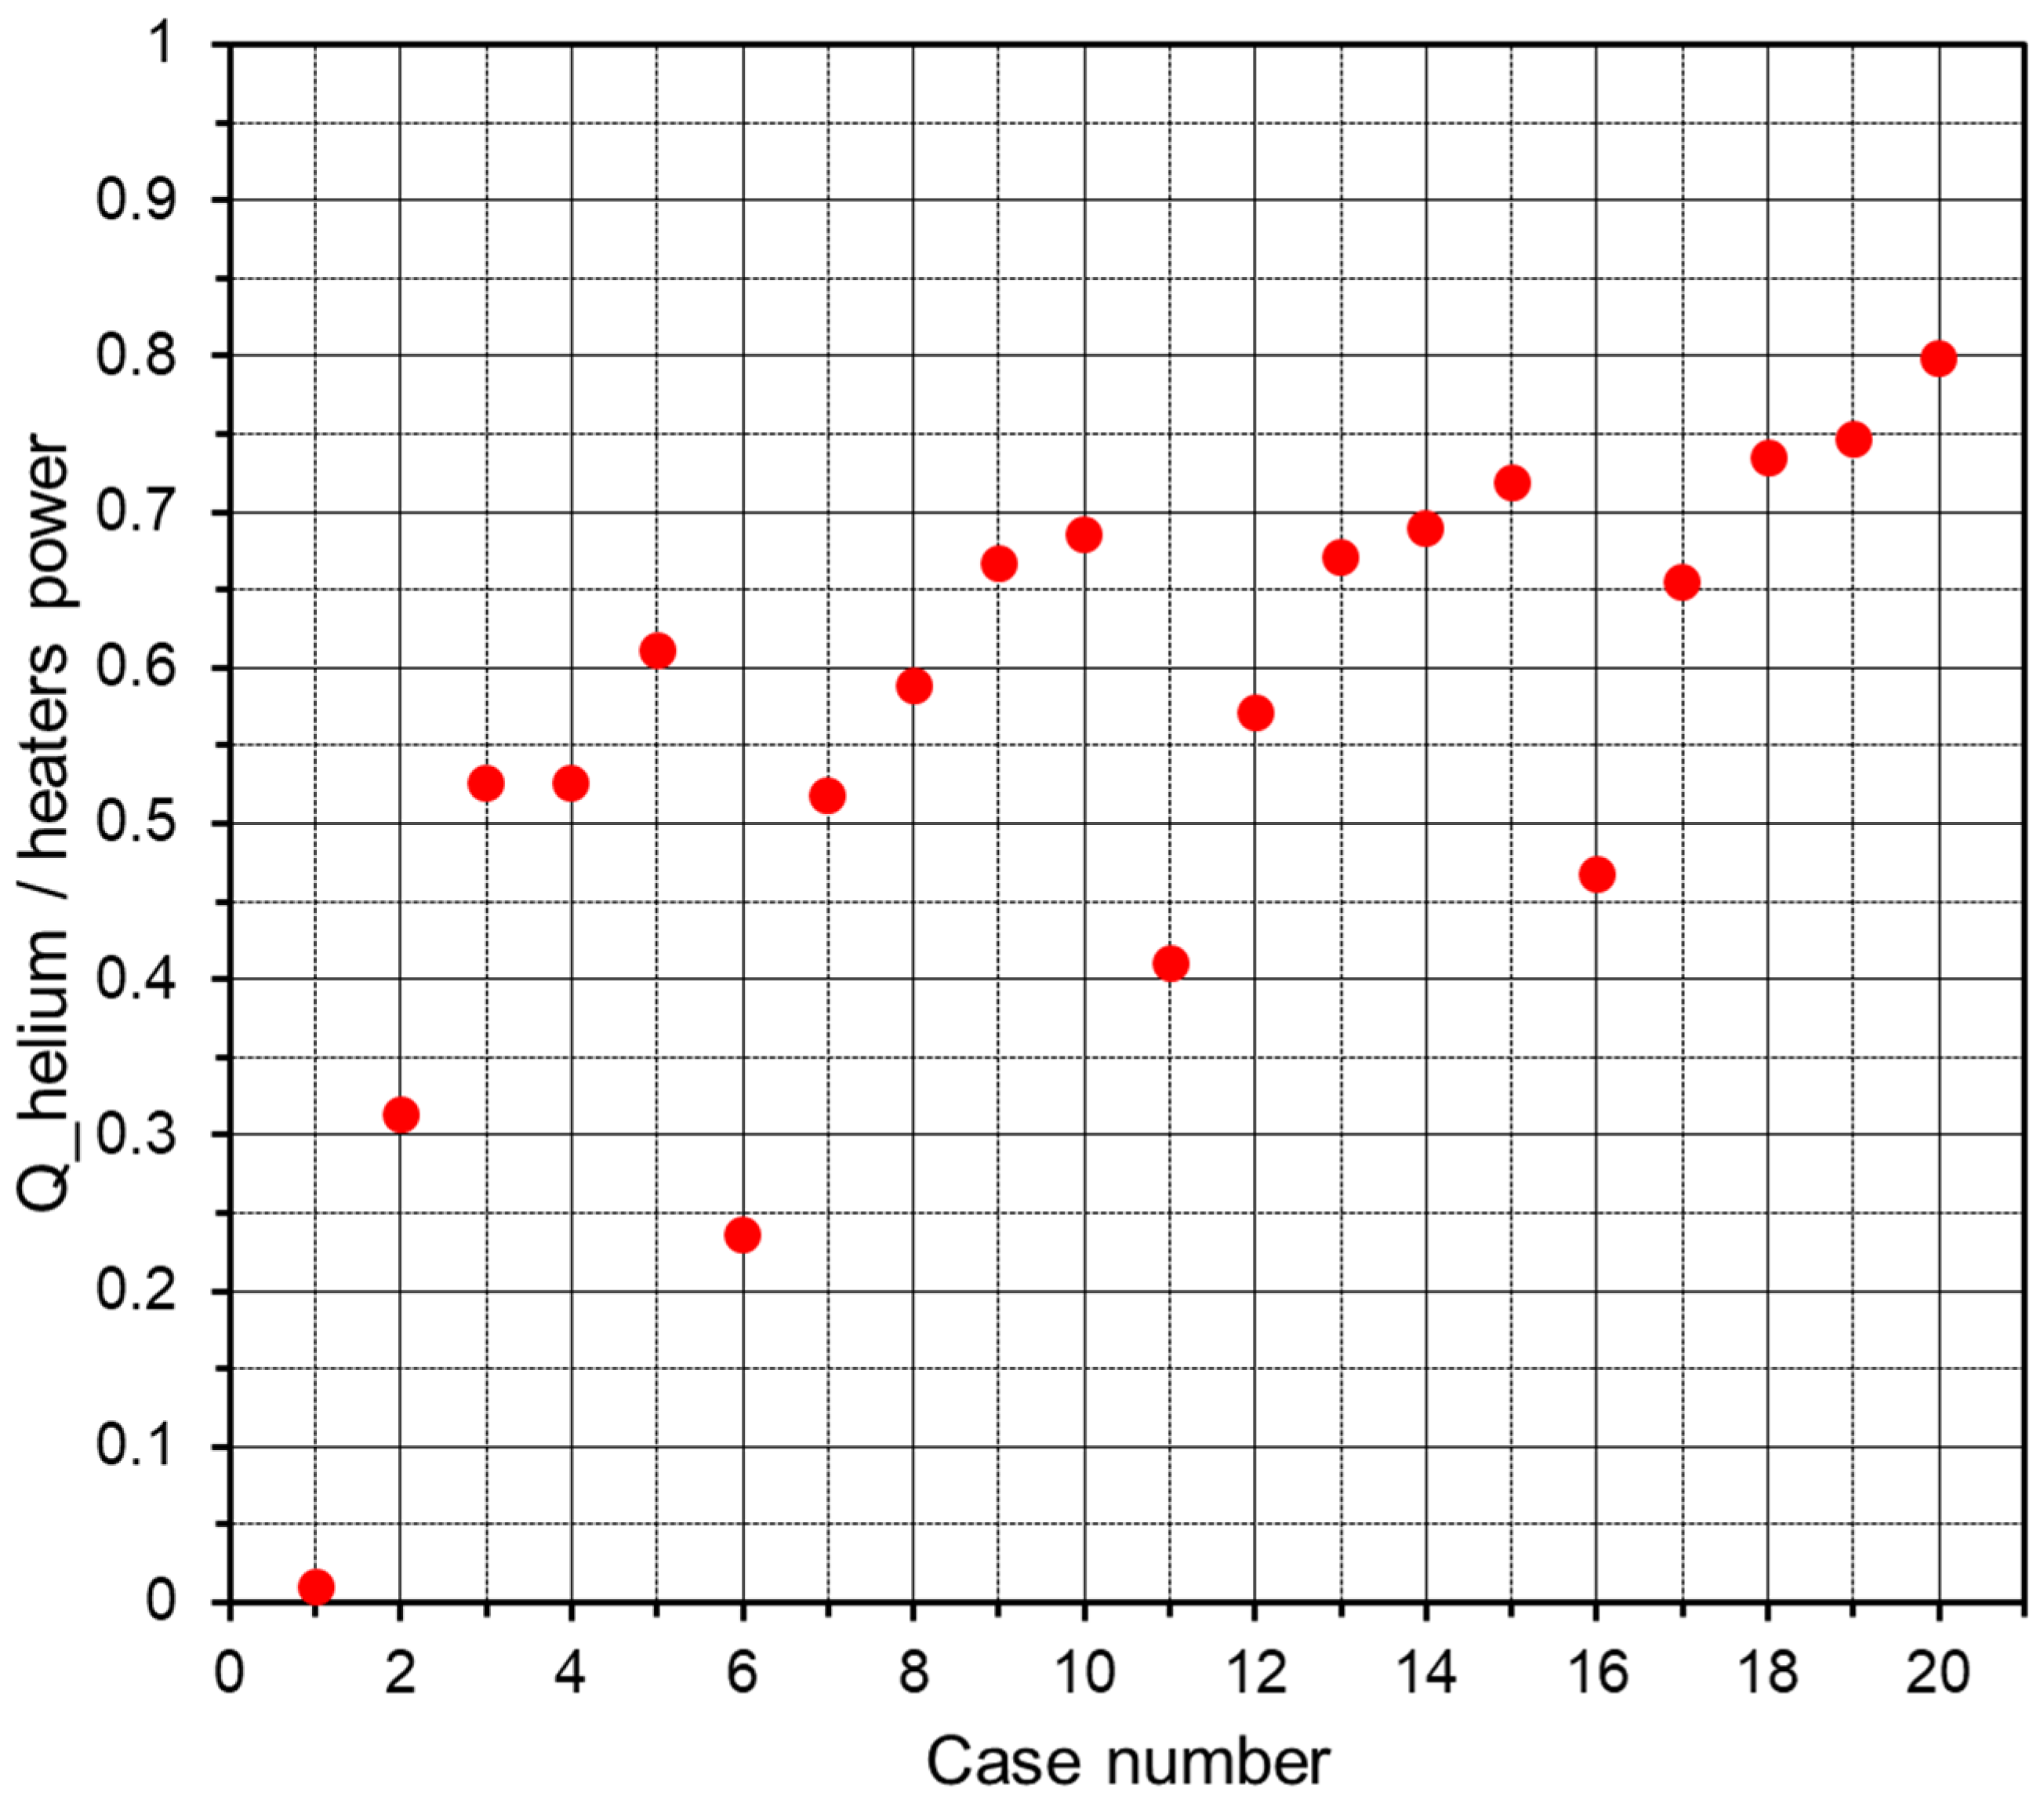
Figure 7 shows the ratio of the heat absorbed by the coolant helium divided by the heaters power input to the mock-up for the twenty cases. The shown value, for each case, is the mean of two values (obtained in the 1st-run and the 2nd-run). The heat absorbed by helium is calculated as the product of the mass flow rate times the specific heat times the helium temperature difference (outlet–inlet). This ratio ranges from about 0.2 to 0.8 for all cases, except case 1 where the ratio is very small (about 0.01). Within each group of five cases (where the helium mass flow rate is almost the same), the ratio values increase with the increase in the input heaters power. Since case 20 received the maximum input heaters power, it shows the highest ratio among all cases. When comparing the four groups, the ratio values show small increases with the increase in the helium mass flow rate from one group to the next one.
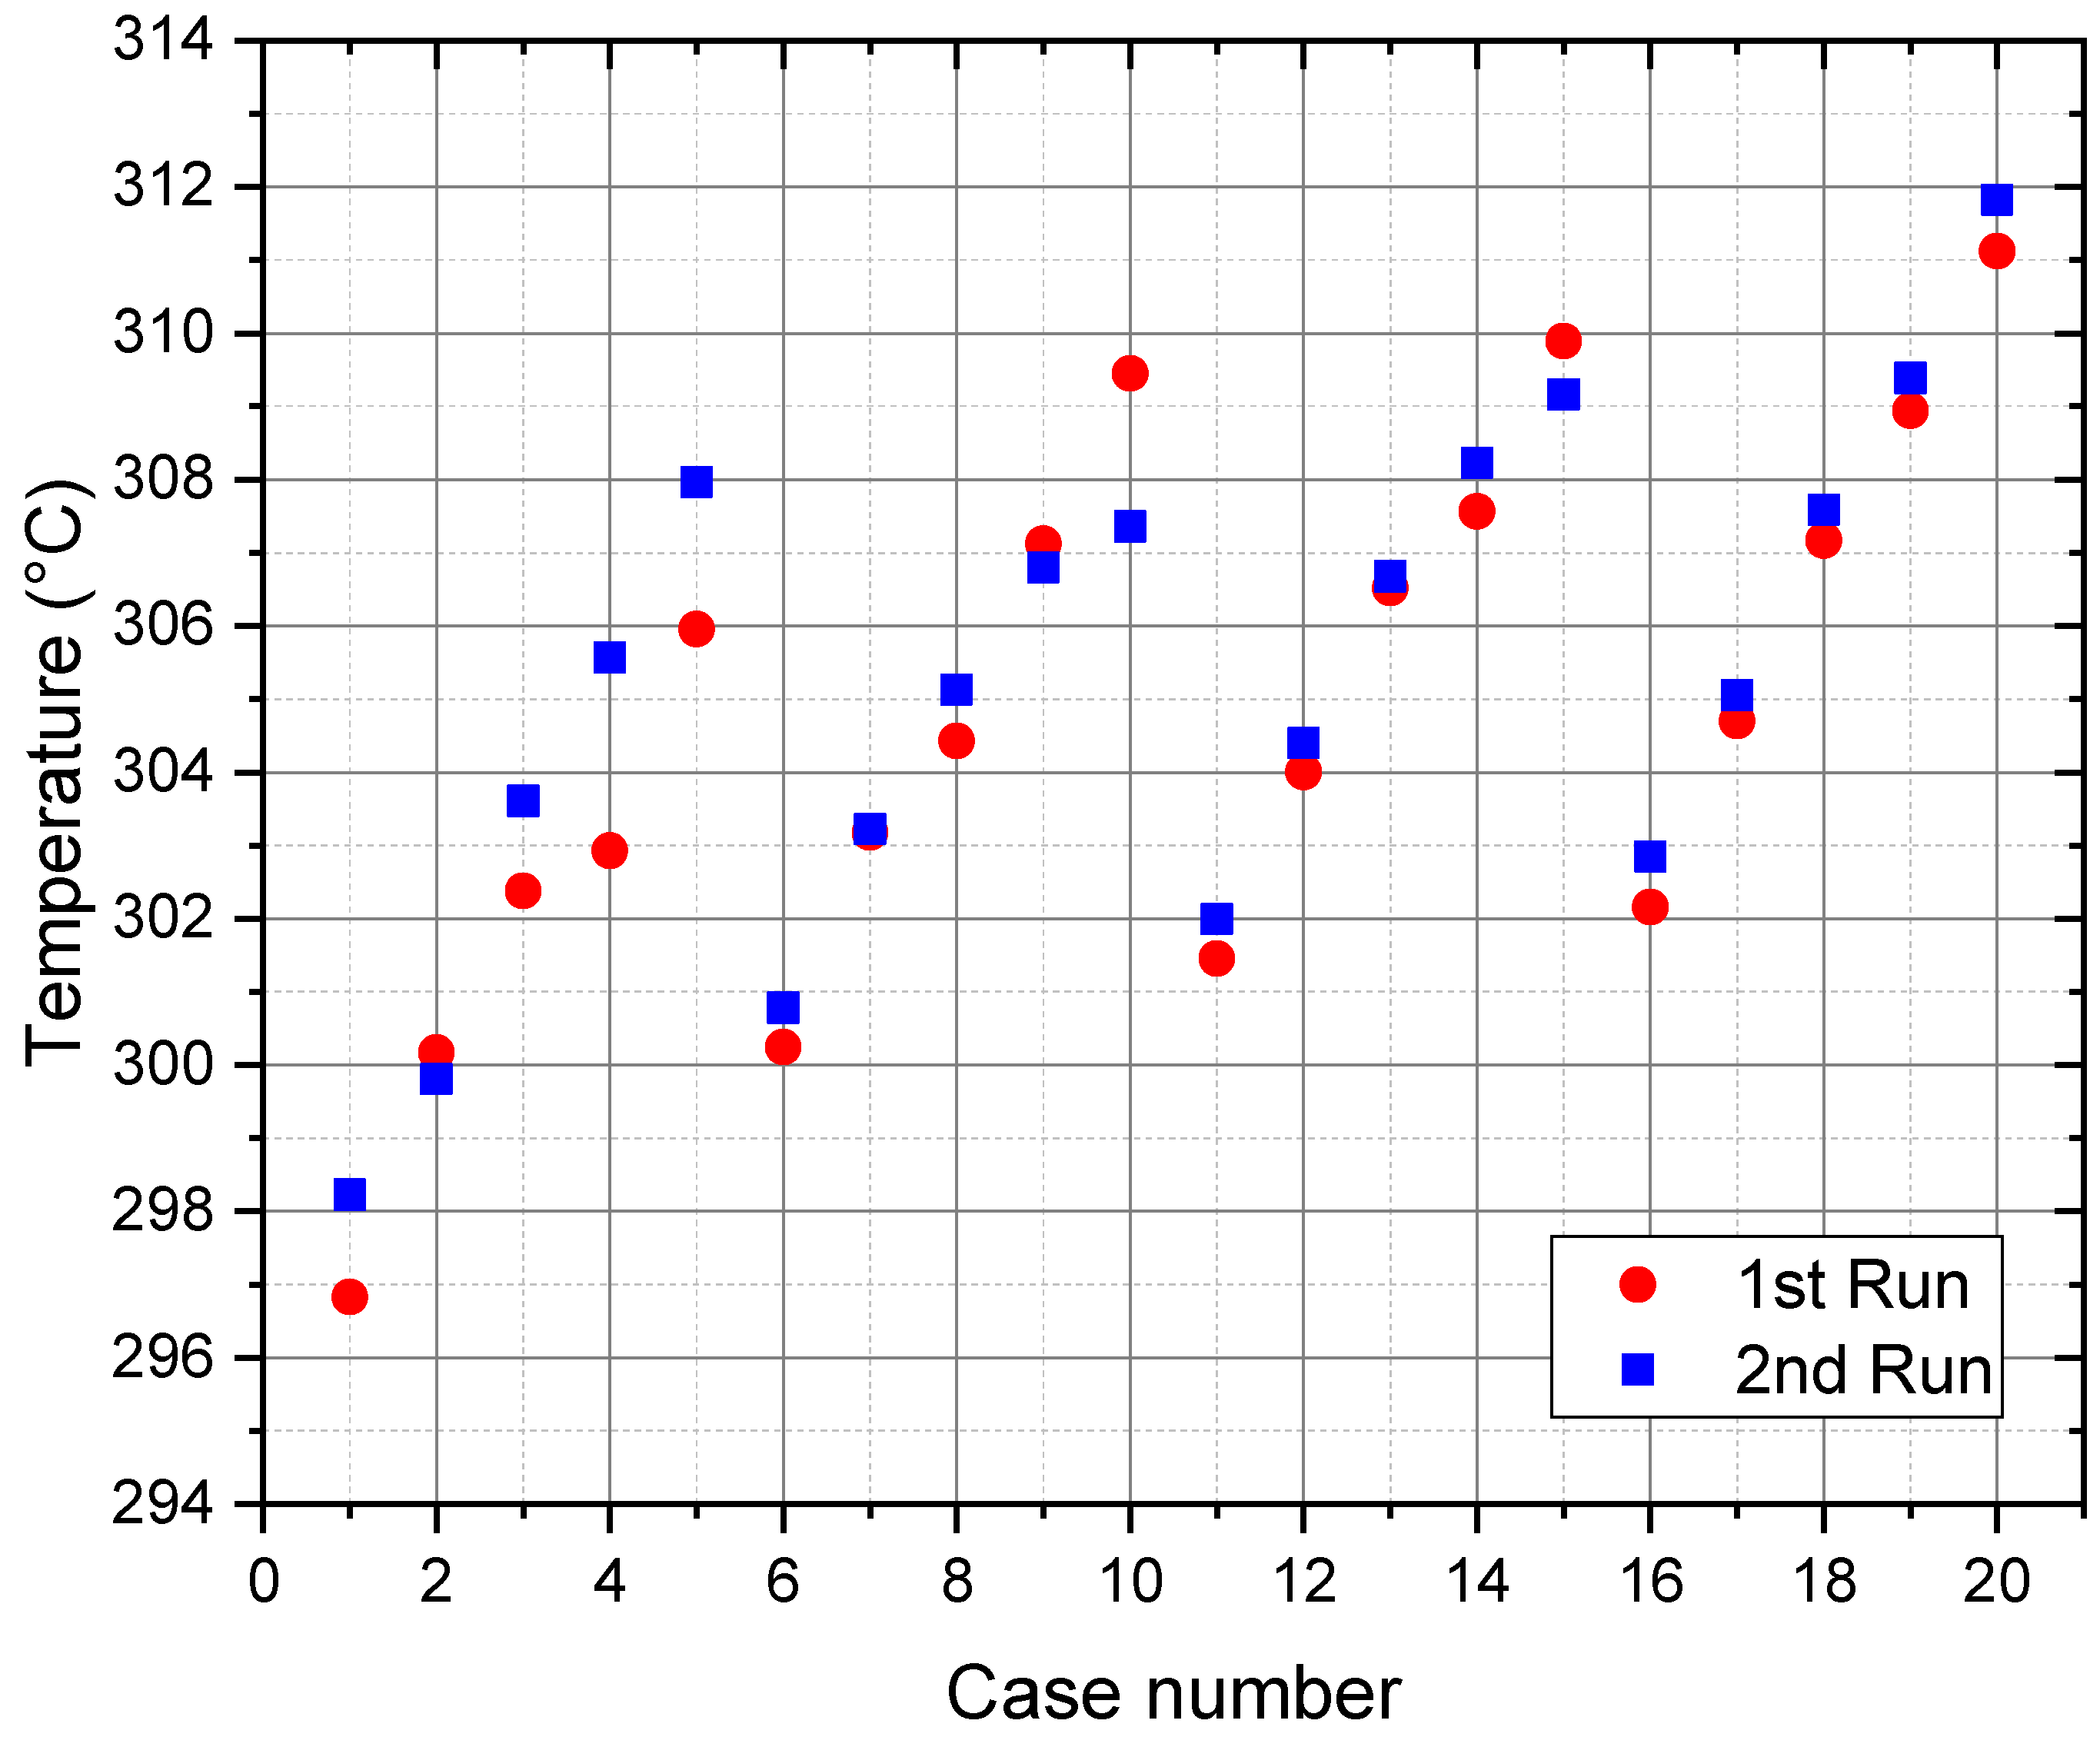
Figure 8 displays the temperature values used for the calculation of the helium mass flow rate for the twenty cases with each case having two values (corresponding to 1st-run and 2nd-run). These temperatures were measured using a thermocouple (TC-27) that was placed next to the flow orifice located downstream of the mock-up. These temperatures show a trend similar to that of the outlet helium temperatures shown in
Figure 6, which is an expected performance. The accuracy and consistency of this thermocouple are important because its temperature reading is used to calculate the helium mass flow rate as described before in
Section 3. The similarity between values of 1st-run and 2nd-run, in each case, is generally very good (the difference is less than the thermocouple tolerance (±1.5 °C) except in cases 4, 5, and 10 (the difference is about 2 °C, which is still very close to the thermocouple tolerance).
All the measured pressure values used for the mass flow rate calculation for the twenty cases lie within the range of 80 ± 0.5 bar except in the 1st-run of case 13, where the pressure is 79.42 bar. These pressure values (80 ± 0.5 bar) are almost the same as the inlet helium pressure to the mock-up.
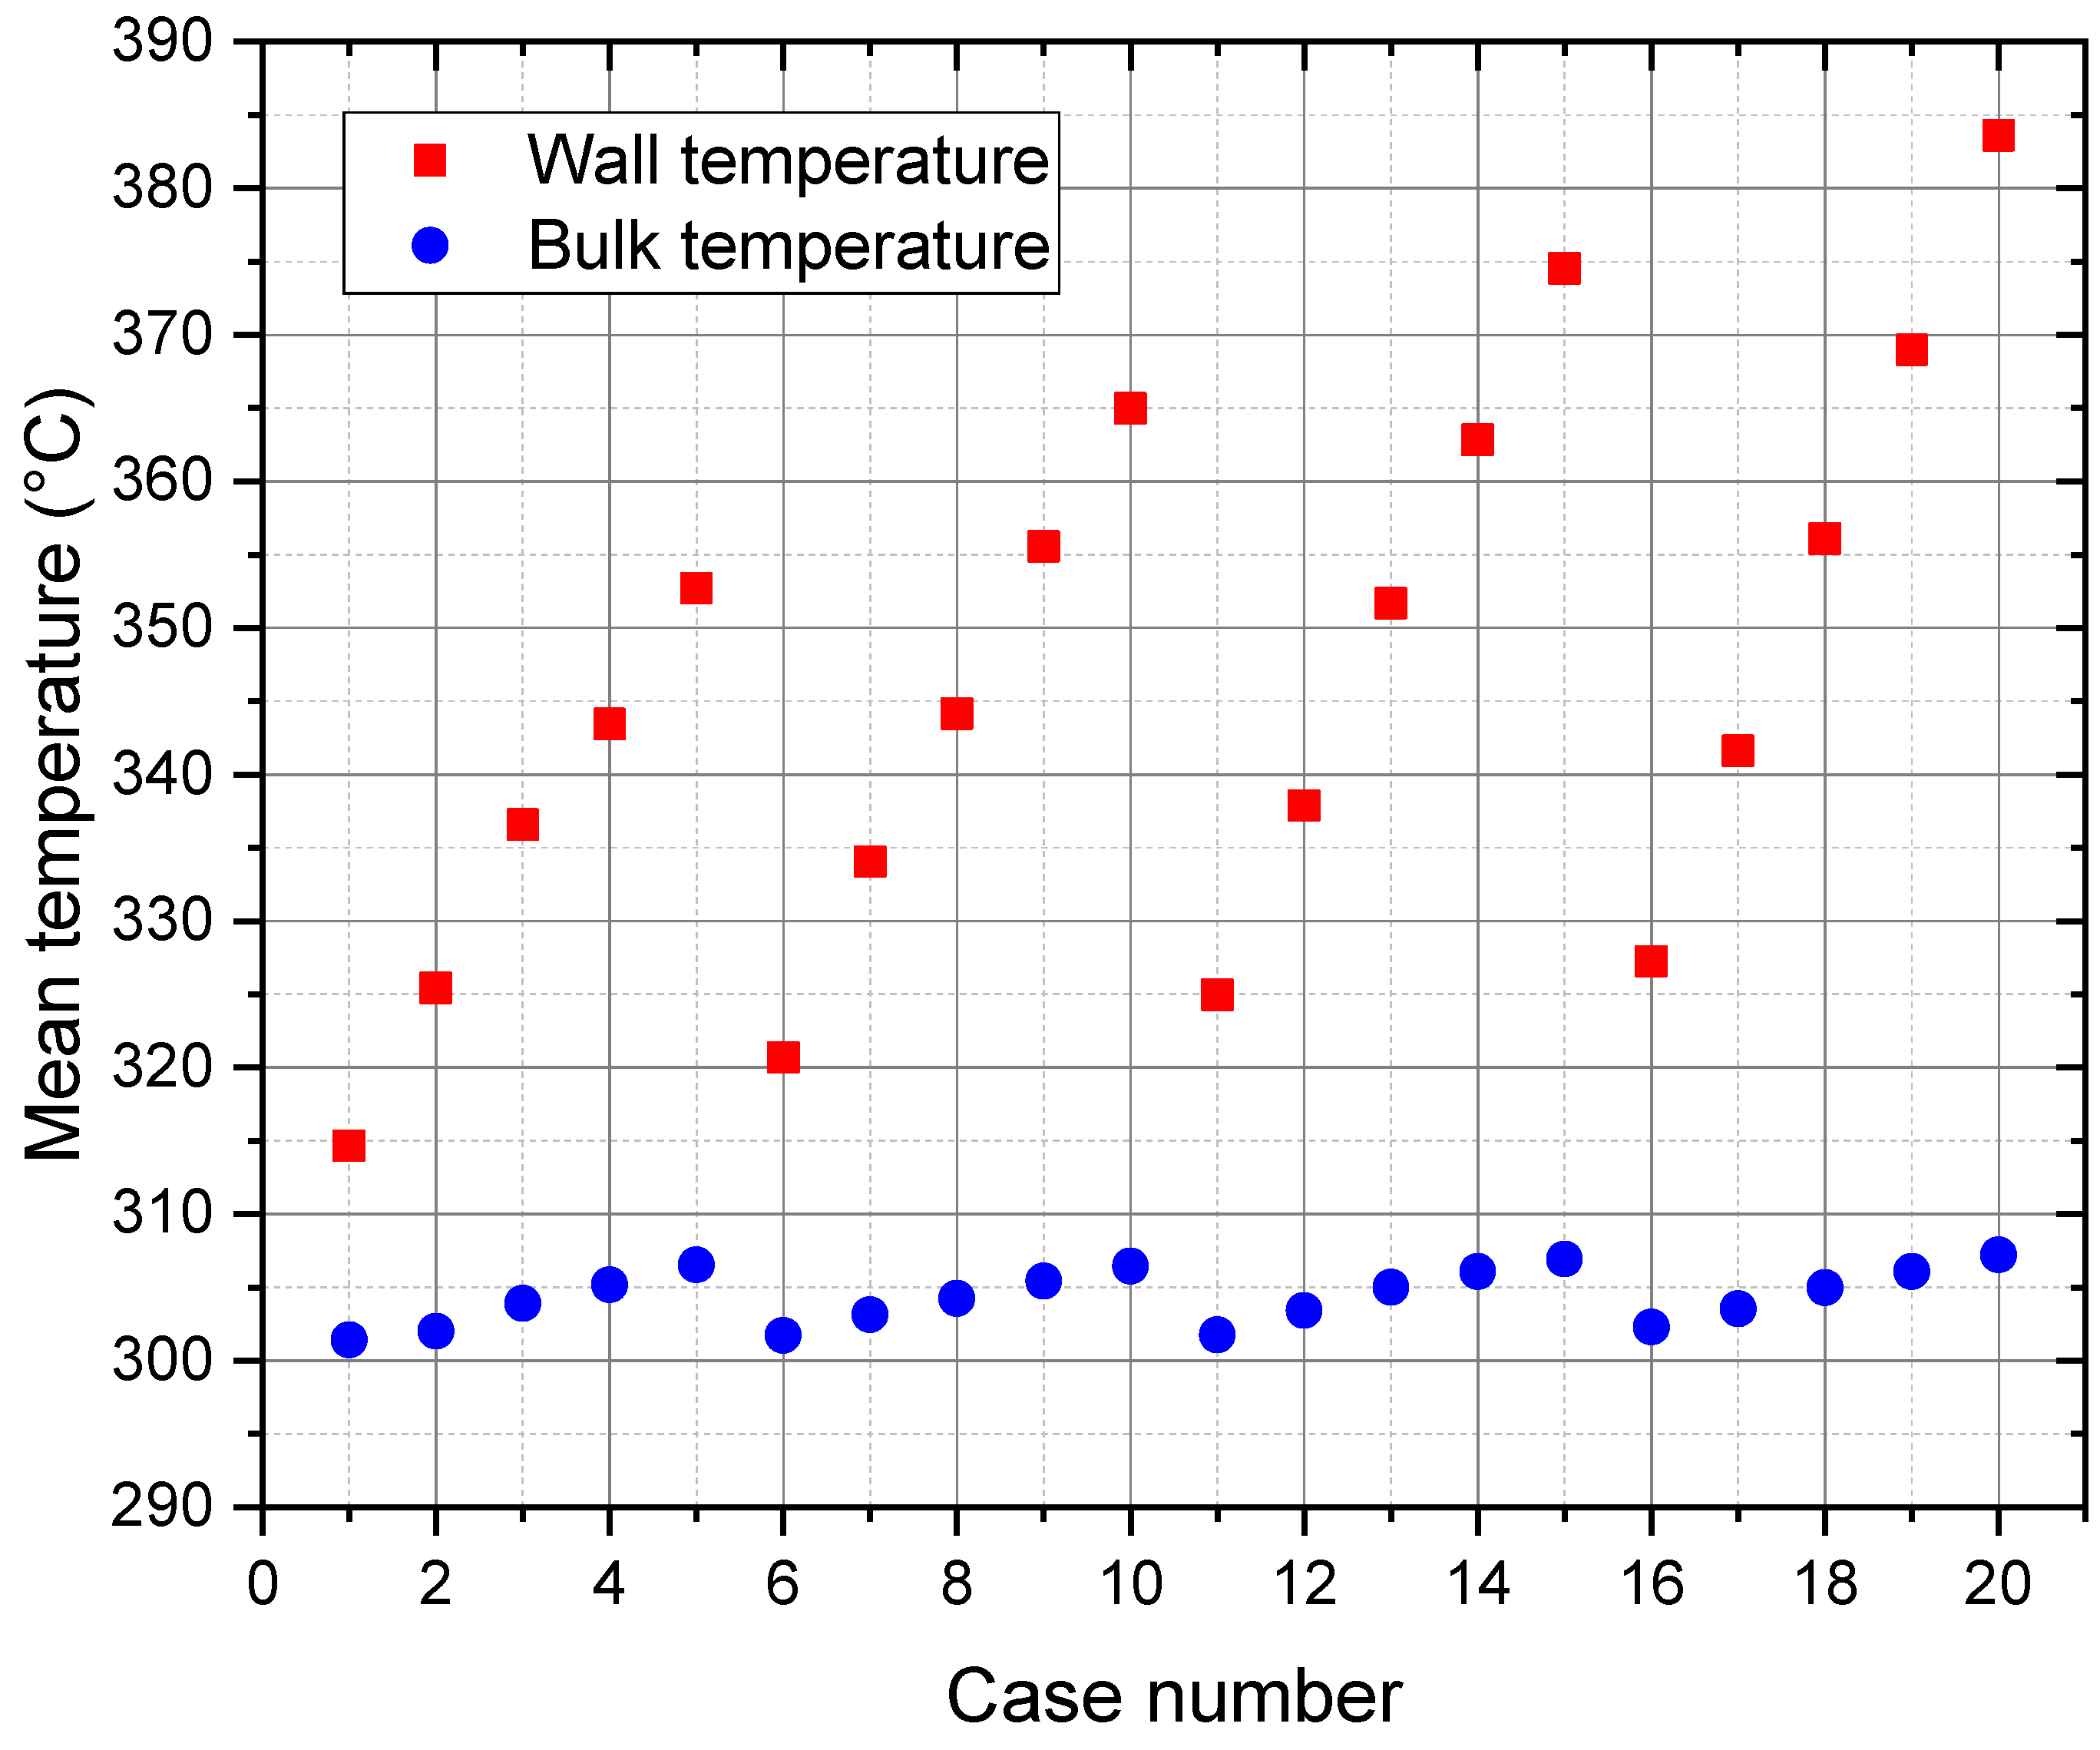
Figure 9 shows the calculated mean (of the 2 runs) values of the wall and bulk temperatures; the wall here is the outer surface of Tube-3, which with the inner surface of Tube-4 forms the concentric annular channel for the flowing helium. The mean wall temperature is calculated using the temperature readings of the thermocouples TC-9 to TC-12 (inserted to a depth of 1.25 mm below the Tube-3 outer surface). The mean of both runs’ bulk temperature ranges from 302 °C to 307 °C for the twenty cases.
4.1. Data Processing
The experimental values of the Nusselt (
Nu) number were calculated using the experimental measurements (data) of the current experiment and the relevant equations of heat transfer in tubes as explained in the following paragraphs. The Nusselt number was calculated using the following equation:
Dh: hydraulic diameter,
λf: thermal conductivity of coolant,
h: convective heat transfer coefficient,
: wall-to-fluid heat flux,
Tw: temperature at coolant-contacting wall,
Tf: bulk temperature of coolant.
The values of
λf,
,
Tw,
Tf can be calculated as described in the following steps. The heat flux
from the wall to the coolant was calculated using Fourier’s law and assuming a uniform heat flux through the wall as follows:
λ: thermal conductivity of Tube-3 (stainless steel 316L),
r1: radius corresponding to location of T1 thermocouple,
r2: radius corresponding to location of T2 thermocouple,
T1: the temperature of thermocouple TC-14 or TC-16,
T2: the temperature of thermocouple TC-10 or TC-12.
Both the TC-10 and TC-12 thermocouples were installed in a groove 1.25 mm deep. This means that the measured temperature is actually the wall temperature at 1.25 mm below the Tube-3 surface. Since the stainless steel has a relatively low thermal conductivity, to accurately account for the change in the wall temperature, the surface temperature of Tube-3 was calculated as follows:
: heat flux determined in the previous step above,
T2: temperature of thermocouple TC-10 or TC-12,
r2: radius corresponding to location of T2 thermocouple,
rwall: outer radius of Tube-3,
λ: thermal conductivity of Tube-3 (stainless steel 316L).
For the coolant bulk temperature Tf no measurement was dedicated. The reason for this is that, during the design phase, it was estimated that placing a thermocouple in the coolant annular gap, even a 0.5 mm thin one, would distort significantly the flow, leading to erroneous results. Thus, for estimating this parameter we are making the following assumptions:
The coolant inlet temperature remains unchanged between the point where it is measured (Pipe-1b in
Figure 1) and the beginning of the annular gap, the temperature changes due to friction or cross-section variations being considered as negligible;
The electrical power generated by the electrical heaters
() is uniformly distributed both axially and circumferentially, the heat flux nonuniformity due to the discreate nature of the heaters being smeared down within the Tube-2 wall. Thus, at a specific axial location along the gap, the heat transferred into the fluid can be estimated as: , where L (528.36 mm) is the total length covered by three heaters and x is the axial location measured from the start of the annular gap, while Qmeasured is the measured total power supplied by the three heaters.
The heat losses to the environment through the mock-up outer shell (Tube-4) are also uniform along this tube and can be estimated as:
λ: thermal conductivity of Tube-4 (steel 316L),
r1: radial location of either TC-6 or TC-8 (r1 = 74.65 mm),
r2: radial location of TC-2 or TC-4 (r2 = 84.15 mm).
The temperatures are measured as: is at TC-6 or TC-8 and is at TC-2 or TC-4.
Under these assumptions, the bulk temperature
Tf of the coolant can be estimated as:
where the heating rate,
Q(x) =
Qin(
x) −
Qloss(
x)
With the knowledge of the coolant bulk temperature and pressure, the thermal conductivity λf of the coolant can be obtained.
4.2. Correlations of Nusselt Number
Considering the available literature, it is noticeable that many researchers have investigated the convective heat transfer in an annular channel (passage), in order to derive reliable correlations for calculating the Nusselt number and the convective heat transfer coefficient for different flow conditions and geometries. Correlations of predicting the Nusselt numbers have been published for both the laminar and turbulent flow regimes. Nevertheless, correlations for calculating the Nusselt numbers of a flowing fluid in an annular channel during the transition flow regime are very rare in the literature. In the following sub-sections, some of the well-known and widely used correlations for calculating the Nusselt number of fluid flows in tubes and concentric annuli are presented.
4.2.1. Correlation of Gnielinski
The Nusselt number may be calculated using the following equation given by Gnielinski [
7]:
d: tube diameter,
L: tube length,
Pr: Prandtl number,
Re: Reynolds number.
The friction factor,
ε, was defined by Filonenko [
8] as follows:
For gases, the parameter K = (Tb/Tw )n.
Tb: bulk temperature,
Tw: wall temperature.
The exponent,
n, depends on the gas type, for example, it is 0.45 for air [
7].
4.2.2. Correlation of Dittus–Boelter
A well-known expression for the calculation of the Nusselt number for a turbulent flow in smooth tubes is that given by Dittus and Boelter [
9] as follows:
This correlation can predict the Nusselt number for both heating and cooling processes. The exponent of the Prandtl number is n = 0.4 for heating of the fluid and n = 0.3 when the fluid is being cooled. The correlation of Dittus–Boelter has been used to calculate the Nusselt number for a fully developed turbulent flow (Re ≥ 10,000) and Prandtl number range (0.6 ≤ Pr ≤ 100) in the smooth-surface circular tubes that have a large ratio of the tube length to inner diameter (L/d ≥ 60). This correlation is less accurate when used for applications with a large temperature difference between wall and fluid conditions or rough-surface tubes. For flows characterized by large properties variations versus temperature, a correction (such as a viscosity correction factor μ/μwall) must be considered.
4.2.3. Correlation of Foust and Christian
The Nusselt number was correlated by Foust and Christian [
10] as follows:
The annular diameter ratio (a) is defined as the inner diameter of the outer tube divided by the outer diameter of the inner tube. The correlation was derived for cases that have: (i) a diameter ratio range of 1.2 to 1.84, (ii) the use of water as a coolant, and (iii) a Reynolds number range of 3000 to 60,000.
4.2.4. Correlation of McAdams
The correlation of McAdams [
11] to calculate the Nusselt number is given as:
The ratio of the fluid bulk viscosity (μ) to the viscosity (μw) at wall temperature was introduced in this correlation. It is valid for the following conditions: (i) annular diameter ratio range of 1.18 to 6800, (ii) all mediums, and (iii) the Reynolds number range is not specified.
4.2.5. Correlation of Davis
The Nusselt number can be predicted with the following Davis [
12] equation:
In this correlation, the annular diameter ratio (a) is included to consider the effect of the geometric dimensions. The correlation can be used for cases with an annular diameter ratio range of 1.18 to 6800 and using any fluid. However, the Reynolds number range is not specified for the Davis correlation.
4.2.6. Correlation of Wiegand
The Nusselt number is given by Wiegand [
13] as:
It was recommended to use 0.2 for the value of n. The correlation may be implemented for tubes with the following conditions: (i) diameter ratio range of 1–10, (ii) fluids with viscosity equal to or less than two times the water viscosity, and (iii) the Reynolds number range is not specified. The ratio of viscosity of the bulk fluid to viscosity at the wall is included in this correlation to consider the variation of fluid properties with temperature.
4.3. Experimental and Correlations Nu Numbers
In this section, the experimental Nusselt (
Nu) numbers calculated from the current experimental measurements are compared with the
Nu values calculated by the relevant correlations presented in the previous section. As shown in the test matrix (
Table 1), the Reynolds (
Re) numbers are in the range of 2900 to 7400; therefore, the coolant flow belongs to the transition regime (zone) that lies between the laminar regime and the fully turbulent regime. This
Re range was selected based on the nominal
Re number in the annular channel of the HCPB blanket breeder zone, which ranges from 4000 to 5900 as given in reference [
4]. A wider range of
Re numbers was selected for the test matrix to cover any fluctuation in the mass flow rate in the HCPB blanket. The
Nu numbers are plotted versus the
Re numbers as shown in
Figure 10. The experimental
Nu number is the mean of five values (corresponding to five cases in each group of almost the same
Re number) and is plotted versus the mean of the five
Re numbers. The total uncertainty associated with both
Nu and
Re values is calculated and shown also in the figure. The total uncertainty consists of both the random and systematic uncertainties. Together with the mean values, the associated standard deviations (random uncertainties) were obtained. The standard deviations associated with the results are low and hence give an indication of the good conditions of steady state and reproducibility of the runs. The systematic uncertainties are the ones associated with the individual measurements such as temperature, pressure and mass flow rate.
The total uncertainty of
Nu numbers ranges from ±2.3 to ±2.8 (equal to relative uncertainty ±6.4% to ±12%) as shown in
Figure 10. The major contribution of this
Nu uncertainty comes from the relatively large uncertainty in calculating the temperature difference Δ
T (exists in the
Nu-calculation equations such as (2) and (4)), which is relatively small across the steel walls. This high uncertainty dominates, in fact, the overall uncertainty of the
Nu evaluation. The total uncertainty of
Re numbers ranges from ±17.9 to ±34.2, which are so small as to not appear in
Figure 10, where the
Re-axis values are in thousands. This
Re uncertainty is mainly due to the uncertainty in the mass flow calculation in addition to the small difference in the mass flow rate from one case to another in the same group. All correlations show linear increase in the
Nu numbers with the increase in the
Re numbers. The experimental
Nu numbers show a similar trend of almost linear increase with the increase in the
Re numbers. Compared to the other correlations, the correlation of Foust and Christian gives the best agreement with the experimental
Nu numbers. All other five correlations give
Nu numbers lower than the experimental ones.
There is a disagreement between the
Nu numbers (experimental and predicted by the Foust and Christian correlation) on one side and the
Nu values predicted by other correlations on the other side because these empirical correlations were derived based on: (i) experimental data produced by different experiments and levels of accuracy, (ii) a wide spectrum of the tubes/channels geometries, (iii) different flowing fluids with a wide range of fluid properties, and (iv) various mass flow rates and heating patterns. With such many variables, it is expected to have such discrepancies among the correlations. These discrepancies among the given
Nu correlations were also reported by Dirker and Meyer in a previous study [
14] where a
Nu-vs-
Re figure was shown with behaviors similar to those of
Figure 10. Nevertheless, the comparison with the above-mentioned correlations is useful and can work as a basis for a future derivation of an empirical correlation based on the experimental data from the current and future testing campaigns.


 ,
, 


