1. Introduction
The water-cooled lead–lithium (WCLL) breeding blanket (BB) is a candidate to become the driver blanket concept for the EU-Demonstration (DEMO) fusion reactor. Such a component is designed to accomplish three fundamental tasks for the reactor operation: tritium breeding for the system self-sufficiency, neutron shielding, and heat extraction. The blanket is foreseen to work at extreme conditions; therefore, its thermal–hydraulic performance must be studied in detail [
1]. Specifically, the BB cooling system must guarantee that the temperature is kept below 550 °C for the Eurofer structure [
2] and below 1300 °C for the tungsten armor [
3], while supplying the optimal coolant outlet temperature (around 328 °C for water at 15.5 MPa) at the primary heat transport system (PHTS).
The thermal–hydraulic feasibility and reliability of the WCLL BB layout have been assessed in the past through numerical simulations. Computational fluid dynamic (CFD) codes are often used for component-scale analyses, whereas for system-scale calculations, system codes are preferred.
In Ref. [
4], a CFD activity was carried out to investigate the optimal first wall (FW) cooling pipes configuration, referring to the equatorial WCLL elementary cell (or breeding unit) of the central outboard segment (COB) of a blanket sector. The same approach has been used in [
5] to analyze the influence of three different cooling tubes arrangements within the breeding zone (BZ) of the equatorial cell. In Ref. [
6], a theoretical–numerical technique based on the finite element method has been exploited to study the impact of the BZ cooling circuit layout, composed of bundles of double walled tubes (DWTs) on the thermo-mechanical behavior of the blanket structures. System-scale analyses of the BB have been carried out to characterize the primary cooling circuits’ thermal–hydraulic performance in both operational and accidental scenarios, using best-estimate system codes such as RELAP5 [
7] and MELCOR [
8].
In this work, the thermal–hydraulic features of the COB segment bottom-cap elementary cell are investigated. The numerical analysis presented in the following section is performed with the CFD code ANSYS-CFX v21.0 which is based on the finite volume method. The main objective of this activity is to characterize the performance of the FW and BZ cooling system configuration for an elementary cell that, owing to its poloidal position in the reactor, is considerably different from the reference equatorial OB cell both in terms of geometry and applied heat loads. The layout of the water channels is extrapolated from the most recent configuration of the equatorial cell (2018 V0.6) [
4,
5], scaled to take into account the differences in terms of geometry and power load deposition between the two components.
2. Geometry
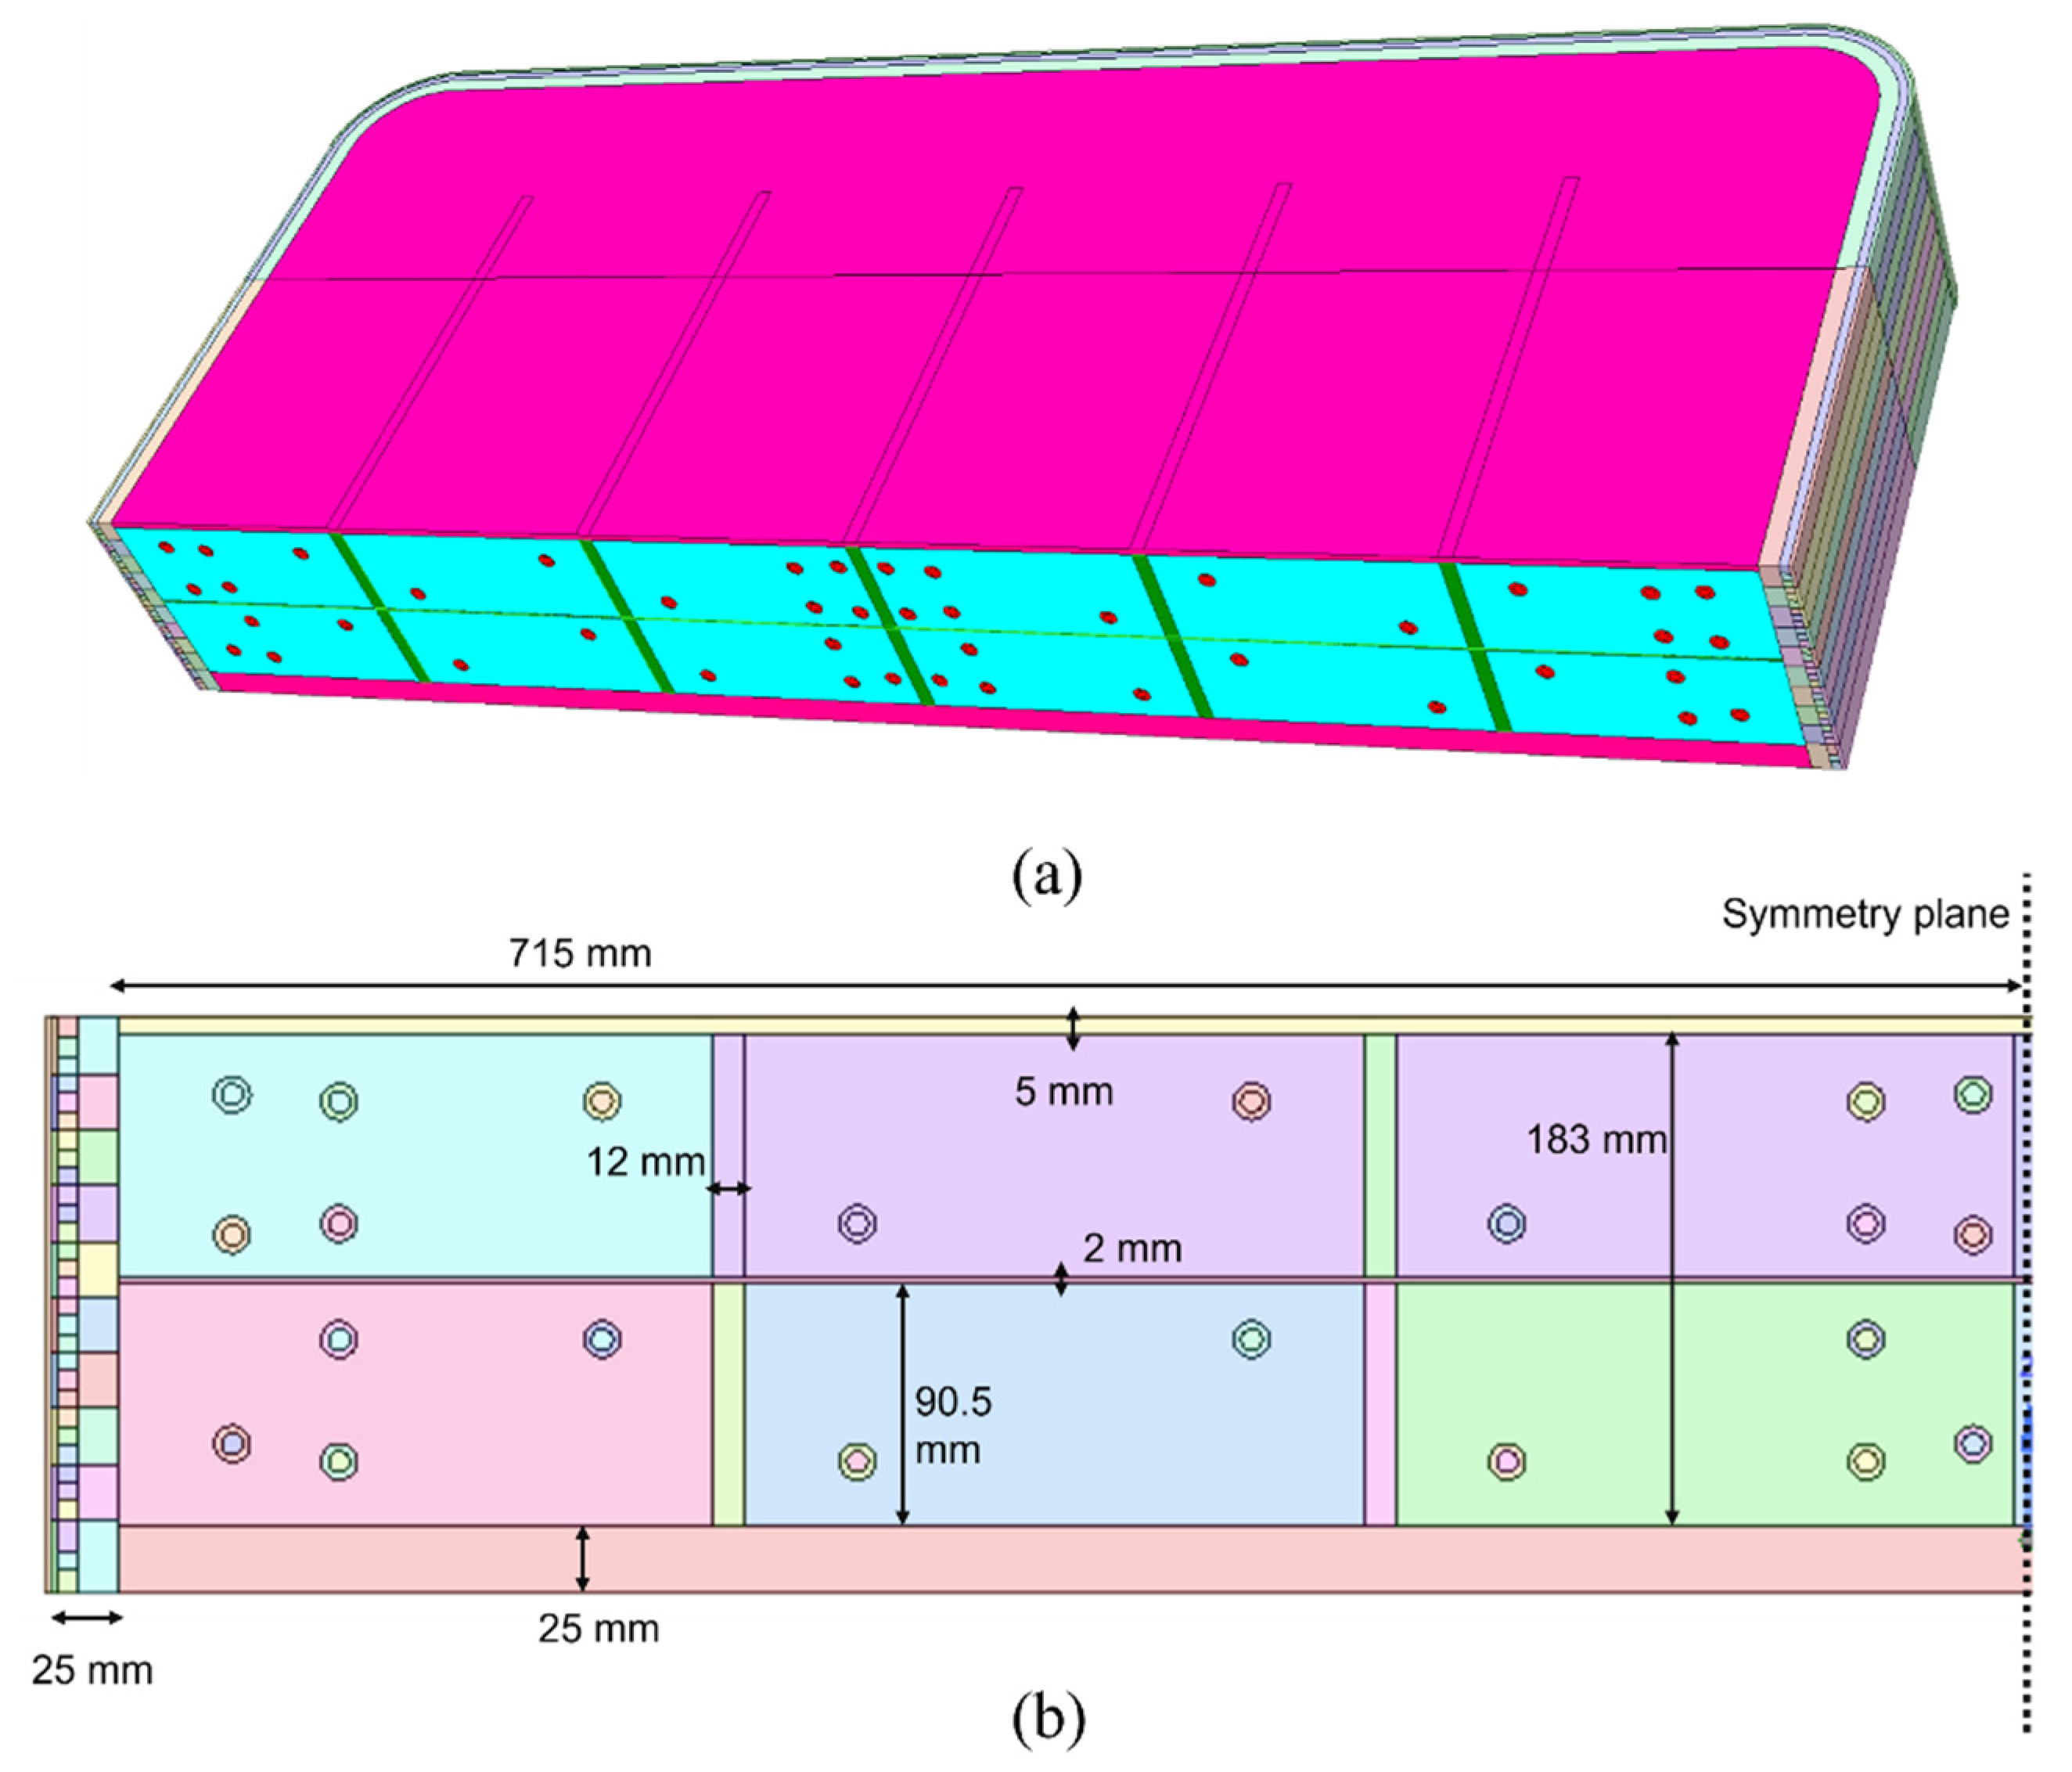
In
Figure 1, the elementary cell studied is depicted. In this study, the manifold and the back-supporting structure are not modelled since the heat load within such domains is foreseen to be negligible. The radial length of the cell stands at 584 mm and the total poloidal height of the domain is 216 mm, considering only the half thickness (5 mm) of the top plate which divides the bottom cell from the cell immediately above.
The total toroidal extension of the geometry is the same of the whole COB segment, i.e., 1480 mm. Within the cell domain, radial–poloidal stiffening structures (ribs) are placed along with a radial–toroidal baffle plate, which serves to convey the PbLi flow from the inlet to the draining manifold. The first wall is coated with a 2 mm-thick protective tungsten layer.
The FW cooling system consists of internal square channels (7 mm × 7 mm); their number and arrangement have been chosen after a preliminary numerical analysis that investigated the effect of various duct pitches on the maximum temperature occurring within the first wall domain, as described in
Section 4. Conversely, the layout of the BZ water channels is based on the configuration that has proven to be the most efficient for the equatorial elementary cell, namely the WCLL 2018 V0.6 [
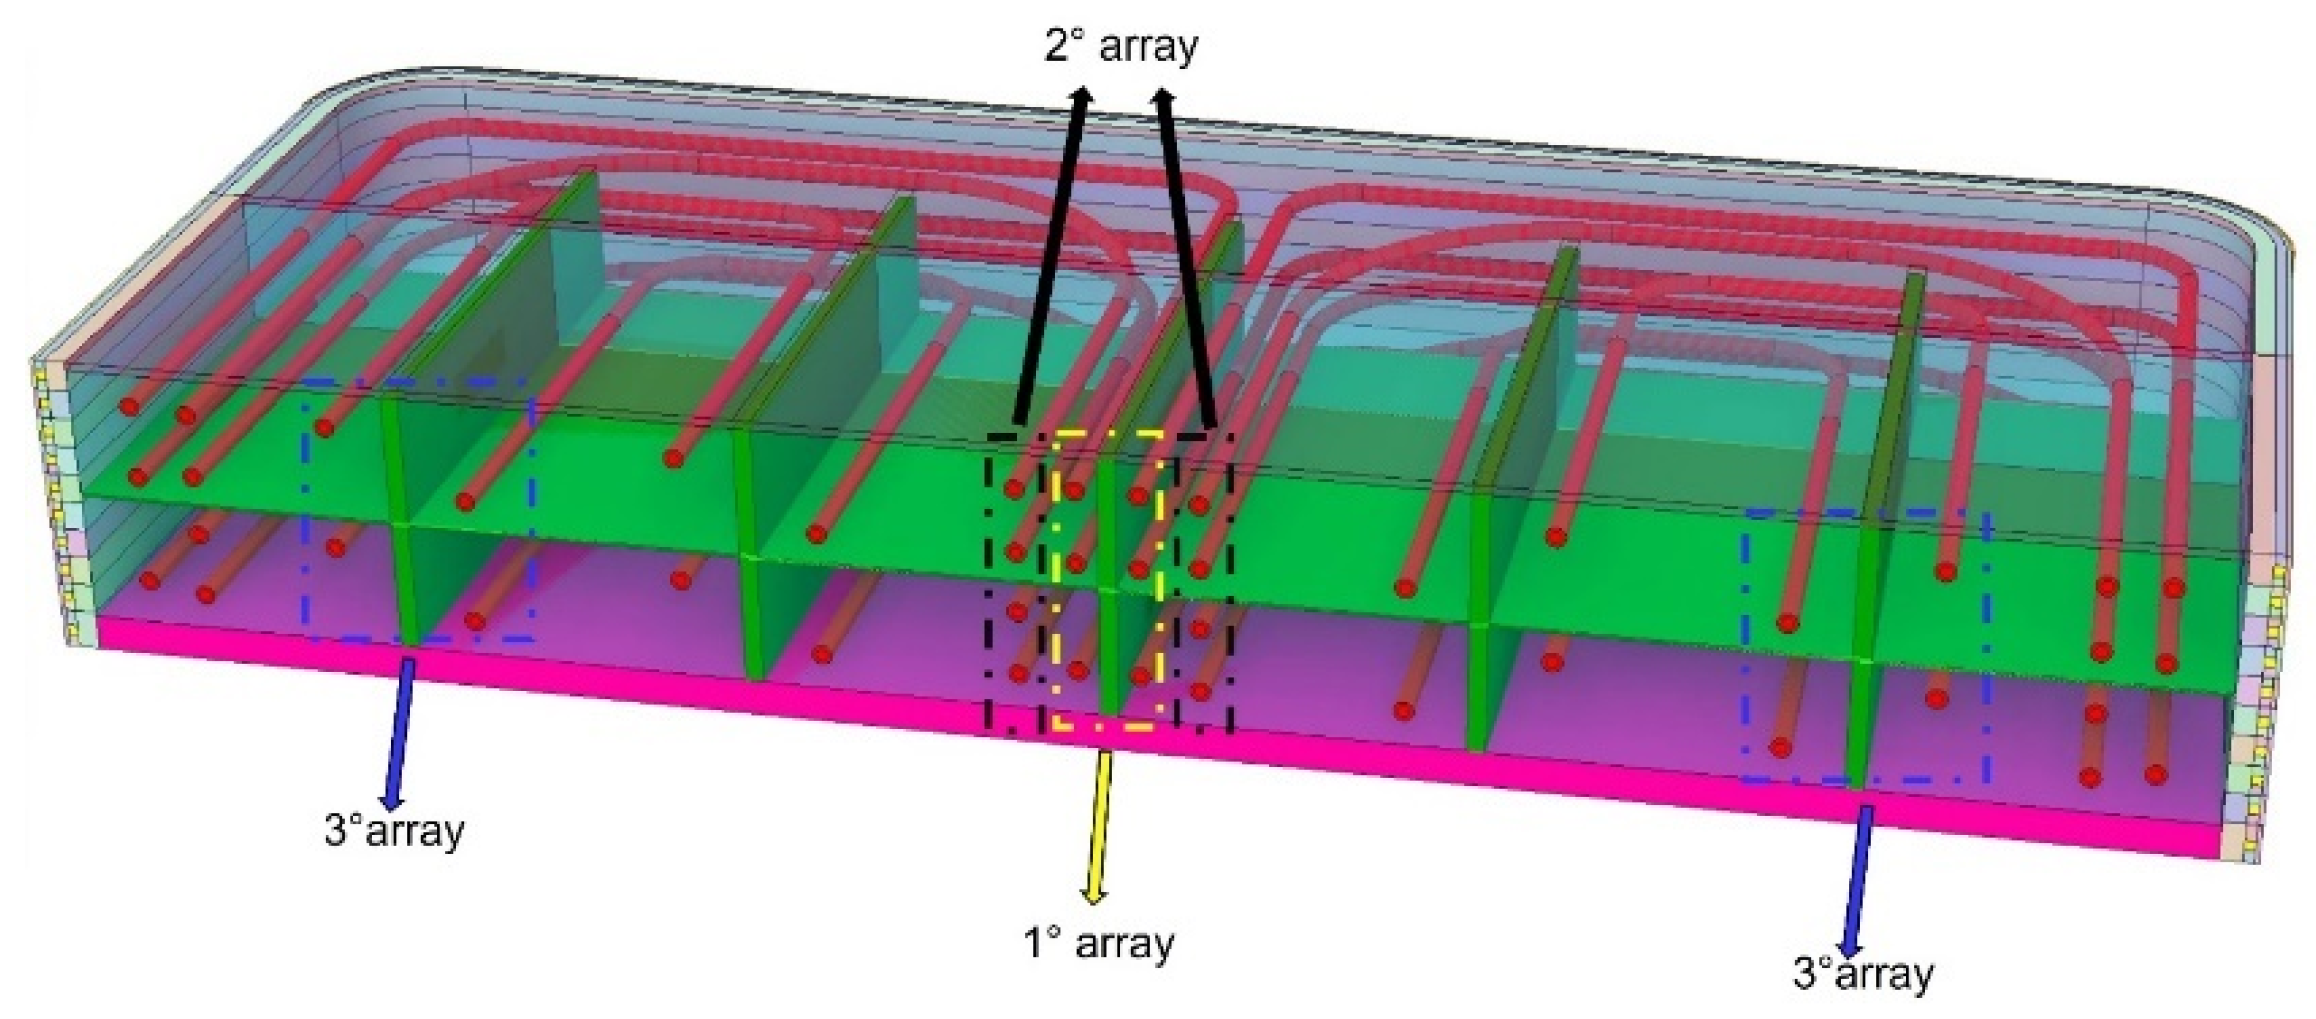
5]. The poloidal dimension of the bottom cell is, however, larger than the poloidal extension of the equatorial one. Consequently, the poloidal coordinates of the channels have been shifted while preserving the relative distances between the pipes and structures. The BZ cooling system is composed of 22 curved DWTs, with
8 mm and
13.5 mm (symmetrical with respect to the central radial–poloidal plane), which can be grouped in three different arrays depending on their total length and curvature ratio (
Figure 2). Moreover, the thermal–hydraulic assessment of the cell is carried out assuming the presence of a recirculation manifold that provides a water double-pass flow within the BZ (see
Section 3.3).
3. Numerical Model
3.1. Materials
The physical properties of all the materials modelled have been implemented in the ANSYS-CFX commercial code as either constants or temperature-dependent functions. For the latter, a polynomial fitting technique of table data has been used (see e.g., [
9,
10]). For the solid materials, the density, the specific heat, and thermal conductivity are specified, whereas the fluid materials also require the dynamic viscosity.
The material for the cell casing (FW together with top and bottom plates), the internal structures, and the BZ pipes is Eurofer, whose thermal properties’ correlations are reported in
Table 1 (see ref. [
11]). The cell is supposed to be filled with liquid PbLi, which is modelled as a solid instead, owing to the negligible advective heat transfer contribution ensured by MHD effects [
1], which allows reduction of the computational cost without unduly affecting the accuracy of the estimate.
The PbLi thermal properties are based on ref. [
10] and their correlations are collected in
Table 2. The thermo–physical properties of tungsten are assumed to have fixed values, since their gradient is found to be negligible over an extended temperature range (327–727 °C). More specifically, the typical operational temperature range of the tungsten armor is foreseen to be around 400–600 °C, where it is observed that the variation of the properties from the imposed value is less than 2%. The material thermal properties are reported in
Table 3 according to ref. [
12].
The properties of pressurized water, which is employed as a coolant for both FW and BZ, are reported in
Table 4. Those correlations derive from an enhancement version of RELAP5 Mod3.3 [
13,
14].
3.2. Thermal Boundary Conditions
The thermal loads that the cell must withstand are mainly caused by two sources: the surface heat load incoming from the plasma and the volumetric power source due to the neutron flux. The former is modelled imposing a constant heat flux (q″) at the outer surface of the armor. The neutron heating is represented with a volumetric power source term (q‴) both for PbLi and Eurofer. Volumetric heating in the coolant is negligible since the water volume of the cell is around 5% of the whole solid one.
A non-uniform heat load is applied on the whole FW armor layer surface, following the relation
. When
y = 27 mm, namely the radial coordinate of the tungsten layer external surface in the model, the maximum heat flux is supplied. Conversely on the side elbows of the armor, which extend up to 102 mm along the radial direction, the heat flux decreases linearly to simulate a progressively increasing distance between those parts of the tungsten and the plasma [
4,
5].
The value
qmax″ = 0.59 MW/m
2 is taken from [
15]. The top and bottom plate external surfaces are treated with a symmetry and an adiabatic boundary condition, respectively. The former is used to represent the adjacent BZ cells along the poloidal direction, whereas the second simulates the fact that the bottom cap is the terminal part of the segment. It is conceivable that an incoming heat flux decaying with the radial coordinate (similar to the one enforced on the FW armor) could be applied to the bottom plate, but such a modelling choice has been discarded for two reasons. First, a sharp decrease in the applied heat flux should be expected since the angle of incidence will be very small, effectively perpendicular to the plasma, thus resulting in a relatively limited amount of heat advected to the solid structure. Second, the component is expected to be, at least partially but effectively, shielded by the divertor baffle plate. In conclusion, the amount of heat flux directly applied on the bottom cap is likely to be negligible, compared with the one applied to the tungsten armor. It is also worth noting that the actual literature lacks references to accurately estimate this contribution. To define the
q‴ in each region, the volumetric power correlations for the OB equatorial cell (OB4) have been assumed to be linear with the neutron wall loading (NWL) and, since it holds true that NWL
OB7/NWL
OB4 ≈ 0.6, they have been accordingly rescaled [
16]. The correlations used for the
q‴ in solid materials (Tungsten/Eurofer and PbLi) are reported in
Table A1 and
Table A2 of the
Appendix A.
3.3. Hydrodynamic Boundary Conditions
Power removal is ensured by the two distinct FW and BZ water coolant circuits. For the present steady-state analysis, the reference water thermodynamic cycle is assumed by the balance of plant (BoP) requirements for the PHTS [
9,
17]. The cycle, based on PWR conditions, foresees water at 15.5 MPa entering at 295 °C and exiting at 328 °C. The water mass flow rate (MFR) boundary condition, both for the FW system and the BZ system, is imposed to guarantee the enthalpy balance, i.e., Δ
h = 193.6 KJ/Kg, using the water physical properties specified in
Section 3.1. For the FW cooling circuit operated in counter-flow conditions, a total mass flow rate of 1.34 kg/s is considered (see
Figure 3). A turbulent regime is hence enforced, with a Reynolds number Re ≈ 2.2 × 10
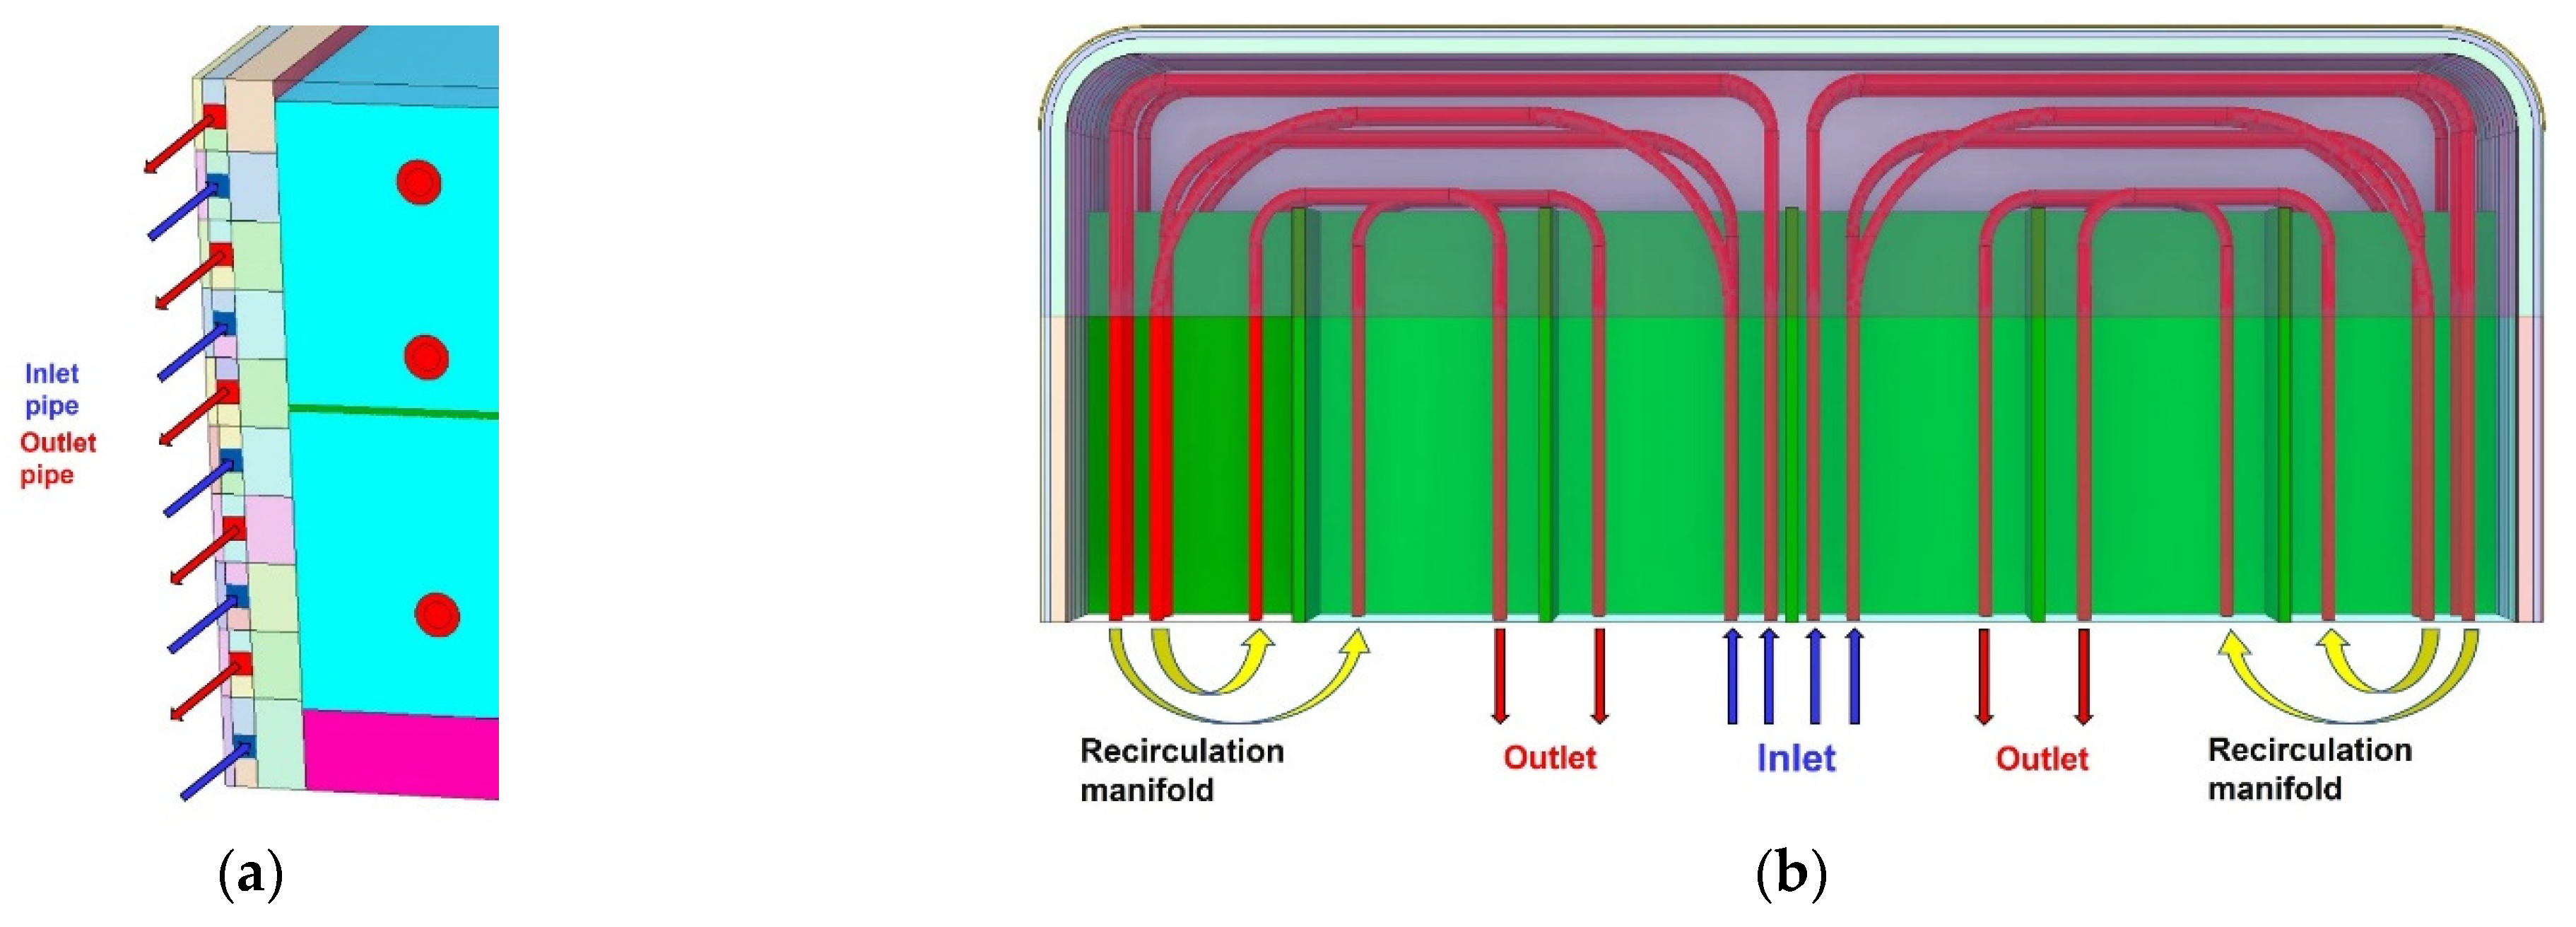
5. In the BZ cooling system, the water is forced to pass twice within the PbLi domain, to simulate the presence of a recirculation manifold [
5]. In such a configuration, the water inlet is located at the central region and includes the DWTs of the first and second arrays and, consequently, the coolant leaves the breeding zone close to the sidewalls; here, it is collected by the recirculation region before re-entering the breeding zone. Thus, for the second pass in the third tube array, the water flows in the opposite direction, from the side walls to the central region. The imposed total MFR at the inlet is 0.656 kg/s with a consequent average Reynolds parameter Re ≈ 1.5 × 10
5.
The turbulence model adopted in the whole water domain is shear stress transport; for all the outlet surfaces, the relative pressure value of 0 has been enforced. The inlet water temperature for the recirculation region (array n° 3) is set equal to the average outlet temperature of the first and second pipes’ arrays.
It is worth underlining that the mass flow rates have been evaluated after a quasi-iterative process. The first attempt MFR values have been calculated with an analytical method, using the information about the thermal loads of the cell. The first calculation, led with those preliminary BCs, showed that the mass flow rate chosen yielded a water outlet temperature that was slightly higher than the design value for the FW (≈331 °C) and lower for the BZ (≈318 °C). These preliminary outcomes, however, also provided a more realistic picture of the temperature field and the power deposition involved; hence, those data have been used to refine the analytical MFRs to obtain the final values reported above.
3.4. Mesh Grid and Solver Settings
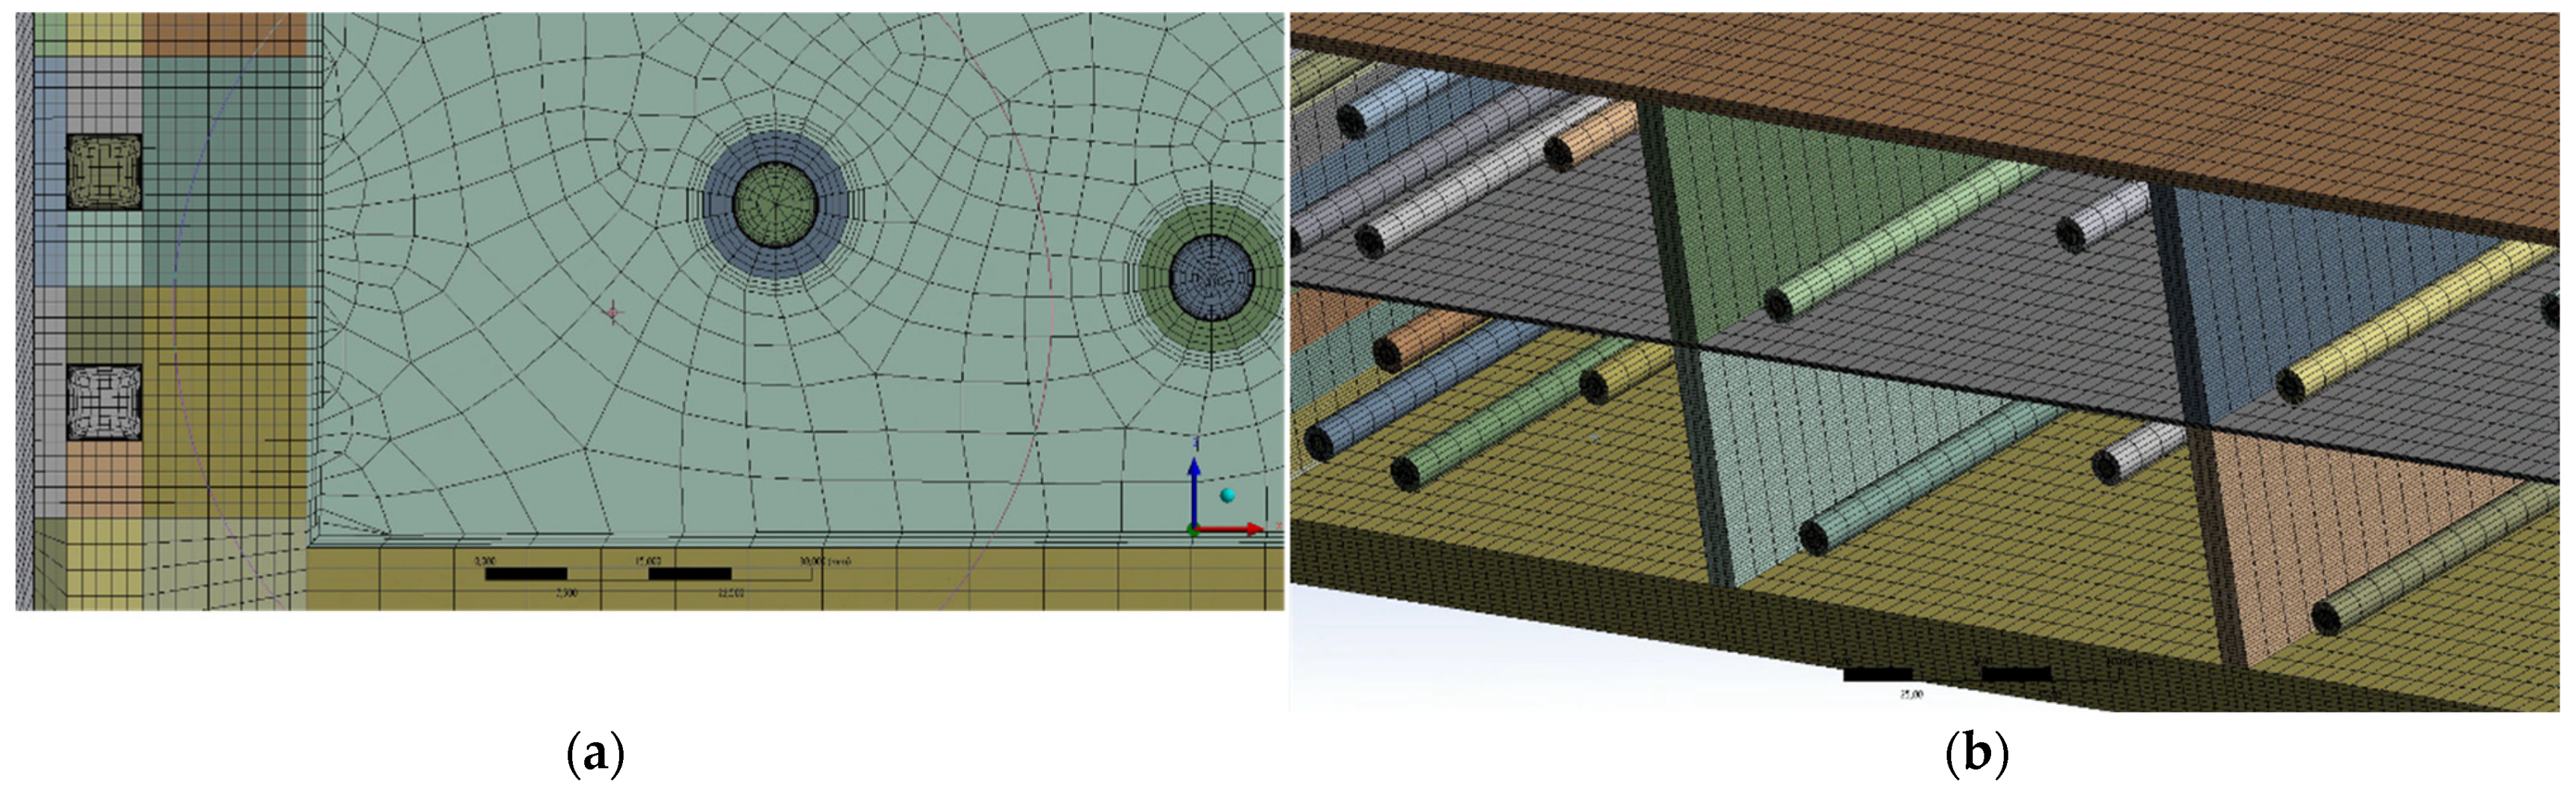
The bottom cell is treated as a single part so that a conformal mesh between domains can be computed. Using many local controls, the grid has been kept as structured as possible and it is mainly composed of hexahedral elements; tetrahedral elements are however generated to resolve the grid connection between straight and curvilinear edges.
To properly characterize the turbulent flow within the water pipes, an inflation control is applied near the solid walls for the resolution of the viscous sub-layer (y ± 1), based on a maximum velocity of 7 m/s. An additional inflation layer (three elements) is provided at the interface between Eurofer and PbLi to deal with the discontinuity of thermal conductivity between the domains. The total count of mesh elements is circa 1.3∙10
7. In
Figure 4 some details of the adopted grid are depicted.
A grid sensitivity analysis has been previously performed on the base model, as described in detail in Ref. [
4]. The fluid domain mesh has been optimized studying the variation of the heat transfer coefficient with y
+ parameter. Independently, the grid resolution for the solid parts has been fine-tuned enforcing a constant y
+ and considering the effect of an increasing elements counts on the temperature values of the whole model.
The built-in high-resolution scheme is used for the discretization of the momentum and energy equations. The convergence of the calculations is controlled monitoring the most relevant parameters for the study case, e.g., the temperature field in solid and fluid regions. The simulation is considered completed when the residuals of the balance equations are lower than a threshold value of 10−7.
4. First-Wall Channel Configuration
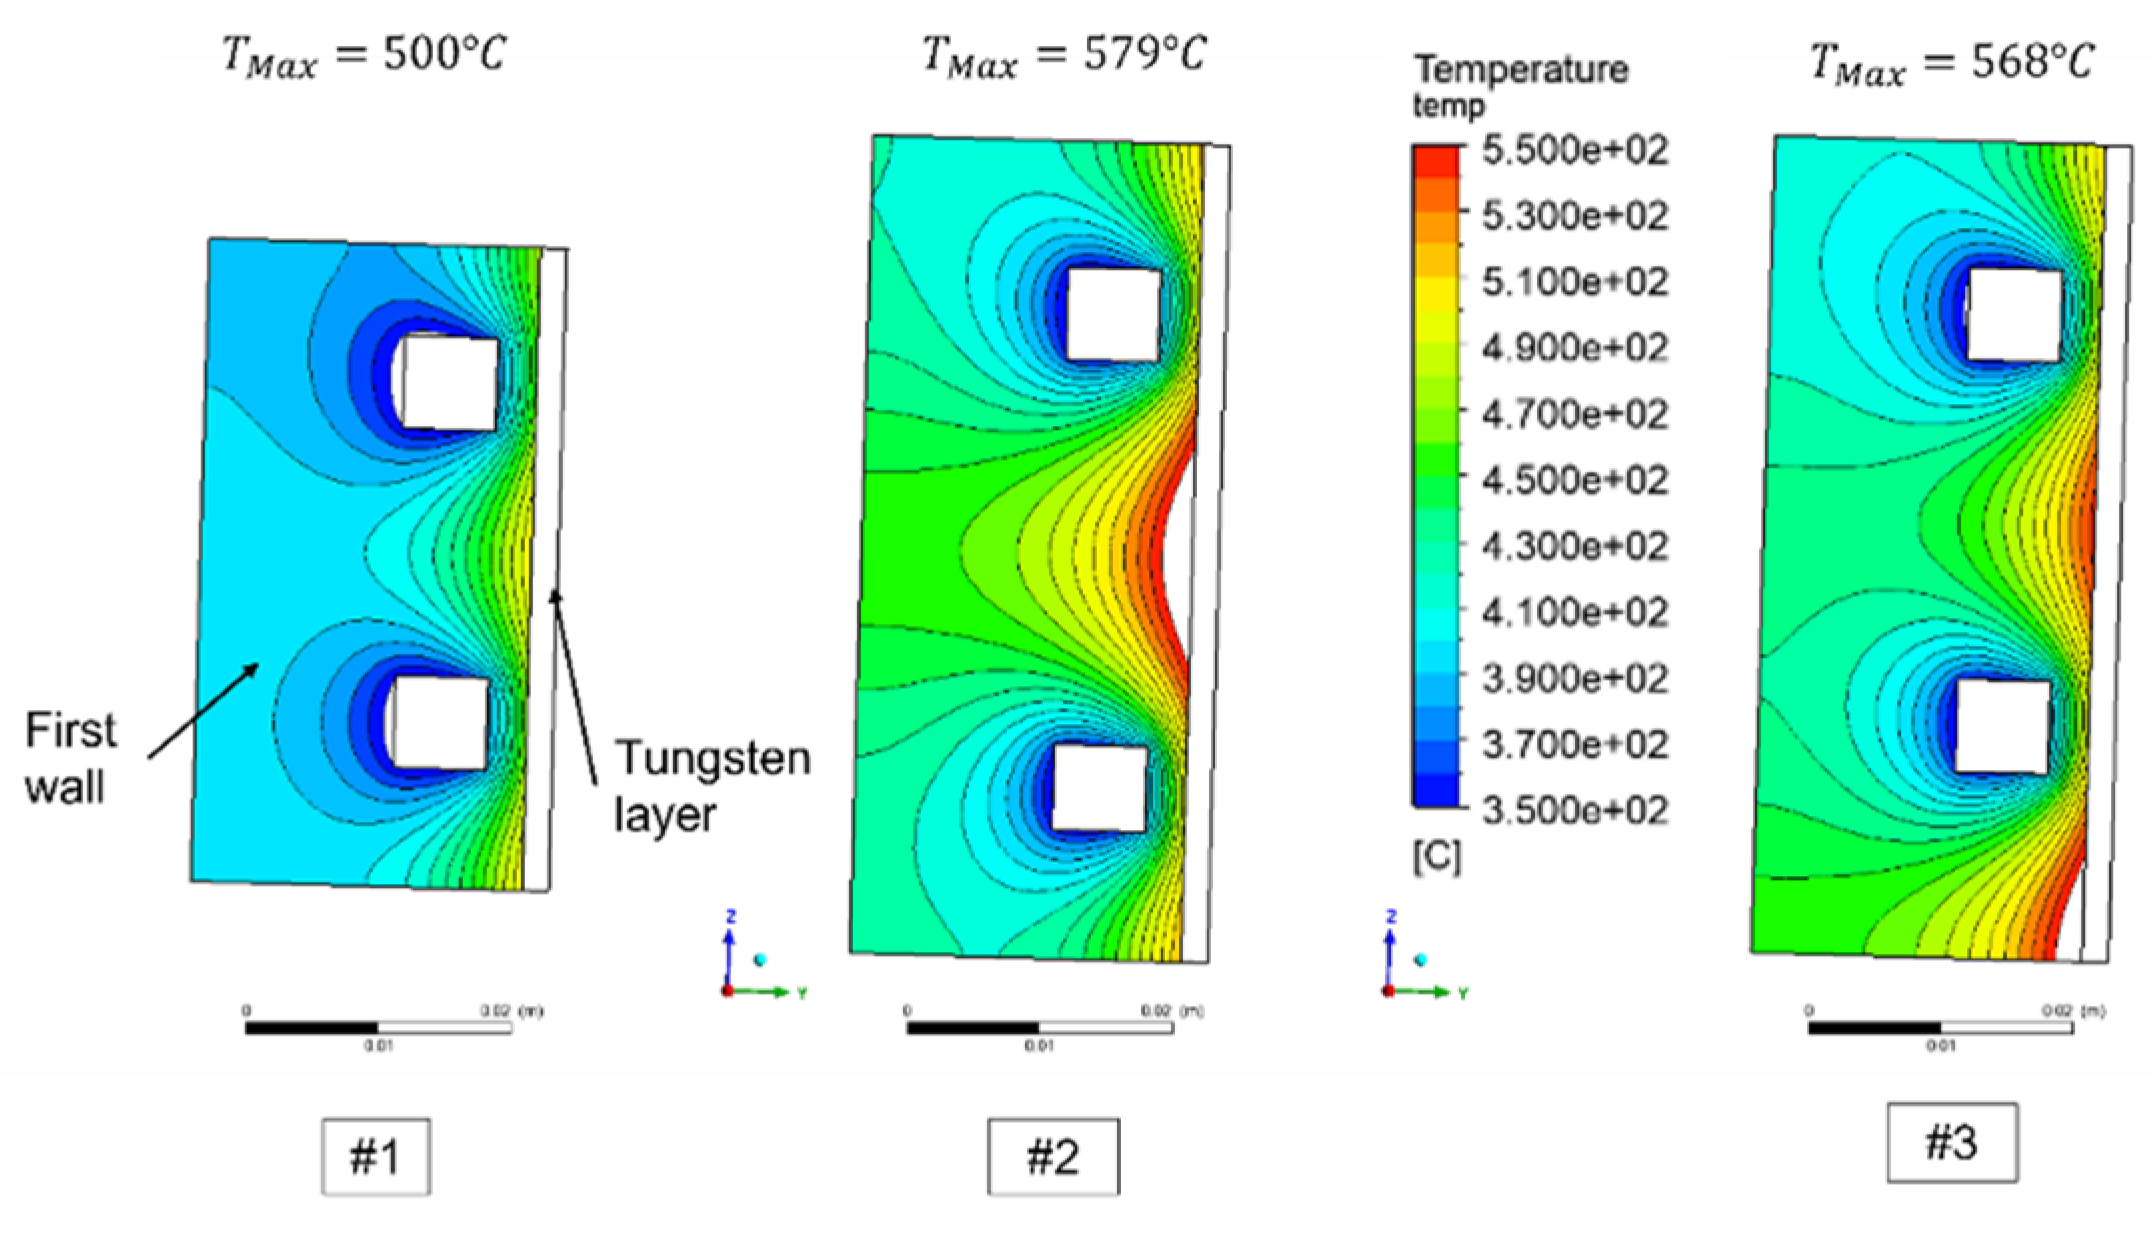
A dedicated set of 2D calculations have been performed to evaluate the thermal–hydraulic performance of the FW cooling system configuration for the bottom OB cell, optimizing the pitches among the channels and proposing an ad hoc channel spacing to ensure good refrigeration of the bottom cap. Note that for this activity, only two channels have been modelled, namely the channel that is the closest to the bottom plate and the one immediately above. All the initial and boundary conditions mirror the ones adopted for the whole cell (see
Section 3). Three candidate layouts have been chosen and their features are reported in
Table 5It is clear from
Figure 5 that a FW cooling system layout featuring 10 channels, with a constant pitch
p = 20.825 mm and the last channel shifted downward to improve the bottom cap refrigeration (
p′ = 25.65 mm), is the only one that can guarantee a proper structures’ refrigeration.
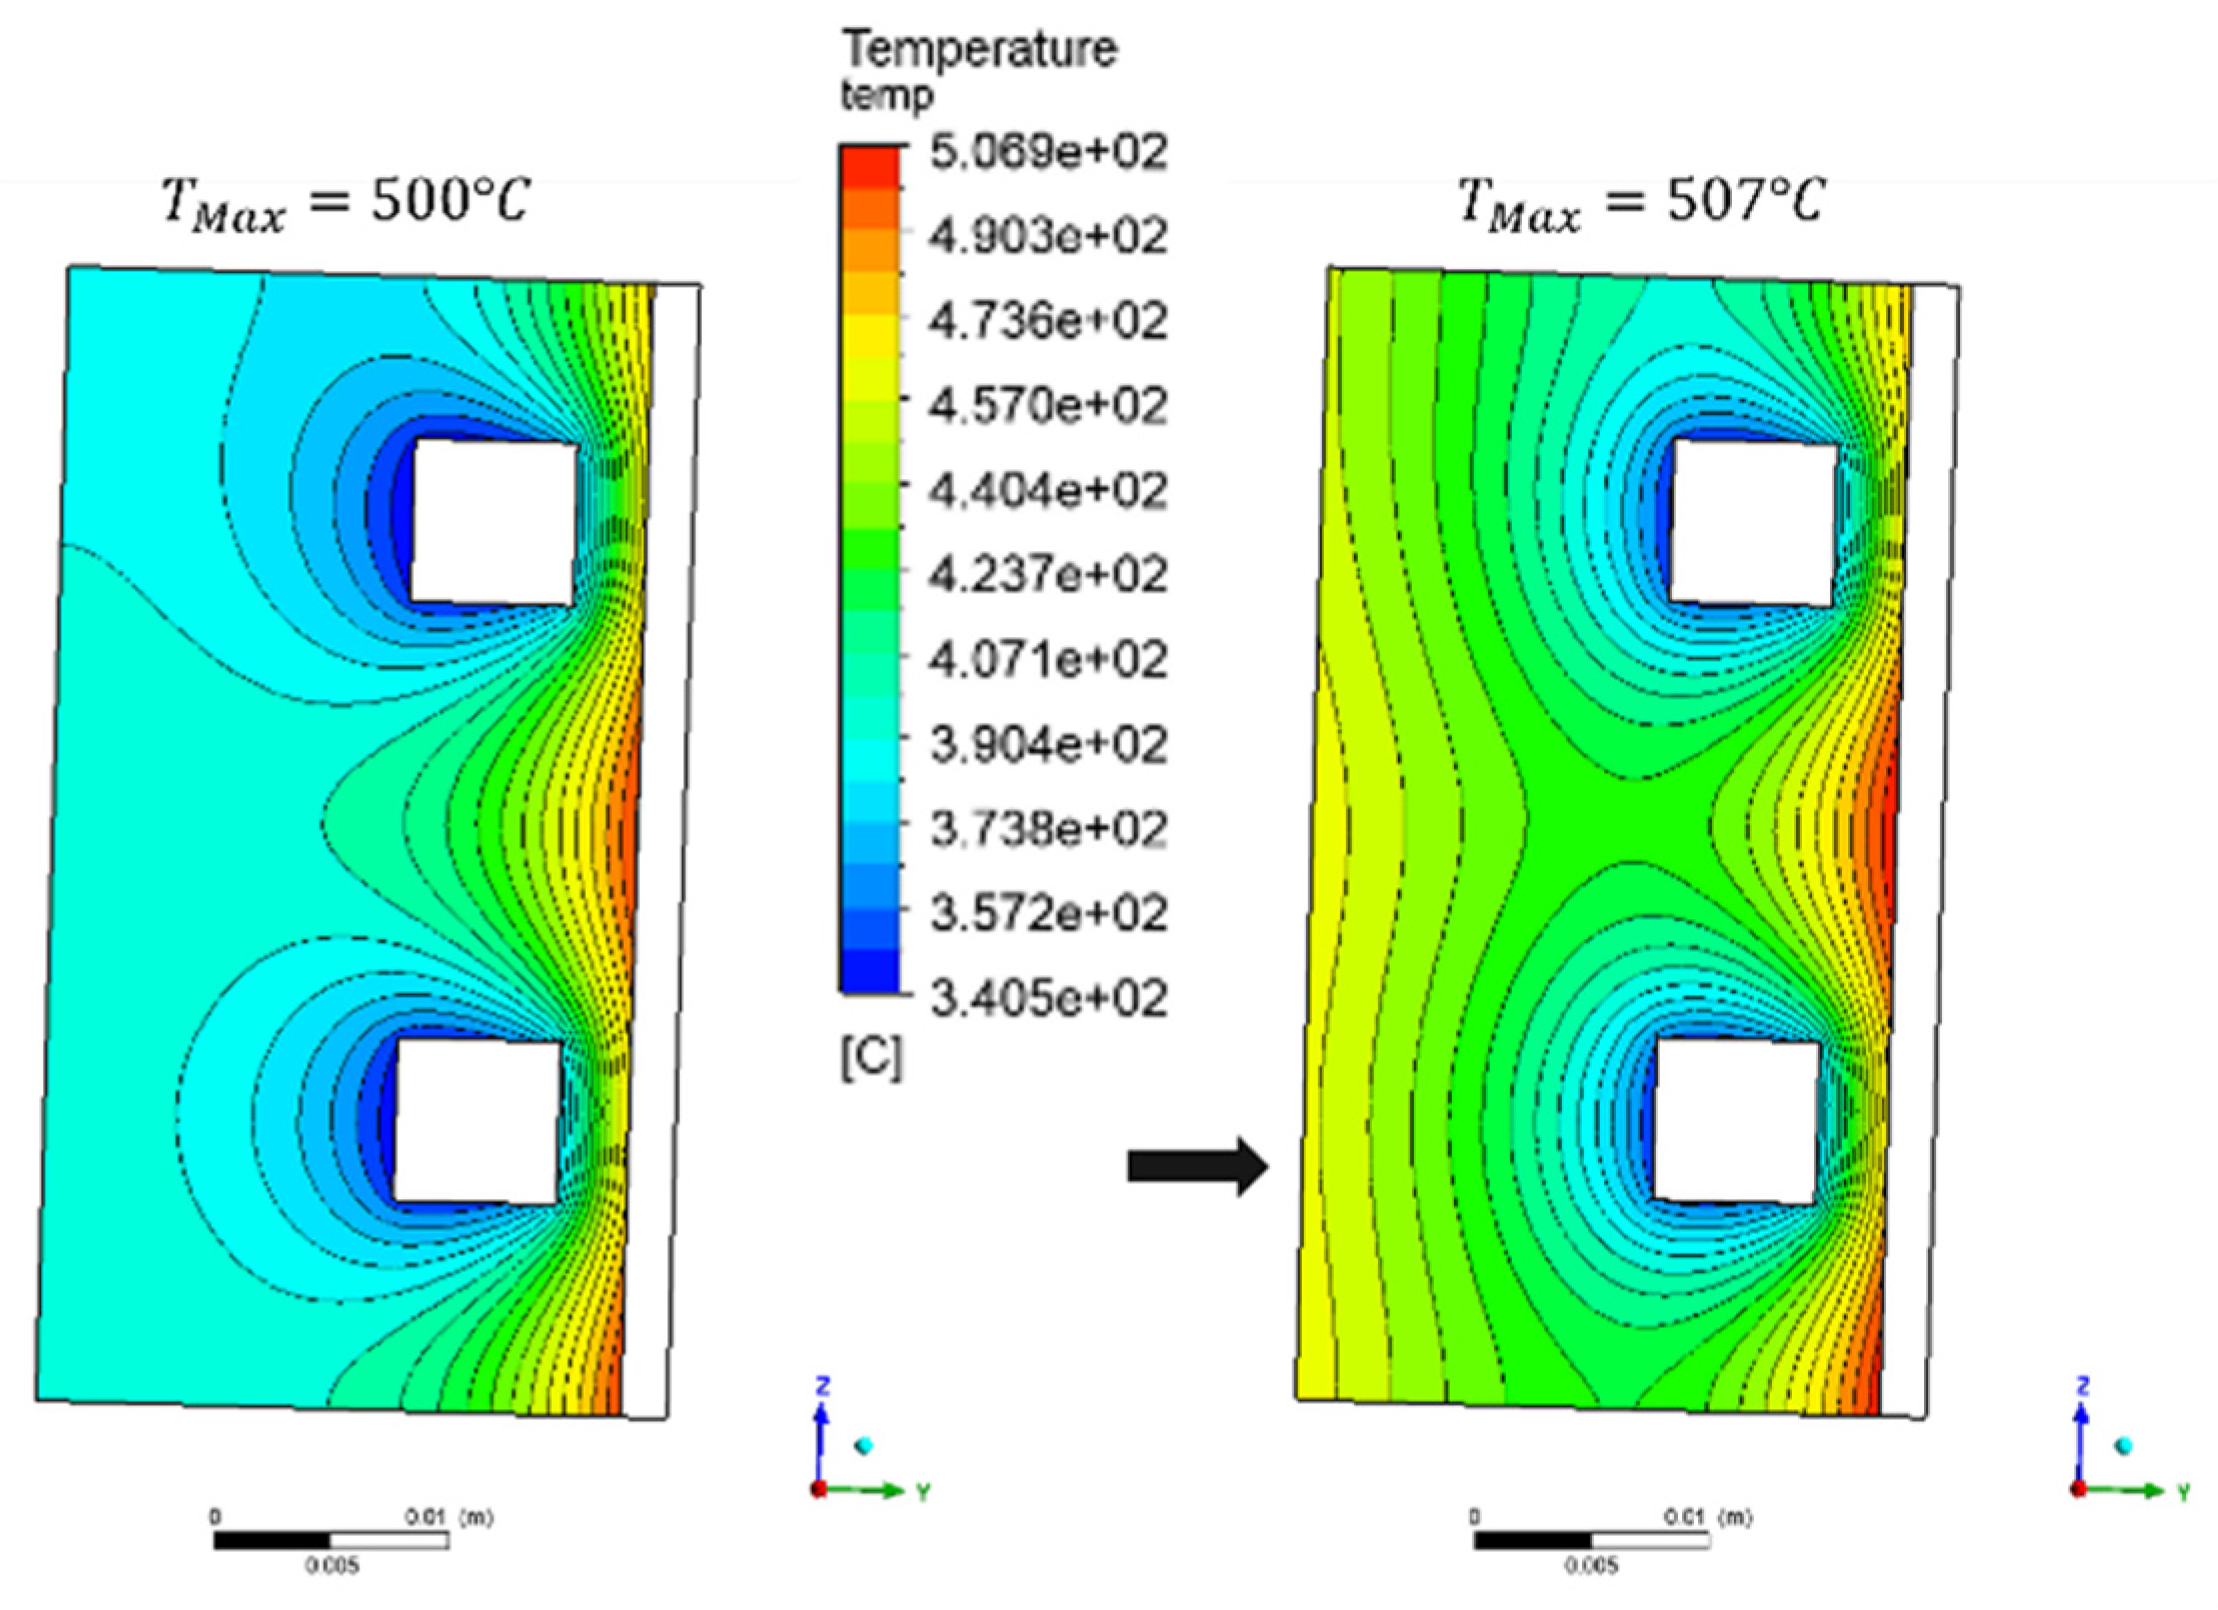
To further substantiate the latter FW configuration, it has been tested considering that it could also remove a fraction of the heat power deposited within the BZ. For this reason, an incoming heat flux q″BZ = 100 kW/m² is assumed. This boundary condition is considered conservative for two reasons. First, this value has been suggested for the equatorial OB cell, where the volumetric heating is circa 64% higher than in the bottom cell, however. It is reasonable to presume that, given the larger surface heat flux, the incoming heat flux from the heated PbLi in the BZ should also be lower. Second, the heat flux has been applied to the entire bottom surface of the model, whereas in reality, the lower part of the model lies within the bottom cap thickness, therefore one should expect significantly lower heat flux in that region.
In
Figure 6, the temperature distribution without and including an incoming heat flux from the BZ is shown.
The effect of the incoming heat flux on the rear part of the model is significant with an increase of circa 80 °C for the average temperature there. The increment of the maximum temperature is much more moderate though, with a maximum temperature equal to 507 °C. Therefore, the FW channels layout #1 has been adopted for the whole cell thermal–hydraulic calculations.
5. Results and Discussion
Once the reference FW layout was selected, the CFD analysis of the elementary cell hosting the bottom cap was carried out. The most relevant parameters of the numerical analysis are reported in
Table 6. It can be noted that no operational temperature constraints are exceeded with the adopted cooling system layout.
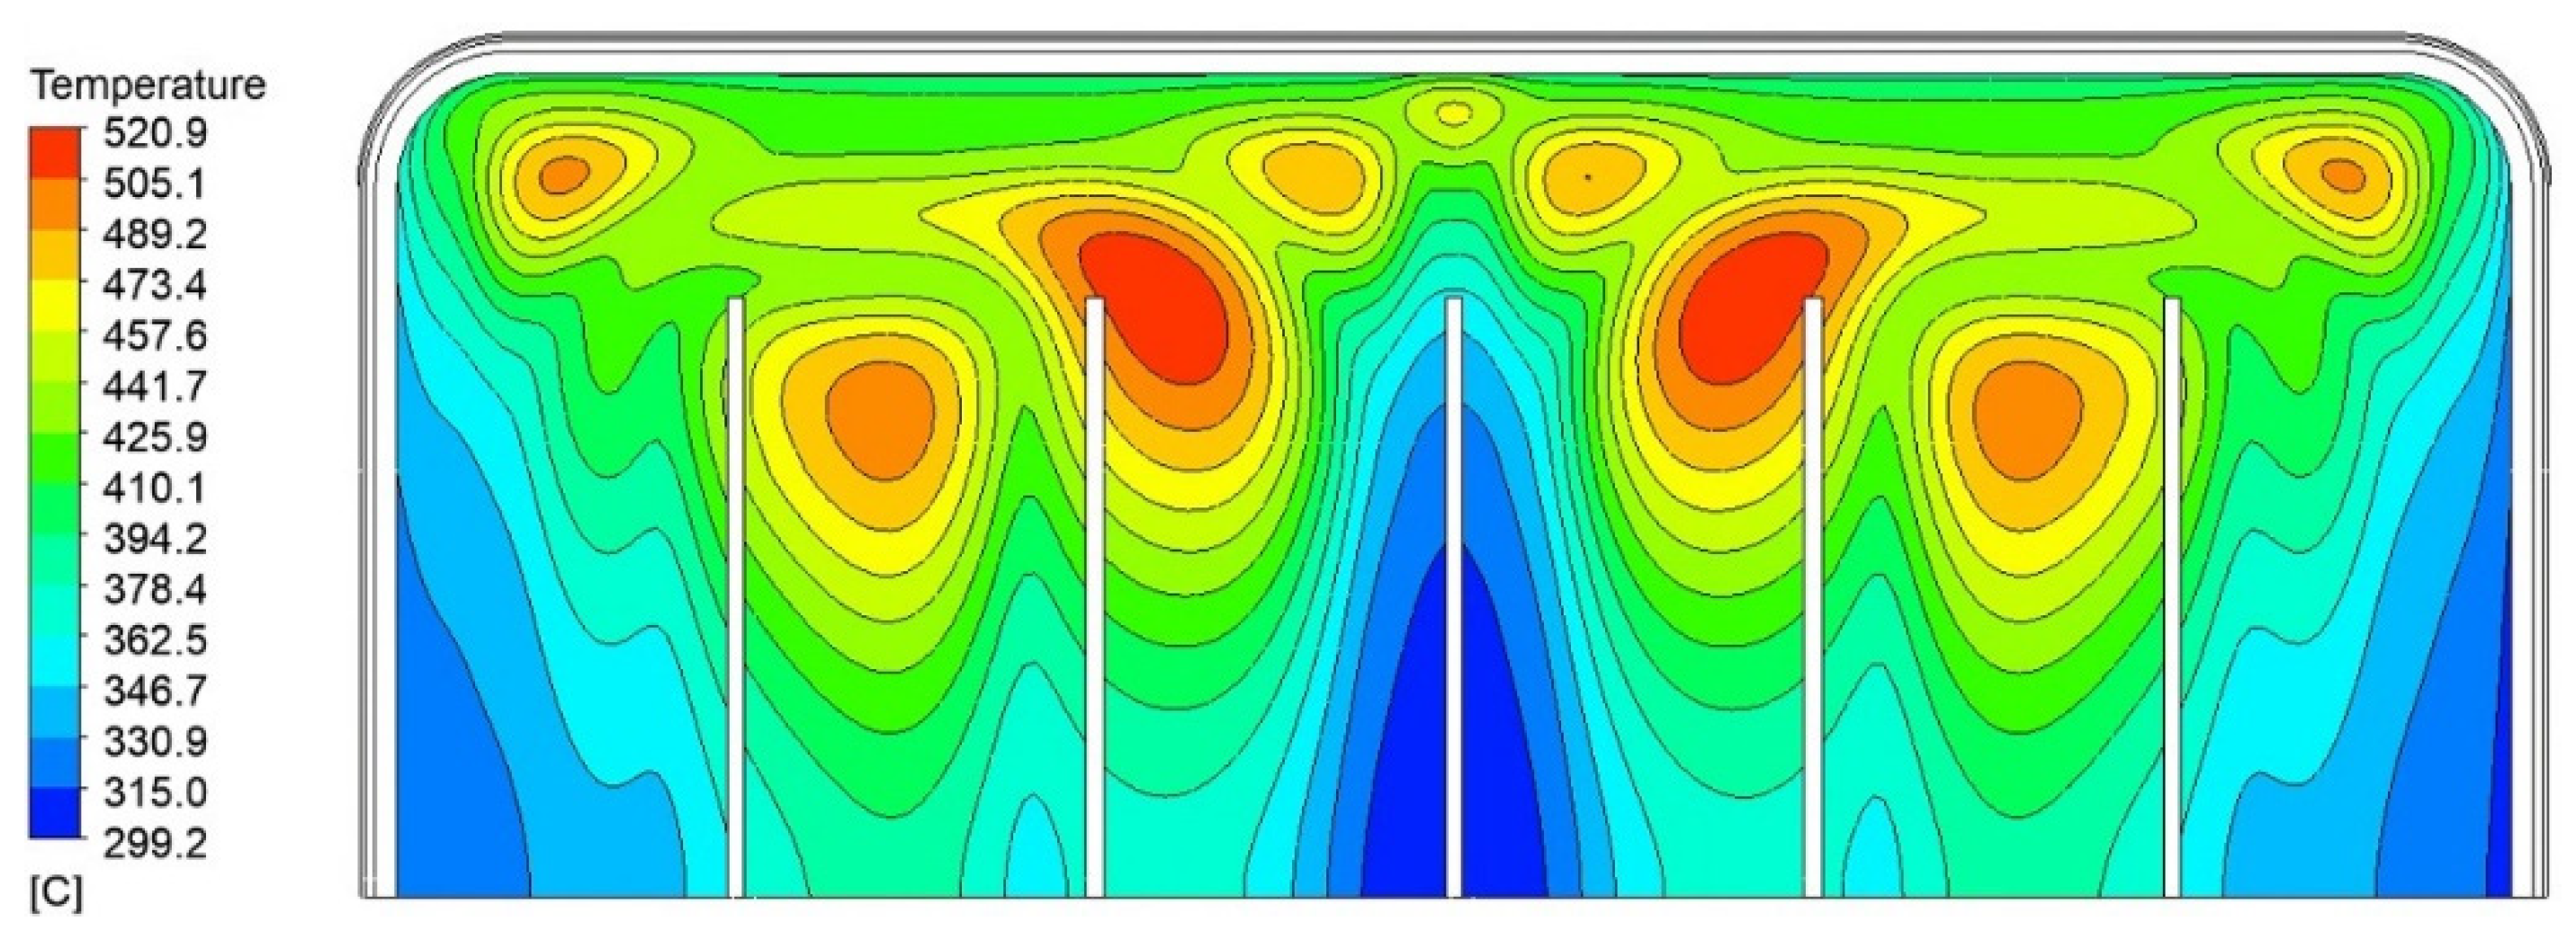
For what concerns the solid regions, the maximum temperature value within the Eurofer domain, 520.9 °C, occurs at the interface between the PbLi and the top radial–toroidal plate, as shown in
Figure 7. The bottom cap plate is colder, with a maximum temperature of 510 °C, hence demonstrating the efficacy of the optimized FW channels’ distributions discussed in
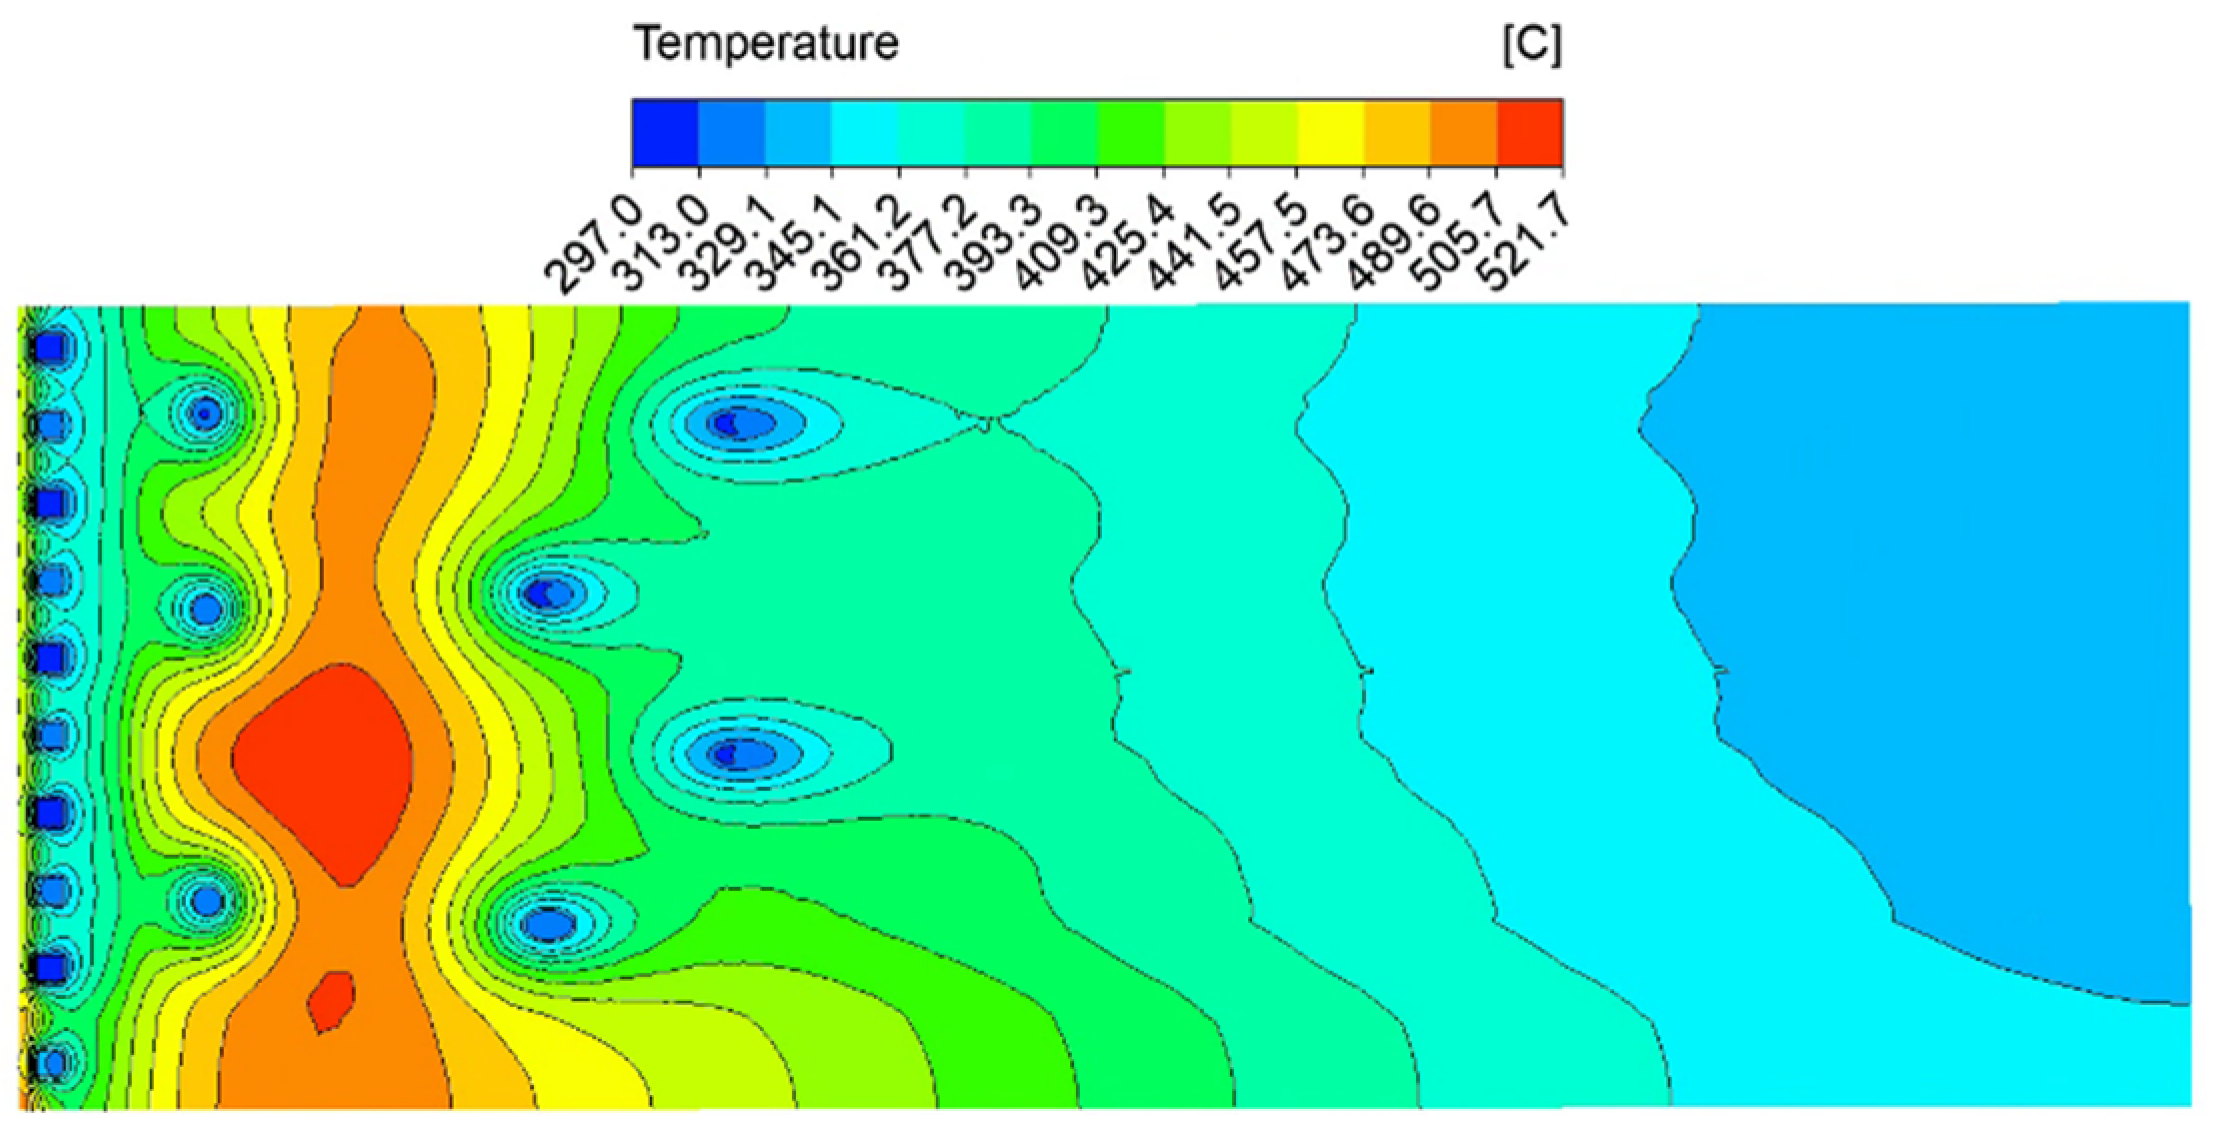
Section 3. The hot spot in the PbLi domain is located in the region between the first/second tubes array and the third array, with the highest temperature value around 522 °C (see
Figure 8).
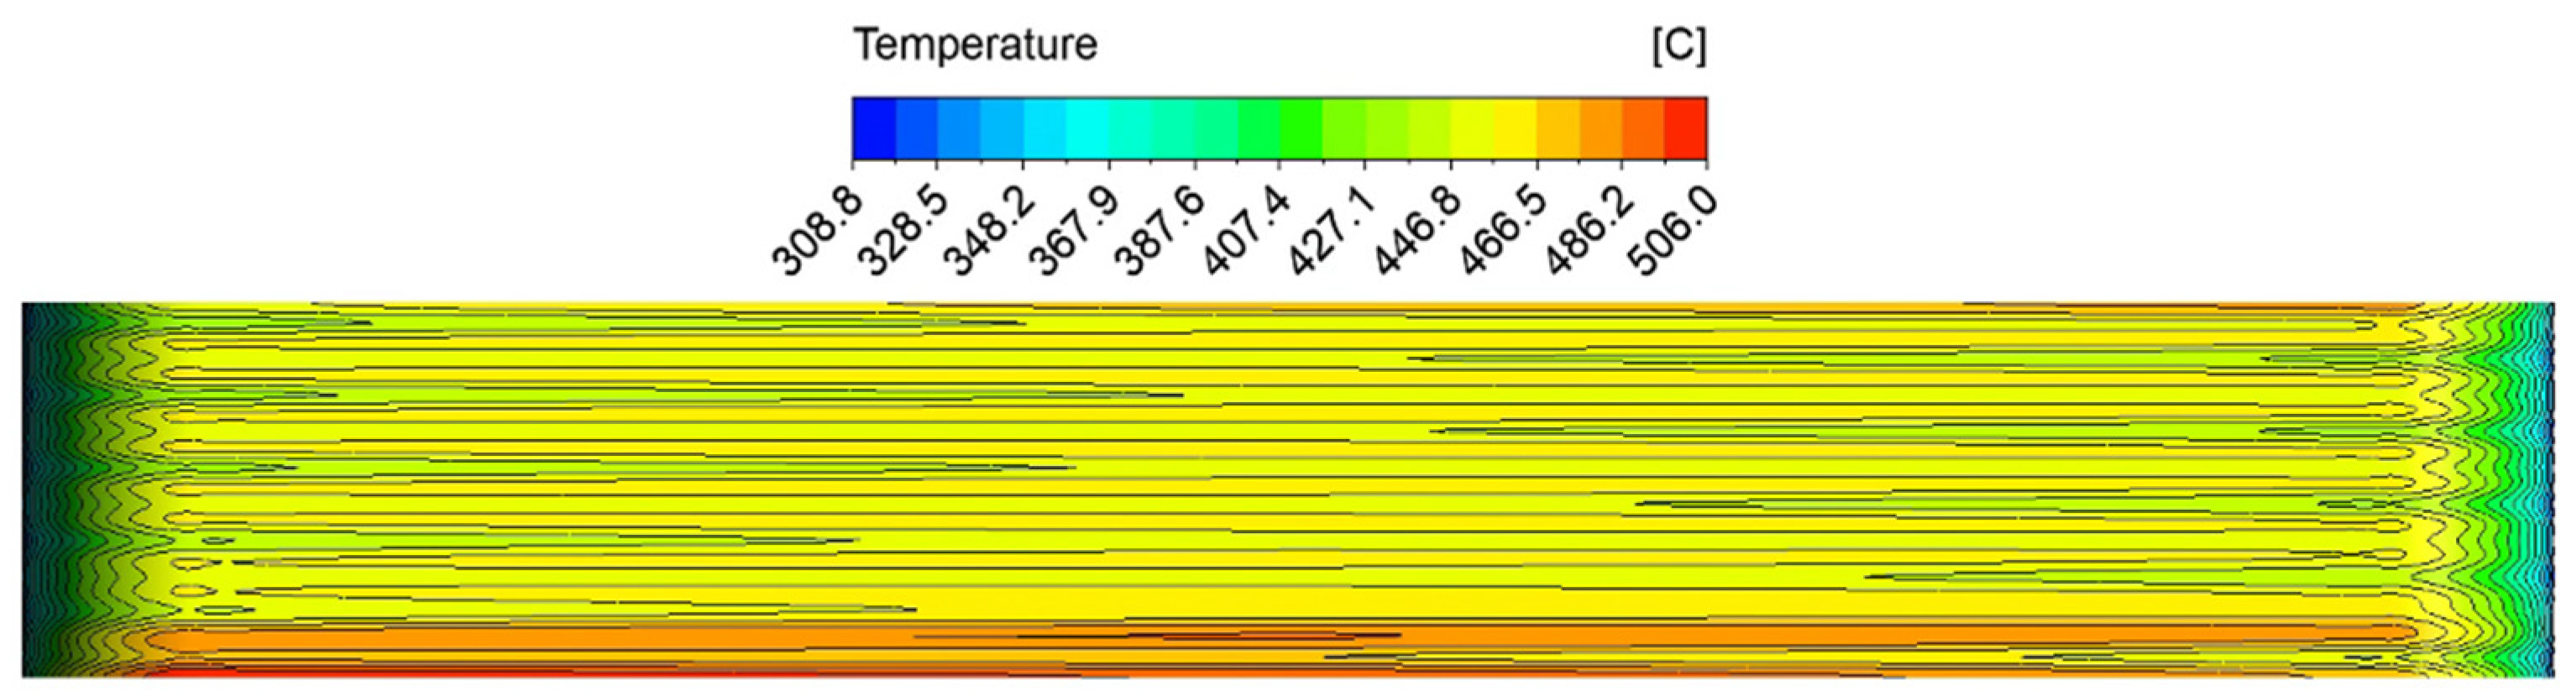
The tungsten armor hot spot (506 °C) arises in the bottom area, before the second elbow, as shown in
Figure 9. This is due to the fact that the shifted FW channel alone is responsible for the cooling of that area, without a counter-current channel below.
The average water temperature at the exit of the FW is 327.3 °C, whereas at the exit of the second BZ loop, the average temperature of the coolant is 328.4 °C. Therefore, the imposed mass flow rates satisfy the PWR operational thermal conditions.
It is worth noting that the maximum water temperature for both the FW and BZ circuit exceeds the saturation temperature (344.8 °C at 15.5 MPa), with the temperatures being 378 °C and 348.7 °C, respectively. Local nucleate boiling should be expected which is not observed in CFX thanks to the numerical model being limited to a “single-phase” state. On the other hand, larger heat transfer coefficients available in the nucleate boiling regime are going to reduce the maximum temperature locally.
The possible occurrence of a thermal crisis within the coolant system has been evaluated. For horizontal tubes and high flow rates, according to Ref. [
18], the critical heat flux (CHF) can be predicted using the correlation
The parameter
varies with the Froude number
, where
is the total mass flux (kg/m
2 s),
ρ is the density of the saturated liquid at 15.5 MPa (kg/m
3),
is the gravity acceleration (m/s
2), and
corresponds to the diameter of the tube (m);
is the correlation for the vertical channels subjected to the same heat flux. The value of the coefficient
is calculated from Fr using the relation:
≤ 1. The coefficient value is bounded at
, so if the calculated
is greater than 1, then is discarded. The bounded value is also adopted if
. For the present study,
= 286.7 hence
, whereas for the breeding zone
= 29 and
. The Tong’s correlation [
19] has been adopted to evaluate the
q″
CHF,Ver. The resulting CHF for the horizontal channels are
q″
CHF,BZ = 2.11 MW/m² and
q″
CHF,FW = 3.04 MW/m².
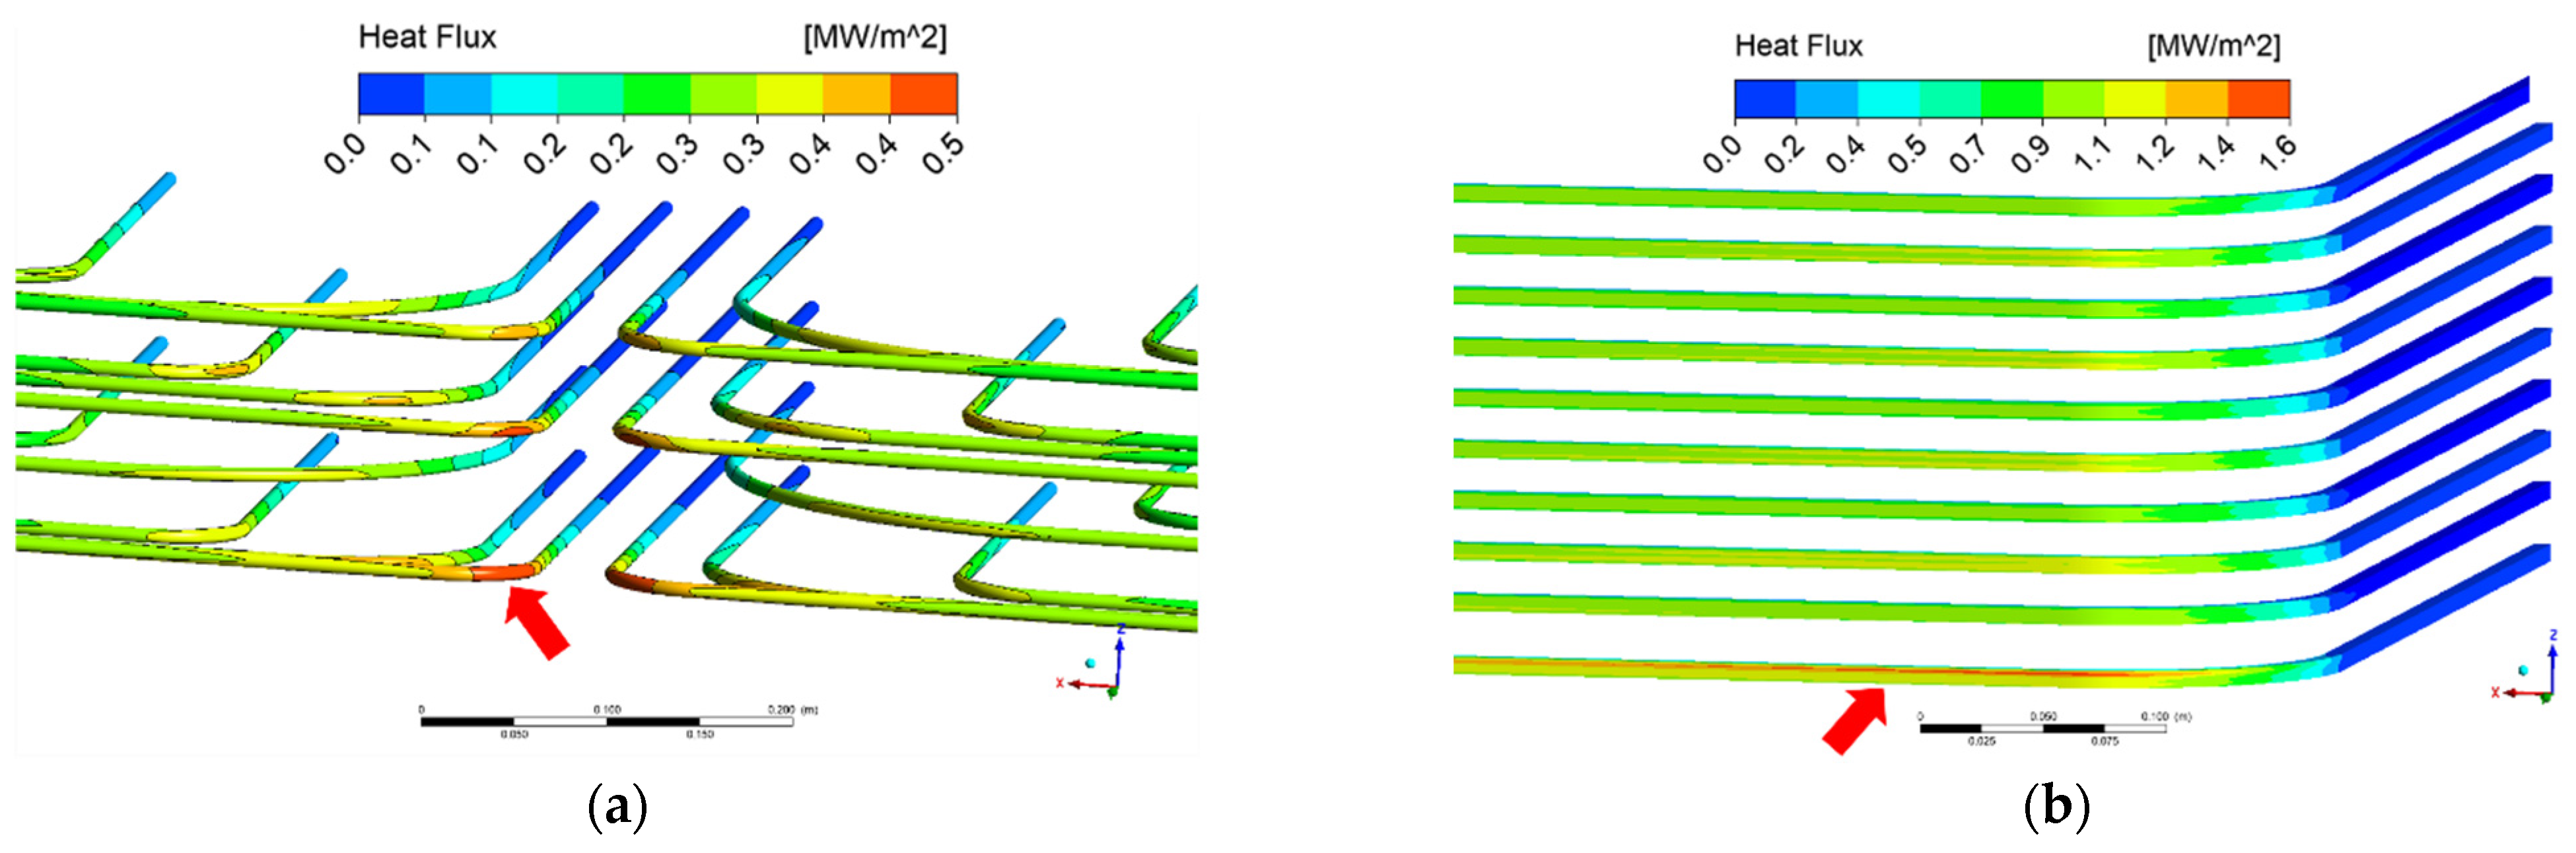
The BZ region that withstands the highest thermal load is the toroidal portion of the first array, as shown in
Figure 10, where the maximum heat flux is 0.485 MW/m
2 (23% of the CHF), however. The portion of the FW channels affected by the highest heat flux is the front-toroidal part of the lower channel (see
Figure 10), in which the maximum superficial power deposition is calculated as 1.59 MW/m
2. Namely, the maximum heat flux is around 52% of the critical flux. This suggests that no thermal crises should occur within the BZ and FW channels, but rather that limited areas of the channels wall can exist where subcooled nucleate boiling is the dominant heat transfer regime.
6. Conclusions
In this work, the layout of a cooling water system, both for the first wall (FW) and the breeding zone (BZ), is proposed to guarantee that all the materials involved can operate in a temperature range that does not exceed the design constraints (550 °C for the Eurofer and 1300 °C for the tungsten). The FW cooling system consists of 10 square channels fed in counter-current flow, with the pitch of the last channel that is calibrated to ensure proper cooling of the thick bottom plate. The BZ cooling system is instead based on the “recirculation loop” configuration developed for the equatorial cell that features 22 °C-shaped double walled tubes (DWTs). The power deposition in the cell domain, due to both plasma thermal radiation and neutrons’ interaction with the materials, has been taken into account by referring to the most recent data. The outcome of the steady-state CFD study is promising: the highest temperature is observed in the front region of the PbLi domain (around 522 °C). All the other materials operate in a temperature range that is way below the safety constraints. Moreover, the water mass flow rate (MFR) in the whole cooling system is properly calibrated and at the exit of the circuits (both for FW and BZ), the desired coolant conditions, 328 °C at 15.5 MPa, are matched with great accuracy. With the imposed velocities of the coolant, which are always well below the design limit of 7 m/s, a thermal crisis is avoided even if there are observed hot-spots where the wall temperature exceeds the saturation value of 344.8 °C, likely indicating the onset of nucleate boiling.
Author Contributions
Conceptualization, L.M. and A.T.; methodology, L.M. and A.T.; software, L.M., A.T. and S.S.; validation, L.M., A.T. and S.S.; formal analysis, L.M. and A.T.; investigation, L.M. and A.T.; resources, L.M., A.T. and S.S.; data curation, P.A.; writing—original draft preparation, L.M., A.T. and P.A.; writing—review and editing, L.M., A.T. and P.A.; visualization, L.M. and A.T.; supervision, A.T. and P.A.; project administration, A.T. and P.A.; funding acquisition, P.A. and F.G. All authors have read and agreed to the published version of the manuscript.
Funding
This research was funded by the European Union via the Euratom Research and Training Programme (Grant Agreement No 101052200—EUROfusion) and The APC was funded by by the European Union via the Euratom Research and Training Programme (Grant Agreement No 101052200—EUROfusion).
Data Availability Statement
Data available on reasonable request from the corresponding author.
Acknowledgments
This work has been carried out within the framework of the EUROfusion Consortium, funded by the European Union via the Euratom Research and Training Programme (Grant Agreement No 101052200—EUROfusion). Views and opinions expressed are however those of the author(s) only and do not reflect those of the European Union or the European Commission. Neither the European Union nor the European Commission can be held responsible for them.
Conflicts of Interest
The authors declare no conflict of interest.
Appendix A
Table A1.
Tungsten/Eurofer volumetric power deposition curves scaled for the bottom elementary cell (OB7).
Table A1.
Tungsten/Eurofer volumetric power deposition curves scaled for the bottom elementary cell (OB7).
| Zone | y [m] | Function [W/m3] |
|---|
| Tungsten | 0.027 | * (NWLOB7/NWLOB4) |
| Tung/FW | 0.025 |
| BZ | −0.025 | *
(NWLOB7/NWLOB4) |
| BZ | −0.075 |
| BZ | −0.125 |
| BZ | −0.175 | *
(NWLOB7/NWLOB4) |
| BZ | −0.225 |
| BZ | −0.275 |
| BZ | −0.325 |
| BZ | −0.375 | *
(NWLOB7/NWLOB4) |
| BZ | −0.425 |
| BZ | −0.475 |
| BZ | −0.525 | *
(NWLOB7/NWLOB4) |
| BZ/manifold | −0.585 |
Table A2.
Lead–lithium volumetric power deposition curves scaled for the bottom elementary cell (OB7).
Table A2.
Lead–lithium volumetric power deposition curves scaled for the bottom elementary cell (OB7).
| Zone | y [m] | Function [W/m3] |
|---|
| BZ | 0 | * (NWLOB7/NWLOB4) |
| BZ | −0.05 |
| BZ | −0.1 | *
(NWLOB7/NWLOB4) |
| BZ | −0.15 |
| BZ | −0.2 |
| BZ | −0.25 |
| BZ | −0.3 |
| BZ | −0.35 |
| BZ | −0.4 |
| BZ | −0.45 | *
(NWLOB7/NWLOB4) |
| BZ | −0.5 |
| BZ/manifold | −0.6 |
References
- Arena, P.; del Nevo, A.; Moro, F.; Noce, S.; Mozzillo, R.; Imbriani, V.; Giannetti, F.; Edemetti, F.; Froio, A.; Savoldi, L.; et al. The demo water-cooled lead–lithium breeding blanket: Design status at the end of the pre-conceptual design phase. Appl. Sci. 2021, 11, 11592. [Google Scholar] [CrossRef]
- Tavassoli, F. Eurofer steel, development to full code qualification. Procedia Eng. 2013, 55, 300–308. [Google Scholar] [CrossRef] [Green Version]
- Martelli, E. Thermal Hydraulic Design of DEMO Water Cooled Lithium Lead Breeding Blanket and Integration with Primary System and Balance of Plant. Ph.D. Thesis, Sapienza University of Rome, Rome, Italy, 2018. Available online: https://iris.uniroma1.it/retrieve/handle/11573/1070504/610931/Tesi%20dottorato%20Martelli (accessed on 24 November 2022).
- Edemetti, F.; Micheli, P.; del Nevo, A.; Caruso, G. Optimization of the first wall cooling system for the DEMO WCLL blanket. Fusion Eng. Des. 2020, 161, 111903. [Google Scholar] [CrossRef]
- Edemetti, F.; Di Piazza, I.; Del Nevo, A.; Caruso, G. Thermal-hydraulic analysis of the DEMO WCLL elementary cell: BZ tubes layout optimization. Fusion Eng. Des. 2020, 160, 111956. [Google Scholar] [CrossRef]
- Catanzaro, I.; Arena, P.; del Nevo, A.; di Maio, P.A.; Edemetti, F.; Forte, R.; Martelli, E. Parametric study of the influence of double-walled tubes layout on the DEMO WCLL breeding blanket thermal performances. Fusion Eng. Des. 2020, 161, 111893. [Google Scholar] [CrossRef]
- Ciurluini, C.; Giannetti, F.; del Nevo, A.; Caruso, G. Study of the EU-DEMO WCLL Breeding Blanket Primary Cooling Circuits Thermal-Hydraulic Performances during Transients Belonging to LOFA Category. Energies 2021, 14, 1541. [Google Scholar] [CrossRef]
- D’Onorio, M.; Giannetti, F.; Porfiri, M.T.; Caruso, G. Preliminary sensitivity analysis for an ex-vessel LOCA without plasma shutdown for the EU DEMO WCLL blanket concept. Fusion Eng. Des. 2020, 158, 111745. [Google Scholar] [CrossRef]
- Martelli, E.; Giannetti, F.; Caruso, G.; Tarallo, A.; Polidori, M.; Barucca, L.; del Nevo, A. Study of EU DEMO WCLL breeding blanket and primary heat transfer system integration. Fusion Eng. Des. 2018, 136 Pt B, 828–833. [Google Scholar] [CrossRef]
- Martelli, D.; Venturini, A.; Utili, M. Literature review of lead-lithium thermophysical properties. Fusion Eng. Des. 2019, 138, 183–195. [Google Scholar] [CrossRef]
- Aubert, J.; Aiello, G.; Li Puma, A.; Morin, A.; Tincani, A.; Giammusso, R.; Di Maio, P.A. Preliminary Design of a Water Cooled Lithium Lead Blanket Concept for DEMO Reactor; EFDA-Power Plant Physics & Technology: Munich, Germany, 2013. [Google Scholar]
- Bergman, T.L.; Lavine, A.S.; Incropera, F.P.; DeWitt, D.P. Principles of Heat and Mass Transfer, 7th ed.; John Wiley and Sons Ltd.: Hoboken, NJ, USA, 2012. [Google Scholar]
- ISL Inc. RELAP5/MOD3.3 Code Manual Volume I: Code Structure, System Models, and Solution Methods; Nuclear Safety Analysis Division: Idaho Falls, ID, USA, 2003.
- Giannetti, F.; D’Alessandro, T.; Ciurluini, C. Development of a RELAP5 Mod3.3 Version for FUSION Applications; DIAEE Sapienza Technical Report D1902_ENBR_T01 Rev. 01; ENEA: Camugnano, Italy, 2020. [Google Scholar]
- Maviglia, F.; Bachmann, C.; Federici, G.; Franke, T.; Siccinio, M.; Albanese, R.; Ambrosino, R.; Arter, W.; Bonifetto, R.; Calabrò, G.; et al. Integrated design strategy for EU_DEMO first wall protection from plasma transients. Fusion Eng. Des. 2022, 177, 113067. [Google Scholar] [CrossRef]
- Moro, F.; Arena, P.; Catanzaro, I.; Colangeli, A.; del Nevo, A.; Flammini, D.; Fonnesu, N.; Forte, R.; Imbriani, V.; Mariano, G.; et al. Nuclear performances of the water-cooled lithium lead DEMO reactor: Neutronic analysis on a fully heterogeneous model. Fusion Eng. Des. 2021, 168, 112514. [Google Scholar] [CrossRef]
- Tassone, A.; del Nevo, A.; Arena, P.; Bongiovì, G.; Caruso, G.; di Maio, P.A.; di Gironimo, G.; Eboli, M.; Forgione, N.; Forte, R.; et al. Recent progress in the WCLL breeding blanket design for the DEMO fusion reactor. IEEE Trans. Plasma Sci. 2018, 46, 1446–1457. [Google Scholar] [CrossRef]
- Shah, M. A general correlation for critical heat flux in horizontal channels. Int. J. Refrig. 2015, 59, 37–52. [Google Scholar] [CrossRef]
- Tong, L.S. A Phenomenological Study of Critical Heat Flux; ASME Paper 75-HT-68; ASME: New York, NY, USA, 1975. [Google Scholar]
| Publisher’s Note: MDPI stays neutral with regard to jurisdictional claims in published maps and institutional affiliations. |
© 2022 by the authors. Licensee MDPI, Basel, Switzerland. This article is an open access article distributed under the terms and conditions of the Creative Commons Attribution (CC BY) license (https://creativecommons.org/licenses/by/4.0/).


 ,
, 


