

Long Range Optical Distance Sensors for Liquid Metal Free Surface Detection

Institute for Neutron Physics and Reactor Technology, Karlsruhe Institute of Technology, 76344 Eggenstein-Leopoldshafen, Germany
J. Nucl. Eng. 2022, 3(4), 364-372; https://doi.org/10.3390/jne3040023
Submission received: 7 October 2022
/
Revised: 11 November 2022
/
Accepted: 15 November 2022
/
Published: 16 November 2022
(This article belongs to the Special Issue Special Issue Dedicated to 32nd Symposium on Fusion Technology—SOFT2022)
Abstract
:For the demonstration of fusion power plant technology, DEMO dedicated materials are necessary to cope with the harsh environment of high energy neutrons. For this purpose, the international neutron irradiation facility for fusion materials IFMIF/DEMO Oriented Neutron Source (DONES) is planned to be built in Granda, Spain. In the DONES facility, a deuteron beam hitting the lithium target produces a high energy neutron flux. Due to the high-power density, the windowless target is a free surface liquid lithium flow in a duct with a concave backplate. In order to keep the heat released by the beam within the liquid lithium and to avoid its intrusion in the backplate, a stable configuration of the free surface flow with a setpoint layer thickness of 25 ± 1 mm is crucial. In particular, stable wave structures, so called wakes, which occur from accumulated impurities at the nozzle edge, can cause a critical local decrease in the layer thickness of more than 1 mm. Therefore, it is necessary to better understand the nature of these wakes and to be able to monitor the surface profile to shut down the beam in case of a critical thickness loss, but to avoid unintended shutdowns. In the context of this work, currently available optical sensors were tested on their capability of detecting a specular liquid metal surface at measurement distances of several meters. After an initial selection, two optical sensors were further considered. Experiments with the liquid metal alloy GaInSn and simulations with the software Blender of the selected optical sensors for their capability of measuring distances of liquid metal were conducted. The results showed a significant dependency of the measurement results on the waviness of the liquid metal surface. Nevertheless, it was possible to resolve the wavy liquid metal surface with a sufficient resolution to detect critical wake structures.
1. Introduction
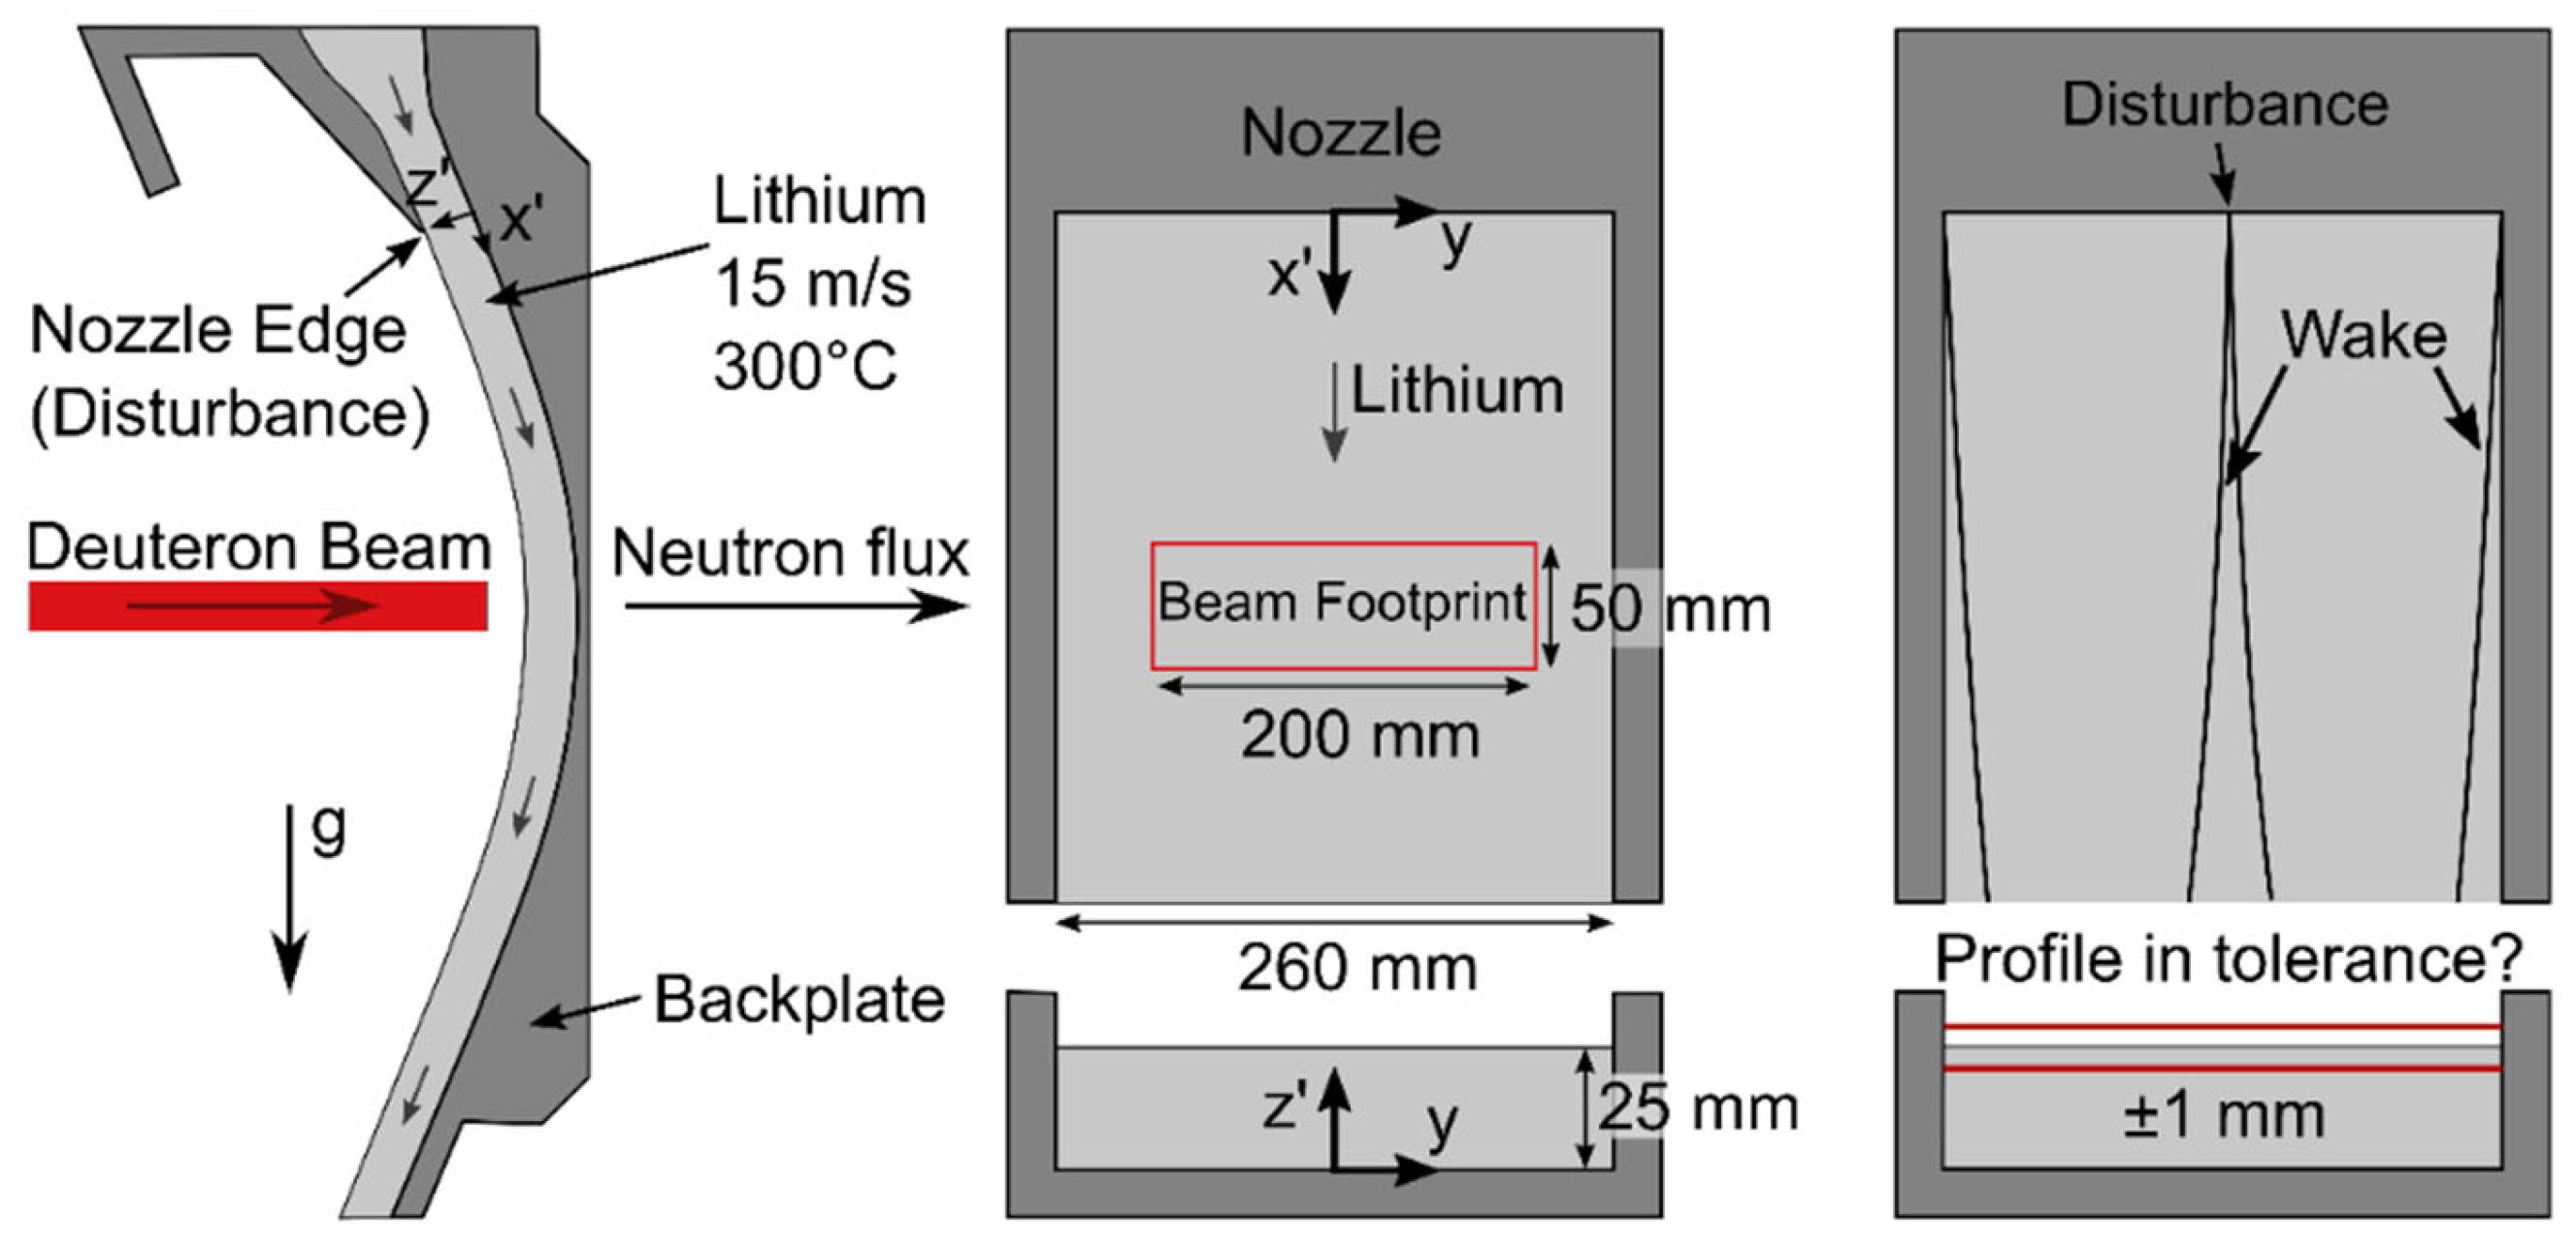
The international fusion materials irradiation facility IFMIF/DEMO Oriented Neutron Source (DONES) is planned to produce a high energy neutron flux from an accelerated deuteron beam hitting a liquid lithium target as shown in Figure 1. The produced neutron flux is essential for further tests of fusion materials (Knaster et al. 2016 [1]). To keep the heat released by the beam within the liquid lithium and to avoid its intrusion in the backplate, a stable configuration of the free surface flow with a setpoint layer thickness of 25 ± 1 mm is crucial. In particular, stable wave structures, so called wakes, which occur from accumulated impurities at the nozzle edge, can cause a critical local decrease in the layer thickness of more than one mm. Therefore, it is necessary to be able to monitor the surface profile to shut down the beam in case of a critical thickness loss, while avoiding an unintended shutdown. The main requirement is the ability of the sensor to detect a height change of 1 mm on the specular wavy liquid metal surface from a measuring distance of more than 7 m.
Regarding the measurement specifications, different measurement methods and sensors were considered. Common methods for liquid metal diagnostics are described by Slocomb (1967) [2].
Most of the described sensors are for level detection such as contact probes, floaters, resistance and inductive probes. In the IFMIF project in particular, a contact probe was considered. It was tested in a similar test facility named EVEDA Lithium Test Loop (ELTL) (Kondo et al. 2011 [3]) to detect the amplitude of small surface waves. The measurement head consists of two needles with a diameter of 3 mm to measure the surface at two positions in the channel simultaneously. For calibration, the distance to the channel floor was known. The probe was moved with steps of 0.1 mm towards the liquid metal surface. Through the contact with the surface, the electric circuit was closed, which was detected by a voltage drop. The height difference of the first contact to a permanent contact of the liquid metal with the sensor results in the wave height. Contact probe sensors were also used by Yoshihashi-Suzuki et al. (2011) [4] and Hvasta et al. (2017) [5] in liquid metal flows. In general, this type of sensor does fulfil the needed measuring accuracy, but lacks measurement speed due to the needed height scan. Another error source is the wetting of the measurement needle, which causes longer contact time measurements (Kanemura et al. 2007 [6]).
High-speed cameras were also used to monitor similar liquid metal flows to IFMIF/DONES. Wakai et al. (2016) [7] observed small surface waves with rather short exposure times of 10 µs. For longer exposure times of 2 s, only stable waves were visible, and the small waves averaged out. Therefore, these sensors are not able to measure small height changes but could rather be used to categorize the state of the flow and detect the location of stable waves.
Other optical measurement methods are based on triangulation, intensity or time of flight. The latter includes the direct time of flight measurements and the measurement of the phase difference. For measuring the height profile of a liquid metal flow, Kondo et al. (2007) [8] were using the pattern projection, which is based on the triangulation method. They were projecting a pattern of stripes at the surface and observed it from another angle. Surface waves deforming the pattern were captured by the camera. From these deformations, the height profile could be reconstructed. The measurement system was able to measure height changes on a liquid metal flow of 0.2 mm with a measurement distance of 473 mm. With the pattern projection, an area on the surface could be measured. For detecting stable wave structures emerging from the nozzle edge, a single height profile along the channel width is sufficient.
Narula et al. (2005) [9], Hvasta et al. (2018) [10] and Yang et al. (2018) [11] were testing light section sensors on a liquid metal flow. The sensor projects a laser line on the surface and evaluates the height profile from the deformation of the laser line. The measurements showed that the sensors reached an accuracy in the order of O (10−4) m with a measurement distance in the order of O (10−1) m. It was also described that the measurement results depended strongly on the oxides at the liquid metal surface. These oxides are diffuse reflecting, which benefits or enables the optical measurement.
Another measurement method based on triangulation which was developed for measuring the height profile of specular surfaces is double layer projection (DLP) (Hillenbrand 2008 [12]). DLP sends a laser through a glass plate to the specular measurement object. The reflected laser passes the glass plate again. The four intersections of the laser with the surface of the plate are detected by a camera and are used to determine the position of the reflection on the surface. The sensor was used to detect the height profile of a liquid metal flow. The measurement distance was 60 mm with a standard deviation of 0.34 mm.
Kanemura et al. (2014) [13] developed an optical distance sensor for detecting waves on the surface of a liquid metal flow. The so called Optical Comb Absolute Distance Meter was tested on water with an accuracy of 40 µm at a measurement distance of 10 m (Kondo et al. 2018 [14]). Validation measurements on a liquid lithium flow showed a measurement accuracy of 16 µm at a measurement distance of 500 mm (Kanemura et al. 2014 [13]). To compensate signal losses due to the wavy specular surface, the measurement time per measurement point was increased. Similar observations were made by Buchenau et al. (2011) [15] who were using a commercial light detection and ranging (LIDAR) sensor to detect a specular wavy liquid metal surface with an accuracy in the centimeter range. Measurements were possible with a wavelength of the surface waves bigger than the measurement spot.
Optical measurement systems focusing on measurement distances of several meters and the possibility to scan an area or line are most often optimized for diffuse surfaces. It was therefore decided to test currently available commercial optical sensors on their capability of detecting a specular surface. In addition to experimental measurements on liquid metal, simulated measurements on a wavy specular surface were conducted. The results were compared regarding their accuracy and loss of information.
2. Experimental Setup
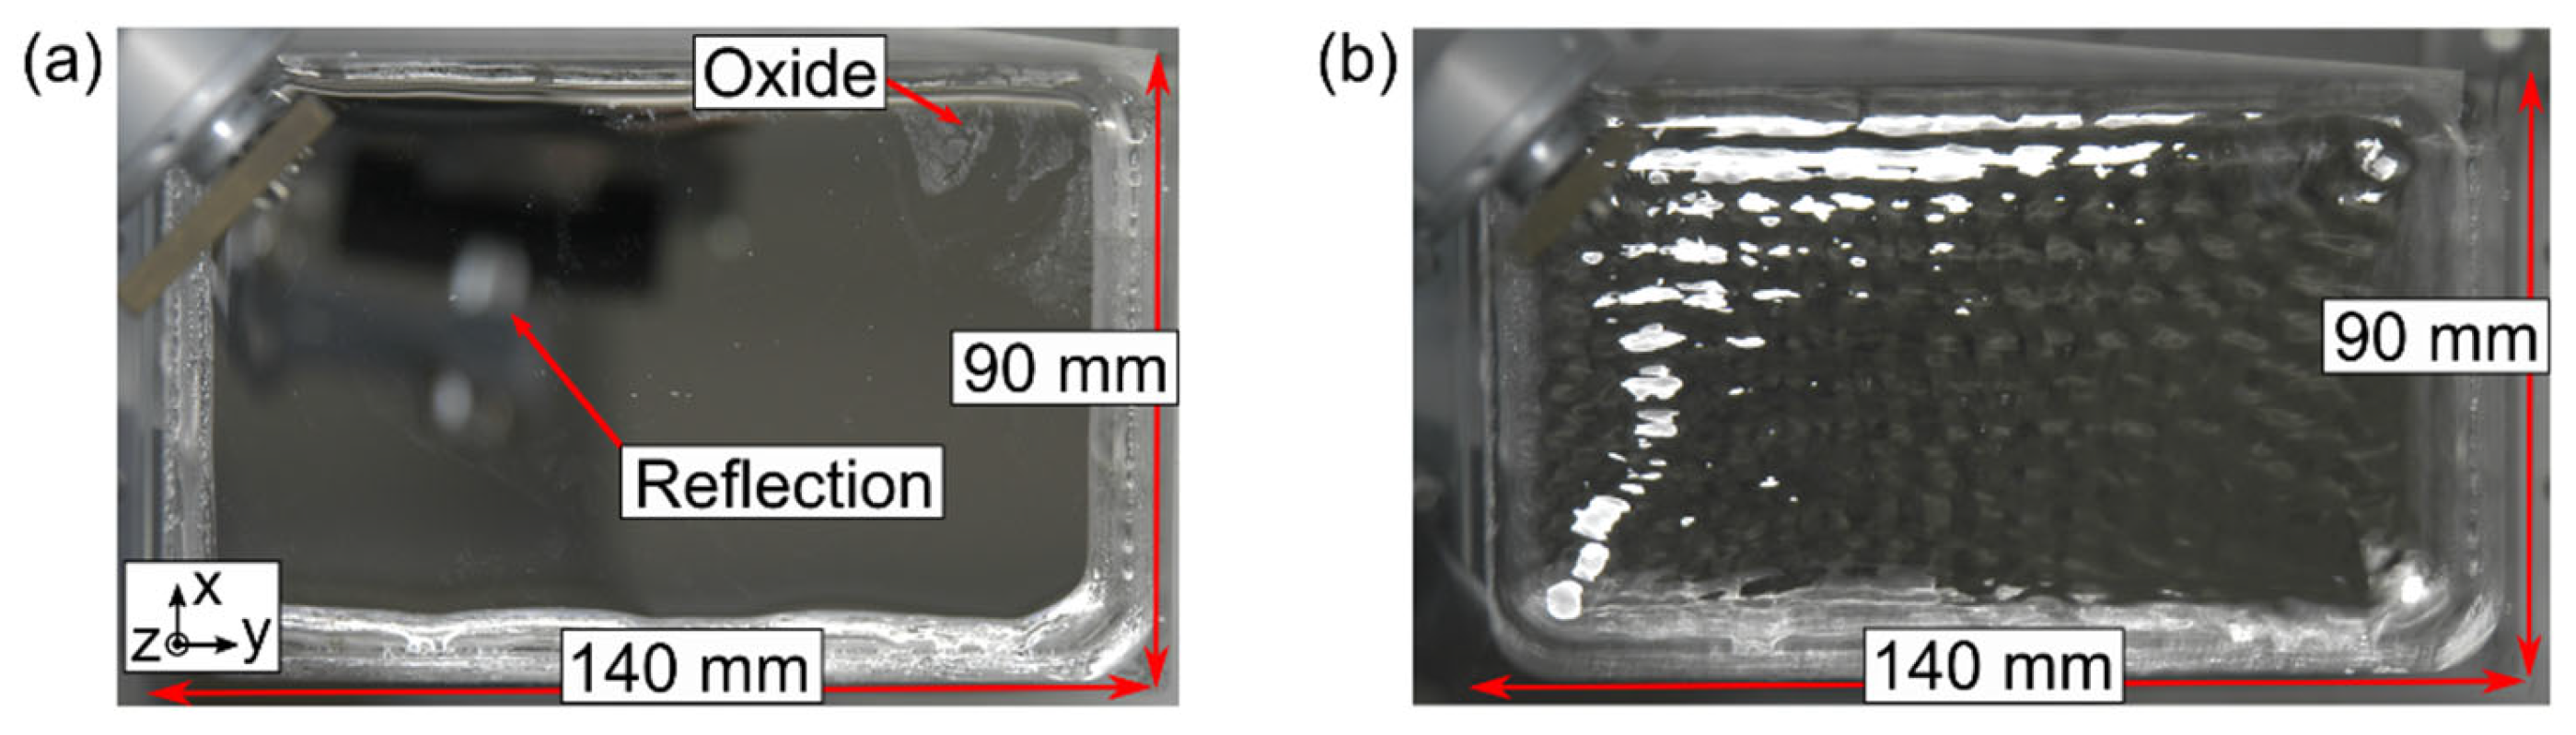
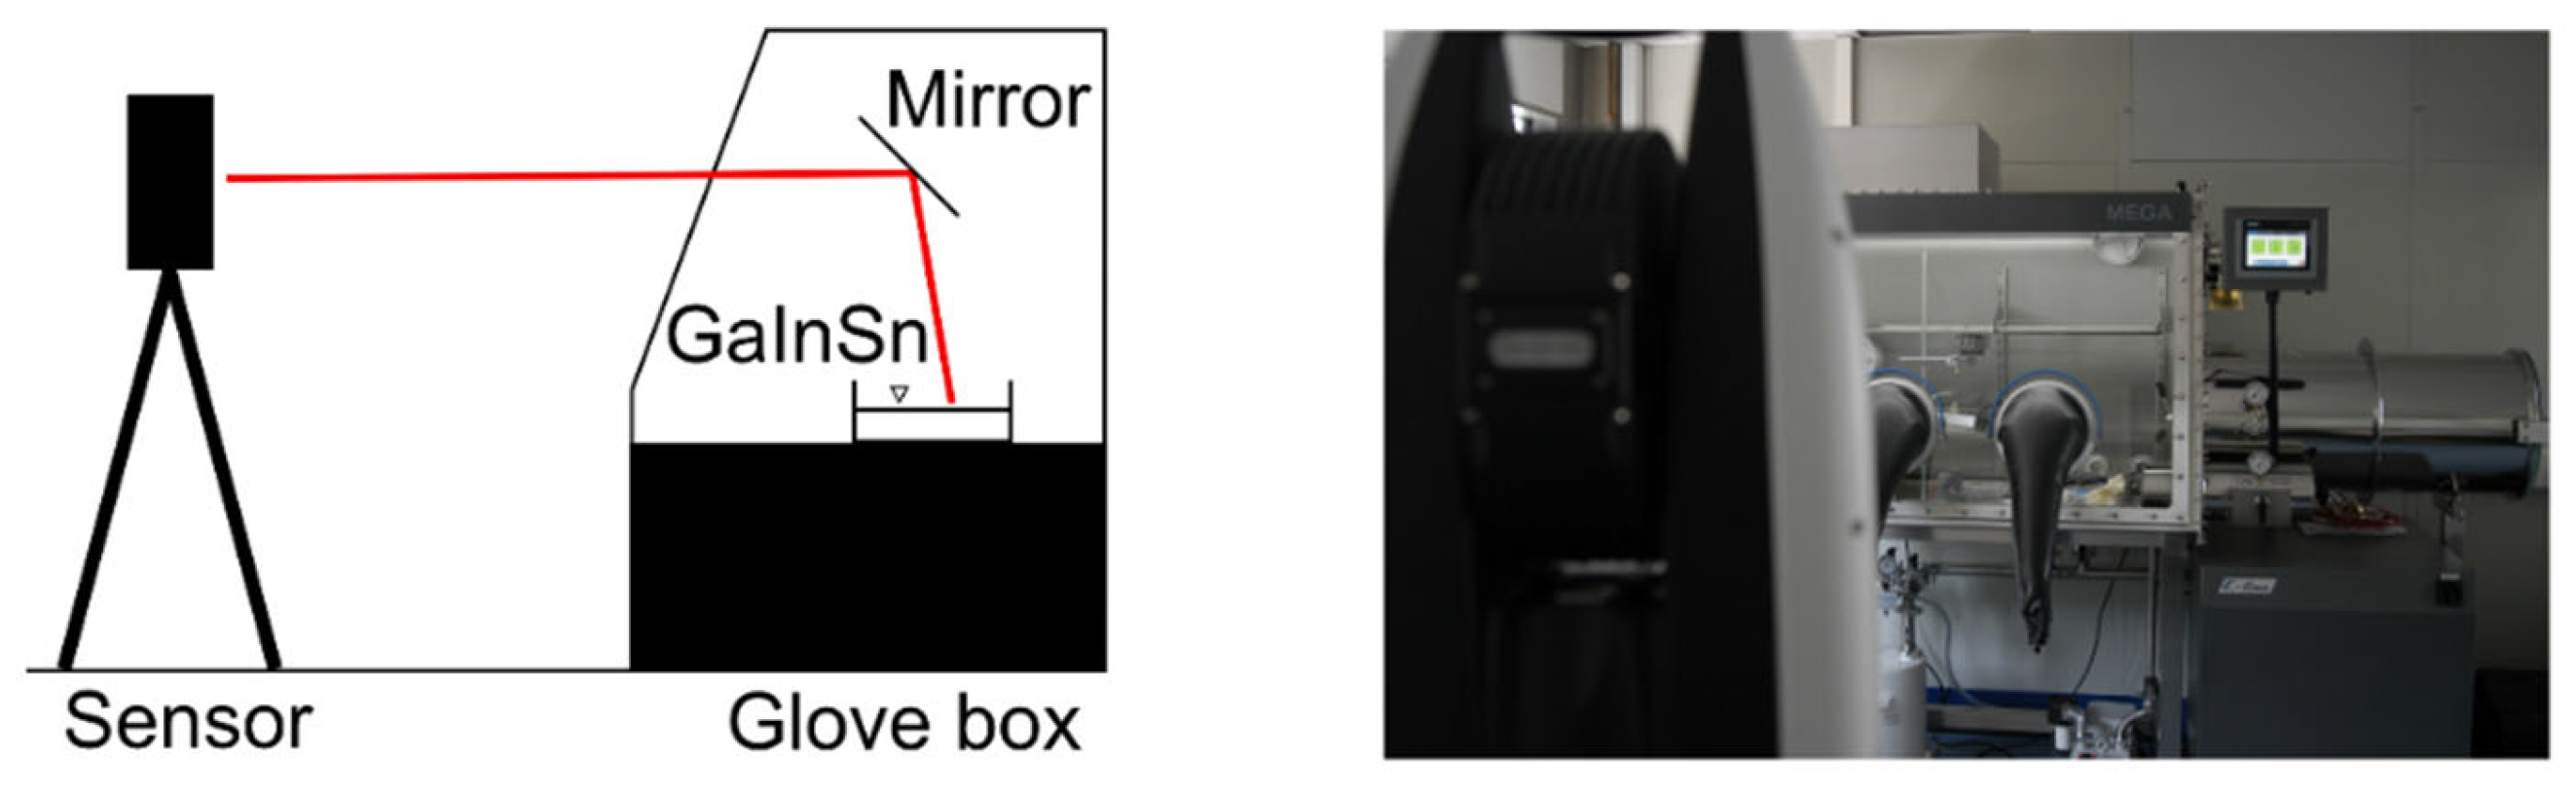
For the experiments, the liquid metal alloy GaInSn (MCP11 from 5N plus [16]) was used. GaInSn is liquid at room temperature and was selected due to its low toxicity and reactivity in comparison to mercury, sodium or lithium (Plevachuk et al. 2014 [17]). The model surface for the test measurements was a 90 × 140 mm2 pod filled with GaInSn. A vibration motor mounted on the pod induced surface waves (Figure 2b). Exposed to air, the GaInSn surface started to be covered by a diffuse reflecting oxide layer. In advance of measurements, the oxide layer had to be removed. By inducing surface waves, which are also present in the liquid metal flow of the DONES target (Kanemura et al. 2014 [13]), the build-up of the oxide layer was quickened, therefore the experiments had to be conducted in an argon atmosphere to prevent or slow down the build-up. In this experimental campaign, the commercial laser radar ATS600 from HEXAGON [18] was used. The sensor is based on the time of flight measurement principle with a given absolute accuracy of <0.3 mm for measurement distances < 30 m and a sampling rate of 1 kHz. The sensor was placed at two different distances (4.3 m or 7.4 m) in front of the glove box (Figure 3).
In both cases, the GaInSn model surface was observed through the front window of the glove box and via a mirror to obtain a smaller viewing angle similar to the 9° in DONES. To extend the measurement distance to 7.4 m, a second mirror had to be used. Measurements on the mirror showed that measurements through a mirror are possible as long as the incident angle is bigger than ~15°, otherwise the surface of the mirror was resolved. The argon atmosphere in the glove box had an oxygen concentration of <5 ppm and a water concentration <1 ppm.
3. Simulation Setup
For the simulated measurements, the ITER In Vessel Viewing System (IVVS) was taken as a reference (Siegel et al. 2019 [19]). The sensor was developed to scan the first wall of ITER for damage with a measurement distance of several meters and an accuracy in the submillimeter range.
The simulations were conducted in the software Blender (Blender 2.82a [20]) with an add-on developed by Fusion for Energy (F4E). To conduct the simulations, a model surface in Blender and a reflection model had to be selected. In contrast to the experiments of Matia-Hernando et al. (2020) [21], there were no measured reflectivity data available. Therefore, the reflectivity was calculated based on the Ashikhmin–Shirley reflection model. The model describes the reflection behavior based on the bidirectional reflectance distribution function (BRDF) (Ashikhmin and Shirley 2000 [22]). The reflected laser power IR depends in this case on the input laser power IL and the reflectivity ϵ,
which is further subdivided into a specular (ϵs) and diffuse (ϵd) term. In the case of the specular surface, the diffuse term was set to zero and the reflection was assumed to be isotropic, which results in
with the incident angle θ and the parameter nuv for the shape of the specular lobe. Large values of nuv ≈ 10,000 resulted in a mirror-like specular surface.
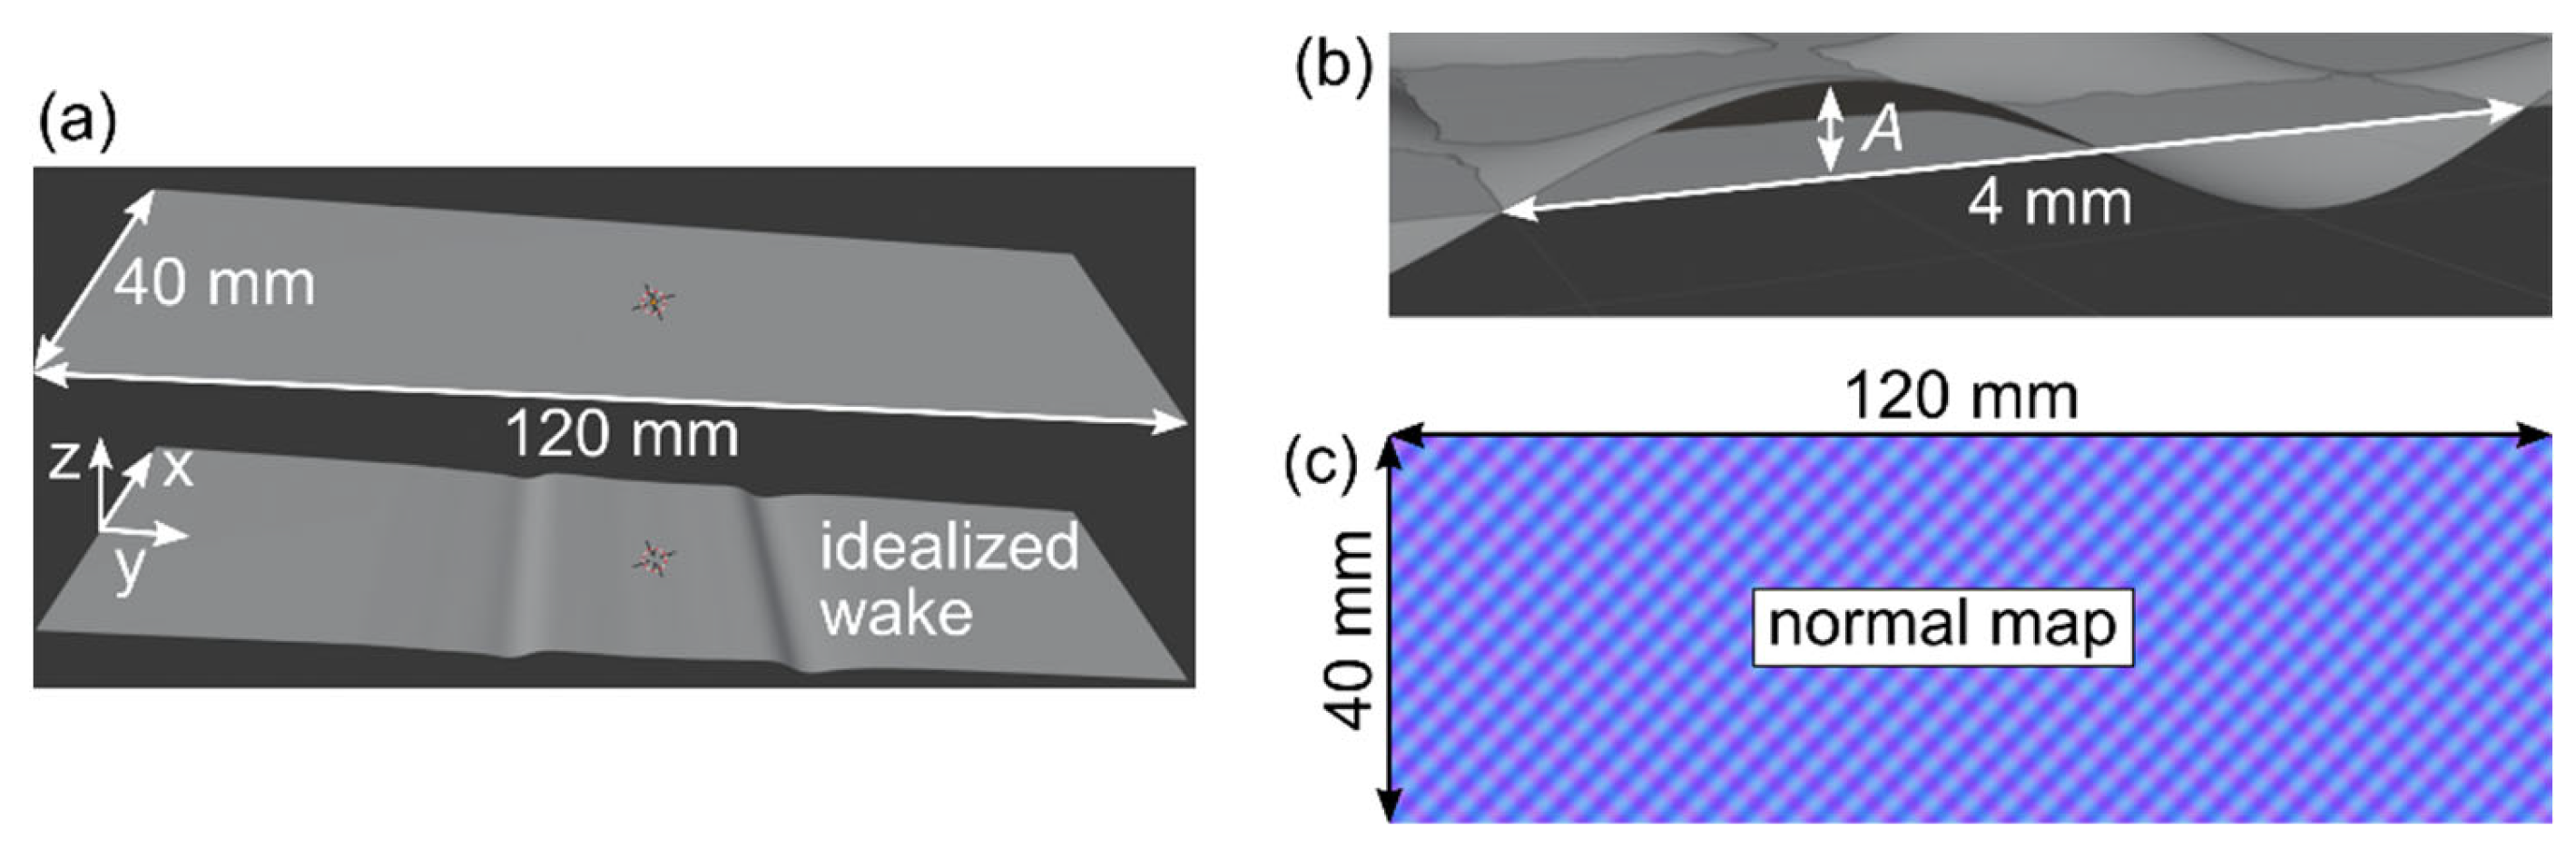
For the model surface, a 120 × 40 mm2 plate was created in Blender (Figure 4a). In one case, this plate was flat and in a second case it was deformed by an idealized wake profile. A 3D wave profile as depicted in Figure 4b with different wave amplitudes A and a wavelength of 4 mm was modeled to consider the small surface waves. It was imprinted on the surface by using a normal map (Figure 4c). The lateral resolution of the waviness on the surface was 0.039 mm.
The simulation was based on ray tracing. Starting from the position of the optical head, rays were sent in the direction of the model surface. In case of an intersection of a ray with the model, the surface normal of the model and the surface normal in the normal map were extracted. Together with the position of the optical head, the incident angle was calculated, which was required in the reflection model to extract the reflected laser power. The cross-section of the laser beam was assumed to be Gaussian shaped with a standard deviation of 0.61 mm at a 7 m distance.
4. Experimental Results
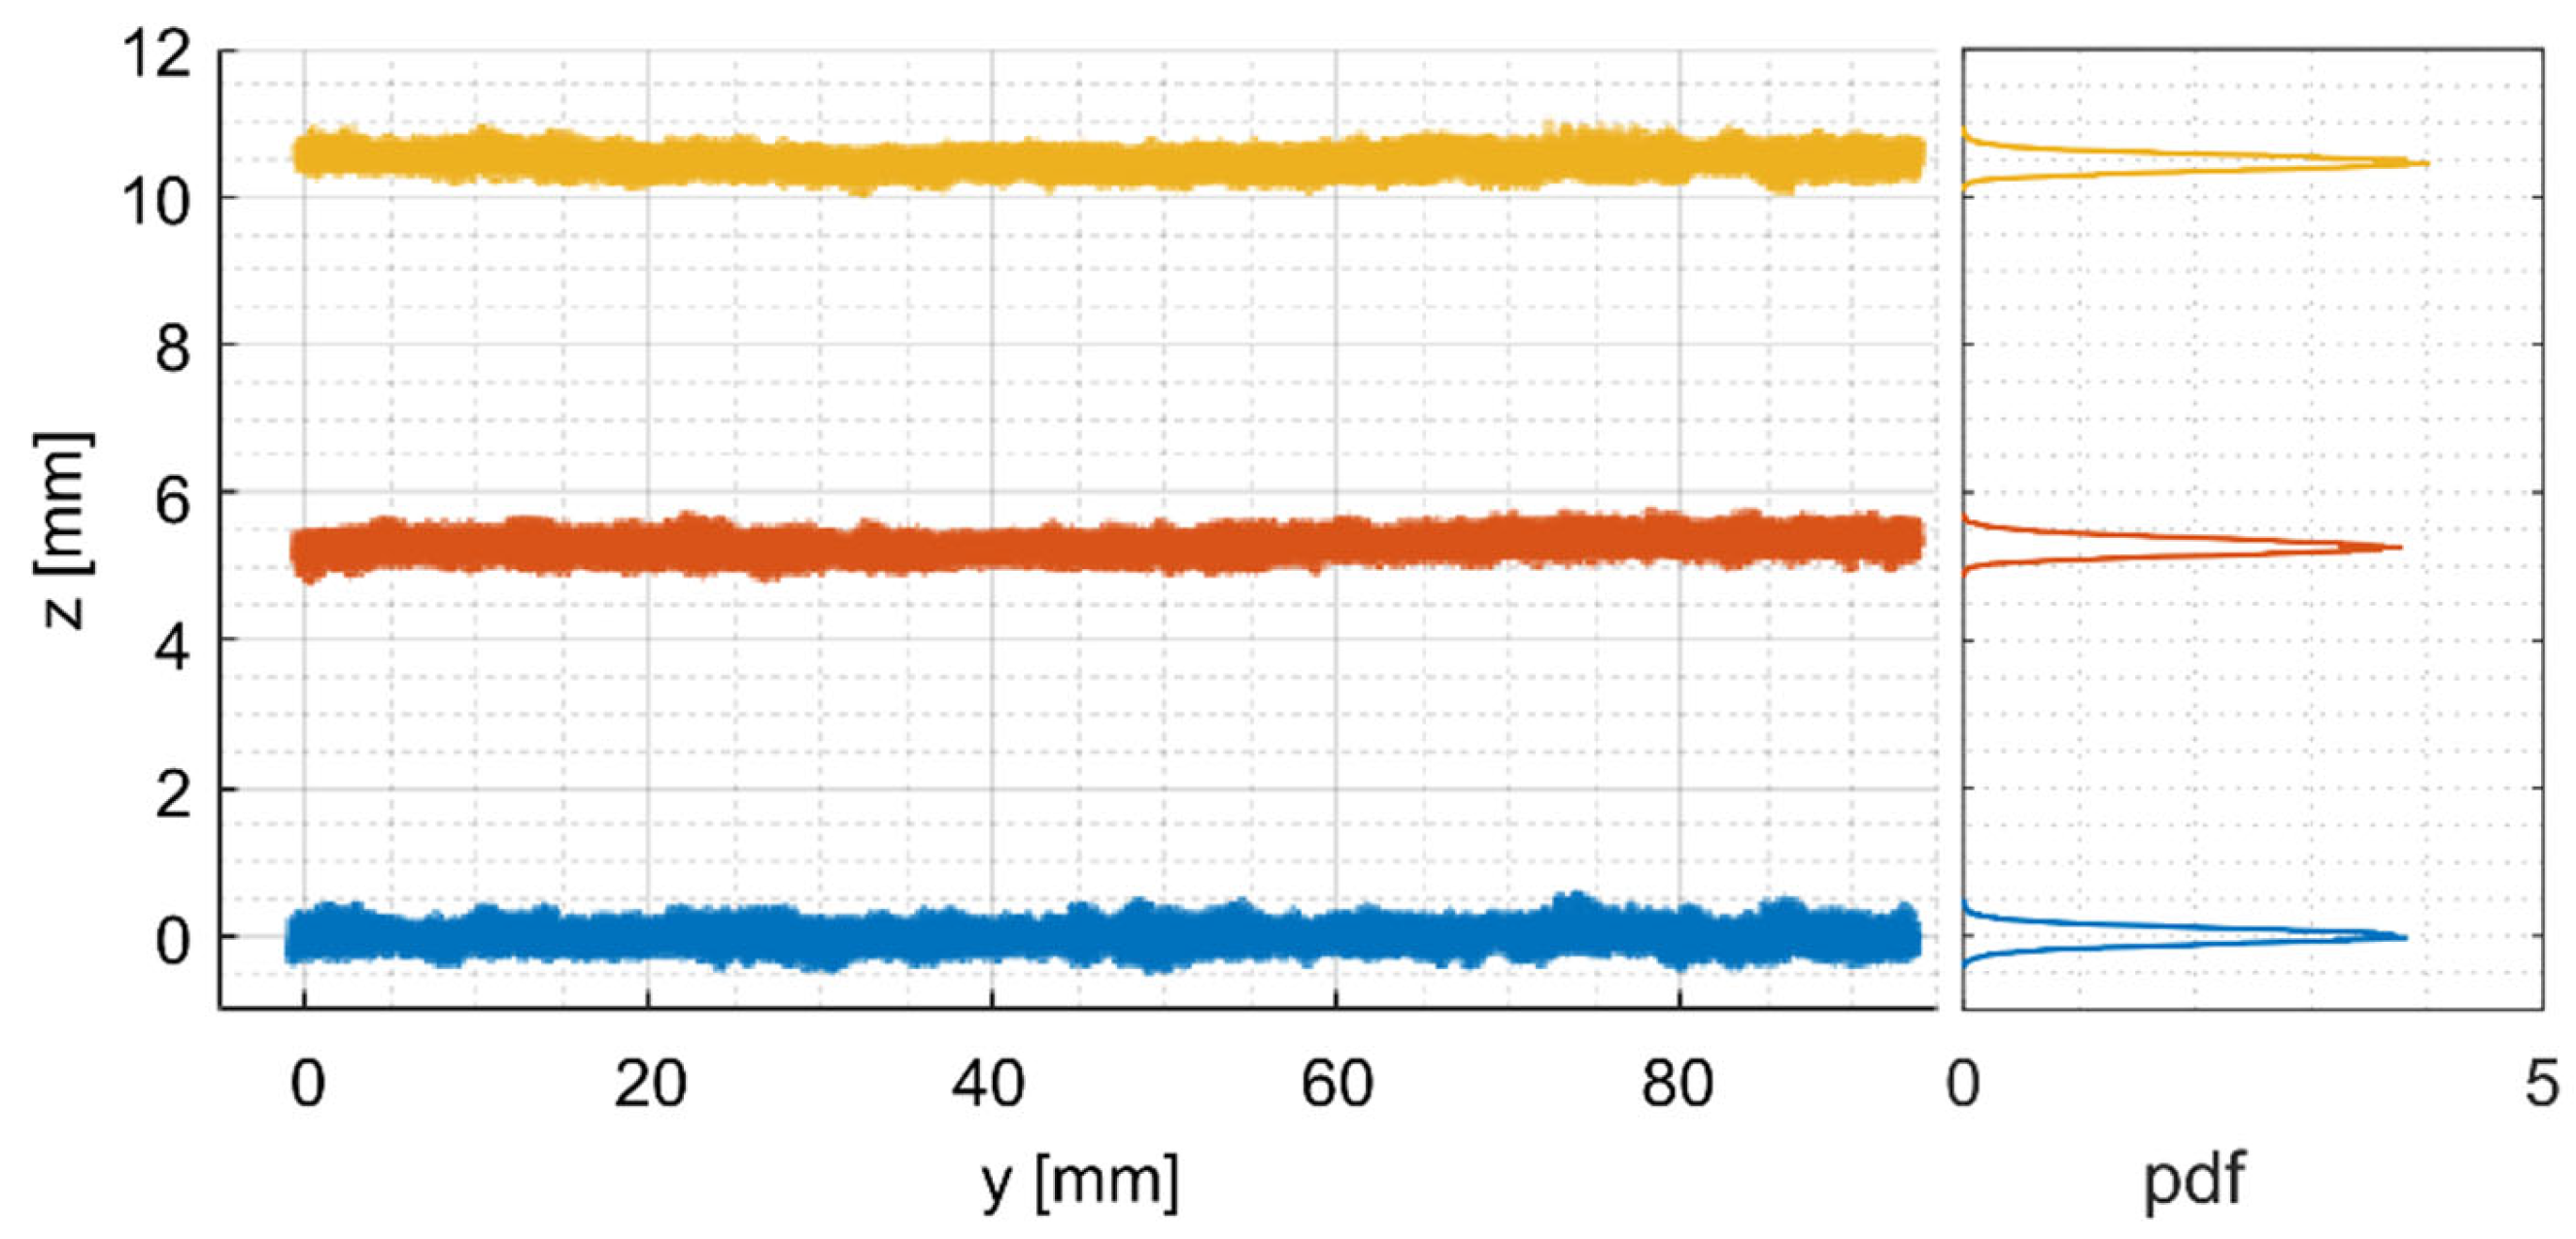
At first, measurements were taken of the flat specular GaInSn surface cleaned of oxides (Figure 2a). In this case, the surface itself was not detected, but objects reflected in the surface. In the case of the GaInSn surface covered with a diffuse reflecting oxide layer, measurements were enabled. In the case of the measurements in the glove box with argon atmosphere, it had to be ensured that the test surfaces were detected. Therefore, the distance to a diffuse reflecting surface at the glove box floor (x–y-plane) at different height levels (z-axes) was measured. The measured point clouds are shown in Figure 5. The measured plates had a deviation of 5.3 mm and 10.5 mm with a standard deviation of 0.11 mm. The height level and standard deviation were related to planes fitted to the point cloud. The measurements showed that the sensor is able to detect the area of interest in the glove box through the glove box front window and via one mirror.
Going further, the distance to the GaInSn model surface in the glove box was measured. To extract the effect of the small surface waves, the distance to the GaInSn surface was measured on a flat and wavy surface. These alternating measurements made sure that there was no oxide layer building up during the measurements.
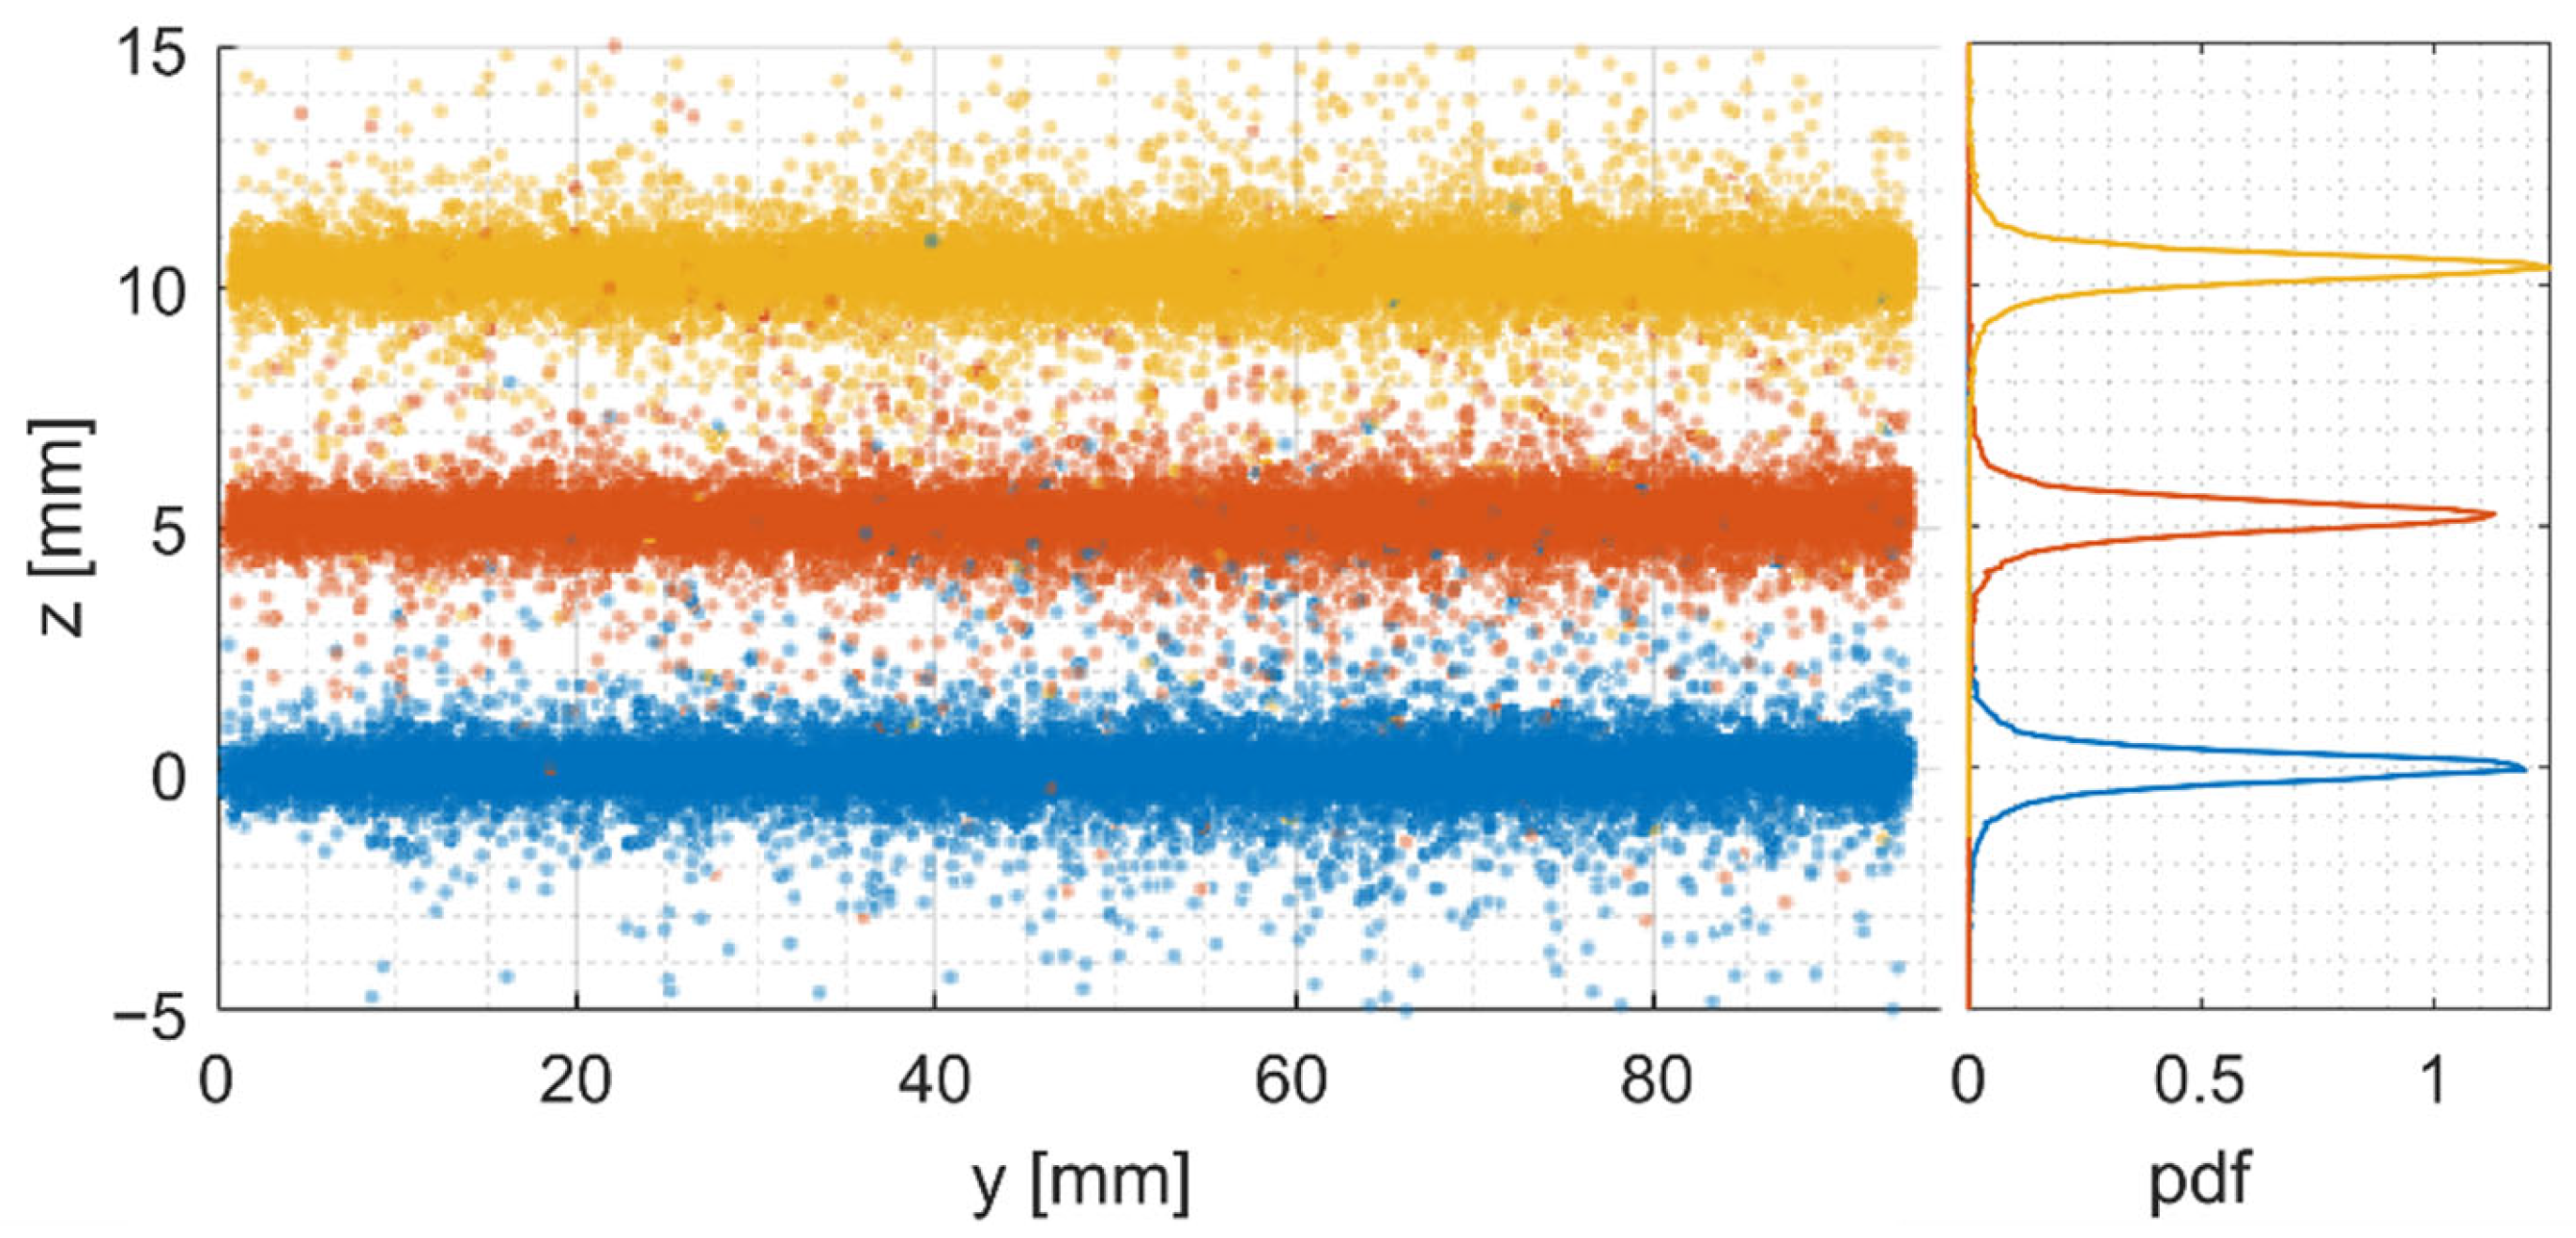
The detected raw point cloud of the wavy surface was highly scattered. It was necessary to take the reflected power of each point into account, which was given by the sensor. A threshold value for the reflected laser power was defined to filter highly scattered points. Only points with values above the threshold were further considered. Similar to the measurements of the reference surface, the wavy surface was detected at three different height levels, which is shown in Figure 6.
The measured offset of the planes was 5.2 mm and 10.4 mm with a standard deviation of 0.79 mm. Even after filtering the point clouds with the threshold value, there were still some highly scattered points present. Therefore, the 5% trimmed mean was further used, discarding the 5% smallest and largest z values of each point cloud. The resulting point clouds had a standard deviation of 0.33 mm.
Besides the measurement distance of 4.3 m, the tests were repeated for a measurement distance of 7.4 m with an additional mirror. The resulting point cloud was similar to the point clouds in Figure 5 and Figure 6. The standard deviation was also in the order of magnitude of 0.33 mm, suggesting that standard deviation is dominated by the small surface waves.
Another important parameter is the amount of points which can be detected during one scan of the wavy specular surface. In the presented measurements, the point to point distance was set to 0.5 mm. The amount of measured points in the measurement area is known. In the case of the test measurements on the diffuse surface, 100% of the possible points were detected and present in the point cloud. In the case of the measurements on the wavy specular surface, 36% to 56% of the possible points were present in the point cloud, due to the threshold value and the trimmed mean.
5. Simulation Results
The purpose of the Blender simulations was to evaluate the ability of the simulated IVVS sensor to detect a wavy specular surface and to evaluate the impact of different wave amplitudes.
At first, simulated measurements were conducted on a diffuse reflecting surface (nuv = 0) and a specular surface (nuv = 10,000) with a viewing angle of 9°. The diffuse surface was detected. The point cloud of the specular surface was highly scattered, therefore not reflecting the plate.
In the next step, the flat specular reflecting plate with small surface waves was tested for different amplitudes. In these measurements, the point cloud was also highly scattered, but in contrast to the simulations of the flat surface a point cloud representing the plate could be extracted by using a threshold value for the reflected laser power of 0.5 nW. Points with a smaller reflected laser power were discarded. To extract the impact of different wave amplitudes, the amount of detected points was evaluated. A peak was detected for a wave amplitude of A = 0.13 mm with roughly 40% of the possible points present. By increasing the wave amplitude to A = 0.28 mm, the amount of valid points was reduced to 12.3%. Varying the parameter nuv by ±25%, the amount of detected points varied by less than 5%, suggesting a minor effect of the uncertainty of this parameter on the results.
The standard deviation in the point cloud of these simulations was <0.13 mm. Considering wave amplitudes in the order of 0.13 mm ≤ A ≤ 0.28 mm, which are currently only considered in their effect on the surface normal, the combined standard deviation was estimated at <0.2 mm.
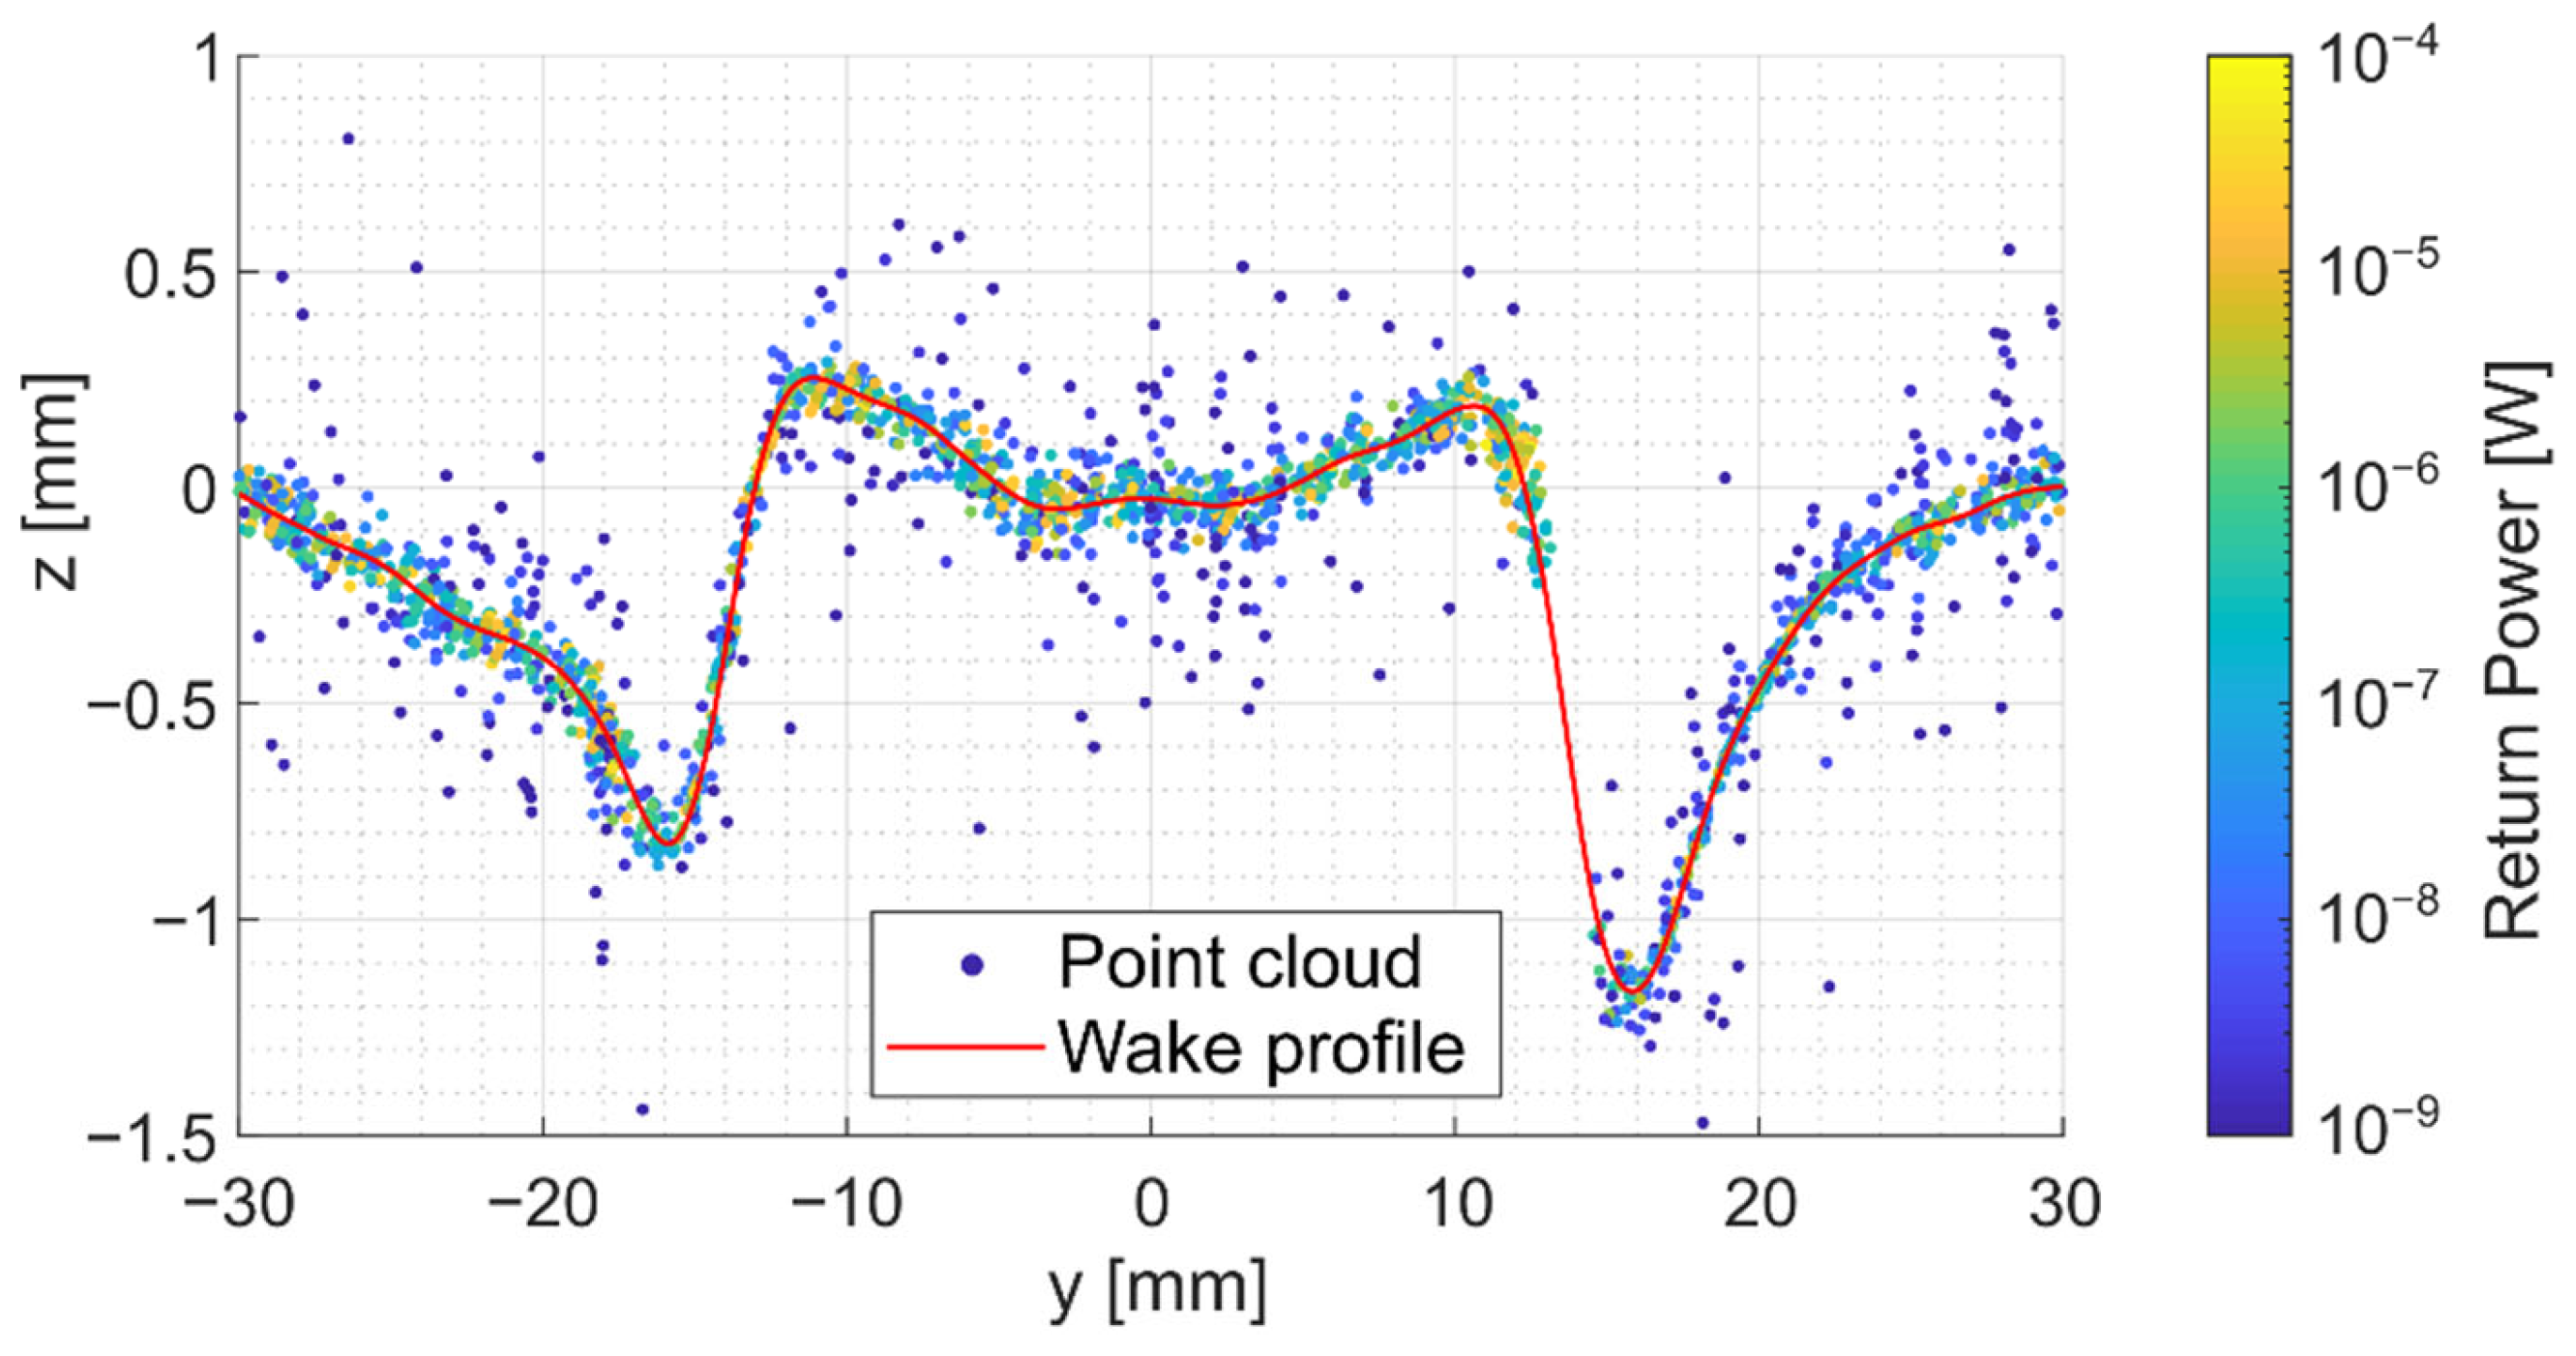
Simulations were also conducted on the plate with the idealized wake profile shown in Figure 4a. Small surface waves with a wave amplitude of A = 0.28 mm were still considered, affecting only the surface normal. Figure 7 shows the given profile of the wake in red and the detected points of a simulated measurement. The profile could be mostly recovered by evaluating the points in 1 mm segments across the y-axes. Only the slope for 12 mm < y < 16 mm could not be resolved. Here, the viewing angle of 9° had an impact and the incoming light is reflected away from the sensor. The two largest minima of the wakes were resolved, which are the main concern for local disturbances of the surface.
6. Summary
In the DONES target flow, a setpoint layer with thickness of is necessary to keep the heat released by the beam within the liquid lithium. Therefore, monitoring the thickness of the flow is mandatory to be able to shut down the beam in case of a critical thickness loss. The main requirement for a potential optical sensor is the ability to detect a height change of 1 mm on a specular wavy liquid metal surface from a measuring distance of more than 7 m. Two potential optical sensors were selected. One was tested experimentally on GaInSn, the other was tested by simulated measurements in Blender. Detecting the flat specular surface was not possible. The surface acted as a mirror. Due to small waves present in DONES, the measurements were repeated with waviness of the surface. In both cases, a threshold value was necessary to filter highly scattered points. The results showed that small surface waves enabled the measurements. A standard deviation of <0.35 mm was reached. The amount of points detected by the sensor depended on the wave amplitude A, with a maximum at at a fixed wavelength of 4 mm in the case of the simulations. The simulations also showed that measurements of a wake profile are feasible, even for less optimal wave amplitudes.
Funding
This work has been carried out within the framework of the EUROfusion Consortium, funded by the European Union via the Euratom Research and Training Programme (Grant Agreement No 101052200—EUROfusion). Views and opinions expressed are, however, those of the author(s) only and do not necessarily reflect those of the European Union or the European Commission. Neither the European Union nor the European Commission can be held responsible for them.
Acknowledgments
We acknowledge support by the KIT-Publication Fund of the KIT Institute of Technology.
Conflicts of Interest
The author declares no conflict of interest.
References
- Knaster, J.; Moeslang, A.; Muroga, T. Materials research for fusion. Nat. Phys. 2016, 12, 424–434. [Google Scholar] [CrossRef]
- Slocomb, H. Liquid Metal Level Measurement (Sodium) State-of-the-Art-Study; NAA-SR-MEMO-12582; Atomics International, Liquid Metal Engineering Center: Canoga Park, CA, USA, 1967. [CrossRef] [Green Version]
- Kondo, H.; Furukawa, T.; Hirakawa, Y.; Nakamura, K.; Ida, M.; Watanabe, K.; Kanemura, T.; Wakai, E.; Horiike, H.; Yamaoka, N.; et al. IFMIF/EVEDA lithium test loop: Design and fabrication technology of target assembly as a key component. Nucl. Fusion 2011, 51, 123008. [Google Scholar] [CrossRef]
- Yoshihashi-Suzuki, S.; Sugiura, H.; Hoashi, E.; Kondo, H.; Kanemura, T.; Yamaoka, N.; Ida, M.; Nakamura, H.; Nakamura, K.; Matsushita, I.; et al. Overview: Free Surface Measurement with Renewed Nozzle of Osaka Li Loop. Fusion Engineering and Design 86.9. In Proceedings of the 26th Symposium of Fusion Technology (SOFT-26), Porto, Portugal, 27 September–1 October 2010; pp. 2577–2580. [Google Scholar] [CrossRef]
- Hvasta, M.G.; Kolemen, E.; Fisher, A. Application of IR imaging for free-surface velocity measurement in liquid-metal systems. Rev. Sci. Instrum. 2017, 88, 013501. [Google Scholar] [CrossRef] [PubMed]
- Kanemura, T.; Kondo, H.; Yamaoka, N.; Miyamoto, S.; Ida, M.; Nakamura, H.; Matsushita, I.; Muroga, T.; Horiike, H. Investigation of Free-Surface Fluctuations of Liquid Lithium Flow for IFMIF Lithium Target by using an Electro-Contact Probe. Fusion Engineering and Design 82.15. In Proceedings of the 24th Symposium on Fusion Technology, Warsaw, Poland, 11–15 September 2006; pp. 2550–2557. [Google Scholar] [CrossRef]
- Wakai, E.; Kanemura, T.; Kondo, H.; Hirakawa, Y.; Ito, Y.; Serizawa, H.; Kawahito, Y.; Higashi, T.; Suzuki, A.; Fukada, S.; et al. Engineering validation for lithium target facility of the IFMIF under IFMIF/EVEDA project. Nucl. Mater. Energy 2016, 9, 278–285. [Google Scholar] [CrossRef] [Green Version]
- Kondo, H.; Kanemura, T.; Yamaoka, N.; Miyamoto, S.; Ida, M.; Nakamura, H.; Matushita, I.; Muroga, T.; Horiike, H. Measurement of Free Surface of Liquid Metal Lithium Jet for IFMIF Target. Fusion Engineering and Design 82.15. In Proceedings of the 24th Symposium on Fusion Technology, Warsaw, Poland, 11–15 September 2006; pp. 2483–2489. [Google Scholar] [CrossRef]
- Narula, M.; Ying, A.; Abdou, M.A. A Study of Liquid Metal Film Flow, Under Fusion Relevant Magnetic Fields. Fusion Sci. Technol. 2005, 47, 564–568. [Google Scholar] [CrossRef]
- Hvasta, M.; Kolemen, E.; Fisher, A.; Ji, H. Demonstrating electromagnetic control of free-surface, liquid-metal flows relevant to fusion reactors. Nucl. Fusion 2017, 58, 016022. [Google Scholar] [CrossRef]
- Yang, J.-C.; Qi, T.-Y.; Ren, D.-W.; Liu, B.-Q.; Ni, M.-J. Rearrangement of liquid metal surface waves by a uniform transverse magnetic field. Exp. Fluids 2018, 59, 165. [Google Scholar] [CrossRef]
- Hillenbrand, M.P. Qualifizierung einer Messtechnik zur Erfassung freier Grenzflächen bei Flüssigmetallen; Wissenschaftliche Berichte FZKA: Karlsruhe, Germany, 2008. [Google Scholar] [CrossRef]
- Kanemura, T.; Kondo, H.; Hoashi, E.; Yoshihashi-Suzuki, S.; Yamaoka, N.; Horiike, H.; Furukawa, T.; Hirakawa, Y.; Wakai, E. Evaluation of Applicability of Laserbased Distance Meter to Measure Li-Jet Thickness for IFMIF/EVEDA Project. Fusion Engineering and Design 89.7. In Proceedings of the 11th International Symposium on Fusion Nuclear Technology-11 (ISFNT-11), Barcelona, Spain, 15–20 September 2013; pp. 1642–1647. [Google Scholar] [CrossRef]
- Kondo, H.; Kanemura, T.; Hirakawa, Y.; Furukawa, T. Conceptual design and verification of long-distance laser-probe system for Li target diagnostics of intense fusion neutron source. Fusion Eng. Des. 2018, 136, 24–28. [Google Scholar] [CrossRef]
- Buchenau, D.; Eckert, S.; Gerbeth, G.; Stieglitz, R.; Dierckx, M. Measurement technique developments for LBE flows. J. Nucl. Mater. 2011, 415, 396–403. [Google Scholar] [CrossRef]
- 5N Plus. 5N Plus Inc., 4385 Garand Street Montreal, Quebec H4R 2B4, Canada. 2022. Available online: https://www.5nplus.com/low-melting-point-alloys.html (accessed on 11 November 2022).
- Plevachuk, Y.; Sklyarchuk, V.; Eckert, S.; Gerbeth, G.; Novakovic, R. Thermophysical Properties of the Liquid Ga–In–Sn Eutectic Alloy. J. Chem. Eng. Data 2014, 59, 757–763. [Google Scholar] [CrossRef]
- HEXAGON. Leica Absolute Tracker ATS600; Hexagon Metrology GmbH: Wetzlar, Germany, 2021; Available online: https://www.hexagonmi.com/de-DE/products/laser-tracker-systems/leica-absolute-tracker-ats600 (accessed on 28 September 2022).
- Siegel, T.; Kolokotronis, E.; Cifuentes, A.; Matia-Hernando, P.; Sansa, A.; Symeonidou, P.; Bates, P.; Damiani, C.; Dubus, G.; Puiu, A.; et al. In-vessel viewing system prototype performance measurements and simulation of measurement quality across the ITER in-vessel components. Fusion Eng. Des. 2019, 146, 2348–2352. [Google Scholar] [CrossRef]
- Blender Institute. Blender 2.82a; Blender Institute B.V.: Amsterdam, The Netherlands, 2020; Available online: https://download.blender.org/release/ (accessed on 28 September 2022).
- Matia-Hernando, P.; Siegel, T.; Kolokotronis, E.; Bates, P.; Maiorino, M.; Urizar, M.P.; Symeonidou, P.; Damiani, C.; Dubus, G.; Puiu, A.; et al. Measurements of the angle-dependent reflectivity of plasma-facing components and assessment of the impact on the estimations of coverage of the IVVS measurements of the ITER VV. Fusion Eng. Des. 2020, 158, 111716. [Google Scholar] [CrossRef]
- Ashikhmin, M.; Shirley, P. An Anisotropic Phong BRDF Model. J. Graph. Tools 2000, 5, 25–32. [Google Scholar] [CrossRef]
Figure 1.
Sketch of the DONES target.

Figure 2.
(a) Flat specular GaInSn model surface and (b) wavy specular GaInSn surface.

Figure 3.
Sketch and picture of the ATS600 measurement setup.

Figure 4.
(a) Model surfaces in Blender. (b) Waviness of the surface and (c) normal map of the small surface waves.
Figure 4.
(a) Model surfaces in Blender. (b) Waviness of the surface and (c) normal map of the small surface waves.

Figure 5.
Measurement of the diffuse reference surface in the glove box at different height levels. The measured averages are 0 mm, 5.3 mm and 10.5 mm. The standard deviation is 0.11 mm. On the right, the probability density function (pdf) is shown.
Figure 5.
Measurement of the diffuse reference surface in the glove box at different height levels. The measured averages are 0 mm, 5.3 mm and 10.5 mm. The standard deviation is 0.11 mm. On the right, the probability density function (pdf) is shown.

Figure 6.
Measurement of the wavy specular surface at different height levels. The measured averages are 0 mm, 5.2 mm and 10.4 mm. The standard deviation is 0.79 mm. On the right, the probability density function (pdf) is shown.
Figure 6.
Measurement of the wavy specular surface at different height levels. The measured averages are 0 mm, 5.2 mm and 10.4 mm. The standard deviation is 0.79 mm. On the right, the probability density function (pdf) is shown.

Figure 7.
Point cloud of a plate with an idealized wake profile and small surface waves with an amplitude of A = 0.28 mm.
Figure 7.
Point cloud of a plate with an idealized wake profile and small surface waves with an amplitude of A = 0.28 mm.

Publisher’s Note: MDPI stays neutral with regard to jurisdictional claims in published maps and institutional affiliations. |
© 2022 by the author. Licensee MDPI, Basel, Switzerland. This article is an open access article distributed under the terms and conditions of the Creative Commons Attribution (CC BY) license (https://creativecommons.org/licenses/by/4.0/).
Share and Cite
MDPI and ACS Style
Brenneis, B. Long Range Optical Distance Sensors for Liquid Metal Free Surface Detection. J. Nucl. Eng. 2022, 3, 364-372. https://doi.org/10.3390/jne3040023
AMA Style
Brenneis B. Long Range Optical Distance Sensors for Liquid Metal Free Surface Detection. Journal of Nuclear Engineering. 2022; 3(4):364-372. https://doi.org/10.3390/jne3040023
Chicago/Turabian StyleBrenneis, Björn. 2022. "Long Range Optical Distance Sensors for Liquid Metal Free Surface Detection" Journal of Nuclear Engineering 3, no. 4: 364-372. https://doi.org/10.3390/jne3040023