
The Role of Women’s and Men’s Body Shapes in Explicit and Implicit Fat Stigma

Abstract
:1. The Role of Women’s and Men’s Body Shapes in Explicit and Implicit Fat Stigma
2. What We Know about the Role of Shape in Fat Stigma
3. What Remains Unknown about the Role of Shape in Fat Stigma
Fat Stigma, Body Shape, and Men
4. Open Practices
5. Studies 1 and 2
5.1. Method
5.1.1. Study 1 Participants
5.1.2. Study 2 Participants
5.2. Procedure
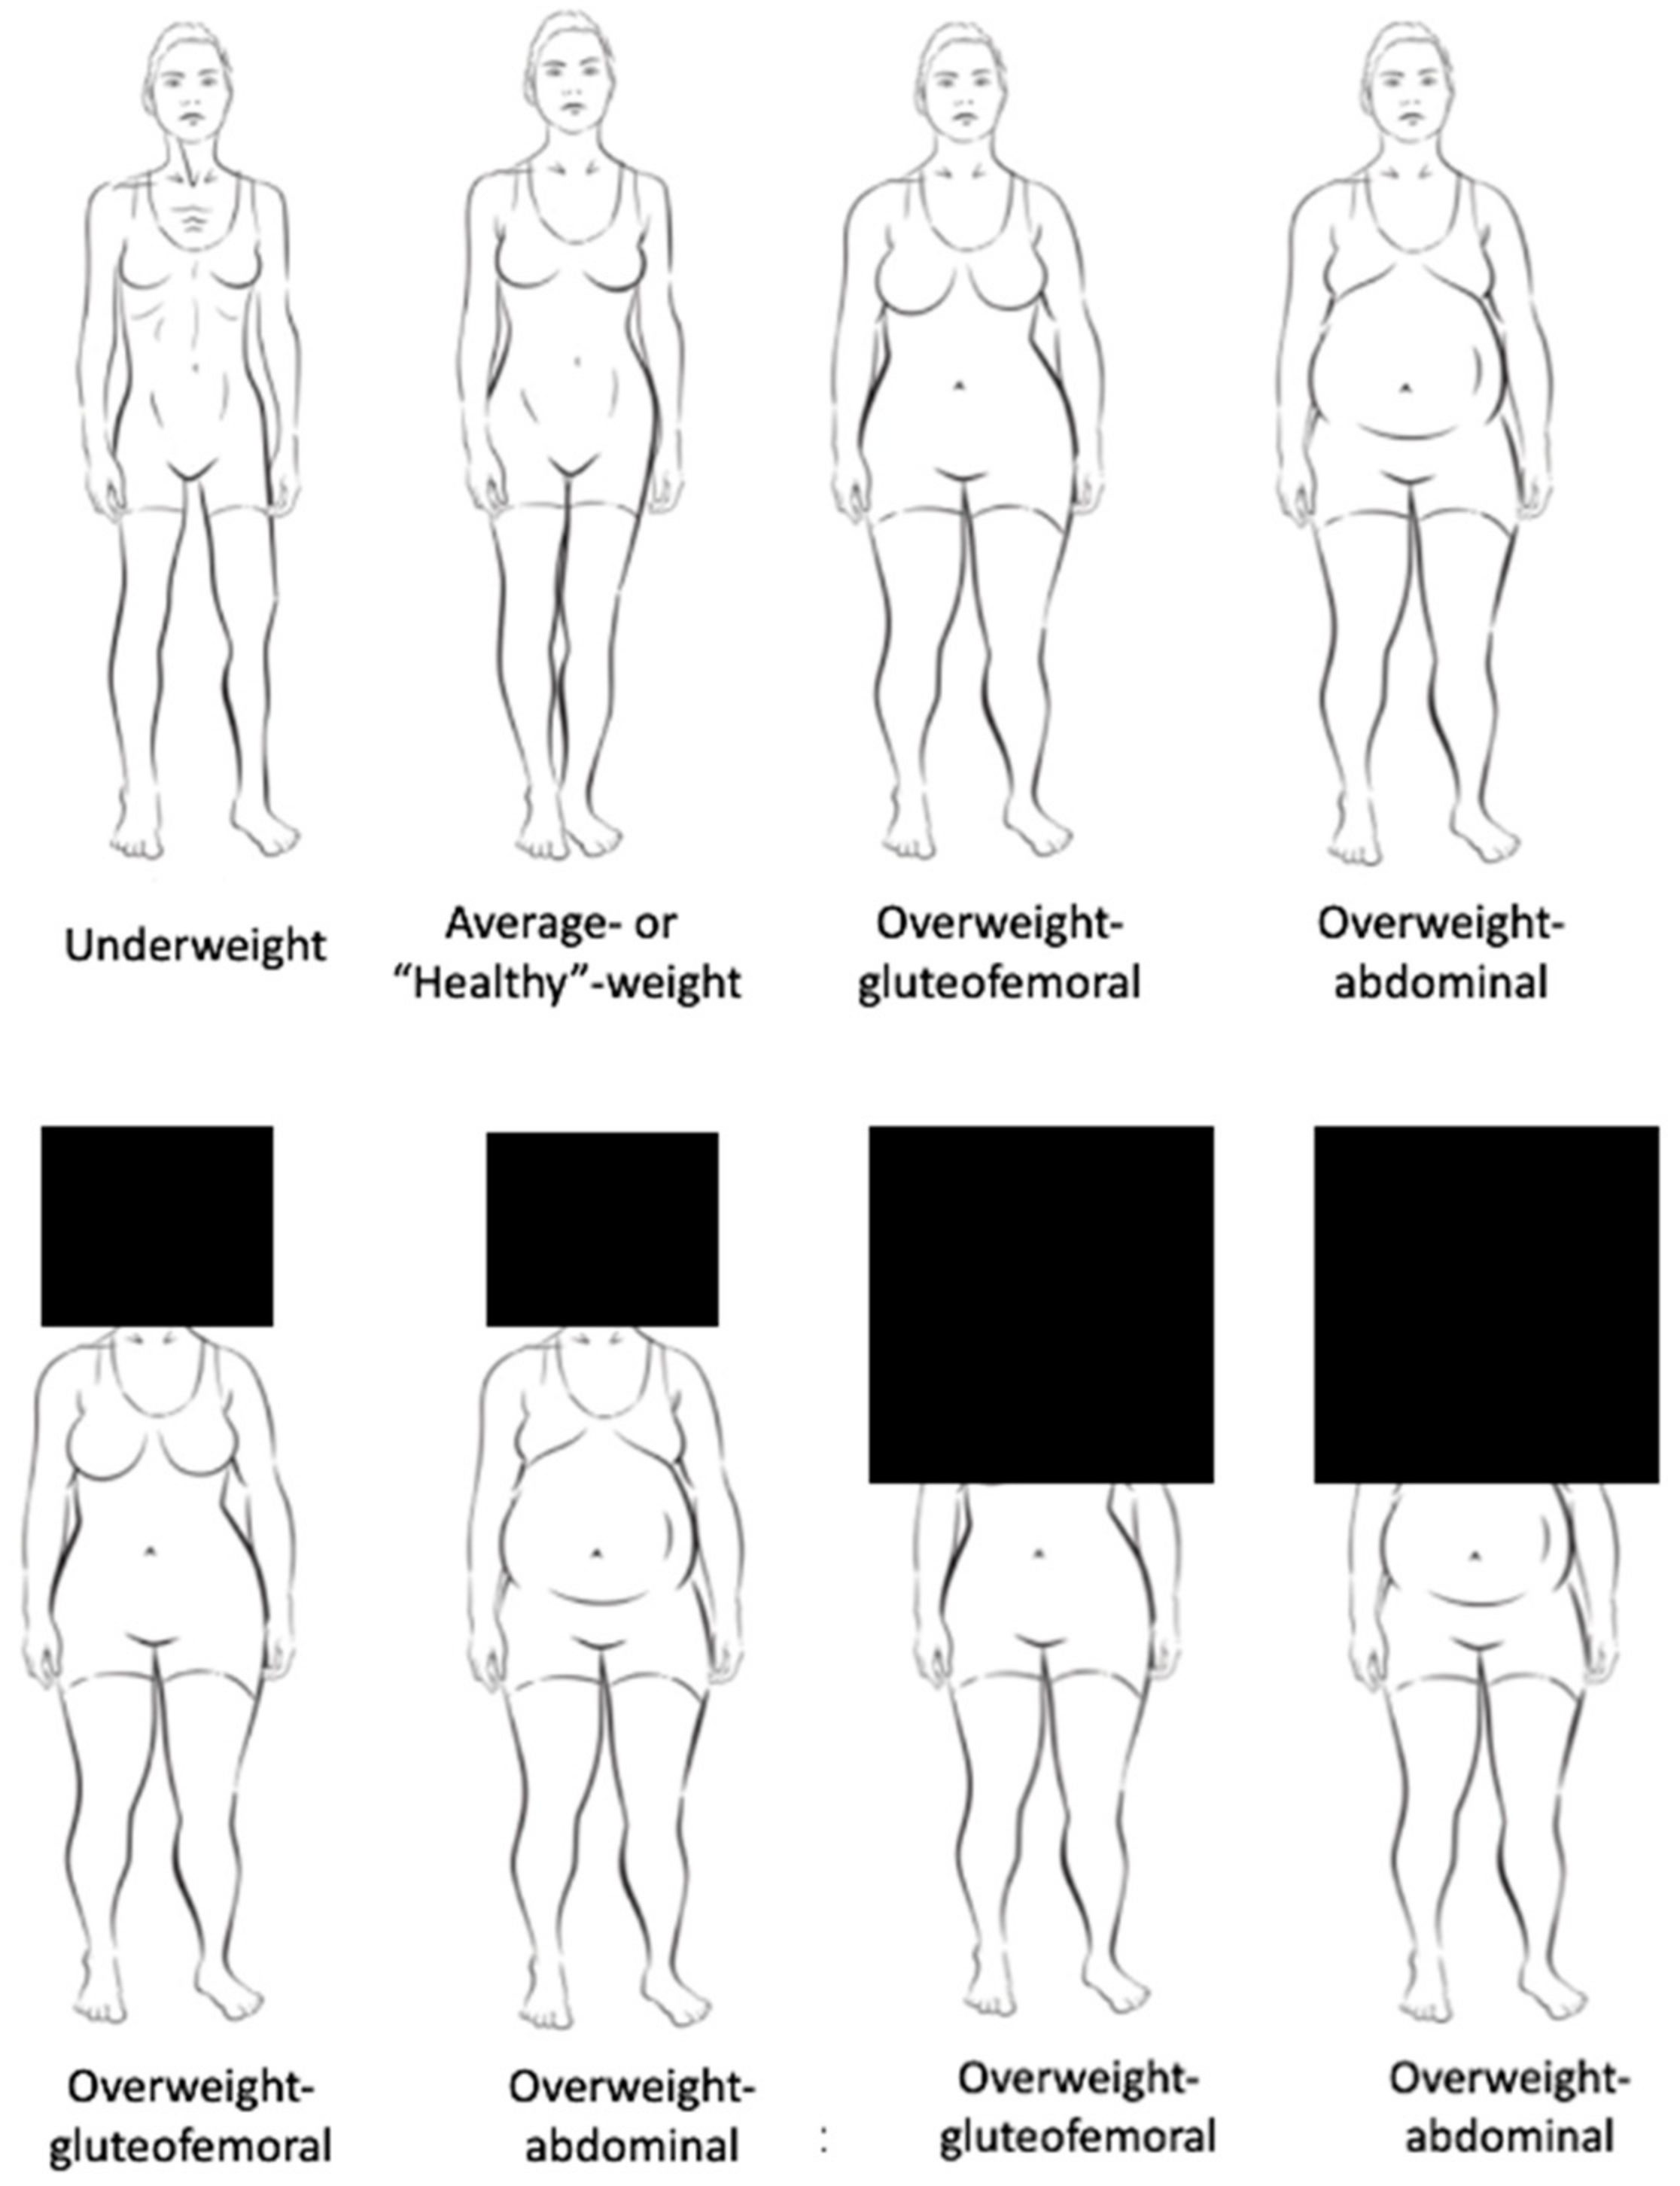
5.3. Materials
6. Results
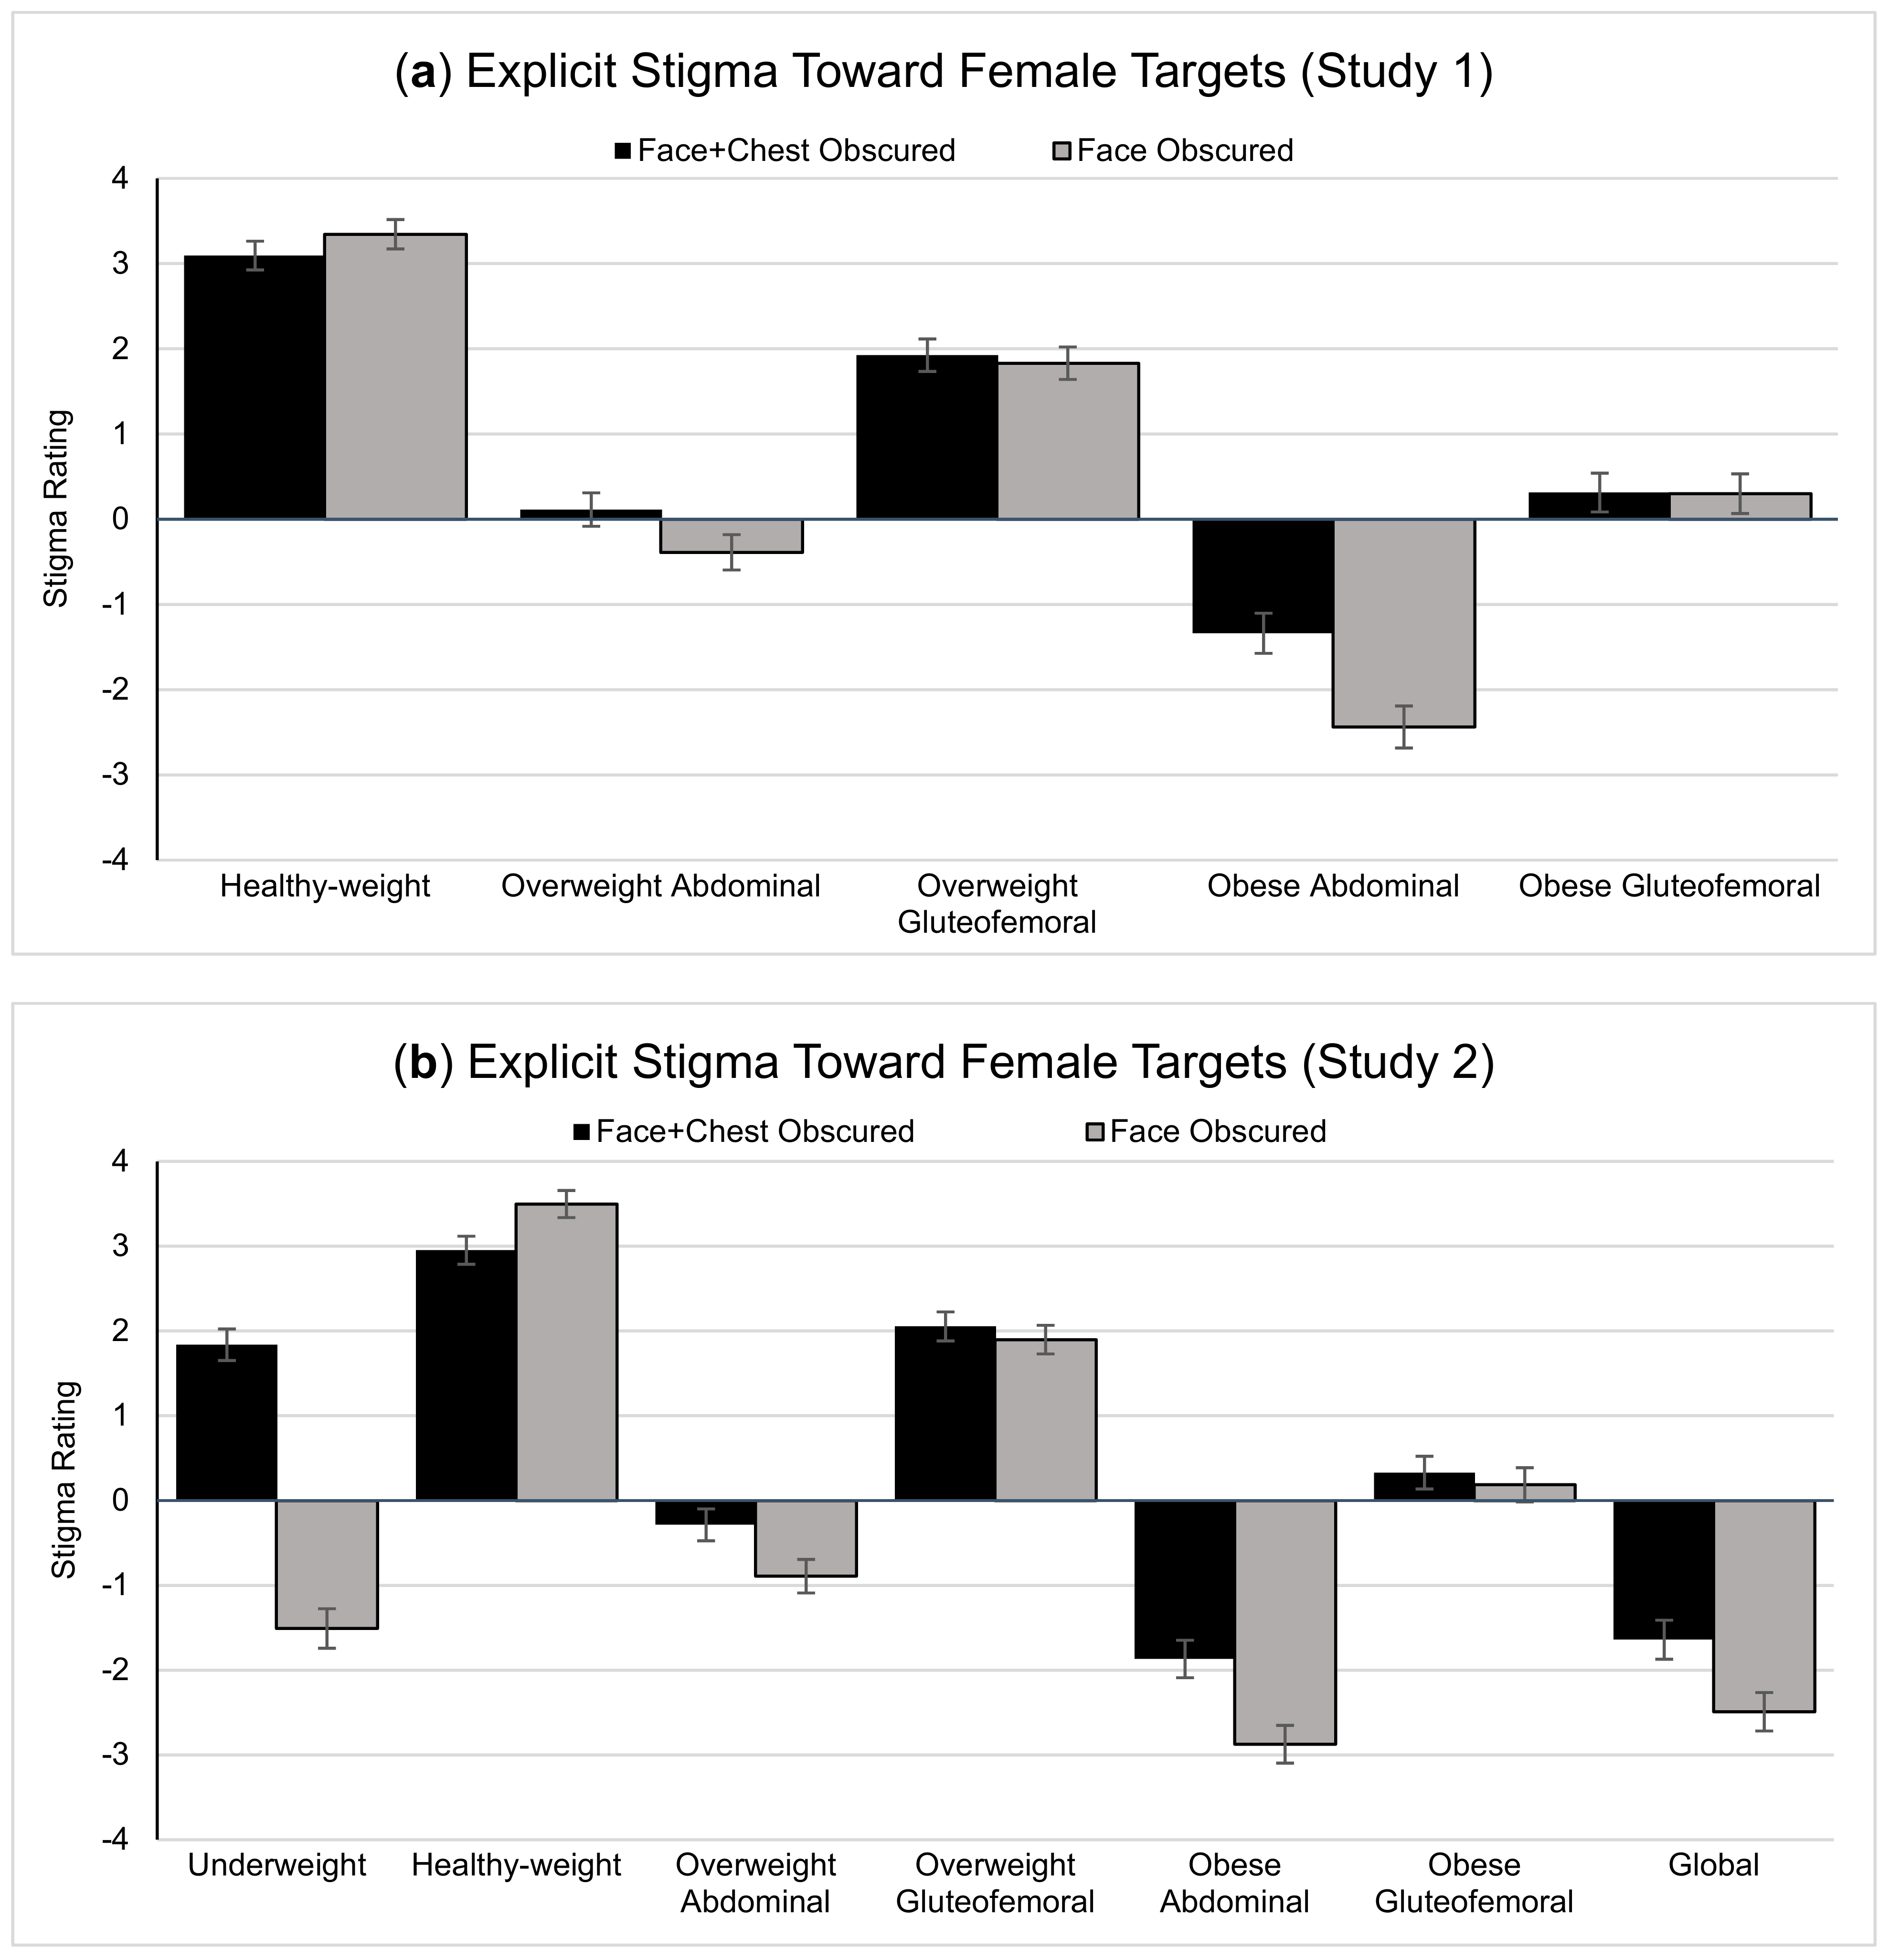
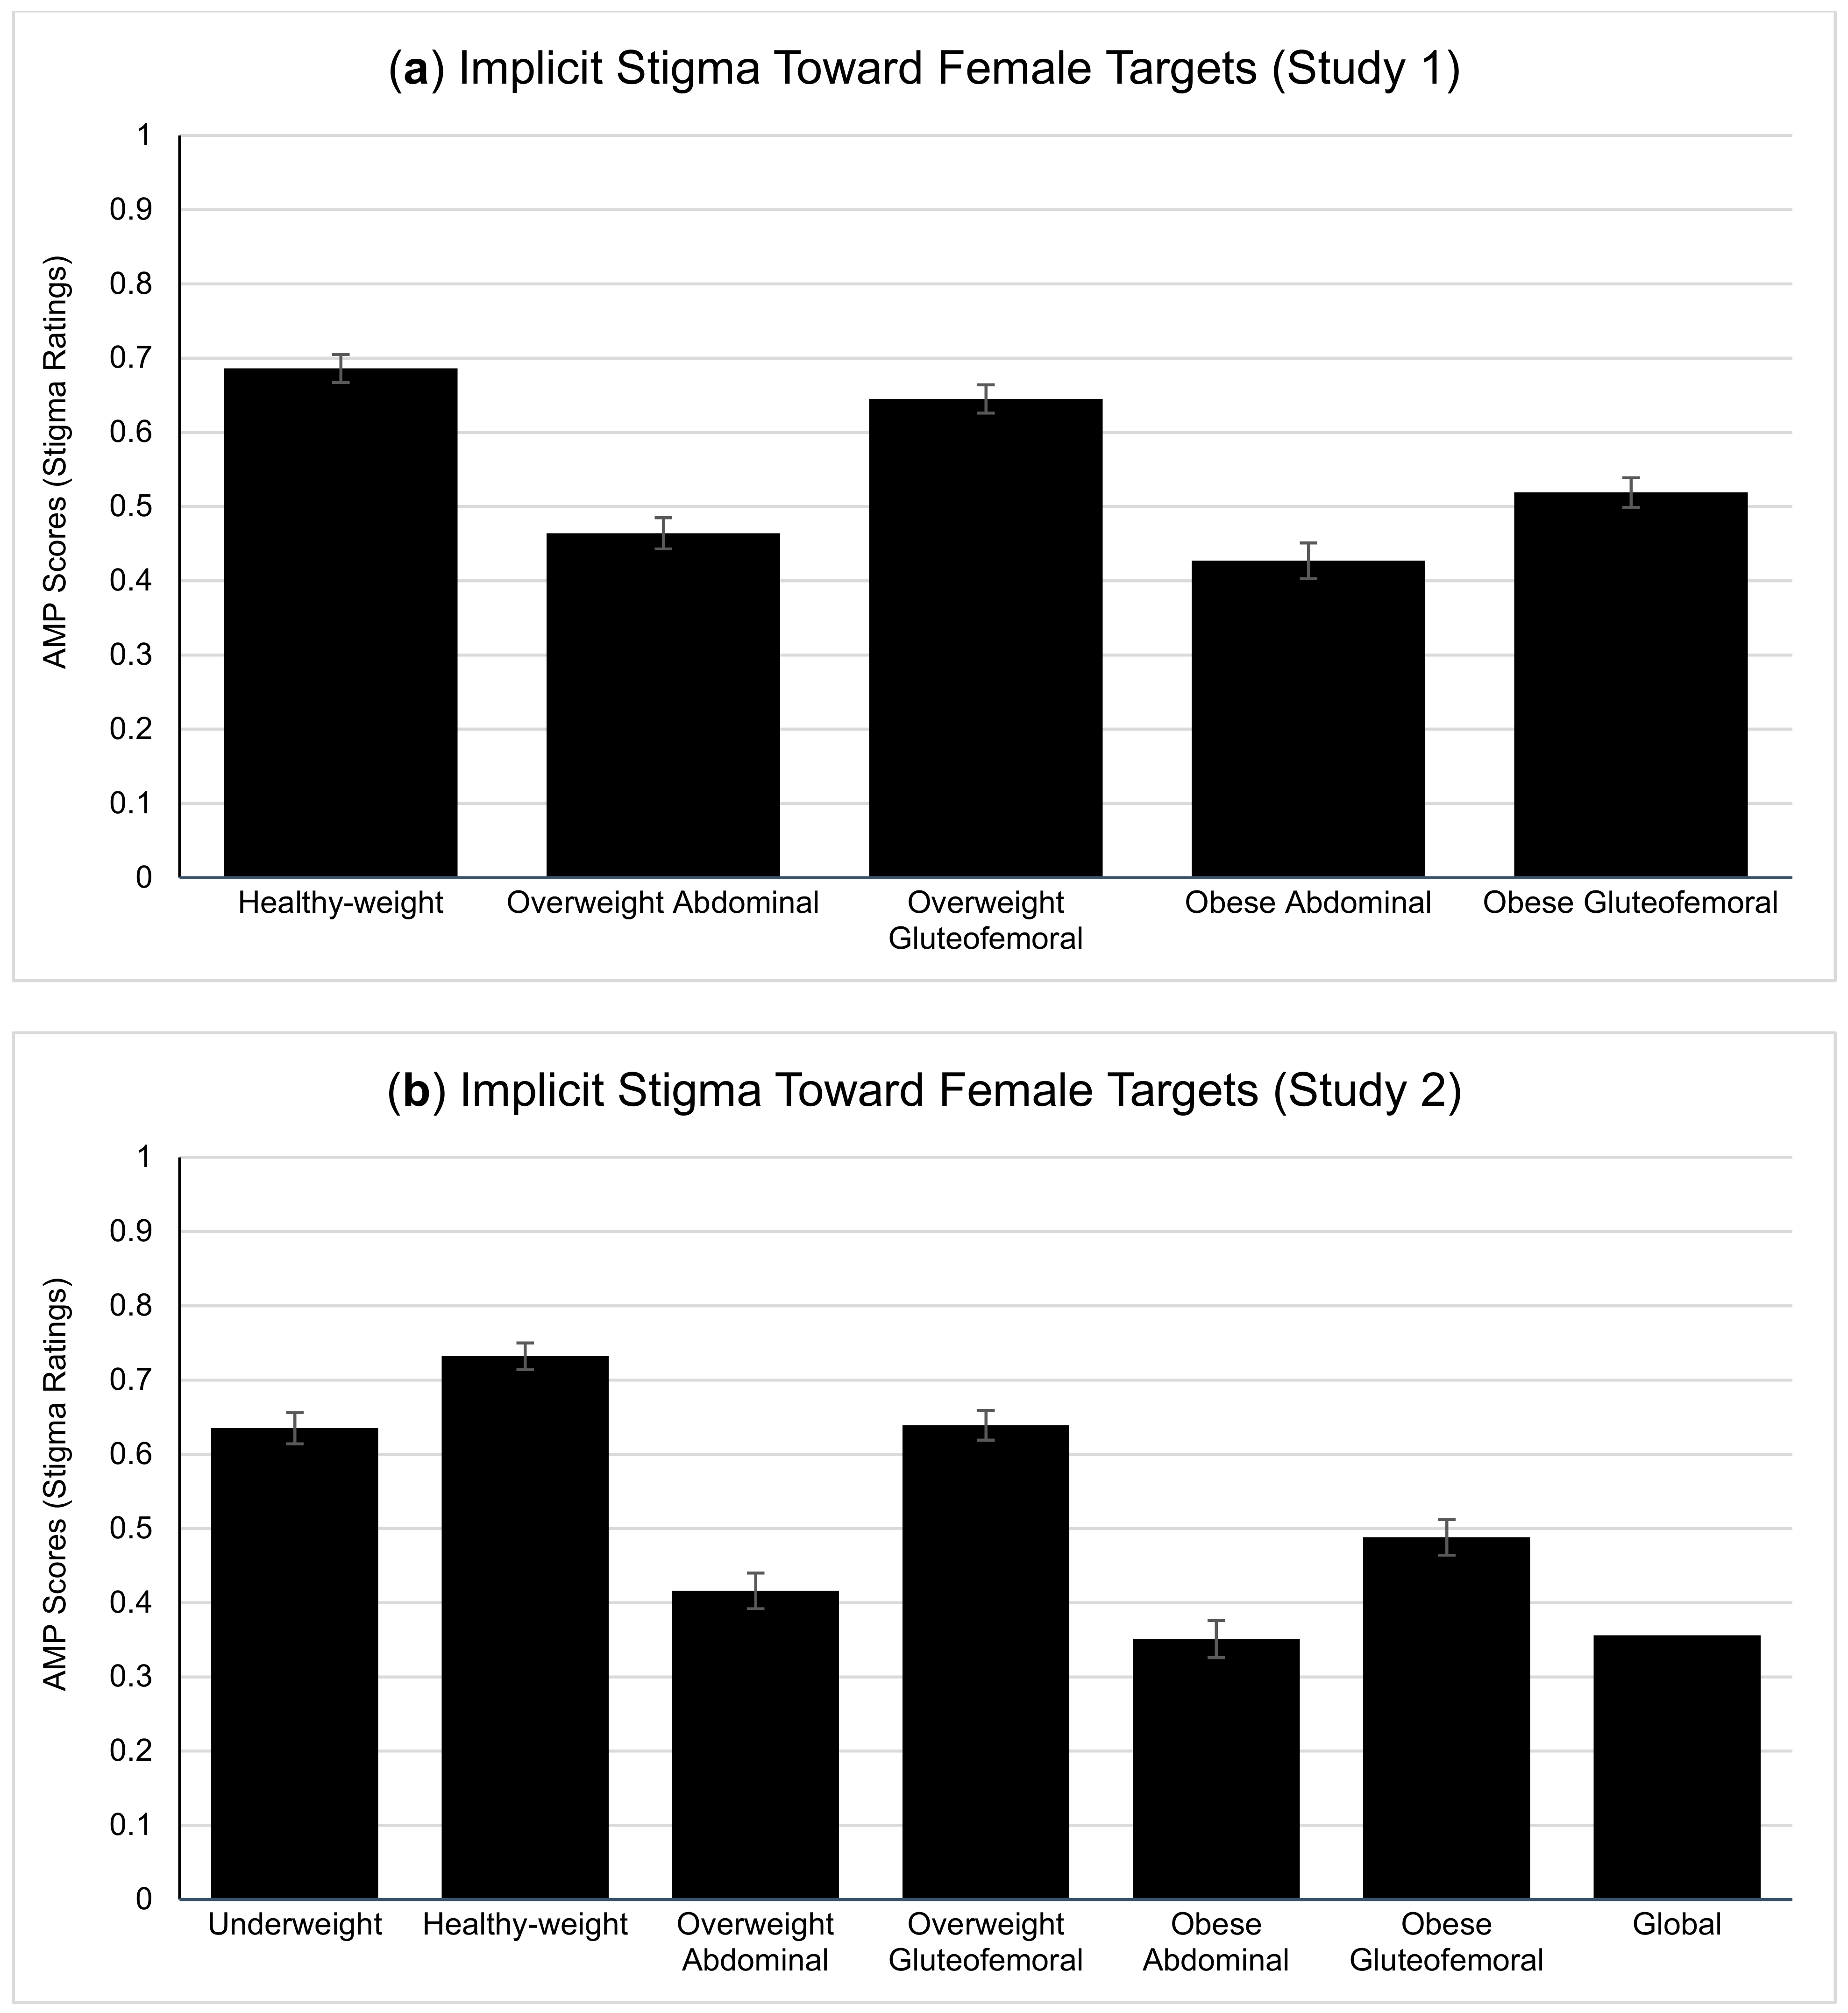
6.1. Does Shape Influence Fat Stigma toward Women?
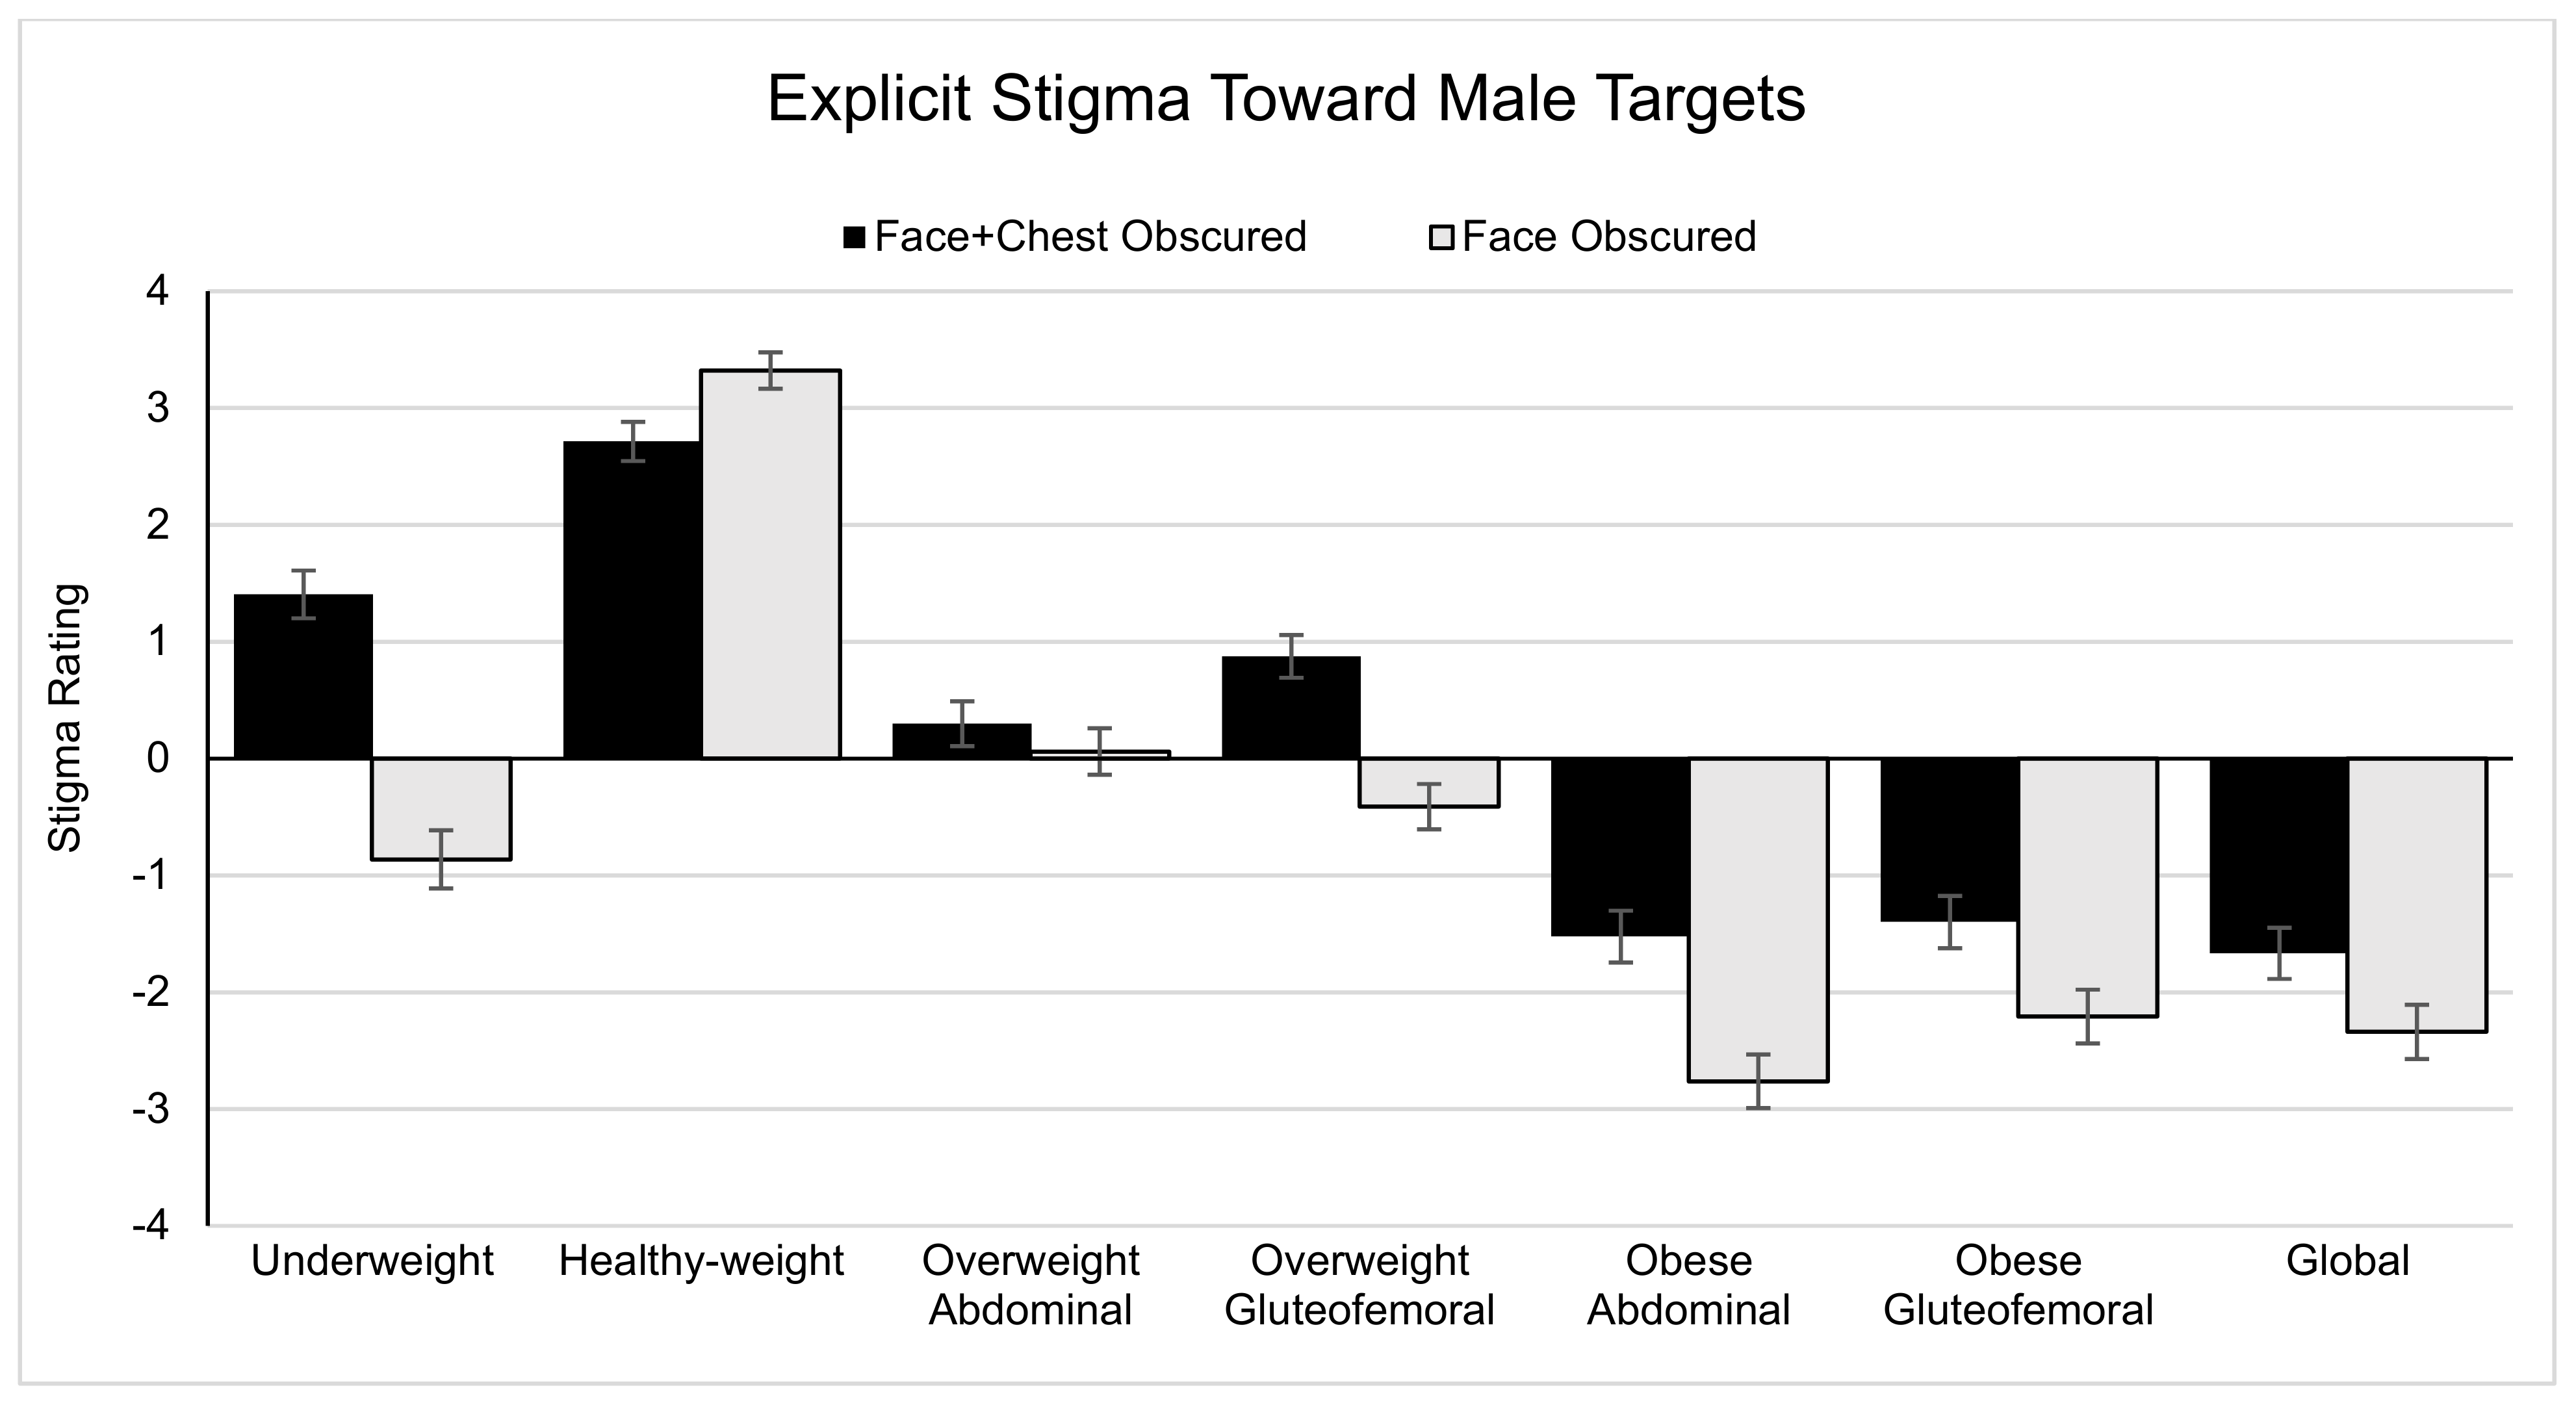
6.2. Does Shape Influence Explicit Fat Stigma toward Men?
6.3. Links between Explicit and Implicit Stigma?
6.4. Does Target Gender Influence Stigma?
6.5. Individual Differences in Explicit and/or Implicit Stigma?
7. Discussion
8. Limitations and Future Directions
Supplementary Materials
Author Contributions
Funding
Institutional Review Board Statement
Informed Consent Statement
Data Availability Statement
Acknowledgments
Conflicts of Interest
References
- Brewis, A.A.; Wutich, A. Explicit versus implicit fat-stigma. Am. J. Hum. Biol. 2012, 24, 332–338. [Google Scholar] [CrossRef] [PubMed]
- Crandall, C.S. Do Parents Discriminate against Their Heavyweight Daughters? Pers. Soc. Psychol. Bull. 1995, 21, 724–735. [Google Scholar] [CrossRef]
- Crandall, C.S. Prejudice against fat people: Ideology and self-interest. J. Pers. Soc. Psychol. 1994, 66, 882–894. [Google Scholar] [CrossRef] [PubMed]
- Foster, G.D.; Wadden, T.A.; Makris, A.P.; Davidson, D.; Sanderson, R.S.; Allison, D.B.; Kessler, A. Primary Care Physicians’ Attitudes about Obesity and Its Treatment. Obes. Res. 2003, 11, 1168–1177. [Google Scholar] [CrossRef]
- Hatzenbuehler, M.L.; Phelan, J.C.; Link, B.G. Stigma as a Fundamental Cause of Population Health Inequalities. Am. J. Public Health 2013, 103, 813–821. [Google Scholar] [CrossRef]
- Janssen, I.; Craig, W.M.; Boyce, W.F.; Pickett, W. Associations Between Overweight and Obesity with Bullying Behaviors in School-Aged Children. Pediatrics 2004, 113, 1187–1194. [Google Scholar] [CrossRef] [Green Version]
- Kenrick, A.C.; Shapiro, J.R.; Neuberg, S.L. Do Parental Bonds Break Anti-fat Stereotyping?: Parental Work Ethic Ideology and Disease Concerns Predict Bias Against Heavyweight Children. Soc. Psychol. Personal. Sci. 2013, 4, 721–729. [Google Scholar] [CrossRef]
- Puhl, R.M.; Heuer, C.A. The Stigma of Obesity: A Review and Update. Obesity 2009, 17, 941–964. [Google Scholar] [CrossRef] [Green Version]
- Sjöberg, R.L.; Nilsson, K.W.; Leppert, J. Obesity, Shame, and Depression in School-Aged Children: A Population-Based Study. Pediatrics 2005, 116, e389–e392. [Google Scholar] [CrossRef] [Green Version]
- Brewis, A.; Sturtzsreetharan, C.; Wutich, A. Obesity stigma as a globalizing health challenge. Glob. Health 2018, 14, 20. [Google Scholar] [CrossRef]
- Jackson, S.E.; Beeken, R.J.; Wardle, J. Perceived weight discrimination and changes in weight, waist circumference, and weight status. Obesity 2014, 22, 2485–2488. [Google Scholar] [CrossRef] [PubMed]
- Major, B.; Hunger, J.M.; Bunyan, D.P.; Miller, C.T. The ironic effects of weight stigma. J. Exp. Soc. Psychol. 2014, 51, 74–80. [Google Scholar] [CrossRef]
- Major, B.; Tomiyama, A.J.; Hunger, J.M. The negative and bidirectional effects of weight stigma on health. In The Oxford Handbook of Stigma, Discrimination, and Health; Oxford University Press: Oxford, UK, 2018; Volume 556, pp. 499–519. [Google Scholar]
- Puhl, R.M.; Brownell, K.D. Psychosocial origins of obesity stigma: Toward changing a powerful and pervasive bias. Obes. Rev. 2003, 4, 213–227. [Google Scholar] [CrossRef]
- Tomiyama, A.J.; Carr, D.; Granberg, E.M.; Major, B.; Robinson, E.; Sutin, A.R.; Brewis, A. How and why weight stigma drives the obesity “epidemic” and harms health. BMC Med. 2018, 16, 123. [Google Scholar] [CrossRef]
- Rubino, F.; Puhl, R.M.; Cummings, D.E.; Eckel, R.H.; Ryan, D.H.; Mechanick, J.I.; Nadglowski, J.; Ramos Salas, X.; Schauer, P.R.; Twenefour, D.; et al. Joint international consensus statement for ending stigma of obesity. Nat. Med. 2020, 26, 485–497. [Google Scholar] [CrossRef] [PubMed] [Green Version]
- Krems, J.A.; Neuberg, S.L. Updating Long-Held Assumptions About Fat Stigma: For Women, Body Shape Plays a Critical Role. Soc. Psychol. Pers. Sci. 2021, 13, 70–82. [Google Scholar] [CrossRef]
- Diedrichs, P.C.; Puhl, R. Weight bias: Prejudice and discrimination toward overweight and obese people. In The Cambridge Handbook of the Psychology of Prejudice; Sibley, C., Ed.; Cambridge University Press: Cambridge, UK, 2017; Volume 671, pp. 392–412. [Google Scholar]
- Jayedi, A.; Soltani, S.; Zargar, M.S.; Khan, T.A.; Shab-Biidar, S. Central fatness and risk of all cause mortality: Systematic review and doe-response meta-analysis of 72 prospective cohort studies. Br. Med. J. 2020, 370, m3324. [Google Scholar] [CrossRef]
- Lassek, W.D.; Gaulin, S.J.C. Do the Low WHRs and BMIs Judged Most Attractive Indicate Better Health? Evol. Psychol. 2018, 16, 147470491880399. [Google Scholar] [CrossRef] [PubMed] [Green Version]
- Lassek, W.D.; Gaulin, S.J.C. Do the Low WHRs and BMIs Judged Most Attractive Indicate Higher Fertility? J. Evol. Psychol. 2018, 16, 1474704918800063. [Google Scholar] [CrossRef] [Green Version]
- Sacco, D.F.; Holifield, K.; Drea, K.; Brown, M.; Macchione, A. Dad and Mom Bods? Inferences of Parenting Ability from Bodily Cues. Evol. Psychol. Sci. 2020, 6, 207–214. [Google Scholar] [CrossRef]
- Nosek, B.A.; Greenwald, A.G.; Banaji, M.R. The Implicit Association Test at age 7: A methodological and conceptual review. In Social Psychology and the Unconscious: The Automaticity of Higher Mental Processes; Bargh, J.A., Ed.; Psychology Press: London, UK, 2006; pp. 265–292. [Google Scholar]
- Payne, B.K.; Cheng, C.M.; Govorun, O.; Stewart, B.D. An inkblot for attitudes: Affect misattribution as implicit measurement. J. Pers. Soc. Psychol. 2005, 89, 277–293. [Google Scholar] [CrossRef] [Green Version]
- Guedj, R.; Marini, M.; Kossowsky, J.; Berde, C.; Mateo, C.; Fleegler, E.W. Explicit and implicit bias based on race, ethnicity, and weight among pediatric emergency physicians. Acad. Emerg. Med. 2021, 28, 1073–1076. [Google Scholar] [CrossRef] [PubMed]
- Sabin, J.A.; Maddalena, M.; Nosek, B.A. Implicit and explicit anti-fat bias among a large sample of medical doctors by BMI, race/ethnicity and gender. PLoS ONE 2012, 7, e48448. [Google Scholar] [CrossRef] [Green Version]
- Nosek, B.A.; Hawkins, C.B.; Frazier, R.S. Implicit social cognition: From measures to mechanisms. Trends Cogn. Sci. 2011, 15, 152–159. [Google Scholar] [CrossRef] [PubMed]
- Nosek, B.A.; Hawkins, C.; Frazier, R.S. Implicit social cognition. Soc. Cogn. 2012, 31–53. [Google Scholar]
- Fitzgerald, C.; Hurst, S. Implicit bias in healthcare professionals: A systematic review. BMC Med. Ethic 2017, 18, 19. [Google Scholar] [CrossRef] [Green Version]
- Schwartz, M.B.; Vartanian, L.; Nosek, B.; Brownell, K.D. The Influence of One’s Own Body Weight on Implicit and Explicit Anti-fat Bias. Obesity 2006, 14, 440–447. [Google Scholar] [CrossRef] [PubMed]
- Schwartz, M.B.; Chambliss, H.O.; Brownell, K.D.; Blair, S.N.; Billington, C. Weight Bias among Health Professionals Specializing in Obesity. Obes. Res. 2003, 11, 1033–1039. [Google Scholar] [CrossRef]
- Teachman, B.; Brownell, K. Implicit anti-fat bias among health professionals: Is anyone immune? Int. J. Obes. 2001, 25, 1525–1531. [Google Scholar] [CrossRef] [Green Version]
- Rudman, L.A. Sources of Implicit Attitudes. Curr. Dir. Psychol. Sci. 2004, 13, 79–82. [Google Scholar] [CrossRef]
- Marini, M.; Sriram, N.; Schnabel, K.; Maliszewski, N.; Devos, T.; Ekehammar, B.; Wiers, R.; HuaJian, C.; Somogyi, M.; Shiomura, K.; et al. Overweight People Have Low Levels of Implicit Weight Bias, but Overweight Nations Have High Levels of Implicit Weight Bias. PLoS ONE 2013, 8, e83543. [Google Scholar] [CrossRef] [PubMed] [Green Version]
- Vartanian, L.R.; Herman, C.P.; Polivy, J. Implicit and explicit attitudes toward fatness and thinness: The role of the internalization of societal standards. Body Image 2005, 2, 373–381. [Google Scholar] [CrossRef]
- Greenwald, A.G.; Banaji, M.R. Implicit social cognition: Attitudes, self-esteem, and stereotypes. Psychol. Rev. 1995, 102, 4. [Google Scholar] [CrossRef]
- Marini, M. Underweight vs. overweight/obese: Which weight category do we prefer? Obes. Sci. Pract. 2017, 3, 390–398. [Google Scholar] [CrossRef]
- Robertson, N.; Vohora, R. Fitness vs. fatness: Implicit bias towards obesity among fitness professionals and regular exercisers. Psychol. Sport Exerc. 2008, 9, 547–557. [Google Scholar] [CrossRef]
- Brochu, P.; Morrison, M.A. Implicit and Explicit Prejudice Toward Overweight and Average-Weight Men and Women: Testing Their Correspondence and Relation to Behavioral Intentions. J. Soc. Psychol. 2007, 147, 681–706. [Google Scholar] [CrossRef]
- Park, J.H.; Schaller, M.; Crandall, C.S. Pathogen-avoidance mechanisms and the stigmatization of obese people. Evol. Hum. Behav. 2007, 28, 410–414. [Google Scholar] [CrossRef]
- Tybur, J.M.; Lieberman, D.; Griskevicius, V. Microbes, mating, and morality: Individual differences in three functional domains of disgust. J. Pers. Soc. Psychol. 2009, 97, 103–122. [Google Scholar] [CrossRef] [PubMed] [Green Version]
- Lieberman, D.L.; Tybur, J.M.; Latner, J.D. Disgust Sensitivity, Obesity Stigma, and Gender: Contamination Psychology Predicts Weight Bias for Women, Not Men. Obesity 2012, 20, 1803–1814. [Google Scholar] [CrossRef]
- Han, S.-J.; Zaretsky, A.G.; Andrade-Oliveira, V.; Collins, N.; Dzutsev, A.; Shaik, J.; da Fonseca, D.M.; Harrison, O.J.; Tamoutounour, S.; Byrd, A.L.; et al. White Adipose Tissue Is a Reservoir for Memory T Cells and Promotes Protective Memory Responses to Infection. Immunity 2017, 47, 1154–1168.e6. [Google Scholar] [CrossRef] [PubMed] [Green Version]
- Katz, I.; Hass, R.G. Racial ambivalence and American value conflict: Correlational and priming studies of dual cognitive structures. J. Pers. Soc. Psychol. 1988, 55, 893. [Google Scholar] [CrossRef]
- Allison, D.B.; Basile, V.C.; Yuker, H.E. The measurement of attitudes toward and beliefs about obese persons. Int. J. Eat. Disord. 1991, 10, 599–607. [Google Scholar] [CrossRef]
- Rudman, L.A.; Feinberg, J.; Fairchild, K. Minority Members’ Implicit Attitudes: Automatic Ingroup Bias as a Function of Group Status. Soc. Cogn. 2002, 20, 294–320. [Google Scholar] [CrossRef]
- Wang, S.S.; Brownell, K.D.; A Wadden, T. The influence of the stigma of obesity on overweight individuals. Int. J. Obes. 2004, 28, 1333–1337. [Google Scholar] [CrossRef] [PubMed] [Green Version]
- Open Science Framework. Available online: https://osf.io/3zd7a/ (accessed on 24 October 2018).
- Open Science Framework. Available online: https://osf.io/tvrb8/ (accessed on 24 October 2018).
- Payne, B.K.; Brown-Iannuzzi, J.; Burkley, M.; Arbuckle, N.L.; Cooley, E.; Cameron, C.D.; Lundberg, K.B. Intention invention and the affect misattribution procedure: Reply to Bar-Anan and Nosek (2012). Pers. Soc. Psychol. Bull. 2013, 39, 375–386. [Google Scholar] [CrossRef]
- Gawronski, B.; Ye, Y. What drives priming effects in the affect misattribution procedure? Pers. Soc. Psychol. Bull. 2014, 40, 3–15. [Google Scholar] [CrossRef] [PubMed]
- Ye, Y.; Gawronski, B. Validating the semantic misattribution procedure as an implicit measure of gender stereotyping. Eur. J. Soc. Psychol. 2018, 48, 348–364. [Google Scholar] [CrossRef] [Green Version]
- Magallares, A. Predictors of Social Distance Toward People with Obesity: The Role of Allophilia. Int. Rev. Soc. Psychol. 2017, 30, 102–110. [Google Scholar] [CrossRef] [Green Version]
- Millisecond Software 2017, Millisecond: Seattle, WA, USA, 2017.
- Neuberg, S.; Krems, J. The BODy Size and Shape (BODSS) Figure Set. OSF 2016. [Google Scholar] [CrossRef]
- Payne, K.; Lundberg, K. The Affect Misattribution Procedure: Ten Years of Evidence on Reliability, Validity, and Mechanisms. Soc. Pers. Psychol. Compass 2014, 8, 672–686. [Google Scholar] [CrossRef]
- Duncan, L.A.; Schaller, M.; Park, J.H. Perceived vulnerability to disease: Development and validation of a 15-item self-report instrument. Pers. Individ. Differ. 2009, 47, 541–546. [Google Scholar] [CrossRef]
- van Leeuwen, F.; Hunt, D.; Park, J.H. Is Obesity Stigma Based on Perceptions of Appearance or Character? Theory, Evidence, and Directions for Further Study. Evol. Psychol. 2015, 13, 1474704915600565. [Google Scholar] [CrossRef] [Green Version]
- Bar-Anan, Y.; Nosek, B.A. A comparative investigation of seven indirect attitude measures. Behav. Res. Methods 2014, 46, 668–688. [Google Scholar] [CrossRef] [Green Version]
- Bar-Anan, Y.; Vianello, M. A multi-method multi-trait test of the dual-attitude perspective. J. Exp. Psychol. Gen. 2018, 147, 1264–1272. [Google Scholar] [CrossRef] [PubMed] [Green Version]
- Cameron, C.D.; Brown-Iannuzzi, J.L.; Payne, B.K. Sequential priming measures of implicit social cognition: A meta-analysis of associations with behavior and explicit attitudes. Pers. Soc. Psychol. 2012, 16, 330–350. [Google Scholar] [CrossRef]
- Greenwald, A.G.; Poehlman, T.A.; Uhlmann, E.L.; Banaji, M.R. Understanding and using the Implicit Association Test: III. Meta-analysis of predictive validity. J. Pers. Soc. Psychol. 2009, 97, 17–41. [Google Scholar] [CrossRef] [Green Version]
- Oswald, F.L.; Mitchell, G.; Blanton, H.; Jaccard, J.; Tetlock, P.E. Predicting ethnic and racial discrimination: A meta-analysis of IAT criterion studies. J. Pers. Soc. Psychol. 2013, 105, 171–192. [Google Scholar] [CrossRef]
- Gawronski, B.; Hahn, A. Implicit measures: Procedures, use, and interpretation. In Measurement in Social Psychology; Blanton, H., LaCroix, J., Webster, G., Eds.; Taylor & Francis: Abingdon, UK, 2019; pp. 29–55. [Google Scholar]
- Payne, B.K.; Burkley, M.A.; Stokes, M.B. Why do implicit and explicit attitude tests diverge? The role of structural fit. J. Pers. Soc. Psychol. 2008, 94, 16–31. [Google Scholar] [CrossRef] [Green Version]
- Bessenoff, G.R.; Sherman, J.W. Automatic and Controlled Components of Prejudice toward Fat People: Evaluation versus Stereotype Activation. Soc. Cogn. 2000, 18, 329–353. [Google Scholar] [CrossRef]
- Devine, P.G. Stereotypes and prejudice: Their automatic and controlled components. J. Pers. Soc. Psychol. 1989, 56, 5. [Google Scholar] [CrossRef]
- Karpinski, A.; Hilton, J.L. Attitudes and the implicit association test. J. Pers. Soc. Psychol. 2001, 81, 774. [Google Scholar] [CrossRef]
- Frederick, D.A.; Haselton, M.G. Why Is Muscularity Sexy? Tests of the Fitness Indicator Hypothesis. Pers. Soc. Psychol. Bull. 2007, 33, 1167–1183. [Google Scholar] [CrossRef]
- Gray, P.B.; Frederick, D.A. Body image and body type preferences in St. Kitts, Caribbean: A cross-cultural comparison with US samples regarding attitudes towards muscularity, body fat, and breast size. Evol. Psychol. 2012, 10, 147470491201000319. [Google Scholar] [CrossRef] [Green Version]
- Brown, P.J.; Konner, M. An Anthropological Perspective on Obesity. Ann. N. Y. Acad. Sci. 1987, 499, 29–46. [Google Scholar] [CrossRef] [PubMed]
- Kirchengast, S. Differential reproductive success and body size in! Kung San people from northern Namibia. Coll. Antropol. 2000, 24, 121–132. [Google Scholar]
- Sear, R. Size-dependent reproductive success in Gambian men: Does height or weight matter more? Biodemogr. Soc. Biol. 2006, 53, 172–188. [Google Scholar] [CrossRef] [Green Version]
- Anderson, J.L.; Crawford, C.B.; Nadeau, J.; Lindberg, T. Was the Duchess of windsor right? A cross-cultural review of the socioecology of ideals of female body shape. Ethol. Sociobiol. 1992, 13, 197–227. [Google Scholar] [CrossRef]
- Crandall, C.S.; Schiffhauer, K.L. Anti-Fat Prejudice: Beliefs, Values, and American Culture. Obes. Res. 1998, 6, 458–460. [Google Scholar] [CrossRef]
- Buss, D.M. Toward an evolutionary psychology of human mating. Behav. Brain Sci. 1989, 12, 39–49. [Google Scholar] [CrossRef]
- Walter, K.V.; Conroy-Beam, D.; Buss, D.M.; Asao, K.; Sorokowska, A.; Sorokowski, P.; Zupančič, M. Sex differences in mate preferences across 45 countries: A large-scale replication. Psychol. Sci. 2020, 31, 408–423. [Google Scholar] [CrossRef]
- O'Brien, K.S.; Puhl, R.M.; Latner, J.D.; Mir, A.S.; Hunter, J.A. Reducing Anti-Fat Prejudice in Preservice Health Students: A Randomized Trial. Obesity 2010, 18, 2138–2144. [Google Scholar] [CrossRef] [PubMed]
- Phelan, S.M.; Dovidio, J.F.; Puhl, R.M.; Burgess, D.J.; Nelson, D.B.; Yeazel, M.W.; Hardeman, R.; Perry, S.; Van Ryn, M. Implicit and explicit weight bias in a national sample of 4,732 medical students: The medical student CHANGES study. Obesity 2014, 22, 1201–1208. [Google Scholar] [CrossRef] [PubMed]
- Teachman, B.A.; Gapinski, K.D.; Brownell, K.D.; Rawlins, M.; Jeyaram, S. Demonstrations of implicit anti-fat bias: The impact of providing causal information and evoking empathy. Health Psychol. 2003, 22, 68. [Google Scholar] [CrossRef] [PubMed]


| Study 1 (U.S. Adults) | Study 2 (U.S. Undergraduates) | ||||||||
|---|---|---|---|---|---|---|---|---|---|
| Female Targets | Female Targets | Male Targets | |||||||
| Figure Size/Shape | Face + Chest | Face-Only | Average | Face + Chest | Face-Only | Average | Face + Chest | Face-Only | Average |
| Underweight | - | - | - | 1.83 (2.40) [1.46, 2.19] | −1.50 (3.01) [−1.96, −1.04] | 0.16 (2.29) [−0.19, 0.51] | 1.40 (2.64) [1.00, 1.81] | −0.86 (3.23) [−1.36, −0.37] | 0.27 (2.57) [−0.12, 0.66] |
| Healthy-weight | 3.09 (2.13) [2.76, 3.43] | 3.34 (2.17) [3.00, 3.68] | 3.22 (1.96) [2.91, 3.53] | 2.93 (2.15) [2.61, 3.26] | 3.48 (2.07) [3.16, 3.79] | 3.21 (1.90) [2.92, 3.50] | 2.71 (2.18) [2.38, 3.05] | 3.32 (2.02) [3.01, 3.63] | 3.02 (1.84) [2.74, 3.30] |
| Overweight (aggregated) | 1.02 (2.12) [0.69, 1.35] | 0.72 (2.13) [0.39, 1.06] | 0.87 (1.99) [0.56, 1.18] | 0.88 (1.97) [0.58, 1.18] | 0.50 (1.96) [0.20, 0.80] | 0.69 (1.80) [0.41, 0.97] | 0.59 (2.05) [0.27, 0.90] | −0.18 (2.16) [−0.51, 0.15] | 0.21 (1.92) [−0.09, 0.50] |
| Overweight with AB fat | 0.11 (2.48) [−0.27, 0.50] | −0.39 (2.64) [−0.80, 0.02] | - | −0.29 (2.43) [−0.66, 0.08] | −0.89 (2.56) [−1.28, −0.50] | - | 0.30 (2.48) [−0.08, 0.68] | 0.06 (2.58) [−0.33, 0.45] | - |
| Overweight with GF fat | 1.93 (2.41) [1.55, 2.30] | 1.83 (2.42) [1.45, 2.21] | - | 2.05 (2.20) [1.72, 2.39] | 1.90 (2.18) [1.57, 2.23] | - | 0.88 (2.37) [0.51, 1.24] | −0.41 (2.51) [−0.79, −0.03] | - |
| Obese (aggregated) | −0.51 (2.74) [−0.94, −0.08] | −1.07 (2.73) [−1.50, −0.64] | −0.79 (2.62) [−1.20, −0.38] | −1.05 (2.40) [−1.42, −0.69] | −1.72 (2.48) [−2.09, −1.34] | −1.39 (2.33) [−1.74, −1.03] | −1.53 (2.63) [−1.93, −1.13] | −2.44 (2.76) [−2.86, −2.02] | −1.98 (2.58) [−2.38, −1.59] |
| Obese with AB fat | −1.34 (2.98) [−1.80, −0.87] | −2.44 (3.12) [−2.93, −1.95] | - | −1.87 (2.86) [−2.31, −1.43] | −2.87 (2.87) [−3.31, −2.44] | - | −1.52 (2.87) [−1.96, −1.09] | −2.76 (2.97) [−3.22, −2.31] | - |
| Obese with GF fat | 0.31 (2.89) [−0.14, 0.76] | 0.30 (2.94) [−0.16, 0.76] | - | 0.33 (2.49) [−0.05, 0.71] | 0.19 (2.60) [−0.21, 0.58] | - | −1.40 (2.90) [−1.84, −0.96] | −2.21 (2.98) [−2.66, −1.75] | - |
| Obese with global fat | - | - | - | −1.64 (2.97) [−2.10, −1.19] | −2.49 (2.93) [−2.94, −2.04] | - | −1.67 (2.84) [−2.10, −1.24] | −2.34 (3.00) [−2.80, −1.88] | - |
| Study 1 (U.S. Adults) | Study 2 (U.S. Undergraduates) | ||
|---|---|---|---|
| Female Targets | Female Targets | Male Targets | |
| Explicit Stigma | |||
| When aggregating over target shape, are higher-weight targets more explicitly stigmatized? | F(1.23, 196.00) = 211.15, p < 0.001, η2p = 0.570 | F(2.20, 367.55) = 194.18, p < 0.001, η2p = 0.538 | F(2.24, 373.42) = 187.92, p < 0.001, η2p = 0.529 |
| When aggregating over target shape, does target depiction influence explicit fat stigma toward women/men? | F(1, 159) = 5.84, p = 0.017, η2p = 0.035 | F(1, 167) = 118.46, p < 0.001, η2p = 0.415 | F(1, 167) = 83.07, p < 0.001, η2p = 0.332 |
| When aggregating over target shape, does target depiction interact with shape to influence explicit fat stigma toward women/men? | F(1.77, 280.67) = 11.78, p < 0.001, η2p = 0.069 | F(2.14, 356.68) = 125.42, p < 0.001, η2p = 0.429 | F(2.48, 413.86) = 57.65, p < 0.001, η2p = 0.257 |
| Does shape influence explicit fat stigma toward women/men? | F(2.12, 337.29) = 188.50, p < 0.001, η2p = 0.542 | F(3.01, 500.21) = 214.67, p < 0.001, η2p = 0.564 | F(3.20, 535.04) = 165.21, p < 0.001, η2p = 0.497 |
| Does the target depiction (face and chest v. face only) influence explicit fat stigma toward women/men? | F(1, 159) = 11.44, p < 0.001, η2p = 0.067 | F(1, 166) = 95.86, p < 0.001, η2p = 0.366 | F(1, 167) = 94.00, p < 0.001, η2p = 0.360 |
| Does the target depiction (face and chest v. face only) interact with shape to influence explicit fat stigma toward women/men? | F(3.69, 586.41) = 14.24, p < 0.001, η2p = 0.082 | F(4.97, 825.30) = 58.19, p < 0.001, η2p = 0.260 | F(5.37, 895.92) = 27.87, p < 0.001, η2p = 0.143 |
| Implicit Stigma | |||
| When aggregating over target shape, are higher-weight targets more implicitly stigmatized? | F(1.59, 252.91) = 46.40, p < 0.001, η2p = 0.226 | F(2.04, 342.06) = 63.39, p < 0.001, η2p = 0.274 | F(1.69, 283.24) = 70.64, p < 0.001, η2p = 0.296 |
| Does shape influence implicit fat stigma toward women/men? | F(2.92, 464.75) = 43.05, p < 0.001, η2p = 0.213 | F(3.24, 543.64) = 58.05, p < 0.001, η2p = 0.257 | F(2.48, 416.64) = 63.27, p < 0.001, η2p = 0.274 |
| Study 1 (U.S. Adults) | Study 2 (U.S. Undergraduates) | ||
|---|---|---|---|
| Female Targets | Female Targets | Male Targets | |
| Figure Size/Shape | M (SD) 95% CI | M (SD) 95% CI | M (SD) 95% CI |
| Underweight | - | 0.64 (0.27) [0.59, 0.68] | 0.68 (0.27) [0.64, 0.72] |
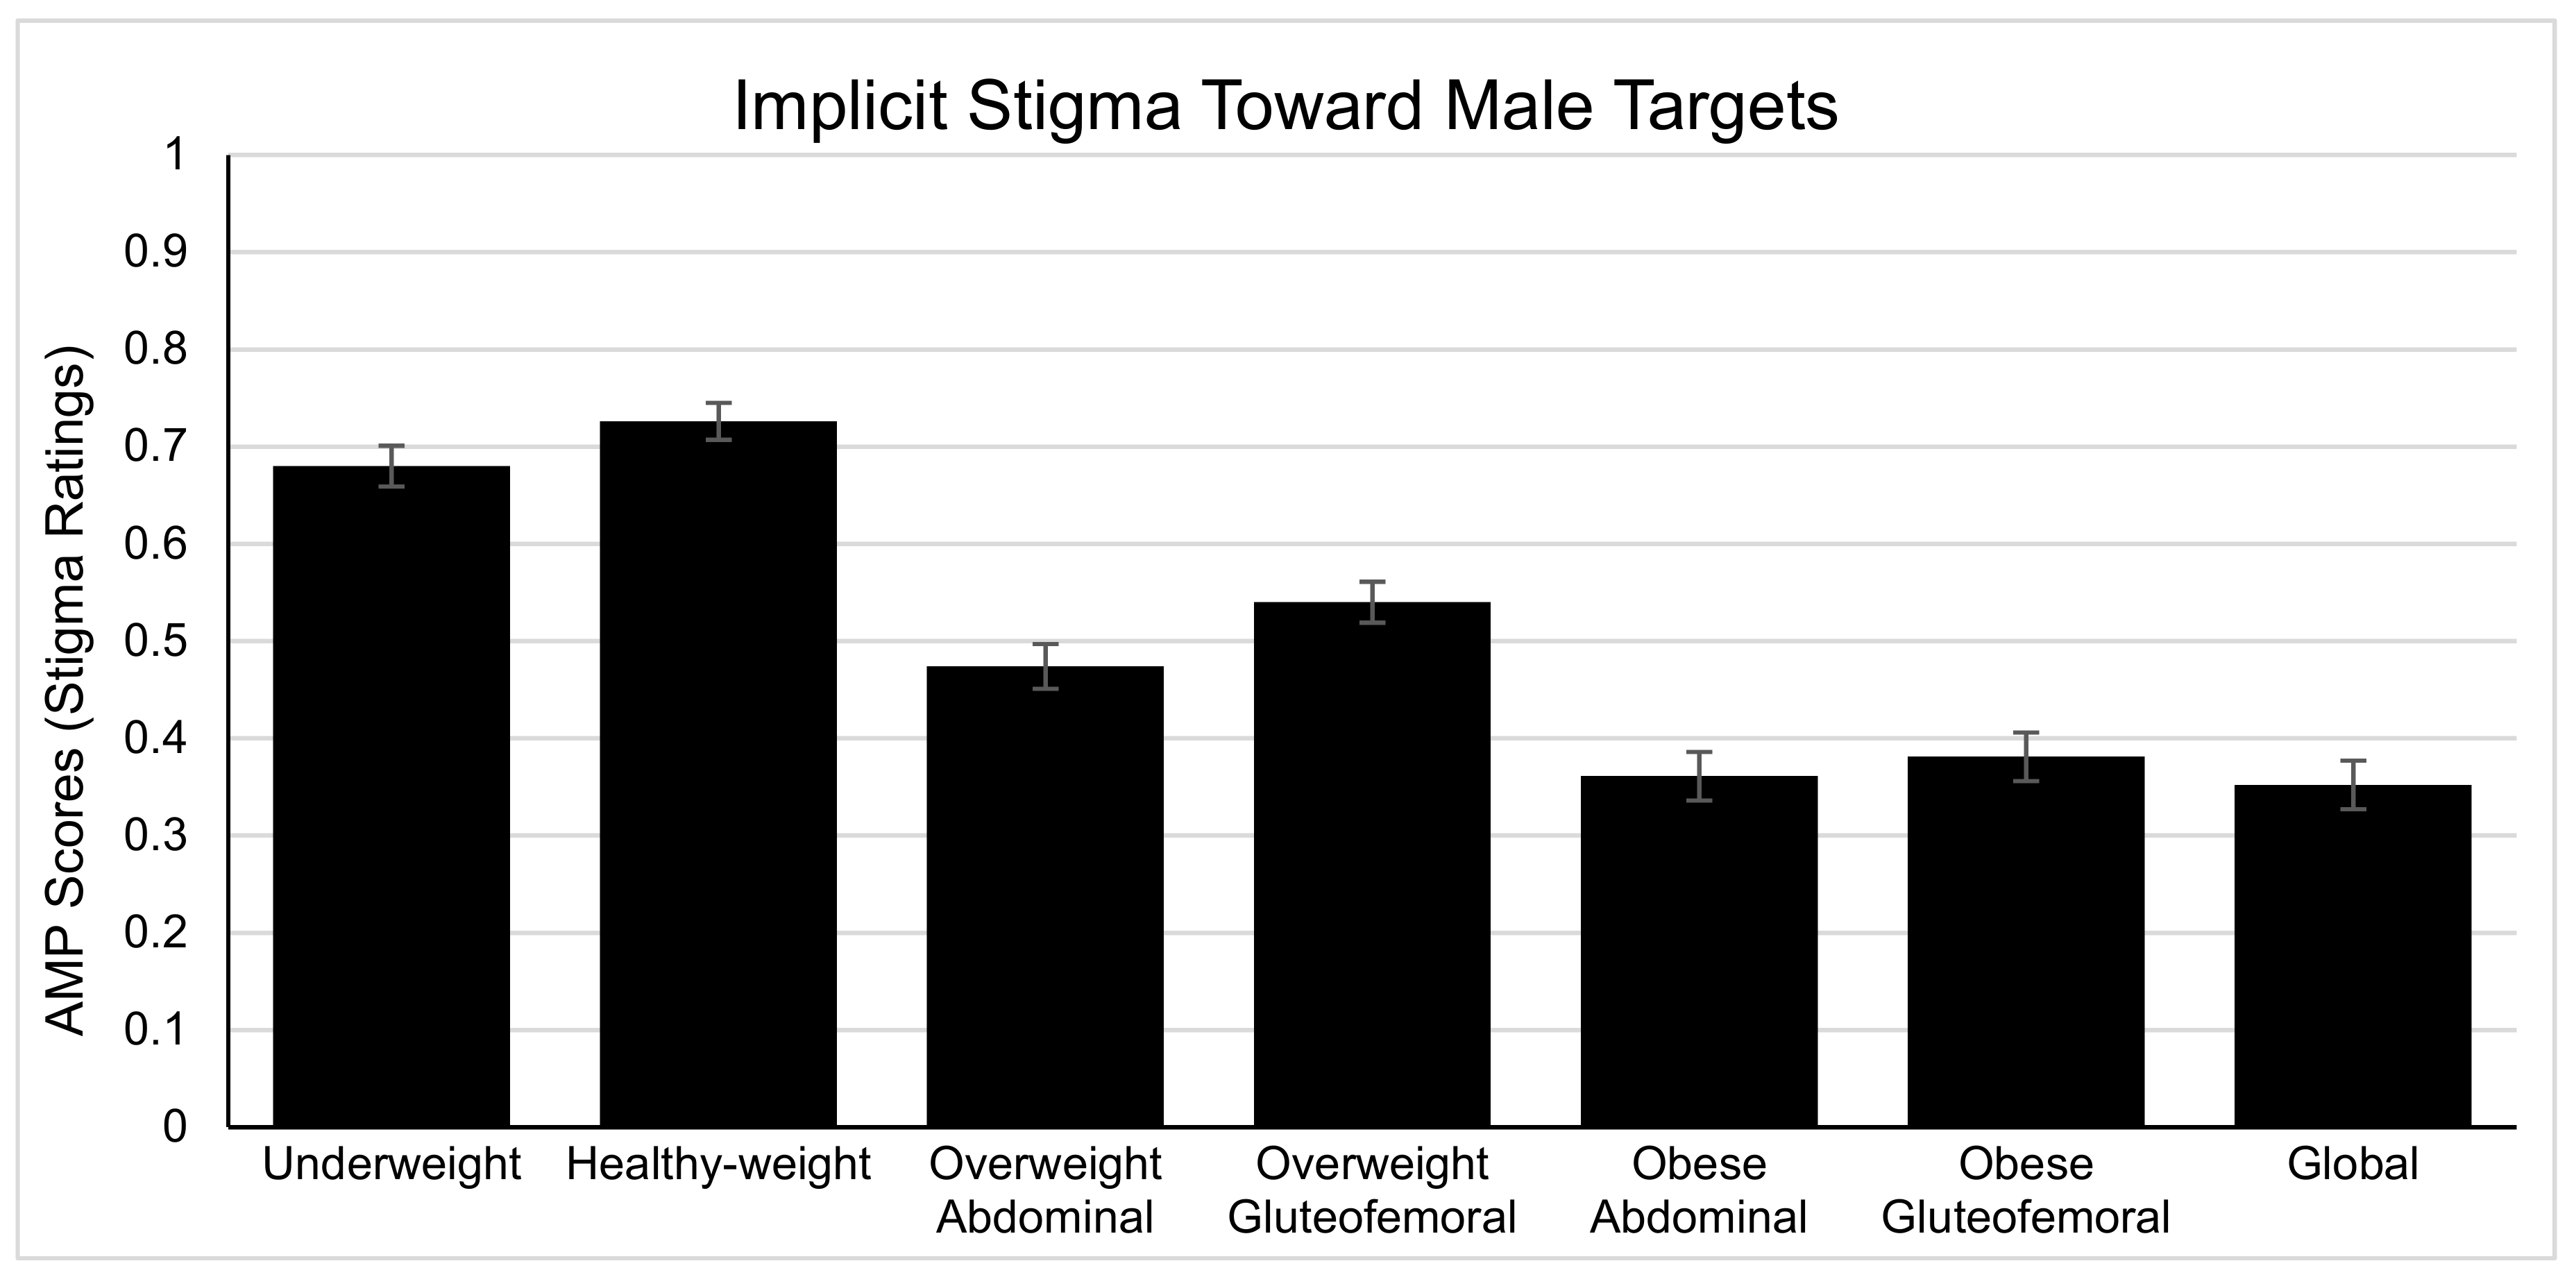
| Healthy-weight | 0.69 (0.23) [0.65, 0.72] | 0.73 (0.24) [0.70, 0.77] | 0.73 (0.25) [0.69, 0.76] |
| Overweight (aggregated) | 0.55 (0.20) [0.52, 0.59] | 0.53 (0.22) [0.49, 0.56] | 0.51 (0.26) [0.47, 0.55] |
| Overweight with AB fat | 0.46 (0.26) [0.42, 0.51] | 0.42 (0.31) [0.37, 0.46] | 0.47 (0.30) [0.43, 0.52] |
| Overweight with GF fat | 0.65 (0.64) [0.61, 0.68] | 0.64 (0.26) [0.60, 0.68] | 0.54 (0.27) [0.50, 0.58] |
| Obese (aggregated) | 0.47 (0.25) [0.44, 0.51] | 0.40 (0.28) [0.36, 0.44] | 0.37 (0.36) [0.32, 0.41] |
| Obese with AB fat | 0.43 (0.30) [0.38, 0.47] | 0.35 (0.32) [0.30, 0.40] | 0.36 (0.33) [0.31, 0.41] |
| Obese with GF fat | 0.52 (0.25) [0.48, 0.56] | 0.49 (0.31) [0.44, 0.54] | 0.38 (0.32) [0.33, 0.43] |
| Obese with global fat | - | 0.36 (0.35) [0.30, 0.41] | 0.35 (0.32) [0.30, 0.40] |
| Study 1 | Study 2 | ||
|---|---|---|---|
| Target Size/Shape | Female Targets | Female Targets | Male Targets |
| Underweight | - | 0.28 *** | 0.14 a |
| Healthy-weight | −0.02 | 0.10 | 0.09 |
| Overweight (aggregated) | 0.28 *** | 0.27 *** | 0.17 * |
| Overweight with abdominal fat | 0.20 * | 0.25 *** | 0.12 |
| Overweight with gluteofemoral fat | 0.12 | 0.18 * | 0.16 * |
| Obese (aggregated) | 0.08 | 0.37 *** | 0.32 *** |
| Obese with abdominal fat | 0.19 * | 0.31 *** | 0.30 *** |
| Obese with gluteofemoral fat | 0.14 a | 0.36 *** | 0.30 *** |
| Obese with global fat | - | 0.30 *** | 0.26 *** |
| Explicit Stigma | |
|---|---|
| Does target gender influence explicit fat stigma? | F(1, 165) = 32.28, p < 0.001, η2p = 0.188 |
| Does shape influence explicit fat stigma? | F(2.67, 441.26) = 229.30, p < 0.001, η2p = 0.582 |
| Does the target depiction (face and chest v. face only) influence explicit fat stigma? | F(1, 165) = 146.61, p < 0.001, η2p = 0.470 |
| Does target gender interact with shape to influence explicit fat stigma? | F(4.86, 802.14) = 58.90, p < 0.001, η2p = 0.263 |
| Does target gender interact with depiction (face and chest v. face only) to influence explicit fat stigma? | F(1, 165) = 0.26, p = 0.608, η2p = 0.002 |
| Does the target depiction (face and chest v. face only) interact with shape to influence explicit fat stigma? | F(4.87, 803.43) = 65.60, p < 0.001, η2p = 0.284 |
| Does the target depiction x shape interaction differ across target gender? | F(5.45, 898.50) = 10.88, p < 0.001, η2p = 0.062 |
| Implicit Stigma | |
| Does target gender influence implicit fat stigma? | F(1, 168) = 2.19, p = 0.141, η2p = 0.013 |
| Does shape influence implicit fat stigma? | F(2.27, 381.54) = 78.56, p < 0.001, η2p = 0.319 |
| Does target gender interact with shape to influence implicit fat stigma? | F(5.18, 870.64) = 10.38, p < 0.001, η2p = 0.058 |
| BMI | |||||||||
|---|---|---|---|---|---|---|---|---|---|
| Target Size/Shape | Under-Weight | Healthy-Weight | Overweight (agg.) | Overweight Ab. Fat | Overweight GF Fat | Obese (agg.) | Obese Ab. Fat | Obese GF Fat | Obese Global |
| Female Targets | |||||||||
| Study 1 | |||||||||
| Face + Chest (Exp.) | - | −0.05 | −0.04 | 0.16 * | 0.13 | 0.01 | 0.14 a | 0.15 a | - |
| Face-Only (Exp.) | - | −0.08 | 0.08 | 0.08 | 0.17 * | 0.02 | 0.12 | 0.14 a | - |
| Implicit (Face-Only) | - | 0.02 | 0.10 | 0.03 | 0.16 * | 0.11 | −0.02 | 0.08 | - |
| Study 2 | |||||||||
| Face + Chest (Exp.) | −0.09 | −0.10 | 0.12 | 0.09 | 0.12 | 0.06 | 0.03 | 0.10 | 0.04 |
| Face-Only (Exp.) | −0.02 | −0.20 * | 0.10 | 0.04 | 0.13 a | 0.10 | 0.09 | 0.13 a | 0.06 |
| Implicit (Face-Only) | 0.01 | 0.13 a | 0.15 a | 0.11 | 0.13 a | 0.11 | 0.06 | 0.16 * | 0.08 |
| Male Targets | |||||||||
| Study 2 | |||||||||
| Face + Chest (Exp.) | −0.05 | −0.18 * | 0.08 | 0.02 | 0.11 | 0.07 | 0.04 | 0.03 | 0.12 |
| Face-Only (Exp.) | −0.11 | −0.24 ** | 0.16 * | 0.11 | 0.16 * | 0.07 | 0.07 | 0.05 | 0.06 |
| Implicit (Face-Only) | 0.02 | −0.03 | 0.16 * | 0.16 * | 0.13 | 0.10 | 0.12 | 0.08 | 0.08 |
| Perceived Infectability (Study 2 only) | |||||||||
| Target Size/Shape | Under-weight | Healthy-weight | Overweight (agg.) | Overweight Ab. Fat | Overweight GF Fat | Obese (agg.) | Obese Ab. Fat | Obese GF Fat | Obese Global |
| Female Targets | |||||||||
| Face + Chest (Exp.) | 0.16 * | −0.07 | −0.05 | 0.04 | −0.12 | −0.03 | 0.02 | −0.11 | −0.00 |
| Face-Only (Exp.) | 0.05 | −0.14 a | −0.14 a | −0.05 | −0.19 * | 0.03 | 0.07 | −0.08 | 0.06 |
| Implicit (Face-Only) | 0.17 * | −0.00 | 0.00 | −0.02 | 0.03 | −0.01 | −0.06 | −0.05 | 0.07 |
| Male Targets | |||||||||
| Face + Chest (Exp.) | 0.07 | 0.12 | −0.26 *** | −0.24 ** | −0.20 * | −0.06 | −0.09 | −0.05 | −0.04 |
| Face-Only (Exp.) | 0.02 | −0.09 | −0.15 a | −0.13 a | −0.12 | −0.01 | 0.02 | −0.02 | −0.03 |
| Implicit (Face-Only) | 0.18 * | 0.12 | −0.02 | −0.02 | −0.01 | −0.02 | −0.06 | −0.01 | 0.02 |
| Germ Aversion (Study 2 only) | |||||||||
| Target Size/Shape | Under-weight | Healthy-weight | Overweight (agg.) | Overweight Ab. Fat | Overweight GF Fat | Obese (agg.) | Obese Ab. Fat | Obese GF Fat | Obese Global |
| Female Targets | |||||||||
| Face + Chest (Exp.) | 0.10 | −0.09 | −0.04 | −0.03 | −0.05 | −0.01 | 0.04 | −0.08 | 0.02 |
| Face-Only (Exp.) | 0.12 | 0.03 | −0.09 | 0.01 | −0.17 * | 0.02 | 0.04 | −0.07 | 0.09 |
| Implicit (Face-Only) | 0.16 * | 0.03 | −0.07 | −0.04 | −0.07 | −0.10 | −0.11 | −0.10 | −0.05 |
| Male Targets | |||||||||
| Face + Chest (Exp.) | 0.13 a | 0.15 a | −0.03 | −0.04 | −0.00 | 0.05 | 0.01 | 0.04 | 0.07 |
| Face-Only (Exp.) | 0.11 | 0.02 | −0.01 | 0.05 | −0.06 | 0.02 | 0.02 | 0.00 | 0.04 |
| Implicit (Face-Only) | 0.12 | 0.16 * | −0.14 a | −0.18 * | −0.07 | −0.14 a | −0.12 | −0.19 * | −0.08 |
| Pathogen Disgust (TDDS) (Study 2 only) | |||||||||
| Target Size/Shape | Under-weight | Healthy-weight | Overweight (agg.) | Overweight Ab. Fat | Overweight GF Fat | Obese (agg.) | Obese Ab. Fat | Obese GF Fat | Obese Global |
| Female Targets | |||||||||
| Face + Chest (Exp.) | 0.17 * | 0.05 | −0.03 | −0.09 | 0.04 | −0.15 a | −0.07 | −0.20 ** | −0.13 a |
| Face-Only (Exp.) | −0.00 | 0.19 * | −0.06 | −0.10 | 0.01 | −0.12 | −0.11 | −0.08 | −0.13 |
| Implicit (Face-Only) | 0.08 | −0.04 | −0.14 a | −0.15 a | −0.06 | −0.23 ** | −0.17 * | −0.13 a | −26 *** |
| Male Targets | |||||||||
| Face + Chest (Exp.) | 0.24 ** | 0.32 *** | −0.08 | −0.15 a | 0.01 | −0.14 a | −0.18 * | −0.10 | −0.10 |
| Face-Only (Exp.) | 0.11 | 0.22 ** | −0.10 | −0.12 | −0.05 | −0.15 a | −0.13 a | −0.17 * | −0.12 |
| Implicit (Face-Only) | 0.09 | 0.11 | −0.11 | −0.15 * | −0.04 | −0.20 * | −0.18 * | −0.19 * | −0.19 * |
| Sexual Disgust (TDDS) (Study 2 only) | |||||||||
| Target Size/Shape | Under-weight | Healthy-weight | Overweight (agg.) | Overweight Ab. Fat | Overweight GF Fat | Obese (agg.) | Obese Ab. Fat | Obese GF Fat | Obese Global |
| Female Targets | |||||||||
| Face + Chest (Exp.) | 0.02 | −0.11 | −0.01 | 0.03 | −0.05 | 0.06 | 0.09 | −0.04 | 0.09 |
| Face-Only (Exp.) | −0.06 | 0.03 | 0.07 | 0.17 * | −0.07 | 0.05 | 0.07 | −0.09 | 0.13 a |
| Implicit (Face-Only) | −0.07 | −0.13 | −0.11 | 0.01 | −0.20 ** | −0.09 | −0.03 | −0.14 a | −0.08 |
| Male Targets | |||||||||
| Face + Chest (Exp.) | 0.18 * | 0.14 a | −0.07 | 0.02 | −0.14 a | 0.02 | −0.01 | 0.02 | 0.03 |
| Face-Only (Exp.) | 0.05 | 0.06 | −0.07 | −0.06 | −0.05 | −0.01 | 0.05 | −0.03 | −0.04 |
| Implicit (Face-Only) | −0.05 | −0.05 | −0.01 | −0.07 | 0.05 | −0.07 | −0.05 | −0.09 | −0.06 |
| Moral Disgust (TDDS) (Study 2 only) | |||||||||
| Target Size/Shape | Under-weight | Healthy-weight | Overweight (agg.) | Overweight Ab. Fat | Overweight GF Fat | Obese (agg.) | Obese Ab. Fat | Obese GF Fat | Obese Global |
| Female Targets | |||||||||
| Face + Chest (Exp.) | 0.08 | 0.13 a | 0.02 | −0.05 | 0.08 | −0.07 | −0.05 | −0.10 | −0.03 |
| Face-Only (Exp.) | −0.02 | 0.08 | −0.04 | −0.04 | −0.03 | −0.03 | 0.00 | −0.07 | −0.01 |
| Implicit (Face-Only) | 0.02 | 0.02 | −0.03 | −0.05 | 0.01 | −0.05 | −0.05 | −0.01 | −0.07 |
| Male Targets | |||||||||
| Face + Chest (Exp.) | 0.03 | 0.01 | −0.00 | 0.05 | −0.06 | −0.03 | −0.06 | −0.02 | −0.01 |
| Face-Only (Exp.) | 0.02 | −0.00 | −0.03 | −0.09 | 0.03 | −0.07 | −0.03 | −0.00 | −0.18 * |
| Implicit (Face-Only) | −0.03 | 0.04 | 0.05 | 0.00 | 0.09 | −0.06 | −0.08 | −0.09 | 0.00 |
| PWE (Study 2 only) | |||||||||
| Target Size/Shape | Under-weight | Healthy-weight | Overweight (agg.) | Overweight Ab. Fat | Overweight GF Fat | Obese (agg.) | Obese Ab. Fat | Obese GF Fat | Obese Global |
| Female Targets | |||||||||
| Face + Chest (Exp.) | 0.03 | 0.03 | 0.01 | −0.02 | 0.03 | −0.01 | −0.01 | −0.04 | 0.01 |
| Face-Only (Exp.) | −0.09 | 0.03 | −0.08 | −0.10 | −0.02 | −0.06 | −0.03 | −0.06 | −0.05 |
| Implicit (Face-Only) | −0.04 | −0.03 | −0.08 | −0.06 | −0.07 | −0.00 | −0.00 | 0.00 | −0.01 |
| Male Targets | |||||||||
| Face + Chest (Exp.) | −0.06 | −0.06 | 0.03 | 0.01 | 0.04 | −0.02 | −0.01 | −0.06 | 0.01 |
| Face-Only (Exp.) | −0.11 | 0.03 | −0.06 | −0.06 | −0.04 | −0.05 | −0.04 | −0.05 | −0.04 |
| Implicit (Face-Only) | 0.09 | 0.05 | −0.04 | −0.04 | −0.03 | 0.05 | 0.06 | 0.03 | 0.04 |
Disclaimer/Publisher’s Note: The statements, opinions and data contained in all publications are solely those of the individual author(s) and contributor(s) and not of MDPI and/or the editor(s). MDPI and/or the editor(s) disclaim responsibility for any injury to people or property resulting from any ideas, methods, instructions or products referred to in the content. |
© 2023 by the authors. Licensee MDPI, Basel, Switzerland. This article is an open access article distributed under the terms and conditions of the Creative Commons Attribution (CC BY) license (https://creativecommons.org/licenses/by/4.0/).
Share and Cite
Krems, J.A.; Bock, J.E. The Role of Women’s and Men’s Body Shapes in Explicit and Implicit Fat Stigma. Obesities 2023, 3, 97-118. https://doi.org/10.3390/obesities3020009
Krems JA, Bock JE. The Role of Women’s and Men’s Body Shapes in Explicit and Implicit Fat Stigma. Obesities. 2023; 3(2):97-118. https://doi.org/10.3390/obesities3020009
Chicago/Turabian StyleKrems, Jaimie Arona, and Jarrod E. Bock. 2023. "The Role of Women’s and Men’s Body Shapes in Explicit and Implicit Fat Stigma" Obesities 3, no. 2: 97-118. https://doi.org/10.3390/obesities3020009