Article

‘Pera’ Orange and ‘Moro’ Blood Orange Juice Improves Oxidative Stress and Inflammatory Response Biomarkers and Modulates the Gut Microbiota of Individuals with Insulin Resistance and Different Obesity Classes

by
Aline Alves de Santana
1,†,
Eric de Castro Tobaruela
1,*,†,
Karina Gama dos Santos
1,
Luiz Gustavo Sparvoli
2,
Cristiane Kovacs do Amaral
3,
Carlos Daniel Magnoni
3,
Carla R. Taddei
2,
Ronaldo Vagner Thomatieli dos Santos
4,
Neuza Mariko Aymoto Hassimotto
1 and
Franco Maria Lajolo
1
1
Food Research Center (FoRC), Department of Food and Experimental Nutrition, School of Pharmaceutical Sciences, University of São Paulo (USP), São Paulo 05508-080, SP, Brazil
2
Department of Clinical and Toxicological Analysis, School of Pharmaceutical Sciences, USP, São Paulo 05508-000, SP, Brazil
3
Dante Pazzanese Institute of Cardiology, São Paulo 04012-909, SP, Brazil
4
Department of Bioscience, Federal University of São Paulo, São Paulo 11015-020, SP, Brazil
*
Author to whom correspondence should be addressed.
These authors contributed equally to this work.
Obesities 2022, 2(4), 389-412; https://doi.org/10.3390/obesities2040033
Submission received: 15 September 2022 / Revised: 15 December 2022 / Accepted: 16 December 2022 / Published: 19 December 2022

Abstract

:
Orange juice contains flavanones, which are associated with reducing the risk of obesity-associated diseases. We evaluated the effects of two varieties of orange juices on the oxidative stress, inflammatory response, and gut microbiota of individuals with insulin resistance and different obesity classes. In a randomized crossover study, obese patients consumed ‘Pera’ (POJ—source of flavanones) and ‘Moro’ (MOJ—source of flavanones and anthocyanins) orange juices for 15 days. Blood, urine, and fecal samples were collected before and after the intervention. Daily orange juice intake significantly reduced HDL and total cholesterol, in addition to urinary 8-OHdG and plasmatic MCP-1 levels. Multivariate analyses highlighted the beneficial effects of orange juice intake, mainly the modulation of inflammatory and oxidative stress biomarkers. Patients in different obesity classes presented a gut microbiota with obesity-associated alterations (dysbiosis), and the consumption of Pera and Moro orange juices improved this profile by modulating their gut microbiota in different ways. Although the Firmicutes/Bacteroidetes ratio changed after both interventions, MOJ provided more accentuated changes than POJ. Blautia, Bifidobacterium, and other genera had their relative abundance altered by juice consumption, which correlated with patient parameters (such as HDL-cholesterol and diastolic blood pressure) and biomarkers (such as TNF-α and 8-OHdG). In conclusion, regular orange juice intake can be associated with a reduction in oxidative stress and inflammatory response, in addition to modulating gut microbiota.

1. Introduction

Obesity is a worldwide public health problem that affected 650 million adults in 2016 (13% of the world’s adult population). Projections indicate that, by 2030, 57.8% of the world’s population will be overweight or obese [1]. Obesity is commonly associated with several metabolic diseases, such as cardiovascular disease, type 2 diabetes, fatty liver disease, hypertension, stroke, and cancer, and it represents a significant economic and social burden [2]. Obesity is characterized by an elevated production of systemic inflammatory biomarkers and is, therefore, characterized as low-grade inflammation [3]. The etiology behind obesity is multifactorial, with contributing factors that include the development and maintenance of a sedentary lifestyle, poor diet, increased stress, insufficient sleep, genetics, the use of some classes of drugs, and socioeconomic factors [4]. Recent studies have indicated that the gut microbiota participates in the development of obesity and insulin resistance via increased caloric extraction from indigestible dietary substances, changes in lipolysis and lipogenesis, reduced satiety, and increased gut permeability, which affects the function of the immune system, leading to metabolic endotoxemia and insulin resistance [5,6]. The diet is one of the main factors that contributes to changes in the gut microbiota [6]. Interestingly, some studies suggest that bioactive compounds within foods, such as polyphenols, stimulate the growth of beneficial bacterial via a two-way interaction, because the gut microbiota plays a key role in polyphenol metabolism, while polyphenols and their metabolites can alter the microbiota profile [7]. Recent studies have suggested that polyphenols are candidate prebiotics, since these bioactive compounds stimulate the growth of beneficial bacteria such as Lactobacillus spp. and Bifidobacterium spp., commensal bacteria from the gut microbiota that yield many health benefits to the host but whose prevalence is reduced in the setting of obesity and insulin resistance, in addition to hindering the growth of pathogenic strains such as Clostridium spp. [7,8,9,10].
Dietary polyphenols are the main plant-derived bioactive compounds and are responsible for the color and flavor of fruits and vegetables. Subgroups of bioactive compounds within the polyphenol family include flavanols, flavanones, isoflavones, flavones, flavan-3-ols, and anthocyanins [11]. Orange fruit (Citrus sinensis L. Osbeck) and 100% orange juice are rich sources of flavanones, primarily hesperidin (hesperetin-7-O-rutinoside) and narirutin (naringenin-7-O-rutinoside), which have been associated with benefits such as the modulation of inflammation and oxidative stress biomarkers [12,13,14], reduced blood pressure and body fat percentage [15,16,17], and improved insulin sensitivity [18]. Brazil is the world’s largest producer of oranges, and more than 70% of these fruits are used to produce orange juice [19]. According to the Brazilian National Dietary Survey, from 2017–2018, orange juice, which is mainly derived from Pera oranges, was one of the main individual food contributors to the total polyphenol, flavonoid, and flavanone intake by the Brazilian population [20]. On the other hand, blood orange fruits, including Moro oranges, are becoming increasingly popular in Brazil. These oranges differ from the common fruits due to the presence of anthocyanins, primarily cyanidin-3-O-glucoside, which have been shown to behave directly as antioxidants, thereby providing protection from DNA, protein, and lipid damage and reducing oxidative stress by activating specific detoxification enzymes such as glutathione peroxidase (GPx) [21,22,23]. In addition to flavanones and anthocyanins, oranges also present variable profiles of carotenoids, with a predominance of violaxanthin isomers in sweet and blood orange pulps, including Pera and Moro cultivars, respectively [24].
Few studies have investigated the effects of flavanones and anthocyanins on the gut microbiota in obese and insulin-resistant individuals or the possible interactions between flavanones and anthocyanins and their possible effects on the host, mainly from food sources such as orange juice. Most prior studies were restricted to assessing the bioavailability of bioactive compounds since this process is microbiota-dependent. We, therefore, decided to evaluate the effects of the consumption of Pera (source of flavanones) and Moro (source of flavanones and anthocyanins) orange juices from Brazil by individuals with insulin resistance and different body mass index (BMI) classes. Anthropometric variables, biochemical parameters, and inflammatory and oxidative stress biomarkers were evaluated, in addition to the gut microbiota profile.

2. Materials and Methods

This was a randomized crossover study. All procedures were approved by the Ethical Committees of the School of Pharmaceutical Science, University of São Paulo and of the Dante Pazzanese Institute of Cardiology (CAAE 59663816.8.0000.5462). The procedures were registered on the Brazilian Registry of Clinical Trials (www.ensaiosclinicos.gov.br/rg/RBR-10xtk662 (accessed on 13 April 2020); UTN code: U111112158661). Written informed consent was obtained from each participant.

2.1. Study Population

Patients with obesity and insulin resistance who were under the care of the Ambulatory Clinical Nutrition service of the Dante Pazzanese Institute of Cardiology were invited to participate in the study. Obesity was defined according to the WHO classification (BMI ≥30.00 kg·m−2), while insulin resistance was defined by the values calculated for the Homeostasis Model Assessment for Insulin Resistance (HOMA-IR) with a cutoff point of 2.71 derived from a previous study carried out on the Brazilian population (Table 1) [25].
Fifty-five patients, aged 40–60 years, with prediabetes (glycated hemoglobin from 5.7% to 6.4%) were invited to undergo fasting blood glucose and insulin analysis to calculate HOMA-IR. Of these, 34 participants met the study criteria and were assigned to the protocol. Six patents dropped out before the start of the clinical trial. Of the 28 remaining participants, 23 completed the protocol (Table 1 and Figure S1A). The exclusion criteria were the use of prebiotics, probiotics, symbiotics, antibiotics, anti-inflammatory medications, vitamins, bioactive compounds, or mineral supplements 1 month before the beginning of the study, pre-existing gastrointestinal disease or cognitive dysfunction, previously diagnosed diabetes mellitus type 1 or 2, pregnancy, and active breastfeeding.

2.2. Intervention

Pasteurized orange juices obtained from C. sinensis L. cv Pera (POJ) and Moro (MOJ) were supplied by Fundecitrus (Araraquara, Brazil), located in the southeastern São Paulo state at 23°23′19″ S and 48°43′22″ W. POJ was made using orange fruits grown in São Paulo, while MOJ was made using fruits grown in the Minas Gerais state. The production of anthocyanins in Moro orange fruits was induced by cold storage. After pasteurization, the juices were poured into 1 L flasks and immediately stored at −20 °C. The characterization of POJ and MOJ (quality parameters, soluble sugars, organic acids, total phenolic compounds, dietary fiber, and flavonoids) was performed according to the methods described in the Supplementary Materials; their compositions are presented in Tables S1 and S2.

2.3. Study Protocol

Three days before the intervention, the participants were instructed to restrict their intake of citrus fruits (orange, lemon, and grapefruit) and their derivatives, as well as that of strawberries, passion fruit, coffee, chocolate, wine, and tea. After the initial washout period, the participants were assigned to sequential treatment with POJ and MOJ, or vice versa, using a randomization procedure. The duration of each intervention was 15 days, with a washout period (40 days) between them. Before (T0) and after (T16) each intervention, blood, urine, and feces were collected, blood pressure (BP) was measured, anthropometric parameters were assessed, and 24 h dietary recall (R24h) was documented. The urine and feces samples were stored at −80 °C until they were analyzed. Figure S1B summarizes the study protocol.
After the first sample and data collection (T0), the participants were instructed to consume 400 mL·day−1 of orange juice (200 mL at lunch and dinner) for 15 days, with the juice flasks refrigerated until use. The volunteers were advised to maintain their lifestyle and normal dietary habits during the protocol period except for restricting food sources that may impact their total flavanone intake.

2.4. Anthropometric and Dietary Intake Measurement

Height, weight, BMI, and body waist circumference were measured before and after POJ and MOJ intake. BMI classification was performed according to the World Health Organization [27]. The R24h was documented before and after each intervention to measure the macronutrient and calorie intake of the participant’s diet.

2.5. Biochemical Parameters

The following biochemical analyses were performed by the Research Incentive Fund Association (AFIP) of the Dante Pazzanese Institute of Cardiology according to the standard laboratory procedures before and after POJ and MOJ intake: blood glucose (enzymatic method—hexokinase), total cholesterol (colorimetric enzymatic method—cholesterol oxidase), low-density lipoprotein (LDL) cholesterol (obtained by the Friedewald equation), high-density lipoprotein (HDL) cholesterol (homogeneous colorimetric enzymatic method without precipitation), and triglycerides (colorimetric enzymatic method—glycerol phosphate peroxidase).

2.6. Plasma Antioxidant Activity

The antioxidant activity of the plasma samples was evaluated according to the ORAC method described by Prior et al. [28].

2.7. Superoxide Dismutase (SOD) and Glutathione Peroxidase (GPx) Activity

SOD (EC 1.15.1.1) and GPx (EC 1.11.1.9) enzymatic activity were measured according to the methods described by Ewing and Janero [29] and Flohé and Günzler [30], respectively. The results were expressed in activity units (U) per mg of protein after quantification using standard curves for SOD (0.69 to 22.15 U·mg−1) and GPx (1.50 to 50.00 U·mg−1).

2.8. Urinary 8-Isoprostane and 8-Hydroxy-2′-deoxyguanosine (8-OHdG) Content

The quantification of 8-isoprostane and 8-OHdG in urine samples was performed using commercial kits (8-Isoprostane ELISA kit, Cayman Chemical, Ann Arbor, MI, USA; New 8-OHdG Check Elisa kit, JaICA, Shizuoka, Japan) following the protocols provided by the manufacturer. The results were expressed as ng·mg−1 of creatinine.

2.9. Inflammatory Biomarkers

Cytokine and chemokine (IL-1β, IL-6, IL-8, IL-10, TNF-α, and MCP-1) levels were measured by flow cytometry using the BD™ Cytometric Bead Array (CBA) Human Inflammatory Cytokine Kit (BD Biosciences, Franklin Lakes, NJ, USA).

2.10. Identification and Quantification of Urine Metabolites

Urine flavanone metabolites were identified and quantified as described by Nishioka et al. [31]. The urine samples were centrifuged at 14,000× g for 5 min at 4 °C and filtered using 0.22 µm PVDF filters (Millipore, Bedford, MA, USA). The samples were analyzed using liquid chromatography UPLC-Nexera LC-30AD (Shimadzu, Kyoto, Japan) coupled to an EVOQTM triple-quadrupole mass spectrometer (Bruker Daltonics, Bremen, Germany). Metabolite separation was performed with a Poroshell 120 C18 column (2.7 µm, 100 × 3.0 mm) (Agilent Technologies, Santa Clara, CA, USA) equipped with a 20 × 4.0 mm guard column. The mobile phases used were as follows: (A) water/formic acid (99:1, v/v) and (B) acetonitrile. The solvent concentration gradient for B was initially 5%, then 18% at 7 min, 28% at 17 min, 50% at 17.2 min, 90% at 20 min, 90% at 20.3 min, and 5% at 26 min, at a flow rate of 0.5 mL·min−1 and a temperature of 25 °C. The eluates were monitored at 280 and 525 nm. The samples were analyzed in negative and positive modes at a source voltage of 3500 V, a cone temperature of 350 °C, a cone gas flow of 20 L·min−1, a heated probe temperature of 350 °C, a probe gas flow of 40 units, and a nebulizer gas flow of 50 units. Phase II metabolites were identified by the similarity of their mass spectra profile to the external standard of the metabolites naringenin-7-O-glucuronide, hesperetin-7-O-glucuronide, and hesperetin-3′-O-glucuronide, which were kindly donated by Dr. Kroon and Dr. Needs (Quadram Institute, Norwich, UK), as well as according to the literature data. Phenolic acids were identified by the similarity of their mass spectra profile to commercial standards and the literature data. The area under the curve (AUC) of each peak was normalized by creatinine value to calculate the relative amount of flavanone metabolite excretion.

2.11. Gut Microbiota Profiling

Frozen fecal samples were prepared following the Bacterial NGS Sequence protocol [32] and sent for gut microbiota profiling to Neoprospecta Microbiome Technologies (Florianopolis, Brazil), which performed DNA extraction with the Illumina MiSeq platform (Illumina, San Diego, CA, USA). The V3/V4 region of the 16S rRNA gene was amplified using the primers 341F (CCTACGGGRSGCA-GCAG) and 806R (GGACTACHVGGGTWTCTAAT) [33,34]. DNA amplification was performed following a two-step PCR protocol, in triplicate, using Platinum Taq Polymerase (Invitrogen, Waltham, MA, USA). Amplicons were pooled and loaded onto the Illumina MiSeq clamshell style cartridge kit at 500 cycles for paired-end 250 sequencing at a final concentration of 12 pM [35].
The generated fragments were analyzed using QIIME2 version 2021.11 [36], and quality sequence files were imported and denoised by DADA2 [37]; based on the quality plot, we truncated our sequences at 251 bases. The taxonomy was assigned to ASVs using the plugin q2-feature-classifier [38], which was based on the Silva database version 138 [39]. The resulting operational taxonomic unit (OTU) table was filtered to remove singletons and any OTU with an abundance of less than 0.05% across all samples. The median (25–75 percentiles) number of sequences found in the samples was 262,549 (185,252–360,160), and the minimum number of sequences in a sample was 106,150.

2.12. Short-Chain Fatty Acids (SCFAs)

The isolation and quantification of SCFA were performed according to the method described by Menezes et al. [40]. The frozen fecal samples (500 mg) were mixed with 1.5 mL of acetonitrile with 0.05% 2-methyl-valeric acid (internal standard) (Sigma-Aldrich 10987-8, Milwaukee, WI, USA) and 12% HClO4 (in a concentration sufficient to maintain a pH of 3.0), centrifuged at 11,000× g for 20 min at 4 °C, filtered using 0.8 and 0.2 µm PVDF filters (Millipore), and transferred to gas chromatography vials. Supernatants (3 µL; split 1:10) were automatically injected into a Plus HP 6890 CG (Hewlett-Packard, Palo Alto, CA, USA) which was equipped with a flame ionization detector and capillary fused silica column (WCOT, CP7747, Varian Medical Systems, Palo Alto, CA, USA). The injector and detector temperatures were 270 °C and 300 °C, respectively. The analysis was performed using a temperature ramp from 115 °C to 250 °C (13 min) under constant pressure. SCFAs were identified and quantified by comparison with a volatile acid standard mix (Sigma-Aldrich, Milwaukee, WI, USA). The results obtained from blanks were subtracted from the samples to correct the SCFA production.

2.13. Statistical Analysis

SPSS version 25.0 (IBM, New York, NY, USA) was used to perform the statistical analyses. The data normality was checked using the Shapiro–Wilk test, and Levene’s test was used to assess the equality of variances. Nonparametric tests (Wilcoxon and Mann–Whitney tests) were used to assess the differences in anthropometric and biochemical parameters, flavanone metabolites, and microbiota data between the volunteer groups. Spearman’s correlation coefficient was used to identify the associations between anthropometric and biochemical parameters, flavanone metabolites, and microbiota OTUs. The data are expressed as the mean ± standard error (SE), and the differences were considered significant at p < 0.05. Multivariate analyses were performed using MetaboAnalyst 5.0 [41] after normalization by median, log transformation, and Pareto scaling. The analysis of group similarities (ANOSIM) was also performed using Microbiome Analyst [42]. Alpha diversity was estimated with the Shannon diversity index [43], while beta diversity was calculated using the Bray–Curtis similarity index [44].

3. Results

Thirty-four patients of both genders who were obese (BMI ≥ 30.00 kg·m−2), considered insulin-resistant (according to the HOMA-IR assessment), and already under the care of the Ambulatory of Clinical Nutrition of the Dante Pazzanese Institute of Cardiology were recruited for this randomized crossover study, of whom twenty-three completed the clinical trial. The baseline parameters are shown in Table 1.
The participants were instructed to consume 400 mL·day−1 of POJ or MOJ for 15 days. The chemical compositions of the orange juices are presented in Tables S1 and S2. The total soluble sugar content was similar in both orange juices (6.16 mg·100 mL−1 of POJ and 6.39 mg·100 mL−1 of MOJ, respectively), with higher concentrations of sucrose (3.10 ± 0.25 mg·100 mL−1 of POJ and 2.80 ± 0.25 mg·100 mL−1 of MOJ, respectively). The total organic acid content of the juices was 1410.13 mg·100 mL−1 (POJ) and 1494.16 mg·100 mL−1 (MOJ). Citric acid had the highest concentration of the organic acids (1092.36 ± 3.09 mg·100 mL−1 of POJ and 1161.94 ± 81.19 mg·100 mL−1 of MOJ). Orange juice dietary fiber was predominantly composed of its insoluble fraction (86% in POJ and 70% in MOJ), and its total dietary fiber content was 0.29 and 0.34 g·100 mL−1 for POJ and MOJ, respectively.
The total flavanone content of both orange juices was similar, but the concentrations of hesperidin and narirutin were higher in POJ than MOJ, while didymin was only detected in MOJ. The major flavanones identified in POJ and MOJ were hesperidin (29.66 and 23.77 mg·100 mL−1, respectively) and narirutin (2.04 and 0.54 mg·100 mL−1, respectively). The didymin (8.01 mg·100 mL−1) concentration in MOJ was higher than that of narirutin. As expected, anthocyanins were only detected in MOJ. The two anthocyanins identified were cyanidin-3-O-glucoside (2.73 ± 0.08 mg·100 mL−1) and cyanidin-3-O-(6″-malonyl)glucoside (0.08 ± 0.03 mg·100 mL−1).
The participants consumed 126.80 mg and 129.28 mg·day−1 of flavanones during the POJ and MOJ protocols, respectively. An additional 11.24 mg of anthocyanins were consumed daily in the MOJ protocol.

3.1. Quantification of Urinary Flavanones, Metabolites, and Phenolic Acids after Orange Juice Intake

Hesperidin and narirutin metabolites and phenolic acids were quantified from urine obtained before and after each intervention. The following hesperidin metabolites were identified and quantified from the urine (summed to compose the total value): hesperetin-7-O-glucuronide, hesperetin-3′-O-glucuronide, hesperetin-O-glucuronyl-sulfate, hesperetin-O-diglucuronide isomer 2, and hesperetin-O-diglucuronide isomer 3. Narirutin metabolites identified and quantified from the urine (summed to compose the total value) were: naringenin-7-O-glucuronide, naringenin-3′-O-glucuronide, naringenin-O-diglucuronide, and naringenin-O-diglucuronide isomer 2. Two phenolic acids were also identified and quantified: hippuric acid and methylhippuric acid.
Narirutin metabolites and phenolic acids excretion significantly increased after POJ (from 0.11 ± 0.03 to 0.47 ± 0.14 mg equivalents of narirutin; from 32.26 ± 13.17 to 72.38 ± 19.34 mg equivalents of phenolic acids) and MOJ (from 0.35 ± 0.09 to 0.71 ± 0.19 mg equivalents of narirutin; from 37.17 ± 6.39 to 77.15 ± 19.83 mg equivalents of phenolic acids) (Table S3). The excretion of hesperidin metabolites also increased after both interventions but was significantly (p = 0.028) increased only after MOJ intake (0.72 ± 0.26 to 1.46 ± 0.49 mg equivalents). After the 15 days of orange juice consumption, 57.96% (POJ) and 61.39% (MOJ) of the intake flavanones were quantified in the 24 h urine as flavanone phase II metabolites and phenolic acids.

3.2. Effect of Orange Juice Intake on Anthropometric and Biochemical Parameters

The participants’ clinical characteristics were measured before and after orange juice intake, in addition to the calculation of R24h considering energy and macronutrients (Table S4). The daily participant macronutrient and energy intake did not change during the interventions (p > 0.05). The macronutrient intake levels were under the dietary reference intakes (DRIs) [45] except for the daily intake of saturated fatty acids, which exceeded the dietary recommendation for individuals with cardiovascular risk.
The anthropometric variables, biochemical parameters, and intestinal permeability biomarkers are shown in Table 2. No significant differences (p > 0.05) were observed in the biochemical and anthropometric variables, probably due to the large interindividual variation between clinical trial participants. Patients with different BMI classes (class I = 30–34.9 kg·m−2, class II = 35–39.9 kg·m−2, and class III ≥ 40 kg·m−2) were included in this study, mostly with class I obesity (n = 12), with mean BMIs of 32.48 ± 0.40 kg·m−2 (POJ, Table S5) and 32.28 ± 0.33 kg·m−2 (MOJ, Table S6). Despite this, significant reductions in HDL-cholesterol levels were still observed after intake of POJ (45.91 ± 9.43 to 43.26 ± 9.15 mg·dL−1) and MOJ (47.78 ± 10.02 to 45.70 ± 9.67 mg·dL−1), and in total cholesterol levels (197.61 ± 40.12 to 184.57 ± 39.49 mg·dL−1) after MOJ intake. A total cholesterol reduction was also observed after POJ intake (184.17 ± 38.13 to 177.39 ± 38.42 mg·dL−1), but it was not statistically significant. Considering the BMI classifications, as shown in Table S5 (POJ) and Table S6 (MOJ), these metabolic parameters were progressively improved across the obesity classes, particularly among obesity class II and III patients. However, only the reduction in total cholesterol (180.25 ± 10.53 to 170.42 ± 8.17 mg·dL−1) after POJ intake was statistically significant (p = 0.004). The modest reduction in many other metabolic parameters in general and by BMI class that was observed is also indicative of the effects of orange juice intake.
The reduction in systolic (SBP) and diastolic blood pressure (DBP) is another indication of the benefits of orange juice, particularly because these blood pressure parameters were slightly elevated (>120 mmHg) in all patients. SBP was reduced from 132.43 ± 27.64 to 125.78 ± 26.31 mmHg after POJ and from 129.17 ± 27.03 to 126.30 ± 26.38 mmHg after MOJ, while DBP was reduced from 82.30 ± 17.14 to 79.74 ± 16.74 mmHg after POJ and from 81.35 ± 16.82 to 79.43 ± 16.76 mmHg after MOJ. These blood pressure parameters progressively improved across the BMI classes, and SBP and DBP were particularly reduced in the obesity class II and III patients.

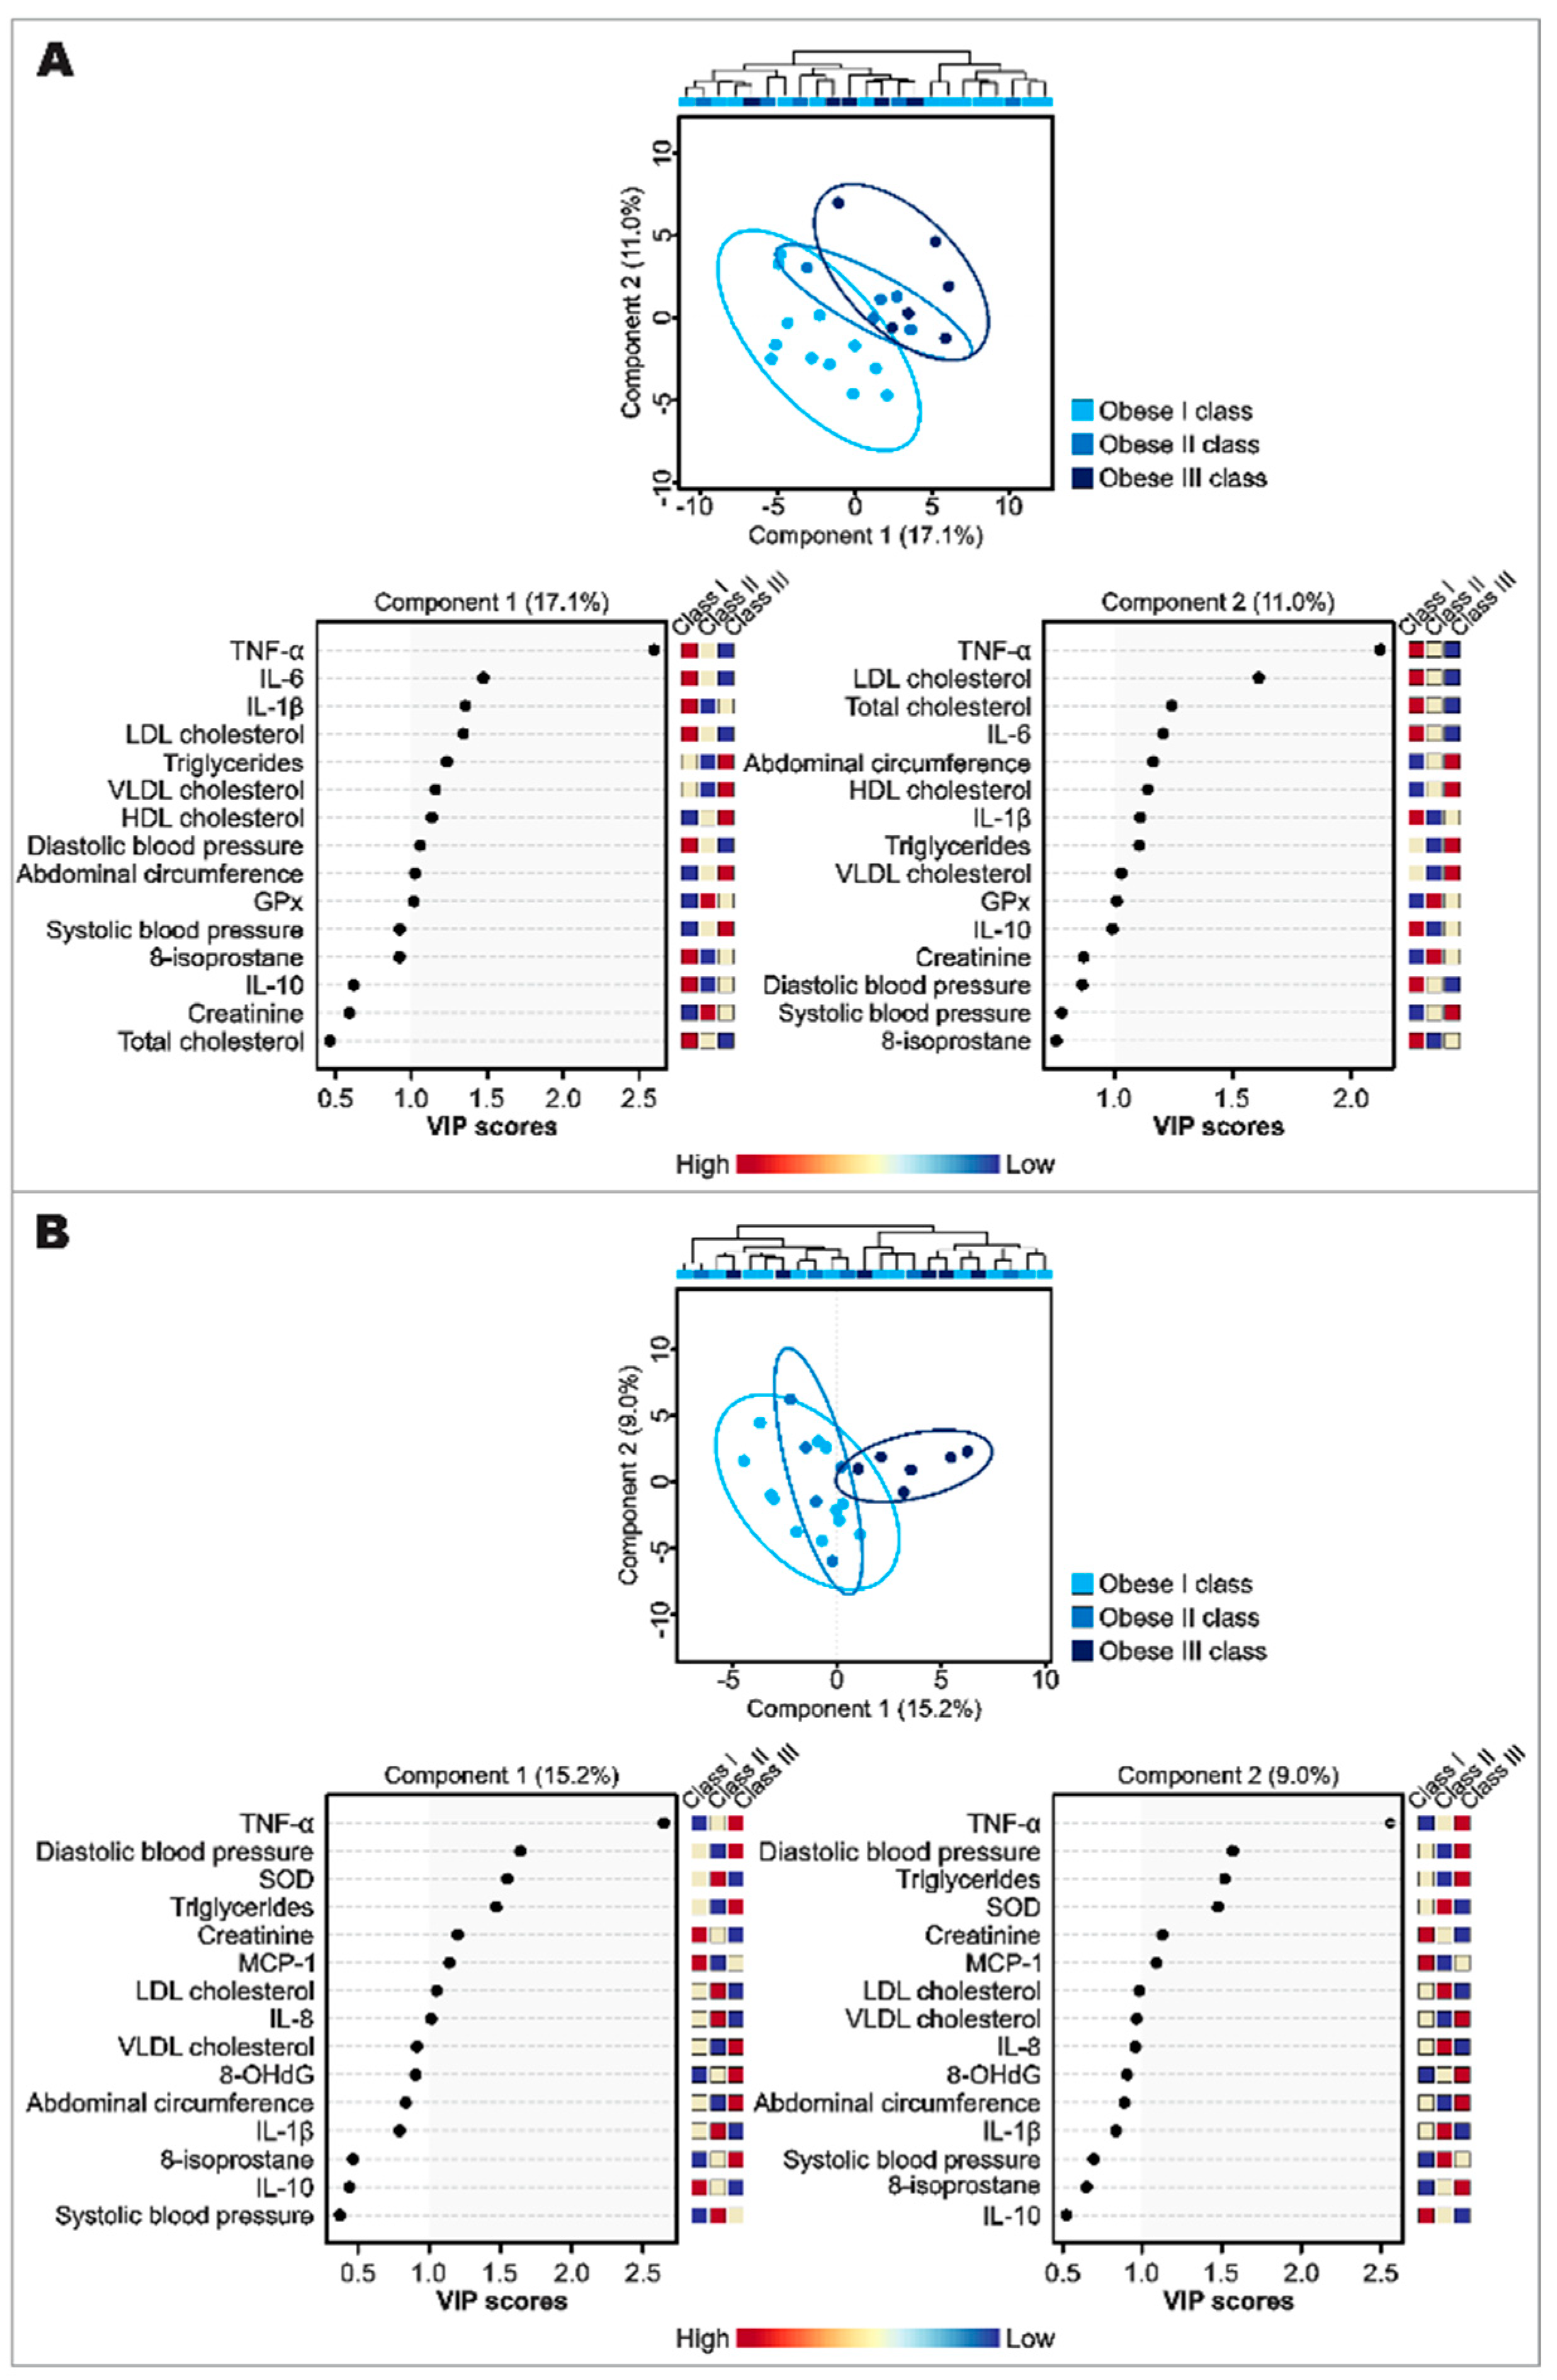
3.3. Inflammatory and Oxidative Stress Biomarker Response after Orange Juice Intake

Table 3 shows the inflammatory and oxidative stress biomarker levels describing the possible effects of orange juice intake on obesity-induced low-grade inflammation and oxidative stress. The cytokines and chemokines (IL-1β, IL-6, IL-8, IL-10, TNF-α, and MCP-1) that were analyzed in the patients’ plasma did not significantly change except for IL-8, which decreased from 733.76 ± 157.15 to 604.62 ± 137.97 pg·mL−1 after MOJ intake (p = 0.025). The most severe reduction in IL-8 occurred in the obesity class II patients (811.40 ± 162.5 to 593.60 ± 84.02 pg·mL−1), but it was not significant (p > 0.05), as shown in Table S7. Other cytokines that did not significantly change still showed an interesting consonant response, with reduced IL-1β, IL-6, and MCP-1 after the intake of both juices.
The plasmatic antioxidant capacity was evaluated using the ORAC assay. The ORAC values increased after POJ (2.45 ± 0.54 to 2.77 ± 0.55 µM eq Trolox·mL−1) but did not change after MOJ intake. Orange juice did not influence plasma SOD activity. GPx activity was significantly reduced after MOJ (1.10 ± 0.20 to 0.75 ± 0.17 U·mg−1) but not after POJ intake (0.93 ± 0.17 to 0.74 ± 0.20 U·mg−1). Orange juice also influenced urinary 8-OHdG levels, an oxidative stress biomarker that was significantly different (p < 0.001) after POJ (1.63 ± 0.32 to 0.47 ± 0.12 ng·mg−1) and MOJ (1.21 ± 0.23 to 0.55 ± 0.14 ng·mg−1) intake. 8-OHdG levels were also significantly lower in the obesity class I and III patients after POJ intake and in all BMI classes after MOJ intake (Table S8).
Discriminant analyses using the partial least squares (PLS-DA) model of anthropometric variables, biochemical parameters, and inflammatory and oxidative stress biomarkers were performed to visualize the global effects of POJ (Figure 1A) and MOJ (Figure 1B) and to identify the most important differentiating parameters across participants of different BMI classes. These data were submitted as delta values (Δ = T16 − T0) to attenuate the basal and interindividual variation and represent the effects of orange juice intake on the observed parameters and biomarkers.
The PLS-DA models did not show a clear separation among participants of different BMI classes, but the participants showed a spatial dispersion as a function of components 1 and 2 according to their BMI values, suggesting that the effects of orange juice intake were not only explained by the BMI variation, and that the variables included in both components were important to understanding the effects of POJ and MOJ even when statistically significant changes were not observed.
The determination of variables that were potentially influential toward the separation in both PLS-DA models was further assessed using a regression coefficient plot where parameters and biomarkers with higher VIP values were indicated as the most affected by each juice intake. The VIP score plots for the top 15 most important parameters and biomarkers are also shown in Figure 1. TNF-α, IL-6, IL-1β, cholesterol (total and fractions), and triglycerides were the parameters that seemed to best explain the effects of POJ intake (Figure 1A), while TNF-α, DBP, SOD, and triglycerides seemed to best explain the effects of MOJ intake (Figure 1B).

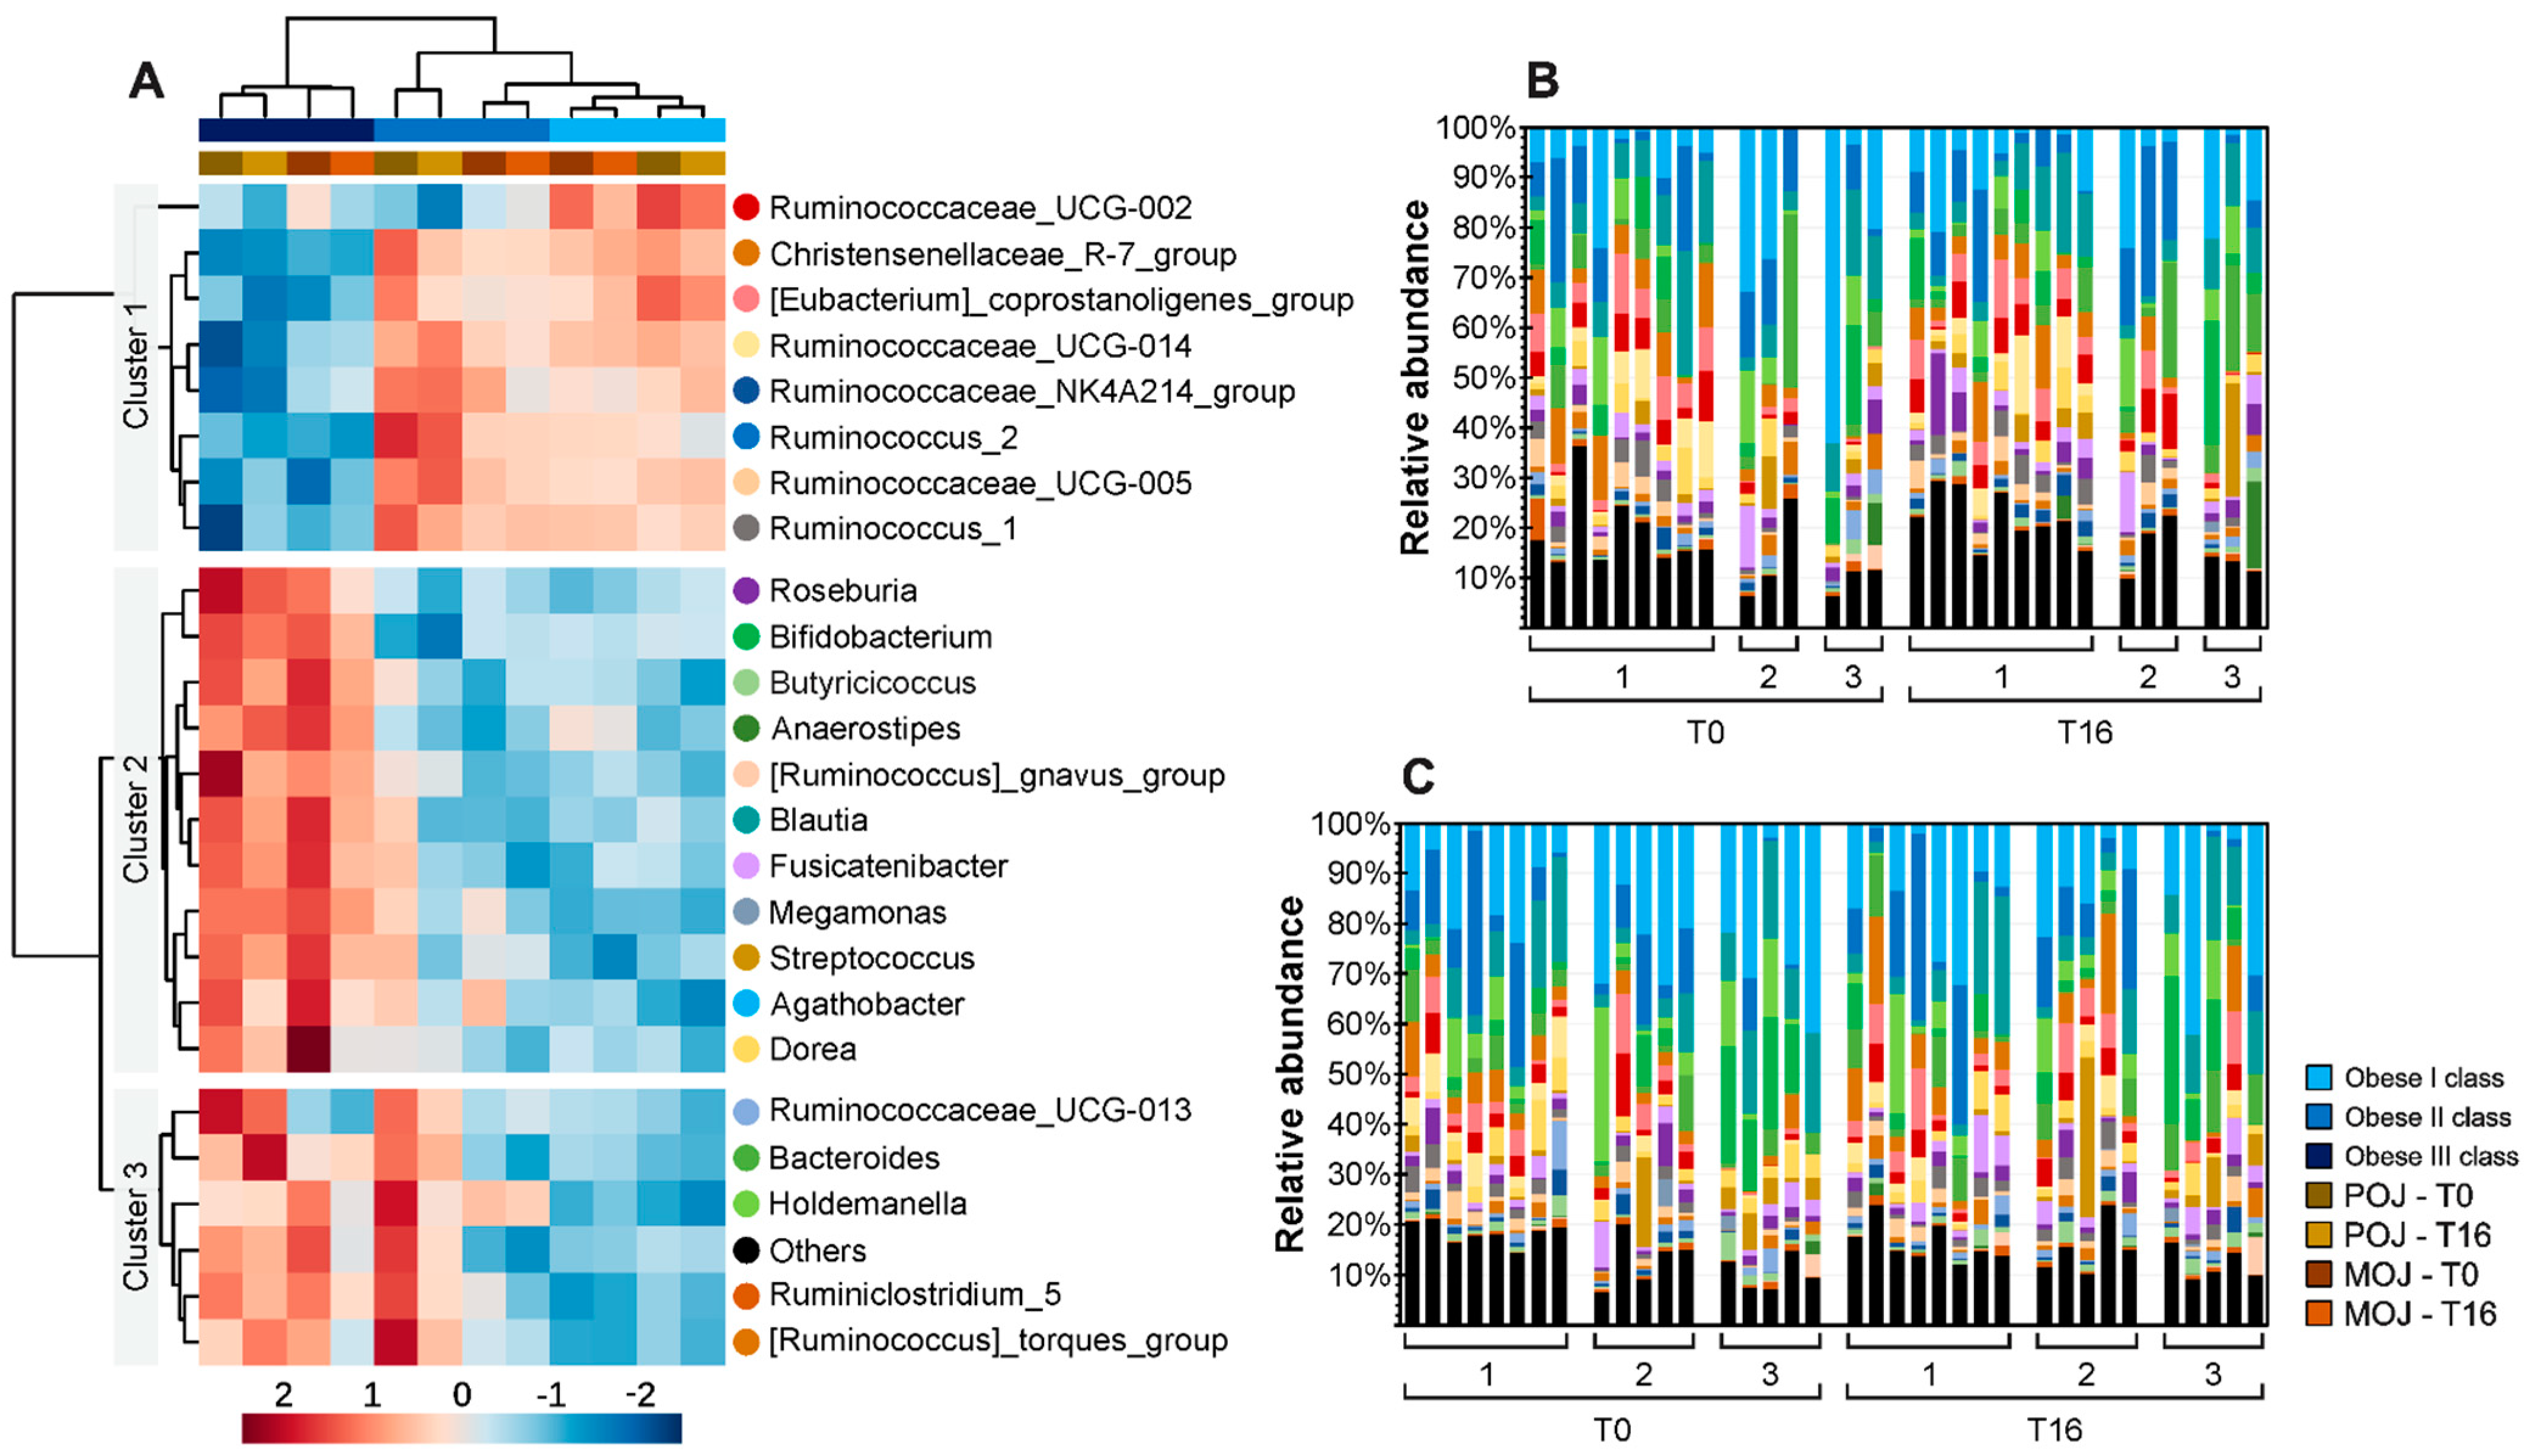
3.4. Effect of Obesity and Insulin Resistance on Gut Microbiota Profile

Before evaluating the effects of the orange juices on the gut microbiota profile of patients, an initial evaluation was performed using the fecal samples collected prior to the first intervention (Table 4). Firmicutes was the predominant phylum (87.43% ± 1.51%) found in all patients, followed by Actinobacteria (6.51% ± 1.37%) and Bacteroidetes (4.51% ± 1.01%). Firmicutes abundance was similar in all BMI classes, while the abundance of Bacteroidetes was lower in patients with class III obesity, albeit with p > 0.05. As expected, the F/B (Firmicutes/Bacteroidetes) ratio increased considerably in patients with higher BMI values, representing the dysbiosis associated with obesity.
Spearman’s correlation analyses were used to identify the associations between relative bacterial abundance in gut microbiota and the biochemical baseline parameters (Table 1). Bacteroidetes had strong inverse correlations with insulin (Spearman’s r = −0.53, p = 0.009) and HOMA-IR (Spearman’s r = −0.50, p = 0.016). Strong correlations were also observed between F/B ratio and insulin (Spearman’s r = −0.50, p = 0.015) and HOMA-IR (Spearman’s r = 0.52, p = 0.018). Firmicutes did not have any significant correlations.

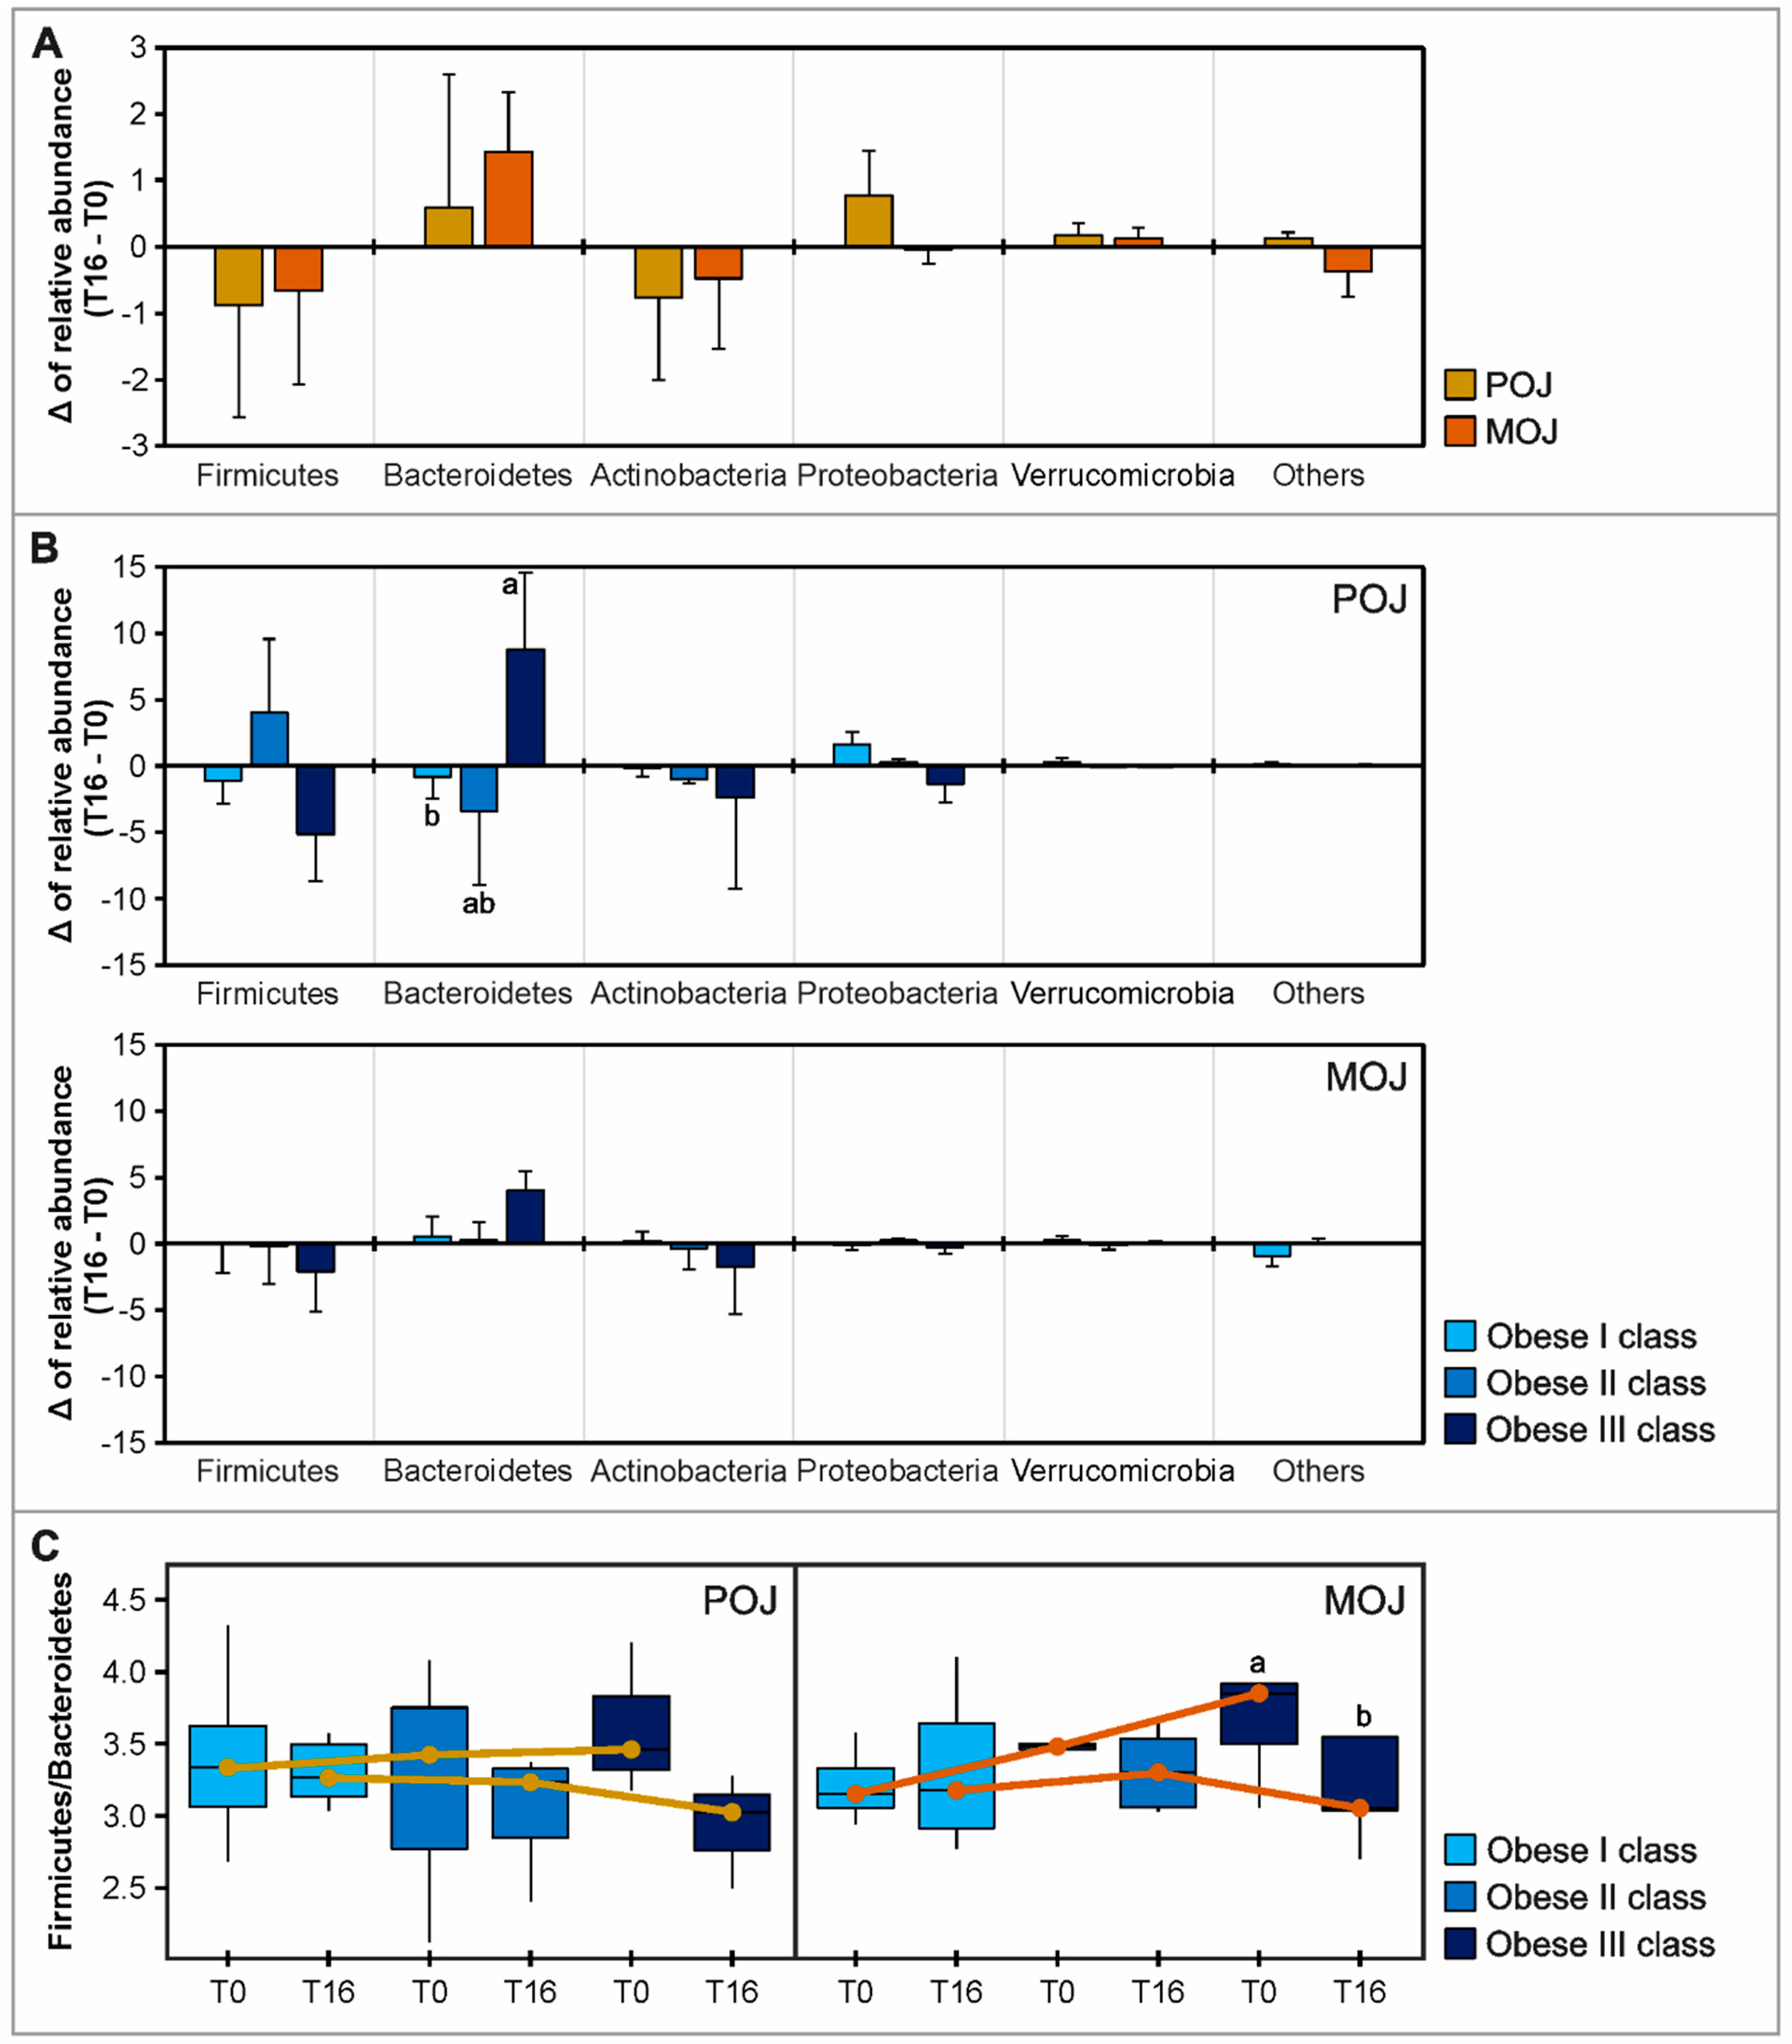
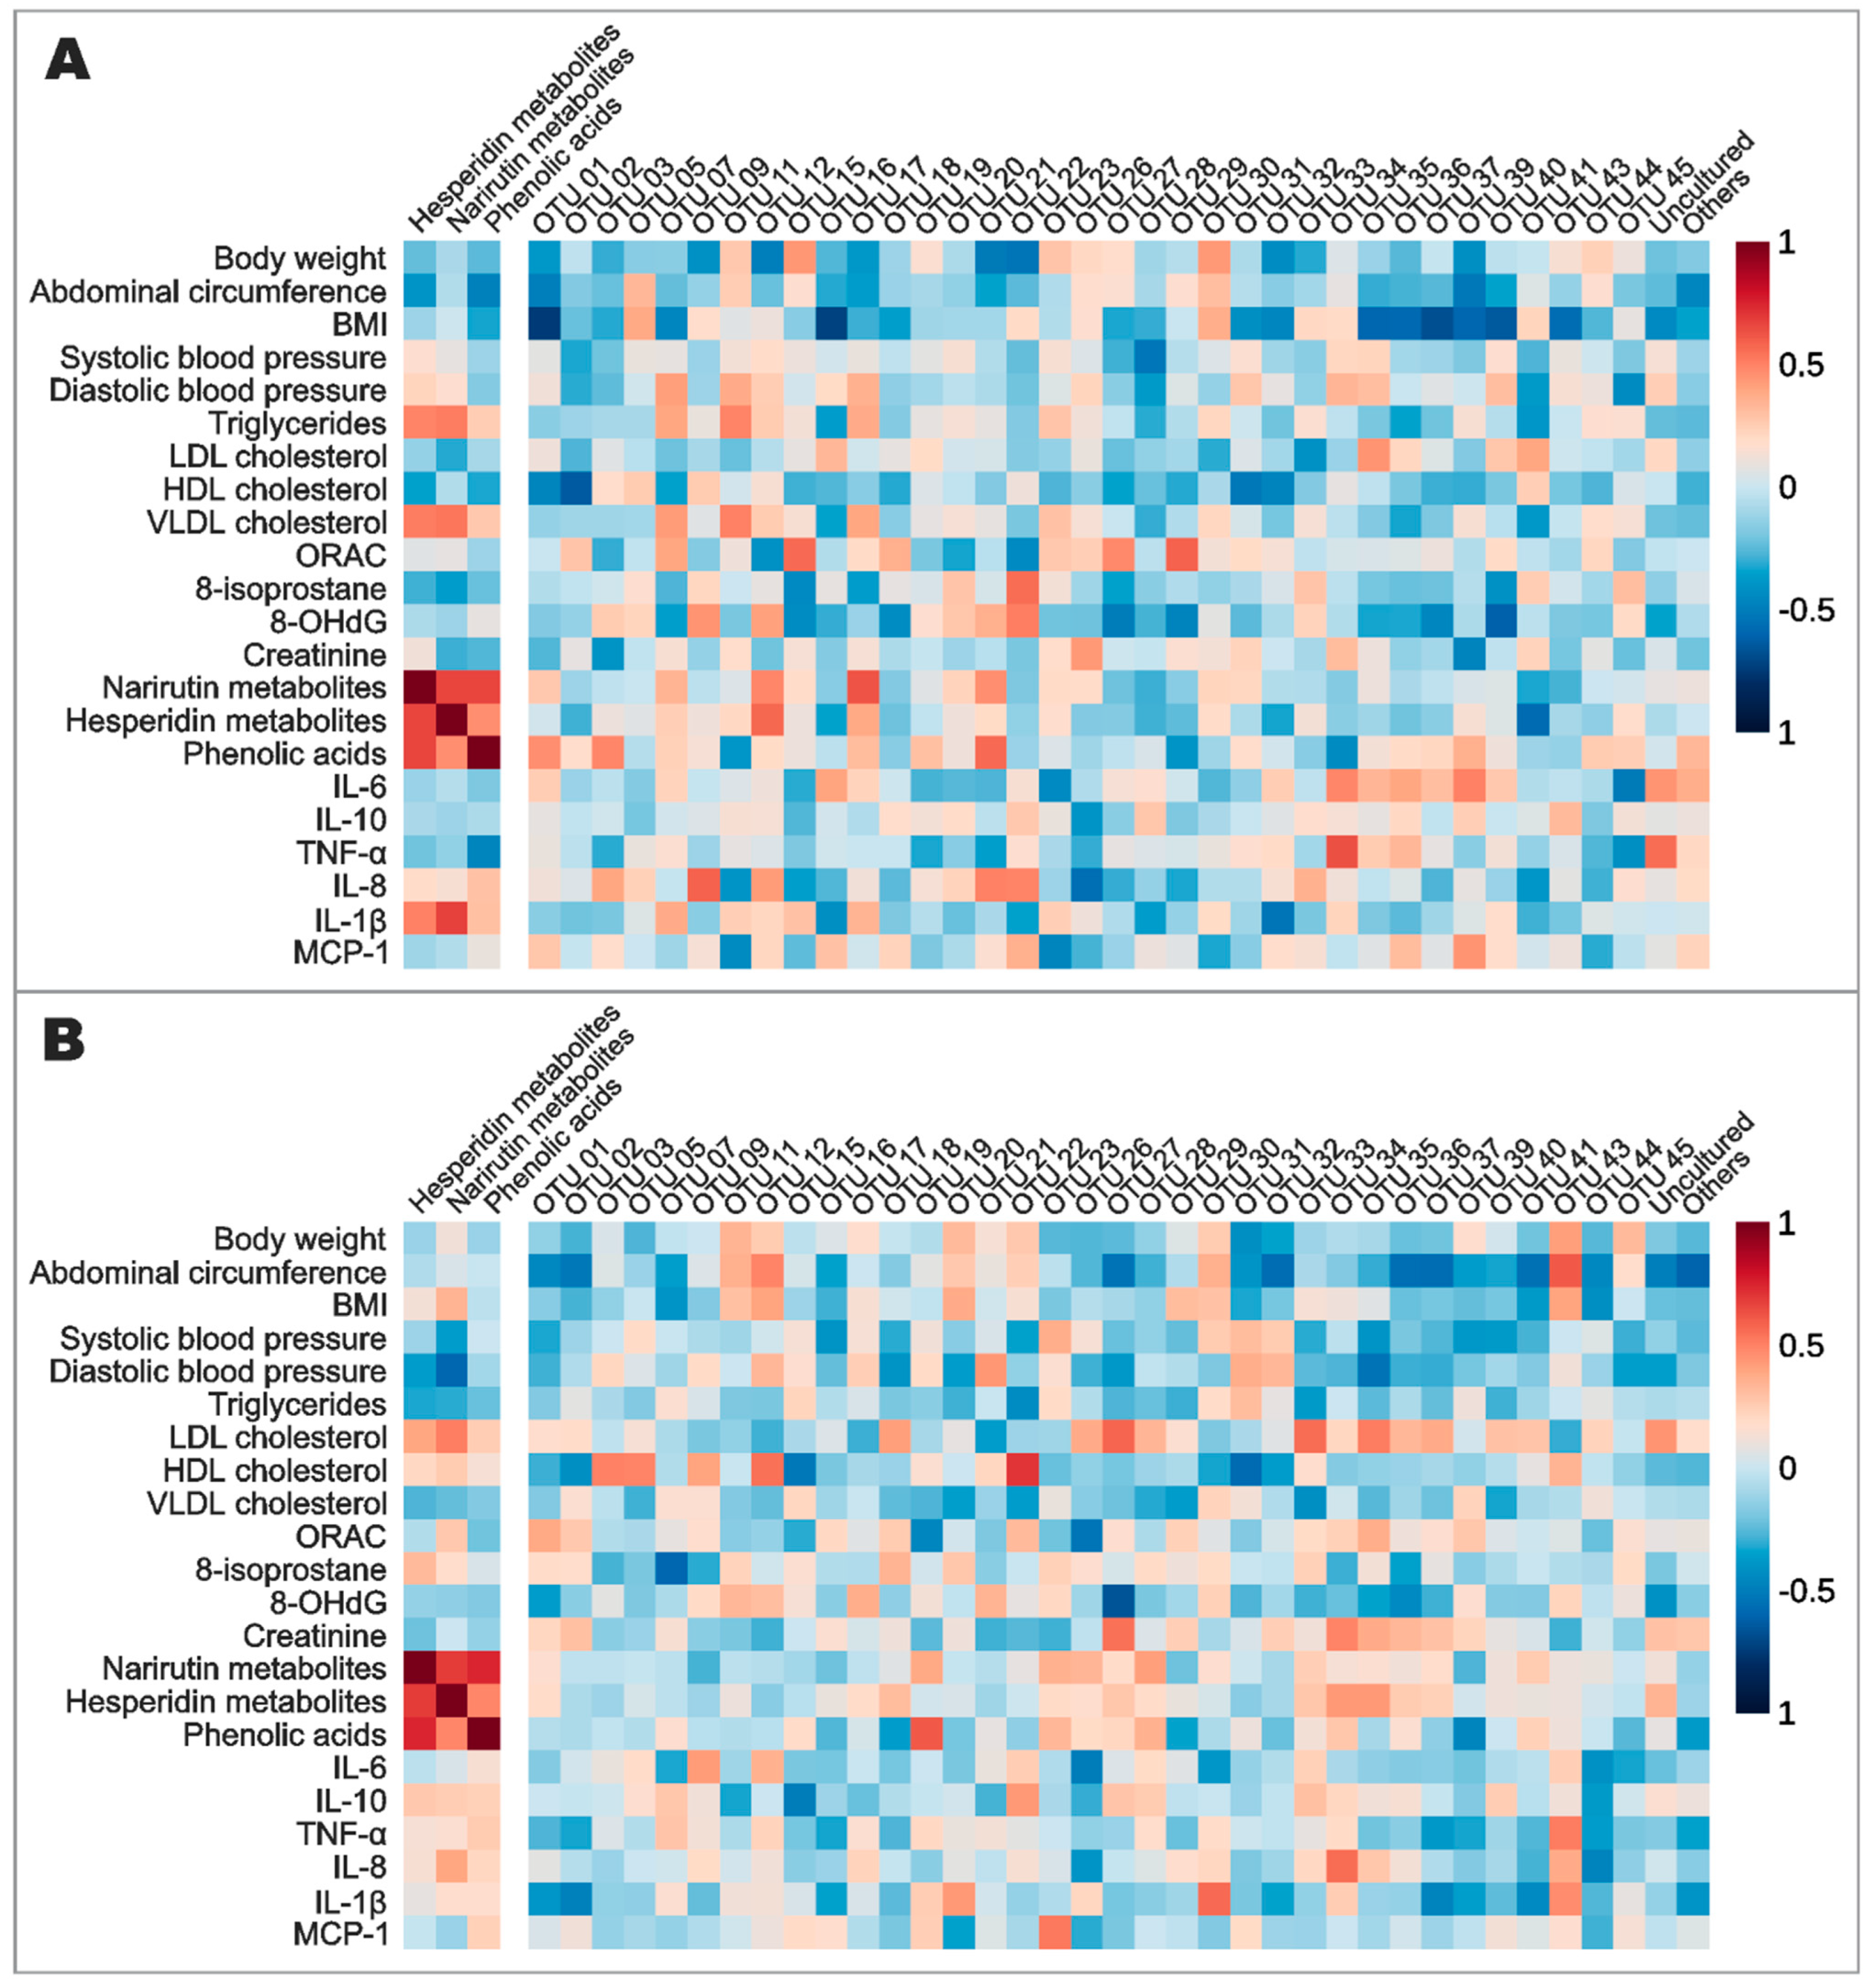
3.5. Effects of Orange Juice Intake on Gut Microbiota Profile and Short-Chain Fatty Acids

Alpha diversity was estimated using the Shannon diversity index, and the results are shown in Figure S2A. Although the alpha-diversity index was not statistically different, a slight increase in microbiota diversity was observed after both interventions, particularly after POJ intake. A principal coordinate analysis (PCoA) was generated considering the Bray–Curtis index to observe differences in the beta-diversity of gut microbiota after each intervention. As shown in Figure S2B, the gut microbiota composition was not significantly changed.
The relative abundance of the five most abundant bacterial phyla (Firmicutes, Actinobacteria, Bacteroidetes, Proteobacteria, and Verrucomicrobia) is shown in Figure S3 for descriptive purposes, as well as in Tables S9 and S10 with statistical analysis. Firmicutes was the predominant phylum found in all groups at T0 and T16 of each intervention, but at a higher relative abundance before POJ (86.07%) and MOJ (86.11%) intake than after (85.18% and 85.45%, respectively). Bacteroidetes levels were higher than Actinobacteria at T0 and T16 of POJ intake (6.84% ± 2.76% and 7.43% ± 1.97%, respectively), while the relative abundance of Actinobacteria was higher at T0 (7.34% ± 1.80%) and T16 (6.86% ± 1.75%) of MOJ intake. Although the orange juices did not significantly change the relative abundance of the five most prevalent bacterial phyla, Figure 2A shows that both juices similarly reduced Firmicutes and Actinobacteria and increased Bacteroidetes and Verrucomicrobia.
Since a large interindividual variation was observed in the microbiota profile, the effects of orange juice intake were more evident when patients were grouped by obesity class, particularly the F/B ratio. The Firmicutes reduction and Bacteroidetes increase were particularly higher among the obesity class III patients. Additionally, the F/B ratio progressively improved across the obesity classes. The boxplots in Figure 2C show the F/B ratio reduction after the intake of both orange juices in patients in different BMI classes, suggesting that individuals with higher BMIs can benefit more from orange juice effects.
Of the 45 most abundant bacterial genera, Agathobacter, Subdoligranulum, Faecalibacterium, Ruminococcus_2, and Blautia were the most prevalent. Relative abundances of these 45 bacterial genera are shown in Table S11 (by intervention) and Table S12 (by obesity classes). Four genera ([Eubacterium]_coprostanoligenes_group, [Ruminococcus]_torques_group, Blautia, and Dialister) had significantly different relative abundances after orange juice consumption, but none of these were significantly affected by both juices. Focusing on the top 25 significant bacterial genera in the gut microbiota, a heatmap analysis was performed to globally visualize the effects of POJ and MOJ on the gut microbiota of participants in different BMI classes, while also considering the interindividual variation observed at the genus level (Figure 3). Interestingly, the heatmap analysis showed the same order of clusters in class I–III obese patients. Patients with class I and II obesity had closer microbiota profiles than those with class III obesity, while T0 and T16 samples were always presented together.
When we analyzed the gut microbiota of patients in different obesity classes, three clusters were identified. The relative abundance of OTUs in cluster 1 was high in obesity classes I and II but lower in obesity class III, while the relative abundance of the OTUs in clusters 2 and 3 was low in obesity classes I and II but higher in obesity class III. Several bacterial genera involved in flavanone metabolism were identified in the gut microbiota, being included in different clusters. Eubacterium was included in cluster 1, while Blautia and Bacteroides were included in clusters 2 and 3, respectively.
SCFAs (acetate, propionate, butyrate, and isobutyrate) were analyzed to obtain an overview of gut microbiota metabolic activity (Table S13). Acetate was significantly reduced after POJ intake, but the same effect was not observed after MOJ. No significant differences were observed in propionate, butyrate, and isobutyrate levels.
Lastly, Spearman’s correlations analyses were performed to identify the potential associations modulated by orange juice intake among the urinary excretion of flavanone metabolites, anthropometric and biochemical parameters, inflammatory and oxidative biomarkers, and microbiota composition (genera) (Figure 4). Focusing on the relationship between the urinary excretion of metabolites and the previously described data, a strong correlation was identified between the excreted hesperidin metabolites and IL-1β levels (Spearman’s r = 0.68, p < 0.001), and a strong inverse correlation was identified between hesperidin metabolites and diastolic blood pressure (Spearman’s r = −0.59, p < 0.001) after POJ and MOJ intake, respectively. Several correlations were observed among the relative abundance of the most abundant bacterial genera, biochemical parameters, and inflammatory biomarkers. There was a positive correlation between the abundance of Bifidobacterium and total triglycerides (Spearman’s r = 0.50, p < 0.001) in the POJ group, as well as between the abundance of Blautia and HDL-cholesterol levels (Spearman’s r = 0.51, p < 0.001), in the MOJ group.

4. Discussion

The goal of this study was to evaluate the effects of POJ and MOJ intake on anthropometric variables, biochemical parameters, and inflammatory and oxidative stress biomarkers, in addition to the gut microbiota profile in individuals with insulin resistance and different classes of obesity. Our 15-day clinical trial was able to provide some additional insights into the benefits of orange intake (Figure 5).
Orange juice is a beverage consumed worldwide that has high amounts of flavanones, particularly hesperidin and narirutin. Orange juice is one of the main individual food contributors to total polyphenol, flavonoid, and flavanone intake by the Brazilian population according to the 2008–2009 Brazilian National Dietary Survey [20]. The orange juices that were used in this study were of a similar composition to those used in other clinical trials by the same research group [30,46]. Regarding total flavanone content, POJ (31.70 mg·100 mL−1) and MOJ (32.32 mg·100 mL−1) had higher flavanone levels than those reported by Fraga et al. [17] for POJ (27.41 mg·100 mL−1), but lower than those found by Nishioka et al. [30] for POJ (48.57 mg·100 mL−1) and MOJ (42.54 mg·100 mL−1) and by Moreira et al. [46] for POJ (33.22 mg·100 mL−1). As observed in those previous studies, hesperidin was the main flavanone in both orange juices. In addition to high flavanone levels, Moro is a variety of blood orange that has high concentrations of anthocyanins [47]. The MOJ used in our study had anthocyanin values (2.81 mg·100 mL−1) that were much lower than the 15.12 mg·100 mL−1 quantified by Nishioka et al. [30].
Outside of vitamin C, flavonones are among the compounds responsible for many of the health-beneficial effects in orange juices [48]. We identified and quantified the flavanone urinary metabolites of 23 obese patients who completed POJ and MOJ interventions. Hesperidin and narirutin metabolites, as well as phenolic acid excretion, significantly increased after both interventions, which suggests that our results may be related to the intake of these bioactive compounds. The absence of significant differences in daily macronutrient and energy intake reinforces the suggestion that our results were associated with the intake of orange juices.
Although most biochemical and anthropometric parameters were not significantly affected by orange juice intake, probably due to the large interindividual variation between patients, considerable improvements were observed in lipid and blood pressure (SBP and DBP) parameters, suggesting that there was a metabolic response. Patients in different BMI classes were included in this study, and this approach allowed us to observe some anthropometric variables and biochemical parameters, such as cholesterol fractions, that progressively improved across all BMI classes, while others were particularly reduced in class II/III obese patients (such as SBP and DBP).
Orange juice flavanones have already been associated with a reduction in these parameters among nonobese and overweight adults, but no association with obese individuals with insulin resistance was previously identified [16,17,49]. In addition to the interindividual variation resulting from the inclusion of patients in different BMI classes, the timing of the intervention and the nutritional quality of the patients’ diet could be two other factors that influenced our results. Long-term clinical trials [16,50] (longer than 60 days) were able to show some significant effects, whereas short-term clinical trials [46,51] (less than 30 days) did not identify significant differences. Furthermore, a 12-week clinical trial [52] that investigated the associations between POJ intake and a hypocaloric diet observed a reduction of 7% in body weight, 14% in adipose mass, and 16% in total cholesterol of obese individuals, suggesting that the health benefits of orange juice are intensified in the setting of a low-calorie diet. Additionally, a recent double-blind placebo-controlled study showed that overweight adults had a significant reduction in body mass (3.7 Kg), fat mass (2.4 Kg), and waist circumference (2.2 cm) after six months of supplementation with a Moro orange standardized extract containing 2.80 mg of anthocyanins and 8.80 mg of flavanones, evidencing the healthy benefits of Moro orange components [53].
Adiposity is directly associated with chronic low-grade inflammation in obese patients. The expansion of adipose tissue increases the expression and secretion of MCP-1, which induces the recruitment of macrophages to the tissue and promotes the increased secretion of cytokines such as IL-6, IL-1β, and TNF-α [54]. In the present study, we found that high plasmatic levels of IL-1β, IL-8, and MCP-1 before both interventions were reduced after the consumption of Pera and Moro juices, which suggests that orange juice might modulate inflammation due to obesity. Obese patients had a mean decrease of 16.81%, 17.60%, and 65.28% for IL-1β, IL-8, and MCP-1 levels after MOJ intake, respectively, while less marked reductions were observed after POJ intake (7.12%, 0.22%, and 35.32%, respectively). These results agree with those of a previous clinical trial that showed that orange juice intake affected MCP-1, IL-1β, and other cytokines [12].
Reactive oxygen (ROS) and nitrogen (RNS) species are the byproducts of biologic activities affected by obesity, and their chronic and excessive production results in structural and functional damage to macronutrients and DNA. The oxidation products of these macromolecules can be used as oxidative stress biomarkers. 8-Isoprostane is used as a lipid peroxidation biomarker, while 8-OHdG reflects oxidative DNA damage [54,55,56]. Flavanones can also modulate the Nrf2 pathway, increasing the enzymatic antioxidant response in response to oxidative stress and exerting a direct action on ROS and RNS [57,58]. Both juices altered the levels of oxidative stress biomarkers in this way, although the activity of antioxidant enzymes was not affected. 8-OHdG was significantly reduced (p < 0.001) after both interventions, suggesting that an important benefit of orange juice intake is reducing oxidative DNA damage, although there is no reference value for urinary 8-OHdG. Despite both juices being rich in vitamin C and flavanones, increased plasma antioxidant capacity was observed only after POJ consumption, which may explain the more pronounced impact of this juice on plasma and urinary biomarkers. Interestingly, MOJ had a more pronounced effect on GPx and SOD activity than POJ. However, these results agree with those obtained by Ribeiro et al. [59] in study performed with rats that presented doxorubicin-induced cardiotoxicity, highlighting that MOJ was more effective in modifying energy metabolism and attenuating oxidative stress than POJ.
As observed in relation to anthropometric variables and biochemical parameters, BMI class impacted the patient response to both orange juice interventions, as different classes of obesity resulted in different changes in inflammatory and oxidative stress biomarkers. The basal levels of MCP-1 and 8-OHdG, as well as their relative reduction, varied by BMI class, with class III obese patients having more marked reductions than class I obese patients.
As shown by the PLS-DA model, oxidative stress and inflammatory biomarkers were most prominently affected by orange juice intake. TNF-α, IL-6, IL-8, MCP-1, SOD, GPx, and lipid parameter changes seemed to explain a greater part of the effects of POJ/MOJ intake despite interindividual variation. We also observed that BMI was not the most important variable for differentiating the patient response to orange juice intake, a result that complements the findings of a previous study by our research group [30]. Nishioka et al. [30] evaluated the phase II metabolite excretion profile of flavanones after POJ and MOJ intake and observed that BMI and gender were not the most important variables for stratifying the volunteers, indicating that other factors have a greater impact on flavanone urinary excretion than BMI. Recent studies identified novel polymorphisms (SULT1A1, SULT1C4, and ABCC2) [60] and microRNAs (miR-375, miR-150-5p, miR-25-3p, and miR-451a) [61,62,63] associated with the interindividual variability in flavanones absorption and with the heterogeneity of the biological response to orange juice consumption, respectively. However, single nucleotide polymorphisms and microRNAs are only two of the several factors involved in those processes.
The interaction among diet, gut microbiota, and obesity has been intensively investigated in recent years. A healthy gut microbiota is characterized by a greater diversity of bacteria. However, gut diversity can be affected by the presence of clinical conditions such as obesity, insulin resistance, and chronic inflammation [64]. Bacteroidetes and Firmicutes constitute 90% of the fecal bacteria of healthy individuals, while some studies reported a lower proportion of Bacteroidetes and higher levels of Firmicutes in obese individuals compared with nonobese patients [58,64,65,66,67]. In our study, the gut microbiota prior to the clinical trial had alterations (dysbiosis) that were likely associated with pathologic conditions such as obesity, and both orange juices were capable of modulating this profile. We noted increased Firmicutes abundance in 85.90% of fecal samples, which corroborates the findings of other studies that noted increased Firmicutes to the detriment of Bacteroidetes. This change may be associated with the chronic intake of a high-fat diet, particularly saturated fat, which induces an increased Firmicutes/Bacteroidetes ratio and has implications on gut microbiota not only at the phylum level, but also at the genus and species levels [68].
Recent studies have suggested that, after being assembled, the adult gut microbiota represents a homeostatic microbial community that prevents profile changes through priority effects, providing resistance to microbiota modulation [69,70]. Despite this, our 15-day clinical trial was able to provide some microbiota changes that could be associated with the dietary intake of the bioactive compounds present in each orange juice. Although alpha- and beta-diversity indices suggest that POJ and MOJ did not affect bacterial diversity, POJ and MOJ intake resulted in a reduced Firmicutes/Bacteroidetes ratio, which supports the beneficial role of orange juice flavanones and anthocyanins in the restoration of a healthy gut microbiota profile in obese individuals. A study performed in mice that received a high-fat diet also showed a significant decrease in Firmicutes abundance and an increase in Bacteroidetes abundance after neohesperidin supplementation [71]. In addition to orange juice intake, factors such as environment [68], diet [72], and exposure to antibiotics [73,74] could result in changes in bacterial profile. Thus, the exclusion criteria adopted in our study avoided the inclusion of patients who could add other variables to the gut microbiota analysis.
By analyzing the most abundant bacterial genera, our study also found significant interindividual variability before and after each intervention. Despite this, POJ and MOJ similarly altered the relative abundance of 53.33% of the bacterial genera, with fifteen genera having their abundance increased and nine genera having their abundance reduced. This pattern suggests that the effects of orange juice on gut microbiota may be partly variety-independent, because both juices modulate gut microbiota in the same ways. In addition, six bacterial genera that include species related to the metabolism of flavanones were identified (Eubacterium, Bacteroides, Bifidobacterium, Blautia, Lactobacillus, and Streptococcus), with four genera having their abundance increased and two genera having their abundance reduced. These species are involved in O-deglycosylation, C-ring fission, and dihydroxylation by colonic microbiota to phenolic acids [8].
Furthermore, positive correlations were observed between the genera Dorea and Ruminococcus and anthropometric parameters, lipid parameters, and blood glucose. The associations between these genera and anthropometric parameters have previously been observed [75,76,77], as has their positive correlation with the lipid parameters [78,79]. These correlations contribute to our hypothesis that both orange juices affected the gut microbiota profile despite statistically significant differences not being extensively observed.
Differences in gut microbiota composition related to obesity and the impact of orange juice intake were more evident when patients were grouped by BMI class. Because patients in different BMI classes are likely to have differences in basal metabolism, chronic inflammation, nutritional quality, and food intake, factors that are known to influence gut microbiota composition, the most abundant bacterial phyla and genera were also compared in patients of similar BMI classes. We identified bacterial genera that were increased or decreased according to the patient’s BMI class, regardless of the effect of orange juice intake. For example, Bacteroidetes (phylum) and Bacteroides (genus) were more abundant in class III obese patients after POJ and MOJ intake. This genus includes species involved in the metabolism of flavanones [80] and anthocyanins [81,82,83,84], and a positive correlation was observed in a previous study by our research group [30] between the relative abundance of Bacteroides and the urinary contents of naringenin-7-O-glucuronide and hesperetin-7-O-glucuronide after the consumption of 600 mL of POJ and MOJ. In contrast, the consumption of flavanones may induce gut microbiota changes and impact SCFA production [85]. Bifidobacterium, Lactobacillus, Bacteroides, and Eubacterium are some of the bacterial genera involved in SCFA production [9,85].
We detected high SCFA levels in fecal samples collected before and after POJ intervention, but we did not find the same results before and after MOJ intake. Regardless, only acetate production was significantly altered by POJ. The absence of significant changes may be explained by the lower abundance of some bacterial genera (such as Bifidobacterium and Lactobacillus) in obese individuals with insulin resistance [68]. Furthermore, the duration of the intervention may not have been sufficient to induce significant changes in the gut microbiota of obese individuals, and the nutritional quality of the patients’ diet may have made it difficult to observe the effects of orange juice. Previous studies that evaluated the effects of polyphenols in higher concentrations reported a greater abundance of Bifidobacterium and higher SCFA concentrations concomitantly, indicating that polyphenol intake may modulate the gut microbiota and increase the production of these microbiota metabolites [86,87].
In this way, our study compared the effect of the consumption of juices obtained from two orange cultivars that present a similar chemical composition, except for the anthocyanins of Moro oranges, and different results were obtained in most of the parameters and biomarkers analyzed. Thus, our results highlight the importance of considering the food matrix (and not only the bioactive compound) when studying the effect of diet on human health. In addition, the large interindividual variation is a factor hindering the identification of significant responses, which limits the visualization of the possible biological effects resulting from orange juice intake. We grouped patients based on their obesity classes to mitigate this variation, an experimental approach that allowed us to show certain responses (not previously shown) that would not have been evident if they were all analyzed together.
Our study has some limitations, mainly related to the study population. This was a randomized crossover study carried out with a specific population (obese patients with prediabetes and insulin resistance who were under the care of the Dante Pazzanese Institute of Cardiology), which emphasizes the need for further studies in different groups. Additionally, the analyses carried out by obesity class presented considerably reduced numbers of participants, which make us consider realizing the following studies with larger populations. We also assume that the intervention may not have been long enough to evidence the effects of POJ and MOJ on some parameters of interest. Thus, a study with a long-term intervention will allow us to confirm this study’s findings and improve the results on parameters and biomarkers that did not present significant changes.

5. Conclusions

The present study showed that patients with insulin resistance and different BMI classes presented a gut microbiota with obesity-associated alterations (dysbiosis), and the consumption of Pera and Moro orange juices could modulate this profile and improve obesity-associated dysbiosis.
The consumption of POJ and MOJ also had a positive effect on plasma lipid parameters in addition to inflammatory and oxidative stress biomarkers, particularly 8-OHdG. Several other metabolic parameters, although not statistically significant, showed positive trends that may contribute to our understanding of the effects of the consumption of orange juice on the reduction in subclinical inflammation associated with obesity.
For the first time, the effects of Brazilian orange juice intake were evaluated in patients with different BMI classes. The findings suggest that individuals with higher BMIs can benefit more from orange juice consumption.
Despite differences in orange juice composition, similar metabolic and gut microbiota changes were observed after both POJ and MOJ intake, thereby reflecting the general benefits of orange juice consumption such as an improved F/B ratio, rather than orange-variety-associated benefits. Additional studies are needed to improve our knowledge about the mechanisms involved in the different beneficial effects of the ingestion of the juices of different orange varieties.

Supplementary Materials

The following supporting information can be downloaded at: https://www.mdpi.com/article/10.3390/obesities2040033/s1, Figure S1. Flowchart of the clinical study (A) and schematic representation of the clinical study design (B); Figure S2. Gut microbiota diversity analysis: (A) Shannon diversity index as a measurement of alpha-diversity; (B) beta diversity indicated by a principal coordinate analysis (PCoA) plot; Figure S3. Effect of Pera (POJ) and Moro (MOJ) orange juice intake on the gut microbiota OTUs. Mean relative abundance (A) and relative abundance by obesity class (B) of the most abundant bacteria phyla in the gut microbiota of the patients before (T0) and after (T16) each intervention; Table S1. Quality parameters and chemical composition of pasteurized Pera and Moro orange juices; Table S2. Flavonoid content in pasteurized Pera and Moro orange juices; Table S3. Creatinine and flavanone metabolites excreted by the patients before (T0) and after (T16) the consumption of Pera and Moro orange juices; Table S4. Energy and macronutrient consumption before (T0) and after (T16) the intervention with daily consumption of 500 mL of orange juice; Table S5. Anthropometric variables and biochemical parameters of patients with different classes of obesity before (T0) and after (T16) the consumption of Pera orange juice; Table S6. Anthropometric variables and biochemical parameters of patients with different classes of obesity before (T0) and after (T16) the consumption of Moro orange juice; Table S7. Inflammatory biomarkers of patients with different classes of obesity before (T0) and after (T16) the consumption of Pera and Moro orange juices; Table S8. Oxidative stress biomarkers of patients with different classes of obesity before (T0) and after (T16) the consumption of Pera and Moro orange juices; Table S9. Relative abundance of significant gut microbiota phyla and Firmicutes/Bacteroidetes ratio in patients before (T0) and after (T16) Pera and Moro orange juice intake; Table S10. Relative abundance of significant gut microbiota phyla and Firmicutes/Bacteroidetes ratio in patients with different classes of obesity before (T0) and after (T16) Pera and Moro orange juice intake; Table S11. Relative abundance of significant gut microbiota OTUs (bacterial genera) in patients before (T0) and after (T16) Pera and Moro orange juice intake; Table S12. Relative abundance of significant gut microbiota OTUs (bacterial genera) in patients with different classes of obesity before (T0) and after (T16) Pera and Moro orange juice intake; Table S13. Effect of Pera (POJ) and Moro orange juice (MOJ) intake on the fecal short-chain fatty acids. Refs. [88,89,90,91,92,93] are cited in supplementary materials.

Author Contributions

Conceptualization, F.M.L.; N.M.A.H.; C.R.T.; C.D.M.; R.V.T.d.S.; K.G.d.S.; A.A.d.S.; Investigation, K.G.d.S.; A.A.d.S.; Data curation, K.G.d.S.; A.A.d.S.; E.d.C.T.; L.G.S.; Formal analysis, E.d.C.T.; Methodology, C.R.T.; C.D.M.; K.G.d.S.; A.A.d.S.; C.K.d.A.; Resources, F.M.L.; N.M.A.H.; Supervision, F.M.L.; Writing—original draft, A.A.d.S.; E.d.C.T.; Writing—review and editing, E.d.C.T.; N.M.A.H.; F.M.L. All authors have read and agreed to the published version of the manuscript.

Funding

This work was supported by the National Council for Scientific and Technological Development (CNPq) (Grant 434713/2018-0) and by the São Paulo Research Foundation (FAPESP) (Grant 2013/07914-8). The authors are grateful for the scholarship provided by the FAPESP (Grant 2020/06467-1).

Institutional Review Board Statement

The study was conducted in accordance with the Declaration of Helsinki, and approved by the Ethics Committees of the School of Pharmaceutical Science, University of São Paulo and of the Dante Pazzanese Institute of Cardiology (CAAE 59663816.8.0000.5462).

Informed Consent Statement

Informed consent was obtained from all subjects involved in the study.

Data Availability Statement

The data from this study will be available up request.

Acknowledgments

We would like to thank Fundecitrus for providing the orange juices used in this study, all of the volunteers who contributed to the project development and Mirian Sanz Roldán for performing mass spectra analyses.

Conflicts of Interest

The authors declare no conflict of interest.

References

  1. Chooi, Y.C.; Ding, C.; Magkos, F. The epidemiology of obesity. Metabolism 2019, 92, 6–10. [Google Scholar] [CrossRef] [PubMed] [Green Version]
  2. Blüher, M. Obesity: Global epidemiology and pathogenesis. Nat. Rev. Endocrinol. 2019, 15, 288–298. [Google Scholar] [CrossRef]
  3. Karczewski, J.; Śledzińska, E.; Baturo, A.; Jończyk, I.; Maleszko, A.; Samborski, P.; Begier-Krasińska, B.; Dobrowolska, A. Obesity and inflammation. Eur. Cytokine Netw. 2018, 29, 83–94. [Google Scholar] [CrossRef] [PubMed]
  4. Hruby, A.; Manson, J.E.; Qi, L.; Malik, V.S.; Rimm, E.B.; Sun, Q.; Willett, W.C.; Hu, F.B. Determinants and Consequences of Obesity. Am. J. Public Health 2016, 106, 1656–1662. [Google Scholar] [CrossRef] [PubMed]
  5. Esteve, E.; Ricart, W.; Fernández-Real, J.M. Gut microbiota interactions with obesity, insulin resistance and type 2 diabetes: Did gut microbiote co-evolve with insulin resistance? Curr. Opin. Clin. Nutr. Metab. Care 2011, 14, 483–490. [Google Scholar] [CrossRef] [PubMed]
  6. Saad, M.J.A.; Santos, A.; Prada, P.O. Linking Gut Microbiota and Inflammation to Obesity and Insulin Resistance. Physiology 2016, 31, 283–293. [Google Scholar] [CrossRef] [Green Version]
  7. Singh, A.K.; Cabral, C.; Kumar, R.; Ganguly, R.; Rana, H.K.; Gupta, A.; Lauro, M.R.; Carbone, C.; Reis, F.; Pandey, A.K. Beneficial effects of dietary polyphenols on gut microbiota and strategies to improve delivery efficiency. Nutrients 2019, 11, 2216. [Google Scholar] [CrossRef] [Green Version]
  8. Corrêa, T.A.F.; Rogero, M.M.; Hassimotto, N.M.A.; Lajolo, F.M. The Two-Way Polyphenols-Microbiota Interactions and Their Effects on Obesity and Related Metabolic Diseases. Front. Nutr. 2019, 6, 188. [Google Scholar] [CrossRef] [Green Version]
  9. Cardona, F.; Andrés-Lacueva, C.; Tulipani, S.; Tinahones, F.J.; Queipo-Ortuño, M.I. Benefits of polyphenols on gut microbiota and implications in human health. J. Nutr. Biochem. 2013, 24, 1415–1422. [Google Scholar] [CrossRef] [Green Version]
  10. Gwiazdowska, D.; Juś, K.; Jasnowska-Małecka, J.; Kluczyńska, K. The impact of polyphenols on Bifidobacterium growth. Acta Biochim. Pol. 2015, 62, 895–901. [Google Scholar] [CrossRef]
  11. Panche, A.N.; Diwan, A.D.; Chandra, S. Flavonoids: An overview. J. Nutr. Sci. 2016, 5, 1–15. [Google Scholar] [CrossRef] [PubMed] [Green Version]
  12. Milenkovic, D.; Deval, C.; Dubray, C.; Mazur, A.; Morand, C. Hesperidin Displays Relevant Role in the Nutrigenomic Effect of Orange Juice on Blood Leukocytes in Human Volunteers: A Randomized Controlled Cross-Over Study. PLoS ONE 2011, 6, e26669. [Google Scholar] [CrossRef] [PubMed] [Green Version]
  13. Ghanim, H.; Sia, C.L.; Upadhyay, M.; Korzeniewski, K.; Viswanathan, P.; Abuaysheh, S.; Mohanty, P.; Dandona, P. Orange juice neutralizes the proinflammatory effect of a high-fat, high-carbohydrate meal and prevents endotoxin increase and Toll-like receptor expression. Am. J. Clin. Nutr. 2010, 91, 940–949. [Google Scholar] [CrossRef] [PubMed] [Green Version]
  14. Anacleto, S.L.; Milenkovic, D.; Kroon, P.A.; Needs, P.W.; Lajolo, F.M.; Hassimotto, N.M.A. Citrus flavanone metabolites protect pancreatic-β cells under oxidative stress induced by cholesterol. Food Funct. 2020, 11, 8612–8624. [Google Scholar] [CrossRef]
  15. Morand, C.; Dubray, C.; Milenkovic, D.; Lioger, D.; Martin, J.F.; Scalbert, A.; Mazur, A. Hesperidin contributes to the vascular protective effects of orange juice: A randomized crossover study in healthy volunteers. Am. J. Clin. Nutr. 2011, 93, 73–80. [Google Scholar] [CrossRef] [Green Version]
  16. Rangel-Huerta, O.D.; Aguilera, C.M.; Martin, M.V.; Soto, M.J.; Rico, M.C.; Vallejo, F.; Tomas-Barberan, F.; Perez-de-la-Cruz, A.J.; Gil, A.; Mesa, M.D. Normal or High Polyphenol Concentration in Orange Juice Affects Antioxidant Activity, Blood Pressure, and Body Weight in Obese or Overweight Adults. J. Nutr. 2015, 145, 1808–1816. [Google Scholar] [CrossRef] [Green Version]
  17. Fraga, L.N.; Coutinho, C.P.; Rozenbaum, A.C.; Tobaruela, E.C.; Lajolo, F.M.; Hassimotto, N.M.A. Blood pressure and body fat % reduction is mainly related to flavanone phase II conjugates and minor extension by phenolic acid after long-term intake of orange juice. Food Funct. 2021, 12, 11278–11289. [Google Scholar] [CrossRef]
  18. Murphy, M.M.; Barrett, E.C.; Bresnahan, K.A.; Barraj, L.M. 100 % Fruit juice and measures of glucose control and insulin sensitivity: A systematic review and meta-analysis of randomised controlled trials. J. Nutr. Sci. 2017, 6, e59. [Google Scholar] [CrossRef] [Green Version]
  19. Food and Agriculture Organization of the United Nations. Citrus Fruit Statistical Compendium 2020; Food and Agriculture Organization of the United Nations: Rome, Italy, 2021. [Google Scholar]
  20. Carnauba, R.A.; Sarti, F.M.; Hassimotto, N.M.A.; Lajolo, F.M. Estimated polyphenol intake and major food sources of the Brazilian population: Changes between 2008–2009 and 2017–2018. Br. J. Nutr. 2022, 7, 1–8. [Google Scholar] [CrossRef]
  21. Muscatello, M.R.A.; Zoccali, R.A.; Bruno, A. Chapter 11—Citrus Fruit Polyphenols and Flavonoids: Applications to Psychiatric Disorders. Polyphenols: Mechanisms of Action in Human Health and Disease; Academic Press: Cambridge, MA, USA, 2018; pp. 119–131. [Google Scholar]
  22. Acquaviva, R.; Russo, A.; Galvano, F.; Galvano, G.; Barcellona, M.L.; Volti, G.L.; Vanella, A. Cyanidin and cyanidin 3-O-beta-D-glucoside as DNA cleavage protectors and antioxidants. Cell Biol. Toxicol. 2003, 19, 243–252. [Google Scholar] [CrossRef]
  23. Shih, P.H.; Yeh, C.T.; Yen, G.C. Anthocyanins induce the activation of phase II enzymes through the antioxidant response element pathway against oxidative stress-induced apoptosis. J. Agric. Food Chem. 2007, 55, 9427–9435. [Google Scholar] [CrossRef] [PubMed]
  24. Yang, C.; Qin, J.; Xie, F.; Zhou, K.; Xi, W. Red light-transmittance bagging promotes carotenoid accumulation through xanthophylls esterification during the ripening of blood orange fruit. Food Chem. 2023, 404, 134578. [Google Scholar] [CrossRef] [PubMed]
  25. Geloneze, B.; Repetto, E.M.; Geloneze, S.R.; Tambascia, M.A.; Ermetice, M.N. The threshold value for insulin resistance (HOMA-IR) in an admixtured population IR in the Brazilian Metabolic Syndrome Study. Diabetes Res. Clin. Pract. 2006, 72, 219–220. [Google Scholar] [CrossRef]
  26. Geloneze, B.; Vasques, A.C.J.; Stabe, C.F.C.; Pareja, J.C.; Rosado, L.E.F.P.L.; Queiroz, E.C.; Tambascia, M.A. HOMA1-IR and HOMA2-IR indexes in identifying insulin resistance and metabolic syndrome: Brazilian Metabolic Syndrome Study (BRAMS). Arq. Bras. Endocrinol. Metab. 2009, 53, 281–287. [Google Scholar] [CrossRef] [PubMed] [Green Version]
  27. World Health Organization. Obesity: Preventing and managing the global epidemic, Report of a World Health Organization Consultation. WHO Obesity Technical Report Series; World Health Organization: Geneva, Switzerland, 2000; Volume 894.
  28. Prior, R.L.; Hoang, H.; Gu, L.; Wu, X.; Bacchiocca, M.; Howard, L.; Hampsch-Woodill, M.; Huang, D.; Ou, B.; Jacob, R. Assays for Hydrophilic and Lipophilic Antioxidant Capacity (oxygen radical absorbance capacity (ORACFL)) of Plasma and Other Biological and Food Samples. J. Agric. Food Chem. 2003, 51, 3273–3279. [Google Scholar] [CrossRef] [PubMed]
  29. Ewing, J.F.; Janero, D.R. Microplate superoxide dismutase assay employing a nonenzymatic superoxide generator. Anal. Biochem. 1995, 232, 243–248. [Google Scholar] [CrossRef] [PubMed]
  30. Flohé, L.; Günzler, W.A. Assays of glutathione peroxidase. Methods Enzymol. 1984, 105, 114–121. [Google Scholar]
  31. Nishioka, A.; Tobaruela, E.C.; Fraga, L.N.; Tomás-Barberán, F.A.; Lajolo, F.M.; Hassimotto, N.M.A. Stratification of Volunteers According to Flavanone Metabolite Excretion and Phase II Metabolism Profile after Single Doses of ‘Pera’ Orange and ‘Moro’ Blood Orange Juices. Nutrients 2021, 13, 473. [Google Scholar] [CrossRef]
  32. Christoff, A.P.; Sereia, A.F.R.; Boberg, D.R.; Moraes, L.R.V.; Oliveira, L.F.V. Bacterial Identification through Accurate Library Preparation and High-Throughput Sequencing; Neoprospecta Microbiome Technologies: Florianopolis, Brazil, 2017; pp. 1–5. [Google Scholar]
  33. Wang, Y.; Qian, P.Y. Conservative Fragments in Bacterial 16S rRNA Genes and Primer Design for 16S Ribosomal DNA Amplicons in Metagenomic Studies. PLoS ONE 2009, 4, e7401. [Google Scholar] [CrossRef] [Green Version]
  34. Caporaso, J.G.; Lauber, C.L.; Walters, W.A.; Berg-Lyons, D.; Huntley, J.; Fierer, N.; Owens, S.M.; Betley, J.; Fraser, L.; Bauer, M. Ultra-high-throughput microbial community analysis on the Illumina HiSeq and MiSeq platforms. ISME J. 2012, 6, 1621–1624. [Google Scholar] [CrossRef] [Green Version]
  35. Christoff, A.P.; Cruz, G.N.F.; Sereia, A.F.R.; Yamanaka, L.E.; Silveira, P.P.; Oliveira, L.F.V. End-to-end assessment of fecal bacteriome analysis: From sample processing to DNA sequencing and bioinformatics results. BioRxiv 2020, 1–22. [Google Scholar] [CrossRef]
  36. Bolyen, E.; Rideout, J.R.; Dillon, M.R.; Bokulich, N.A.; Abnet, C.C.; Al-Ghalith, G.A.; Alexander, H.; Alm, E.J.; Arumugam, M.; Asnicar, F. Reproducible, interactive, scalable and extensible microbiome data science using QIIME 2. Nat. Biotechnol. 2019, 37, 852–857. [Google Scholar] [CrossRef] [PubMed]
  37. Callahan, B.J.; McMurdie, P.J.; Rosen, M.J.; Han, A.W.; Johnson, A.J.A.; Holmes, S.P. DADA2: High-resolution sample inference from Illumina amplicon data. Nat. Methods 2016, 13, 581–583. [Google Scholar] [CrossRef] [Green Version]
  38. Bokulich, N.A.; Kaehler, B.D.; Rideout, J.R.; Dillon, M.; Bolyen, E.; Knight, R.; Huttley, G.A.; Caporaso, J.G. Optimizing taxonomic classification of marker-gene amplicon sequences with QIIME 2’s q2-feature-classifier plugin. Microbiome 2018, 6, 90. [Google Scholar] [CrossRef] [PubMed]
  39. Quast, C.; Pruesse, E.; Yilmaz, P.; Gerken, J.; Schweer, T.; Yarza, P.; Peplies, J.; Glöckner, F.O. The SILVA ribosomal RNA gene database project: Improved data processing and web-based tools. Nucleic Acids Res. 2012, 41, D590–D596. [Google Scholar] [CrossRef] [PubMed]
  40. Menezes, E.W.; Dan, M.C.T.; Cardenette, G.H.L.; Goñi, I.; Bello-Pérez, L.A.; Lajolo, F.M. In Vitro Colonic Fermentation and Glycemic Response of Different Kinds of Unripe Banana Flour. Plant Foods Hum. Nutr. 2010, 65, 379–385. [Google Scholar] [CrossRef] [PubMed]
  41. Pang, Z.; Chong, J.; Zhou, G.; Morais, D.A.L.; Chang, L.; Barrette, M.; Gauthier, C.; Jacques, P.; Li, S.; Xia, J. MetaboAnalyst 5.0: Narrowing the gap between raw spectra and functional insights. Nucleic Acids Res. 2021, 49, W388–W396. [Google Scholar] [CrossRef] [PubMed]
  42. Chong, J.; Liu, P.; Zhou, G.; Xia, J. Using MicrobiomeAnalyst for comprehensive statistical, functional, and meta-analysis of microbiome data. Nat. Protoc. 2020, 15, 799–821. [Google Scholar] [CrossRef]
  43. Shannon, C.E. A Mathematical Theory of Communication. Bell Syst. Tech. J. 1948, 27, 379–423. [Google Scholar]
  44. Caporaso, J.G.; Kuczynski, J.; Stombaugh, J.; Bittinger, K.; Bushman, F.D.; Costello, E.K.; Fierer, N.; Peña, A.G.; Goodrich, J.K.; Gordon, J.I. QIIME allows analysis of high-throughput community sequencing data. Nat. Methods 2010, 7, 335–336. [Google Scholar] [CrossRef] [Green Version]
  45. Institute of Medicine. Dietary Reference Intakes for Energy, Carbohydrate, Fiber, Fat, Fatty Acids, Cholesterol, Protein, and Amino Acids; The National Academies Press: Washington, DC, USA, 2005. [Google Scholar]
  46. Moreira, V.; Brasili, E.; Fiamoncini, J.; Marini, F.; Miccheli, A.; Daniel, H.; Lee, J.J.H.; Hassimotto, N.M.A.; Lajolo, F.M. Orange juice affects acylcarnitine metabolism in healthy volunteers as revealed by a mass-spectrometry based metabolomics approach. Food Res. Int. 2018, 107, 346–352. [Google Scholar] [CrossRef] [PubMed]
  47. Rampersaud, G.C.; Valim, M.F. 100% citrus juice: Nutritional contribution, dietary benefits, and association with anthropometric measures. Crit. Rev. Food Sci. Nutr. 2017, 57, 129–140. [Google Scholar] [CrossRef] [PubMed]
  48. Del Rio, D.; Rodriguez-Mateos, A.; Spencer, J.P.E.; Tognolini, M.; Borges, G.; Crozier, A. Dietar (Poly)phenolics in Human Health: Structures, Bioavailability, and Evidence of Protective Effects Against Chronic Diseases. Antioxid. Redox Signal. 2013, 18, 1818–1892. [Google Scholar] [CrossRef] [PubMed] [Green Version]
  49. Azzini, E.E.; Venneria, E.; Ciarapica, D.; Foddai, M.S.; Intorre, F.; Zaccaria, M.; Maiani, F.; Palomba, L.; Barnaba, L.; Tubili, C. Effect of Red Orange Juice Consumption on Body Composition and Nutritional Status in Overweight/Obese Female: A Pilot Study. Oxid. Med. Cell Longev. 2017, 2017, 1672567. [Google Scholar] [CrossRef] [Green Version]
  50. Lima, A.C.D.; Cecatti, C.; Fidélix, M.P.; Adorno, M.A.T.; Sakamoto, I.K.; Cesar, T.B.; Sivieri, K. Effect of Daily Consumption of Orange Juice on the Levels of Blood Glucose, Lipids, and Gut Microbiota Metabolites: Controlled Clinical Trials. J. Med. Food 2019, 22, 202–210. [Google Scholar] [CrossRef]
  51. Constans, J.; Bennetau-Pelissero, C.; Martin, J.; Rock, E.; Mazur, A.; Bedel, A.; Morand, C.; Bérard, A.M. Marked antioxidant effect of orange juice intake and its phytomicronutrients in a preliminary randomized cross-over trial on mild hypercholesterolemic men. Clin. Nutr. 2015, 34, 1093–1100. [Google Scholar] [CrossRef]
  52. Ribeiro, C.; Dourado, G.; Cesar, T. Orange juice allied to a reduced-calorie diet results in weight loss and ameliorates obesity-related biomarkers: A randomized controlled trial. Nutrition 2017, 38, 13–19. [Google Scholar] [CrossRef]
  53. Briskey, D.; Malfa, G.A.; Rao, A. Effectiveness of “Moro” Blood Orange Citrus sinensis Osbeck (Rutaceae) Standardized Extract on Weight Loss in Overweight but Otherwise Healthy Men and Women—A Randomized Double-Blind Placebo-Controlled Study. Nutrients 2022, 14, 427. [Google Scholar] [CrossRef]
  54. Bondia-Pons, I.; Ryan, L.; Martinez, J.A. Oxidative stress and inflammation interactions in human obesity. J. Physiol. Biochem. 2012, 68, 701–711. [Google Scholar] [CrossRef]
  55. Diretrizes da Sociedade Brasileira de Diabetes (2019–2020); Editora Clannad: São Paulo, Brazil, 2019.
  56. Styskal, J.; Remmen, H.V.; Richardson, A.; Salmon, A.B. Oxidative stress and diabetes: What can we learn about insulin resistance from antioxidant mutant mouse models? Free Radic. Biol. Med. 2012, 52, 46–58. [Google Scholar] [CrossRef] [Green Version]
  57. Khan, M.K.; Zill-E-Huma; Dangles, O. A comprehensive review on flavanones, the major citrus polyphenols. J. Food Compos. Anal. 2014, 33, 85–104. [Google Scholar] [CrossRef]
  58. Ley, R.E.; Bäckhed, F.; Turnbaugh, P.; Lozupone, C.A.; Knight, R.D.; Gordon, J.I. Obesity alters gut microbial ecology. Proc. Natl. Acad. Sci. USA 2005, 102, 11070–11075. [Google Scholar] [CrossRef] [PubMed]
  59. Ribeiro, A.P.D.; Pereira, A.G.; Todo, M.C.; Fujimori, A.S.S.; Santos, P.P.; Dantas, D.; Fernandes, A.A.; Zanati, S.G.; Hassimotto, N.M.A.; Zornoff, L.A.M.; et al. Pera orange (Citrus sinensis) and Moro orange (Citrus sinensis (L.) Osbeck) juices attenuate left ventricular dysfunction and oxidative stress and improve myocardial energy metabolism in acute doxorubicin-induced cardiotoxicity in rats. Nutrition 2021, 91–92, 111350. [Google Scholar] [CrossRef]
  60. Fraga, L.N.; Milenkovic, D.; Lajolo, F.M.; Hassimotto, N.M.A. Association between Single Nucleotide Polymorphisms of SULT1A1, SULT1C4, ABCC2 and Phase II Flavanone Metabolites Excretion after Orange Juice Intake. Nutrients 2022, 14, 3770. [Google Scholar] [CrossRef] [PubMed]
  61. Dorna, M.S.; Barbosa, E.M.S.; Callegari, M.A.; Tanni, S.E.; Chiuso-Minicucci, F.; Felix, T.F.; Seneda, A.L.; Correa, C.R.; Fernandes, A.A.H.; Azevedo, P.S.; et al. Orange Juice Attenuates Circulating miR-150-5p, miR-25-3p, and miR-451a in Healthy Smokers: A Randomized Crossover Study. Front. Nutr. 2021, 8, 775515. [Google Scholar] [CrossRef]
  62. Quintanilha, B.J.; Chaves, D.F.S.; Brasili, E.; Corrêa, T.A.F.; Capetini, V.C.; Ferreira, F.M.; Castro, I.A.; Hassimotto, N.M.A.; Rogero, M.M.; Lajolo, F.M. Ingestion of orange juice prevents hyperglycemia and increases plasma miR-375 expression. Clin. Nutr. ESPEN 2022, 47, 240e24. [Google Scholar] [CrossRef]
  63. Capetini, V.C.; Quintanilha, B.J.; Oliveira, D.C.; Nishioka, A.H.; Matos, L.A.; Ferreira, L.R.P.; Ferreira, F.M.; Sampaio, G.R.; Hassimotto, N.M.A.; Lajolo, F.M.; et al. Blood orange juice intake modulates plasma and PBMC microRNA expression in overweight and insulin resistance women: Impact on MAPK and NFB signaling pathways. J. Nutr. Biochem. 2022, 109240. [Google Scholar]
  64. Stanislawski, M.A.; Dabelea, D.; Lange, L.A.; Wagner, B.D.; Lozupone, C.A. Gut microbiota phenotypes of obesity. NPJ Biofilms Microbiomes 2019, 5, 18. [Google Scholar] [CrossRef] [Green Version]
  65. Turnbaugh, P.J.; Ley, R.E.; Mahowald, M.A.; Magrini, V.; Mardis, E.R.; Gordon, J.I. An obesity-associated gut microbiome with increased capacity for energy harvest. Nature 2006, 444, 1027–1031. [Google Scholar] [CrossRef]
  66. Andoh, A.; Nishida, A.; Takahashi, K.; Inatomi, O.; Imaeda, H.; Bamba, S.; Kito, K.; Sugimoto, M.; Kobayashi, T. Comparison of the gut microbial community between obese and lean peoples using 16S gene sequencing in a Japanese population. J. Clin. Biochem. Nutr. 2016, 59, 65–70. [Google Scholar] [CrossRef] [Green Version]
  67. Jinatham, V.; Kullawong, N.; Kespechara, K.; Gentekaki, E.; Popluechai, S. Comparison of Gut Microbiota between Lean and Obese Adult Thai Individuals. Microbiol. Biotechnol. Lett. 2018, 46, 277–287. [Google Scholar] [CrossRef] [Green Version]
  68. Turnbaugh, P.J.; Hamady, M.; Yatsunenko, T.; Cantarel, B.L.; Duncan, A.; Ley, R.E.; Sogin, M.L.; Jones, W.J.; Roe, B.A.; Affourtit, J.P.; et al. A core gut microbiome in obese and lean twins. Nature 2009, 457, 480–484. [Google Scholar] [CrossRef] [PubMed] [Green Version]
  69. Rogers, A.W.L.; Tsolis, R.M.; Bäumler, A.J. Salmonella versus the Microbiome. Microbiol. Mol. Biol. Rev. 2020, 85, e00027-19. [Google Scholar] [CrossRef]
  70. Lee, J.; Tsolis, R.M.; Bäumler, A.J. The microbiome and gut homeostasis. Science 2022, 377, 6601. [Google Scholar] [CrossRef] [PubMed]
  71. Lu, J.F.; Zhu, M.Q.; Zhang, H.; Liu, H.; Xia, B.; Wang, Y.L.; Shi, X.; Peng, L.; Wu, J.W. Neohesperidin attenuates obesity by altering the composition of the gut microbiota in high-fat diet-fed mice. FASEB J. 2020, 34, 12053–12071. [Google Scholar] [CrossRef]
  72. Turnbaugh, P.J.; Ridaura, V.K.; Faith, J.J.; Rey, F.E.; Knight, R.; Gordon, J.I. The effect of diet on the human gut microbiome: A metagenomic analysis in humanized gnotobiotic mice. Sci. Transl. Med. 2009, 1, 6ra14. [Google Scholar] [CrossRef] [Green Version]
  73. Azad, M.B.; Bridgman, S.L.; Becker, A.B.; Kozyrskyj, A.L. Infant antibiotic exposure and the development of childhood overweight and central adiposity. Int. J. Obes. 2014, 38, 1290–1298. [Google Scholar] [CrossRef]
  74. Azad, M.B.; Konya, T.; Persaud, R.R.; Guttman, D.S.; Chari, R.S.; Field, C.J.; Sears, M.R.; Mandhane, P.J.; Turvey, S.E.; Subbarao, P. Impact of maternal intrapartum antibiotics, method of birth and breastfeeding on gut microbiota during the first year of life: A prospective cohort study. BJOG 2016, 123, 983–993. [Google Scholar] [CrossRef]
  75. Ottosson, F.F.; Brunkwall, L.; Ericson, U.; Nilsson, P.M.; Almgren, P.; Fernandez, C.; Melander, O.; Orho-Melander, M. Connection Between BMI-Related Plasma Metabolite Profile and Gut Microbiota. J. Clin. Endocrinol. Metab. 2018, 103, 1491–1501. [Google Scholar] [CrossRef] [Green Version]
  76. Vazquez-Moreno, M.; Perez-Herrera, A.; Locia-Morales, D.; Dizzel, S.; Meyre, D.; Stearns, J.C.; Cruz, M. Association of gut microbiome with fasting triglycerides, fasting insulin and obesity status in Mexican children. Pediatr. Obes. 2021, 16, e12748. [Google Scholar] [CrossRef]
  77. Companys, J.; Gosalbes, M.J.; Pla-Pagà, L.; Calderón-Pérez, L.; Llauradó, E.; Pedret, A.; Valls, R.M.; Jiménez-Hernández, N.; Sandoval-Ramirez, B.A.; Del Bas, J.M.; et al. Gut Microbiota Profile and Its Association with Clinical Variables and Dietary Intake in Overweight/Obese and Lean Subjects: A Cross-Sectional Study. Nutrients 2021, 13, 2032. [Google Scholar] [CrossRef] [PubMed]
  78. Zeng, Q.; Li, D.; He, Y.; Li, Y.; Yang, Z.; Zhao, X.; Liu, Y.; Wang, Y.; Sun, J.; Feng, X.; et al. Discrepant gut microbiota markers for the classification of obesity-related metabolic abnormalities. Sci. Rep. 2019, 9, 13424. [Google Scholar] [CrossRef] [PubMed] [Green Version]
  79. Huang, K.; Yu, W.; Li, S.; Guan, X.; Liu, J.; Song, H.; Liu, D.; Duan, R. Effect of embryo-remaining oat rice on the lipid profile and intestinal microbiota in high-fat diet fed rats. Food Res. Int. 2020, 129, 108816. [Google Scholar] [CrossRef] [PubMed]
  80. Braune, A.; Blaut, M. Bacterial species involved in the conversion of dietary flavonoids in the human gut. Gut Microbes 2016, 7, 216–234. [Google Scholar] [CrossRef] [PubMed] [Green Version]
  81. Liu, W.; Zhao, S.; Wang, J.; Shi, J.; Sun, Y.; Wang, W.; Ning, G.; Hong, J.; Liu, R. Grape seed proanthocyanidin extract ameliorates inflammation and adiposity by modulating gut microbiota in high-fat diet mice. Mol. Nutr. Food Res. 2017, 61, 1601082. [Google Scholar] [CrossRef]
  82. Mayta-Apaza, A.C.; Pottgen, E.; Bodt, J.D.; Papp, N.; Marasini, D.; Howard, L.; Abranko, L.; Wiele, T.V.; Lee, S.O.; Carbonero, F. Impact of tart cherries polyphenols on the human gut microbiota and phenolic metabolites in vitro and in vivo. J. Nutr. Biochem. 2018, 59, 160–172. [Google Scholar] [CrossRef] [PubMed]
  83. Petersen, C.; Wankhade, U.D.; Bharat, D.; Wong, K.; Mueller, J.E.; Chintapalli, S.V.; Piccolo, B.D.; Jalili, T.; Jia, Z.; Symons, J.D.; et al. Dietary supplementation with strawberry induces marked changes in the composition and functional potential of the gut microbiome in diabetic mice. J. Nutr. Biochem. 2019, 66, 63–69. [Google Scholar] [CrossRef]
  84. Mas-Capdevila, A.; Teichenne, J.; Domenech-Coca, C.; Caimari, A.; Del Bas, J.M.; Escoté, X.; Crescenti, A. Effect of Hesperidin on Cardiovascular Disease Risk Factors: The Role of Intestinal Microbiota on Hesperidin Bioavailability. Nutrients 2020, 12, 1488. [Google Scholar] [CrossRef]
  85. Dueñas, M.; Muñoz-González, I.; Cueva, C.; Jiménez-Girón, A.; Sánchez-Patán, F.; Santos-Buelga, C.; Moreno-Arribas, M.V.; Bartolomé, B. A Survey of Modulation of Gut Microbiota by Dietary Polyphenols. Biomed Res. Int. 2015, 850902, 1–16. [Google Scholar] [CrossRef] [Green Version]
  86. Singh, R.K.; Chang, H.; Yan, D.; Lee, K.M.; Ucmak, D.; Wong, K.; Abrouk, M.; Farahnik, B.; Nakamura, M.; Zhu, T.H.; et al. Influence of diet on the gut microbiome and implications for human health. J. Transl. Med. 2017, 15, 73. [Google Scholar] [CrossRef] [Green Version]
  87. Gentile, C.L.; Weir, T.L. The gut microbiota at the intersection of diet and human health. Science 2018, 362, 776–780. [Google Scholar] [CrossRef] [PubMed] [Green Version]
  88. Association of Official Analytical Chemists (AOAC). Official Methods of Analysis, 16th ed.; AOAC International: Arlington, TX, USA, 1995. [Google Scholar]
  89. Brasili, E.; Chaves, D.F.; Xavier, A.A.; Mercadante, A.Z.; Hassimotto, N.M.A.; Lajolo, F.M. Effect of Pasteurization on Flavonoids and Carotenoids in Citrus sinensis (L.) Osbeck cv. ‘Cara Cara’ and ‘Bahia’ Juices. J. Agric. Food Chem. 2017, 65, 1371–1377. [Google Scholar] [CrossRef] [PubMed]
  90. Hillebrand, S.; Schwarz, M.; Winterhalter, P. Characterization of Anthocyanins and Pyranoanthocyanins from Blood Orange [Citrus sinensis (L.) Osbeck] Juice. J. Agric. Food Chem. 2004, 52, 7331–7338. [Google Scholar] [CrossRef] [PubMed]
  91. Shiga, T.; Soares, C.A.; Nascimento, J.R.O.; Purgatto, E.; Lajolo, F.M.; Cordenunsi, B.R. Ripening-associated changes in the amounts of starch and non-starch polysaccharides and their contributions to fruit softening in three banana cultivars. J. Sci. Food Agric. 2011, 91, 1511–1516. [Google Scholar] [CrossRef]
  92. Singleton, V.L.; Rossi, J.A. Colorimetry of total phenolics with phosphomolybdic-phosphotungstic acid reagents. Am. J. Enol. Vitic. 1965, 16, 144–158. [Google Scholar]
  93. Stella, S.P.; Ferrarezi, A.C.; Santos, K.O.; Monteiro, M. Antioxidant activity of commercial ready-to-drink orange juice and nectar. J. Food Sci. 2011, 76, 392–397. [Google Scholar] [CrossRef]
Figure 1. Discriminant analysis by partial least squares (PLS-DA) and VIP score plot (for the top 15 most important variables) of anthropometric and biochemical parameters, and inflammatory and oxidative stress biomarkers after the intake of Pera (A) and Moro (B) orange juices in patients with class I, II, or II of obesity (sample sizes in MOJ intervention: obesity class I, n = 12; obesity class II, n = 5; obesity class III, n = 6). 8-OHdG: 8-hydroxy-2′-deoxyguanosine; BMI: body mass index; GPx: glutathione peroxidase; HDL: high-density lipoprotein; IL: interleukin; LDL: low-density lipoprotein; MCP-1: monocyte chemoattractant protein-1; ORAC: oxygen radical absorbance capacity; SOD: superoxide dismutase; TNF-α: tumor necrosis factor alpha; VLDL: very-low-density lipoprotein.
Obesities 02 00033 g001
Figure 2. Effect of Pera (POJ) and Moro orange juice (MOJ) intake on the gut microbiota OTUs (phylum) and on the Firmicutes/Bacteroidetes (F/B) ratio. Delta of the relative abundance of the most abundant bacterial phyla when patients are grouped by (A) intervention and (B) obesity class. (C) Boxplot showing F/B ratio of the individuals in obesity classes I, II, or III before (T0) and after (T16) POJ and MOJ intake. For clarity, phyla with an overall abundance of less than 0.5% were summed into “others”. Different superscript letters indicate statistical significance (p < 0.05) between obesity classes (Kruskal–Wallis test) or between T0 and T16 (Wilcoxon test) (sample sizes in POJ intervention: obesity class I, n = 9; obesity class II, n = 3; obesity class III, n = 3; sample sizes in MOJ intervention: obesity class I, n = 8; obesity class II, n = 5; obesity class III, n = 5).
Obesities 02 00033 g002
Figure 3. Differential abundance of the top 25 most significant bacterial genera in fecal samples of patients before (T0) and after (T16) the intake of Pera (POJ) and Moro orange juice (MOJ). (A) Heatmap showing the gut microbiota genera that were differentially abundant among obesity classes. Rows (genera) and columns (samples) were ordered by hierarchical clustering. (B,C) Stacked bar plot showing the relative abundance of microbial genera uncovered in each sample, sorted by obesity class, before (T0) and after (T16) POJ (B) or MOJ (C) intake. For clarity, genera with an overall abundance of less than 0.5% were summed into “others” (sample sizes in POJ intervention: obesity class I, n = 9; obesity class II, n = 3; obesity class III, n = 3; sample sizes in MOJ intervention: obesity class I, n = 8; obesity class II, n = 5; obesity class III, n = 5).
Obesities 02 00033 g003
Figure 4. Spearman’s correlation among excreted flavanone metabolites, most abundant genera in the gut microbiota, anthropometric variables, biochemical parameters, and inflammatory and oxidative stress biomarkers analyzed before and after the intake of Pera (A) and Moro (B) orange juices. 8-OHdG: 8-hydroxy-2′-deoxyguanosine; BMI: body mass index; HDL: high-density lipoprotein; IL: interleukin; LDL: low-density lipoprotein; MCP-1: monocyte chemoattractant protein-1; ORAC: oxygen radical absorbance capacity; OTU: operational taxonomic unit; TNF-α: tumor necrosis factor alpha; VLDL: very-low-density lipoprotein. OTU IDs are from Table S11.
Obesities 02 00033 g004
Figure 5. Schematic summary of the main findings of the study.
Obesities 02 00033 g005
Table 1. Baseline parameters of participants (n = 23).
Baseline
Parameters
Obesity Reference Values
Class I
(n = 12)
Class II
(n = 5)
Class III
(n = 6)
IdealPrediabetes
Body weight (kg)94.52 ± 2.7287.48 ± 3.3899.78 ± 2.59104.22 ± 5.15--
BMI (kg·m−2)36.69 ± 1.2632.36 ± 0.3837.29 ± 0.8044.85 ± 2.19--
Fasting glucose (mg·dL−1)100.96 ± 2.35103.08 ± 3.6698.00 ± 3.4999.17 ± 4.71<99 *100 to 125 *
Fasting insulin (µIU·mL−1)16.43 ± 0.8215.55 ± 1.1215.82 ± 1.6418.68 ± 1.621.9 to 23 *-
HbA1c (%)5.96 ± 0.075.98 ± 0.065.94 ± 0.285.93 ± 0.15<5.7 *5.7 to 6.4 *
HOMA-IR4.05 ± 0.193.93 ± 0.273.79 ± 0.354.52 ± 0.37≤2.71 [26]>2.71 [26]
BMI: body mass index; HbA1c: glycated hemoglobin; HOMA-IR: Homeostasis Model Assessment for Insulin Resistance. Values are expressed as the mean ± standard error. * Reference values used by the laboratory of clinical analyses of the Dante Pazzanese Institute of Cardiology.
Table 2. Anthropometric variables, biochemical parameters, and intestinal permeability markers of the participants before (T0) and after (T16) Pera and Moro orange juice intake.
POJMOJ
T0T16p-ValueT0T16p-Value
Body weight (kg)94.48 ± 2.6994.43 ± 2.710.60393.74 ± 2.6593.61 ± 2.700.503
Abdominal circumference (cm)115.36 ± 24.07115.22 ± 23.970.594114.46 ± 23.84113.37 ± 23.660.887
BMI (kg·m−2)36.66 ± 7.6536.63 ± 7.600.66136.37 ± 7.5836.30 ± 7.660.456
Class I obesity (n = 12)32.48 ± 0.4032.54 ± 0.360.36732.28 ± 0.3332.21 ± 0.340.638
Class II obesity (n = 5)37.35 ± 0.8336.95 ± 0.980.27336.51 ± 1.1136.61 ± 1.260.686
Class III obesity (n = 6)44.46 ± 2.3344.54 ± 2.180.60044.41 ± 1.8444.21 ± 1.730.249
Blood pressure (mmHg)
Systolic132.43 ± 27.64125.78 ± 26.310.083129.17 ± 27.03126.30 ± 26.380.403
Diastolic82.30 ± 17.1479.74 ± 16.740.14481.35 ± 16.8279.43 ± 16.760.700
Cholesterol (mg·dL−1)
HDL45.91 ± 9.43 a43.26 ± 9.15 b0.04547.78 ± 10.02 a45.70 ± 9.67 b0.042
LDL107.87 ± 22.45105.35 ± 23.120.260115.83 ± 23.29110.00 ± 23.690.136
VLDL30.09 ± 6.1928.52 ± 6.100.50132.57 ± 6.5230.17 ± 6.400.253
Total184.17 ± 38.13177.39 ± 38.420.119197.61 ± 40.12 a184.57 ± 39.49 b0.012
Triglycerides (mg·dL−1)151.26 ± 31.11142.39 ± 30.440.426174.04 ± 34.97151.00 ± 32.130.457
Blood glucose (mg·dL−1)94.61 ± 19.4594.52 ± 19.960.89696.83 ± 20.2197.13 ± 20.190.807
POJ: Pera orange juice; MOJ: Moro orange juice; BMI: body mass index; HDL: high-density lipoprotein; LDL: low-density lipoprotein; VLDL: very-low-density lipoprotein. The p-values were calculated using the Wilcoxon test. Values in bold and different superscript letters indicate statistical significance (p < 0.05) between participant groups (n = 23) for each parameter (mean ± standard error).
Table 3. Inflammatory and oxidative stress biomarkers of the participants before (T0) and after (T16) Pera and Moro orange juice intake.
POJ MOJ
T0T16p-ValueT0T16p-Value
Inflammatory biomarkers
IL-6 (pg·mL−1)5.28 ± 1.104.88 ± 1.180.3495.76 ± 1.213.79 ± 0.930.179
IL-10 (pg·mL−1)1.02 ± 0.221.28 ± 0.300.3491.26 ± 0.281.28 ± 0.290.501
TNF-α (pg·mL−1)95.50 ± 26.57163.86 ± 43.110.068148.83 ± 33.21146.22 ± 36.890.619
IL-8 (pg·mL−1)652.26 ± 146.08650.84 ± 155.010.747733.76 ± 157.15a604.62 ± 137.97b0.025
IL-1β (pg·mL−1)253.60 ± 63.60235.53 ± 64.600.433251.35 ± 53.63209.10 ± 53.950.074
MCP-1 (pg·mL−1)5571.72 ± 1336.213603.72 ± 1286.960.23110787.93 ± 3501.453746.00 ± 766.010.391
Oxidative stress biomarkers
Plasma
ORAC (µM eq Trolox·mL−1)2.45 ± 0.54b2.77 ± 0.55a0.0063.02 ± 0.633.03 ± 0.620.910
GPx (U·mg−1)0.93 ± 0.170.74 ± 0.200.2631.10 ± 0.20a0.75 ± 0.17b0.023
SOD (U·mg−1)2.48 ± 0.613.10 ± 0.700.2763.68 ± 0.723.39 ± 0.700.360
Urine
8-isoprostane (pg·mg−1)2.59 ± 0.582.02 ± 0.480.8482.59 ± 0.552.46 ± 0.490.831
8-OHdG (ng·mg−1)1.63 ± 0.32a0.47 ± 0.12b<0.0011.21 ± 0.23a0.55 ± 0.14b<0.001
IL: interleukin; TNF-α: tumor necrosis factor alpha; MCP-1: monocyte chemoattractant protein-1; ORAC: oxygen radical absorbance capacity; GPx: glutathione peroxidase; SOD: superoxide dismutase; 8-OHdG: 8-hydroxy-2′-deoxyguanosine. The p-values were calculated using the Wilcoxon test. Values in bold and different superscript letters indicate statistical significance (p < 0.05) between participant groups (n = 23) for each biomarker (mean ± standard error).
Table 4. Relative abundance of significant gut microbiota phyla and Firmicutes/Bacteroidetes ratio in participants before orange juice intake (basal profile).
GlobalClass I ObesityClass II ObesityClass III Obesityp-Value
Firmicutes87.43 ± 1.5186.09 ± 1.7891.89 ± 2.6786.32 ± 4.290.233
Bacteroidetes4.51 ± 1.015.58 ± 1.424.49 ± 2.671.86 ± 0.600.203
F/B50.28 ± 13.5239.16 ± 19.3855.49 ± 25.1272.86 ± 30.560.203
Actinobacteria6.51 ± 1.376.16 ± 1.462.56 ± 0.8311.34 ± 4.260.253
Proteobacteria0.45 ± 0.080.54 ± 0.130.38 ± 0.170.29 ± 0.100.557
Verrucomicrobia0.63 ± 0.230.64 ± 0.220.80 ± 0.760.08 ± 0.000.307
Tenericutes0.37 ± 0.130.40 ± 0.15N.D.0.21 ± 0.09-
Others0.47 ± 0.300.78 ± 0.540.09 ± 0.050.07 ± 0.050.133
F/B: Firmicutes/Bacteroidetes; N.D.: not detected. Values are expressed as the mean ± standard error. The p-values were calculated using the Kruskal–Wallis test.
Publisher’s Note: MDPI stays neutral with regard to jurisdictional claims in published maps and institutional affiliations.

