Article

Triglyceride-to-High-Density-Lipoprotein-Cholesterol Ratio as a Predictor of Metabolic Syndrome According to Stage of Life at Obesity Onset in Women with Severe Obesity—A Pilot Study

by
Nayra Figueiredo
1,2,
Marcela de Oliveira Queiroz
1,
Karem Lays Soares Lopes
1,
Luciana Oliveira
3,
Ana Raimunda Dâmaso
4,
Paulo Reis Esselin de Melo
5,
Valéria de Souza Abreu
5,
João Felipe Mota
1,
Maria Aderuza Horst
1,* and
Flávia Campos Corgosinho
1,2,*
1
Faculty of Nutrition, Federal University of Goias, Goiania 74605-080, Brazil
2
Faculty of Medicine, Federal University of Goias, Goiania 74605-080, Brazil
3
Department of Health Science, Federal University of Uberlandia, Uberlandia 38400-902, Brazil
4
Paulista Medicine School, Federal University of São Paulo, Sao Paulo 04023-062, Brazil
5
Alberto Hassi Hospital, Goiania 74110-010, Brazil
*
Authors to whom correspondence should be addressed.
Obesities 2022, 2(4), 361-371; https://doi.org/10.3390/obesities2040030
Submission received: 22 September 2022 / Revised: 24 October 2022 / Accepted: 7 November 2022 / Published: 10 November 2022

Abstract

:
The triglyceride-to-high-density lipoprotein-cholesterol (TG/HDL-c) ratio is a simple but effective indicator of metabolic imbalance that characterizes metabolic syndrome (MetS) and can consequently indicate a higher cardiovascular risk. It may, therefore, be useful in identifying a high risk for cardiometabolic diseases according to the onset of obesity. The aim of this study was to evaluate the association between MetS and the stage of life at obesity onset and to establish the cutoff point for the TG/HDL-c ratio as a marker of MetS in women with severe obesity. Forty-seven women who were to undergo bariatric surgery were evaluated. Anthropometric and metabolic parameters were measured, and the TG/HDL-c ratio was calculated. The volunteers were grouped according to their stage of life at obesity onset. A receiver operating characteristic (ROC) curve was constructed to define cutoff points for the TG/HDL-c ratio as predictors of MetS. Women who developed obesity early (during infancy/adolescence) had higher weight (p = 0.008), body mass index (p = 0.031), and hip circumference (p = 0.036) than those who developed obesity later (in adulthood); however, no association was found between obesity onset and MetS. The cutoff points for the TG/HDL-c ratio that were established for those who developed early or late obesity were 2.30 and 2.19, respectively. Although the stage of life at the onset of obesity was not related to MetS, different cutoff points for the TG/HDL-c ratio were observed.

1. Introduction

Metabolic syndrome (MetS) is a set of metabolic dysregulations that includes visceral obesity, insulin resistance (IR), systemic arterial hypertension, and dyslipidemia. This set of factors is associated with the development of type 2 diabetes mellitus (DM2), acceleration of atherosclerosis, and increased cardiovascular risk [1]. A positive family history of MetS, unhealthy eating habits, physical inactivity, smoking, and being overweight in childhood are risk factors for MetS in adulthood [2]. However, it is still unknown whether childhood obesity provides an independent risk for an individual’s level of adiposity in adulthood, or whether weight loss abolishes the metabolic disease risks associated with early obesity [3].
The criteria for the diagnosis of MetS include the presence of central obesity, hypertension, hyperglycemia, and dyslipidemia [4]. Considering that IR is an indisputable risk factor for MetS, the identification of another predictive marker for IR can be useful for screening individuals at risk of developing MetS [5]. The triglyceride-to-high-density lipoprotein cholesterol (TG/HDL-c) ratio is a practical and easy-to-apply test in clinical practice, and different studies have highlighted this ratio as a simple and effective measure for IR identification [6,7,8,9,10,11] and for the risk of cardiovascular events in the general population [12]. The TG/HDL-c ratio was able to identify metabolic abnormalities in eutrophic women [6], IR in individuals with DM1, and be a predictor of DM2 in a cohort of African Americans and Hispanics [8], as well as a predictor of MetS in the elderly Chinese population, highlighting the possibility of its application in different health conditions and ethnicities [9]. However, to date, no study has evaluated the TG/HDL-c ratio as a predictor of MetS in adults with severe obesity.
The TG/HDL-c ratio has also been suggested for use in recognizing MetS in children and adolescents with severe obesity [10,11]. As highlighted by Radetti et al. (2022) [10], the cutoff for the TG/HDL-c ratio as a predictor of MetS can change over the years, which reinforces the importance of studies evaluating this ratio with the MetS outcome in different age groups. This has raised questions about the relationship between the age of obesity onset and the TG/HDL-c ratio as a risk factor for MetS. We hypothesized that the stage of life at obesity onset has an impact on metabolic health, and that the TG/HDL-c ratio is a possible marker for identifying MetS. Thus, this study first aimed to evaluate the association between MetS and the stage of life at obesity onset. Second, the study aimed to establish the TG/HDL-c ratio as a marker of MetS in women with severe obesity who were to undergo bariatric surgery, considering the early and late onset of obesity. Although we did not find an association between MetS and the stage of life at obesity onset, we identified the TG/HDL-c ratio as a possible predictor of MetS, and we suggest different cutoff points for the early or late onset of obesity.

2. Materials and Methods

2.1. Participants

This cross-sectional and analytical pilot study was approved by the Research Ethics Committee of the Federal University of Goiás and the State Hospital of Goiânia, Dr. Alberto Rassi (nº 961/19). Based on the study by Chen et al. (2015) [9], the TG/HDL-c ratio was considered the primary outcome. Accordingly, the sample size was calculated using the G Power software, version 3.1, with the following parameters: independent t-test, α = 0.05, power (1 − β) = 0.80, and effect size (d) = 0.77 [9], resulting in an estimated sample size of 56 participants. Recruitment had to stop due to the COVID-19 pandemic, so the total number of voluntaries included was 47. Thus, we performed the sampling power for 47 volunteers, and it was 85%.
The recruitment period was between July and December 2019, and the exclusion criteria were as follows: having acute inflammatory diseases, infectious diseases, neoplastic diseases, or genetic syndromes; alcohol consumption (>30 g/day) [13]; and using illicit drugs.
The hospital’s nursing team provided a list of patients who were eligible for bariatric surgery, and a trained and authorized member of the research group was present at the first outpatient appointment to invite women with a body mass index (BMI) ≥ 40 kg/m2, aged 20 to 59 years, to participate in the study. Accordingly, 47 women were included in this study.

2.2. Study Design

Biochemical tests were scheduled for the same day as that of the registered dietitian consultation. Volunteers were instructed to fast and meet with one of the researchers at the hospital to be taken to the laboratory. In the laboratory, after blood collection, a trained member of the research team collected basic information such as age, sex, income, education, medication, and the stage of life at which obesity was first observed and performed anthropometric assessments.

2.3. Measurements

2.3.1. Anthropometric Measurements

The measures used to obtain the anthropometric assessment were weight, height, and waist and hip circumferences (WC and HC, respectively). To measure the weight, the volunteers wore light clothes without shoes and were positioned at the center of a scale (Tanita-UM 080 Digital; maximum weight, 150 kg). To measure the height, an inextensible measuring tape was used on a wall upon which the volunteers touched the back of their neck, buttocks, and heels. The volunteers were instructed to be in an upright position, barefoot, and with arms extended along the body [14].
The WC was measured with the volunteers standing, after expiration, at the midpoint between the last rib and iliac crest [14]. The HC was obtained from the largest identified diameter [14]. All measurements were taken twice by the same trained researcher to obtain an average value, using an inextensible tape with 0.1 cm precision. BMI was obtained by dividing the weight (kg) by height squared (m2) and was classified according to the World Health Organization criteria [14].

2.3.2. Blood Analysis

The women who agreed to participate in the study underwent the following tests: fasting blood glucose, insulin, lipid profile (LDL-c, HDL-c, total cholesterol, triglycerides), and glycated hemoglobin (HBA1c). Blood samples were drawn through peripheral vein puncture of the forearm after a 12 h overnight fast by qualified nurses. Insulin resistance was determined based on the homeostasis model assessment for insulin resistance (HOMA-IR), by calculating the fasting glucose and immunoreactive insulin values, and using the following formula: [fasting glucose (mg/dL) × immunoreactive insulin (mU/L)]/405 [15]. The reference value for HOMA-IR was: <3.60 [16]. The blood pressure values were obtained from the last medical record.
For the TG/HDL-c ratio, the volunteers were classified using the reference value for IR (>3.0) because of the absence of the value for MetS, as in the study carried out by Borrayo et al. (2018) [6]. For the analysis of the stage of life at which obesity began, the stages of life were classified as early (≤18 years) or late (>18 years) [17]. The participants were asked how old they were when they started to gain excessive weight, and if they did not remember, they were asked at what stage of life, whether in childhood or adulthood.

2.4. MetS Classification

Patients were identified with MetS using the criteria recommended by the International Diabetes Federation (2006) [4]. The criteria are a high WC (>80 cm) associated with two or more additional factors. The other factors include the diagnosis of diabetes or altered fasting glucose (>100 mg/dL), undergoing treatment for systemic arterial hypertension or having systolic blood pressure ≥ 130 mmHg and/or diastolic blood pressure ≥ 85 mmHg, and undergoing treatment for dyslipidemia or having a triglyceride level > 150 mg/dL or HDL-c level < 50 mg/dL.

2.5. Statistical Analysis

The statistical analysis was performed using IBM SPSS Statistics for Windows, version 24.0 (IBM Co., Armonk, NY, USA). Continuous variables are presented as the mean ± standard deviation. Continuous data are presented as absolute frequencies and percentages (%). A Chi-square or Fisher’s exact test was used to compare the categorical variables. Data distribution was assessed using the Kolmogorov–Smirnov test. Data that did not follow the normality curve were standardized using a Z-score. The odds ratio was calculated based on the variables of the stage of life at the beginning of obesity development and the presence of MetS.
The receiver operating characteristic (ROC) curve was explored and constructed to compare the anthropometric and metabolic parameters with the TG/HDL-c ratio and to establish cutoff points for the TG/HDL-c fraction as predictors of MetS, according to the life stage of obesity onset. After establishing the cutoff point of the fraction, sensitivity was defined as the probability of fraction measurements that correctly classified individuals with MetS (true positives). Specificity was defined as the probability of fraction measurements to correctly classify participants who did not have OSA (true negatives).
The area under the ROC curve (AUC) was used as a global measure of the general precision of the fraction as a predictor of MetS, in which an area of 1 corresponds to 100% sensitivity and 100% specificity, and, therefore, represents a perfect test to discriminate individuals. Accordingly, the AUC was classified into the following categories: no discrimination, acceptable, excellent, and outstanding discrimination with values of 0.5, greater than 0.6 and less than 0.7, greater than 0.7 and less than 0.8, greater than 0.8 and less than 0.9, and greater than 0.9, respectively [18]. The shortest distance on the ROC curve was calculated using the function √ (1—sensitivity2) + (1—specificity2) [19].
The effect sizes were calculated using Cohen’s d formula and classified as small (d = 0.2), medium (d = 0.5), or large (d = 0.8). Statistical significance was set at α ≤ 0.05.

3. Results

The average age and BMI of the included women were 40 years and 48.38 kg/m2, respectively. The prevalence of MetS in the analyzed samples was 76.59% (n = 36). The MetS parameters that were most altered, in addition to BMI and WC (prevalence, 100%), were high systolic blood pressure (82.2%) and reduced HDL-c levels (66%). The prevalence of altered glucose and triglyceride levels and diastolic blood pressure was similar, as shown in Table 1. The prevalence of the reported diseases was 25.5% for DM2 and 59.6% for systemic arterial hypertension.

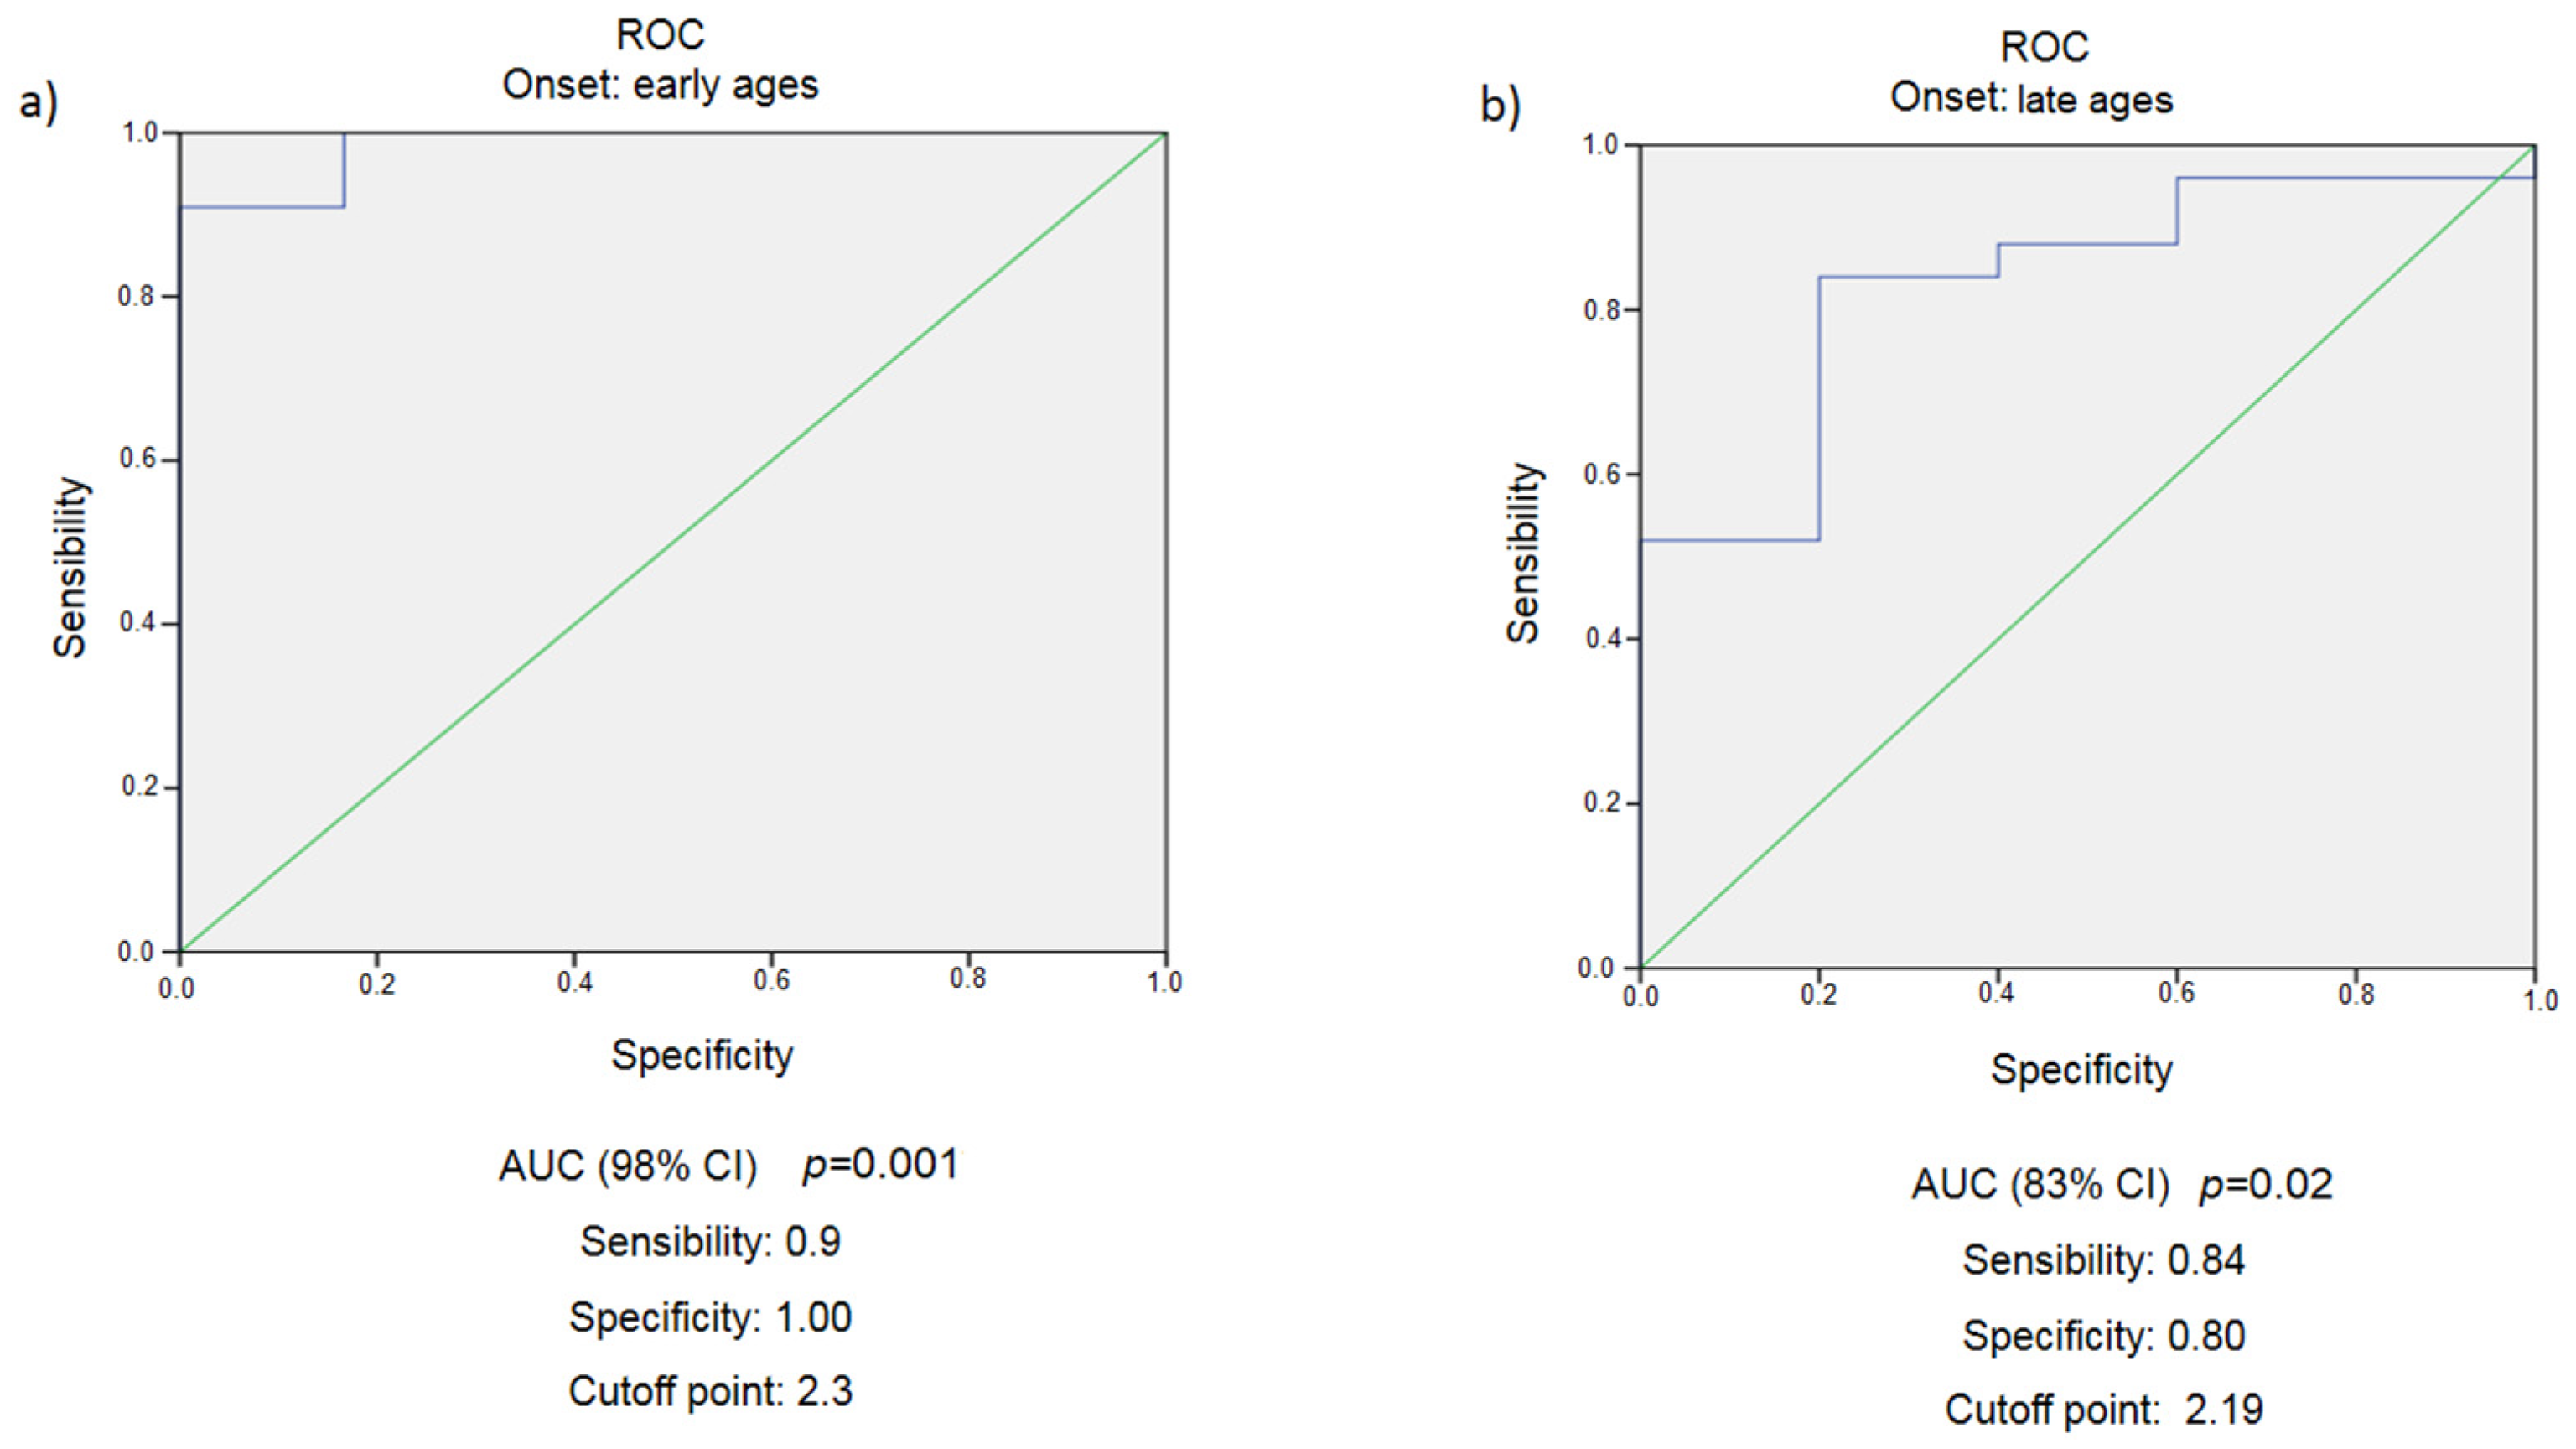
3.1. Early Age Obesity Development (<18 Years)

Table 2 shows that a majority of the sample (63.83% (n = 30)) reported having developed obesity in adulthood, and only 36.17% reported developing it at an early age. Women who developed obesity early had a mean weight of 131.17 kg and a mean BMI of 51.16 kg/m2, characterizing severe obesity. As expected, the WC and HC values were above the cutoff points, presenting mean values of 135.40 cm and 150.66 cm, respectively. All lipid profiles were altered except for the TG. The mean TG obtained was 137.12 mg/dL, while the HDL-c value was below the recommended value at 48.41 mg/dL. Thus, the mean value obtained from the TG/HDL-c ratio was 3.12.
Regarding the glycemic profile, the average blood glucose level was above the reference values [4]; the patients presented with hyperinsulinemia, and thus, with altered HOMA-IR and QUICKI, indicating insulin resistance and a low tolerance to glucose. Finally, the volunteers presented with high mean SBP and DBP. All the variables are presented in Table 2.

3.2. Late Age Obesity Development (>18 Years)

Women who developed obesity in adulthood also had severe obesity despite lower anthropometric measurements compared to the previous group. The mean weight and BMI obtained were 117.15 kg and 46.81 kg/m2, respectively. Likewise, the WC (128.39 cm) and HC (142.17 cm) were both above the cutoff point. All metabolic parameters exhibited altered values, as shown in Table 2.
The volunteers presented with a suggestive state of insulin resistance with low glucose tolerance, as verified by the HOMA-IR and QUICKI values (Table 2), due to elevated blood glucose and insulin values. The SBP, DBP, and TG levels were slightly altered, whereas the HDL-c level was below the recommended level. The TG/HDL-c ratio obtained from these values was 3.43.

3.3. Difference between Groups

Women who developed obesity early had higher averages for weight (p = 0.008), BMI (p = 0.031), and HC (p = 0.036) than those who developed late obesity, as shown in Table 2. Compared to the reference values, both groups showed high concentrations of glucose, high HOMA-IR, and low levels of HDL-c; however, there was no difference between them. The TG levels were only altered in the late obesity group. Although HBA1c levels did not show a significant difference between the groups (p = 0.513), the effect size was considered large (d = 2.077).
No difference was found in the incidence of MetS between women who developed obesity in adulthood (69.45%, n = 25) and those who had obesity onset at an early age (30.55%, n = 11). Similarly, when analyzing the presence of altered MetS parameters and obesity onset, there was no statistically significant difference (Fisher’s exact test, p = 0.11) (Table 3).
As expected, the MetS group reached higher values for HOMA-IR (7.63 vs. 5.19), TG (162.31 mg/dL vs. 92.64 mg/dL), and the TG/HDL-c ratio (3.87 vs. 1.8) when compared to the “Without MetS” group (p < 0.05) (Table S1, Supplementary Material). In addition, higher levels of HDL-c were found in the “Without MetS” group with a statistically significant difference (p = 0.02).
Individuals who developed obesity in adulthood showed no difference in the TG/HDL-c ratio when evaluated by the presence or absence of MetS (p = 0.08) and adjusted for DM (p = 0,234). Likewise, for those who developed obesity at an early stage of life (≤18 years), the TG/HDL-c ratio showed a difference (p = 0.009), even after adjusting for DM2, between the groups with and without Mets (p = 0.018) (Table S2, supplementary material). The TG/HDL-c ratio was associated with the presence of MetS but not with the obesity onset period. On the other hand, when calculating the odds ratio, it was found that women who developed obesity at an early age and with MetS were 2.5 (1.17–5.34) times more likely to have the TG/HDL-c ratio altered than women who developed obesity at a late age, with or without MetS.
The AUC was calculated based on the period during which the women experienced weight gain. The TG/HDL-c ratio was the best predictor of Mets when compared with other anthropometric parameters, such as BMI, WHR, WtHR, and when compared with other lipids ratios: LDL-c/HDL-c and TC/HDL-c (Figure S2, supplementary material). The AUC TG/HDL-c ratio values for the early and late ages of obesity onset were 0.98 (0.93–1.00; p = 0.001) and 0.83 (0.65–1.00; p = 0.02), respectively, signaling this fraction as a predictive marker of MetS. In this way, it was possible to obtain the cutoff point of the fraction for those with early and late development: 2.30 and 2.19, respectively. Figure 1 shows the cutoff points for each group.

4. Discussion

The present study is the first to successfully identify the cutoff points for the TG/HDL-c ratio (2.30 and 2.19), in order to predict MetS in women with severe obesity who developed early or late obesity, respectively. Although there was no association between the phase of life at which obesity was developed and the presence of MetS, we identified the TG/HDL-c ratio as a simple and promising parameter for identifying the risk of MetS in women with severe obesity. The AUC values obtained (0.84 and 0.9) were similar to those found in studies with adolescents from Korea and adults from Iran, China, and a multiethnic sample, which were, respectively, 0.932, 0.85, 0.815, and 0.872 [10,17,20,21].
As hypothesized by Chu et al. (2019) [17], the findings may be highly precise because the study considers two criteria for the diagnosis of MetS. Although the ratio varies according to ethnicity, studies in different countries have obtained positive results when evaluating TG/HDL-c ratio as a predictor, but with different cutoff points. A study of adolescents from Korea [17] and another with adults from a multi-ethnic sample in Canada [21], both with the objective of evaluating the usefulness of lipid ratios to identify individuals with MetS, showed that the TG/HDL-c ratio exhibited a higher AUC value than the other lipid ratios. They determined cutoffs points of 3.3 for young people [17] and 1.18 for adult women who were overweight (BMI 27.3 ± 5.3) [21]. Our results show that for women with severe obesity (BMI ≥ 40 kg/m2), the cutoff point for the TG/HDL-c ratio as a predictor of MetS is higher than adult women who are overweight (BMI < 30), but lower than the cutoff point for adolescents. These results highlight the need to establish reference values for different ages and BMIs.
In the study by Chen et al. (2015) [9], with the aim of identifying the best predictor of MetS, the authors compared the predictive capacity of different anthropometric and atherogenic parameters such as BMI, WHR, body adiposity index, and TG/HDL-c ratio. They found that, in women, the TG/HDL-c ratio had the best AUC value and set the count point to 1.22. Similar results have been reported in a population susceptible to diabetes. The TG/HDL-c ratio showed a higher AUC value than the traditional parameters used to assess the risk of MetS, suggesting that it is an effective biological indicator, especially in women with DM2. The established cutoff point was 0.99 [22].
The cited studies identified the TG/HDL-c ratio as the best predictor, which highlights the potential of the data found in clinical practice [17,20,21,22,23]. It is important to note that only a limited number of studies have used this ratio as an indicator of MetS [10,17,21,22] and, to the best of our knowledge, there are no studies with women with severe obesity (BMI ≥ 40 kg/m2), neither suggesting the different cutoff points according to the life stage of obesity onset. What emphasizes the importance of our findings is that this is the first study to investigate women with a BMI above 40 kg/m2. Thus, this fraction, along with conventional criteria, may aid in the identification of patients with the syndrome, as it is a simple calculation of measures that are already performed in clinical practice, making it accessible and easy to apply.
In addition, the odds ratio showed that in the studied population, early obesity development in the presence of MetS increases the chance of an altered TG/HDL-c ratio 2.5-fold when compared with those who developed obesity at a late age, independent of MetS. In fact, we know that food habits are formed in childhood and that they can persist through adulthood [24,25]. Humans tend to prefer foods that are high in sugar, salt, and energy density, which have an impact on lipid levels [24]. These foods are rich in refined carbohydrates and saturated and trans fats that increase TG levels and reduce HDL-c, consequently increasing the risk of cardiovascular disease [26].
Our study also aimed to assess the impact of obesity onset on MetS parameters and MetS development. We found that women with early obesity had a higher mean weight and BMI than those with late obesity; similar results were identified in a study by Wrzosek et al. (2018) with bariatric surgery patients [27]. Thus, these data reinforce the importance of treating obesity from an early age to prevent the proliferation and expansion of adipose tissue, which is responsible for the development of metabolic diseases. Individuals with weight gain before the age of 18 years have a greater capacity to store and gain weight more easily.
The data presented here contrast with the current view that the longer the period of obesity, the greater are the chances of developing metabolic complications. This can be explained by hyperplasia and hypertrophy of adipose tissue [28,29]. Hyperplasia, an increase in the number of fat cells, occurs mainly in childhood and does not change in adulthood [30]. This process is related to the function of metabolically healthy adipose tissue, considering that there are more cells to store excess calories, and thus, avoid adipocyte stress [29].
During adulthood, adipocyte hypertrophy prevails, which is related to macrophage infiltration, and consequently to chronic inflammation and the development of conditions associated with obesity, such as IR, dyslipidemia, and systemic arterial hypertension [29,30,31,32]. This would explain the difference found in the cutoff point of the TG/HDL-c ratio in the present study, since it allows the early identification of metabolic changes [6,33]. For women who had excess weight at a later stage, the cutoff point was lower because they were more prone to metabolic changes.
Our study has some limitations, such as the absence of food consumption data and the assessment of the inflammatory profile of each individual. To assess the onset of obesity, we asked the patients about the age at which they remember having started to gain excessive weight. Therefore, we have to consider memory bias. The study was cross-sectional with a specific population, which emphasizes the need for further studies in different groups and a long-term perspective to confirm the TG/HDL-c ratio, the life stage of the onset of obesity, and the development of MetS. Currently, the vaccination rate against COVID-19 in Brazil is high and cases are increasingly rare, which makes us confident to resume recruiting volunteers and collecting data. Thus, we estimate that for the second half of 2023, we will be able to confirm the findings of this study in a greater number of women with severe obesity and expand the evidence on the use of the TG/HDL-c ratio as a MetS criterion.

5. Conclusions

In the present study, no association was identified between the obesity onset period and alterations in the parameters and development of MetS. However, our results suggest that the TG/HDL-c ratio could be a parameter that can assist in the identification of individuals at risk of developing MetS, with different cutoffs points considering the stage of life at the onset of obesity. It is not an indicator to replace the conventional criteria for MetS, but it is a simpler criterion to facilitate clinical practice. This is a pilot sample of women; if our results are confirmed in larger sample studies, the TG/HDL-c ratio might be useful in clinical practice as a predictor of MetS according to the stage of life (early or late) at which obesity began.

Supplementary Materials

The following supporting information can be downloaded at: https://www.mdpi.com/article/10.3390/obesities2040030/s1, Figure S1: Comparation of TG/HDL-c ratio with Body Mass Index (BMI), Waist-to-Hip ratio (WHR) and Waist-to-height ratio (WtHR); Figure S2: Comparation of TG/HDL-c ratio with Low-density lipoprotein to high density lipoprotein (LDL-c/HDL-c), Total Cholesterol to high-density lipoprotein (TC/HDL-c) and Homeostasis Model Assessment-Insulin Resistance (HOMA-IR). Table S1: Comparison of metabolic data between groups with and without MS; Table S2: Association of TG/HDL-c ratio with the phase of life at obesity onset and Metabolic Syndrome.

Author Contributions

Conceptualization, N.F., M.d.O.Q., P.R.E.d.M., V.d.S.A., M.A.H. and F.C.C.; Data curation, L.O. and F.C.C.; Formal analysis, N.F., L.O. and F.C.C.; Funding acquisition, M.A.H. and F.C.C.; Investigation, N.F., M.d.O.Q., K.L.S.L., P.R.E.d.M. and V.d.S.A.; Methodology, N.F., M.d.O.Q., K.L.S.L., P.R.E.d.M., V.d.S.A. and F.C.C.; Project administration, M.A.H. and F.C.C.; Resources, J.F.M., M.A.H. and F.C.C.; Supervision, J.F.M., M.A.H. and F.C.C.; Validation, N.F., L.O., A.R.D., J.F.M., M.A.H. and F.C.C.; Writing—original draft, N.F., J.F.M., M.A.H. and F.C.C.; Writing—review and editing, N.F., A.R.D., J.F.M., M.A.H. and F.C.C. All authors have read and agreed to the published version of the manuscript.

Funding

This research was funded by “Conselho Nacional de Desenvolvimento Científico e Tecnológico” (CNPq) grant number [n°434159/2018-2] and “Fundação de Apoio a Pesquisa” (FUNAPE—UFG) [nº01/2022].

Institutional Review Board Statement

The study was conducted according to the guidelines of the Declaration of Helsinki and approved by the Research Ethics Committee of the Federal University of Goiás (nº 3.251.178, 8 April 2019) and the State Hospital of Goiânia Dr. Alberto Rassi (nº 961/19, 17 June 2019).

Informed Consent Statement

Informed consent was obtained from all subjects involved in the study.

Data Availability Statement

The datasets analyzed for this study can be accessed by contacting the corresponding authors.

Acknowledgments

The authors would like to thank the undergraduate students Gabriela Girade, Giovana Caixeta Tassinari, and Paula Ribeiro Toscano, who contributed to the execution of the project. Joao Mota (n. 305082/2019-1) and Ana Dâmaso (n. 305240/2021-8) have been financially supported by Conselho Nacional de Desenvolvimento Científico e Tecnológico CNPq. We would also like to thank all the volunteers who agreed to participate in the studies.

Conflicts of Interest

The authors declare no conflict of interest.

References

  1. McCracken, E.; Monaghan, M.; Sreenivasan, S. Pathophysiology of the metabolic syndrome. Clin. Dermatol. 2018, 36, 14–20. [Google Scholar] [CrossRef]
  2. Al-Qawasmeh, R.H.; Tayyem, R.F. Dietary and lifestyle risk factors and metabolic syndrome: Literature review. Curr. Res. Nutr. Food Sci. 2018, 6, 594–608. [Google Scholar] [CrossRef] [Green Version]
  3. Lloyd, L.J.; Langley-Evans, S.C.; McMullen, S. Childhood obesity and risk of the adult metabolic syndrome: A systematic review. Int. J. Obes. 2012, 36, 1–11. [Google Scholar] [CrossRef] [Green Version]
  4. International Diabetes Federation. Consensus Worldwide Definition of the Metabolic Syndrome. 2006. Available online: https://www.idf.org/e-library/consensus-statements/60-idfconsensus-worldwide-definitionof-the-metabolic-syndrome.html (accessed on 11 January 2022).
  5. Du, T.; Yuan, G.; Zhang, M.; Zhou, X.; Sun, X.; Yu, X. Clinical usefulness of lipid ratios, visceral adiposity indicators, and the triglycerides and glucose index as risk markers of insulin resistance. Cardiovasc. Diabetol. 2014, 13, 146. [Google Scholar] [CrossRef]
  6. Borrayo, G.; Basurto, L.; González-Escudero, E.; Diaz, A.; Vázquez, A.; Sánchez, L.; Hernández-González, G.; Barrera, S.; Degollado, J.; Córdova, N.; et al. TG/HDL-C ratio as cardio-metabolic biomarker even in normal weight women. Acta Endocrinol. 2018, 14, 261–267. [Google Scholar] [CrossRef]
  7. Uruska, A.; Zozulinska-Ziolkiewicz, D.; Niedzwiecki, P.; Pietrzak, M.; Wierusz-Wysocka, B. TG/HDL-C ratio and visceral adiposity index may be useful in assessment of insulin resistance in adults with type 1 diabetes in clinical practice. J. Clin. Lipidol. 2018, 12, 734–740. [Google Scholar] [CrossRef]
  8. Young, K.A.; Maturu, A.; Lorenzo, C.; Langefeld, C.D.; Wagenknecht, L.E.; Chen, Y.-D.I.; Taylor, K.D.; Rotter, J.I.; Norris, J.M.; Rasouli, N. The triglyceride to high-density lipoprotein cholesterol (TG/HDL-C) ratio as a predictor of insulin resistance, β-cell function, and diabetes in Hispanics and African Americans. J. Diabetes Complicat. 2019, 33, 118–122. [Google Scholar] [CrossRef]
  9. Chen, B.-D.; Yang, Y.-N.; Ma, Y.-T.; Pan, S.; He, C.-H.; Liu, F.; Ma, X.; Fu, Z.-Y.; Li, X.-M.; Xie, X.; et al. Waist-to-height ratio and triglycerides/high-density lipoprotein cholesterol were the optimal predictors of metabolic syndrome in Uighur men and women in Xinjiang, China. Metab. Syndr. Relat. Disord. 2015, 13, 214–220. [Google Scholar] [CrossRef]
  10. Radetti, G.; Grugni, G.; Lupi, F.; Fanolla, A.; Caroli, D.; Bondesan, A.; Sartorio, A. High Tg/HDL-Cholesterol Ratio Highlights a Higher Risk of Metabolic Syndrome in Children and Adolescents with Severe Obesity. J. Clin. Med. 2022, 11, 4488. [Google Scholar] [CrossRef]
  11. Nur Zati Iwani, A.K.; Jalaludin, M.Y.; Yahya, A.; Mansor, F.; Md Zain, F.; Hong, J.Y.H.; Wan Mohd Zin, R.M.; Mokhtar, A.H. TG: HDL-C Ratio as Insulin Resistance Marker for Metabolic Syndrome in Children With Obesity. Front. Endocrinol. 2022, 13, 852290. [Google Scholar] [CrossRef]
  12. Chen, Y.; Chang, Z.; Liu, Y.; Zhao, Y.; Fu, J.; Zhang, Y.; Liu, Y.; Fan, Z. Triglyceride to high-density lipoprotein cholesterol ratio and cardiovascular events in the general population: A systematic review and meta-analysis of cohort studies. Nutr. Metab. Cardiovasc. Dis. 2022, 32, 318–329. [Google Scholar] [CrossRef]
  13. SBD- Sociedade Brasileira de Diabetes. Diretrizes da Sociedade Brasileira de Diabetes. São Paulo, 2017–2018. Available online: https://diretriz.diabetes.org.br/ (accessed on 30 December 2019).
  14. Allain-Regnault, M.; Bwibo, N.O.; Chigier, E. WHO Study Group on Young People and ‘Health for All by the Year 2000’ & World Health Organization. Young People’s Health-a Challenge for Society: Report of a WHO Study Group on Young People and “Health for All by the Year 2000” [Meeting Held in Geneva from 4 to 8 June 1984]. World Health Organization. 1986. Available online: https://apps.who.int/iris/handle/10665/41720 (accessed on 15 December 2019).
  15. Matthews, D.R.; Hosker, J.P.; Rudenski, A.S.; Naylor, B.A.; Treacher, D.F.; Turner, R.C. Homeostasis model assessment: Insulin resistance and beta-cell function from fasting plasma glucose and insulin concentrations in man. Diabetologia. 1985, 28, 412–419. [Google Scholar] [CrossRef] [Green Version]
  16. Stern, S.E.; Williams, K.; Ferrannini, E.; DeFronzo, R.A.; Bogardus, C.; Stern, M.P. Using Routine Clinical Measurements. Diabetes 2005, 54, 333–339. [Google Scholar] [CrossRef] [Green Version]
  17. Chu, S.-Y.; Jung, J.-H.; Park, M.-J.; Kim, S.-H. Risk assessment of metabolic syndrome in adolescents using the triglyceride/high-density lipoprotein cholesterol ratio and the total cholesterol/high-density lipoprotein cholesterol ratio. Ann. Pediatr. Endocrinol. Metab. 2019, 24, 41–48. [Google Scholar] [CrossRef] [Green Version]
  18. Hosmer, D.W.; Lemeshow, S. Applied Logistic Regression, 2nd ed.; John Wiley & Sons, Inc.: New York City, NY, USA, 2000; ISBN 0-471-72214-6. [Google Scholar]
  19. Tests, D. Basic Principles of ROC Analysis. Semin. Nucl. Med. 1978, 8, 283–298. [Google Scholar]
  20. Rezapour, M.; Shahesmaeili, A.; Hossinzadeh, A.; Zahedi, R.; Najafipour, H.; Gozashti, M.H. Comparison of Lipid Ratios to Identify Metabolic Syndrome. Arch. Iran. Med. 2018, 21, 572–577. [Google Scholar]
  21. Gasevic, D.; Frohlich, J.; Mancini, G.J.; Lear, S.A. Clinical usefulness of lipid ratios to identify men and women with metabolic syndrome: A cross-sectional study. Lipids Health Dis. 2014, 13, 159. [Google Scholar] [CrossRef] [Green Version]
  22. Huang, W.; Shu, L.; Zhao, H.; Chen, S.; Zhang, H.; Song, G. Association of the Triglyceride to High-Density Lipoprotein Ratio and the Visceral Adiposity Index with Metabolic Syndrome in Diabetic Susceptible Population. Horm. Metab. Res. 2020, 52, 95–103. [Google Scholar] [CrossRef]
  23. Gu, Z.; Zhu, P.; Wang, Q.; He, H.; Xu, J.; Zhang, L.; Li, D.; Wang, J.; Hu, X.; Ji, G. Obesity and lipid-related parameters for predicting metabolic syndrome in Chinese elderly population. Lipids Health Dis. 2018, 17, 289. [Google Scholar] [CrossRef] [Green Version]
  24. De Cosmi, V.; Scaglioni, S.; Agostoni, C. Early taste experiences and later food choices. Nutrients 2017, 9, 107. [Google Scholar] [CrossRef] [Green Version]
  25. Joshi, S.M.; Katre, P.A.; Kumaran, K.; Joglekar, C.; Osmond, C.; Bhat, D.S.; Lubree, H.; Pandit, A.; Yajnik, C.S.; Fall, C.H.D. Tracking of cardiovascular risk factors from childhood to young adulthood-The Pune Children’s Study. Int. J. Cardiol. 2014, 175, 176–178. [Google Scholar] [CrossRef] [Green Version]
  26. Mach, F.; Baigent, C.; Catapano, A.L.; Koskinas, K.C.; Casula, M.; Badimon, L.; Chapman, M.J.; De Backer, G.G.; Delgado, V.; Ference, B.A.; et al. 2019 ESC/EAS Guidelines for the management of dyslipidaemias: Lipid modification to reduce cardiovascular risk. Eur. Heart J. 2020, 41, 111–188. [Google Scholar] [CrossRef]
  27. Wrzosek, M.; Wiśniewska, K.; Sawicka, A.; Tałałaj, M.; Nowicka, G. Early Onset of Obesity and Adult Onset of Obesity as Factors Affecting Patient Characteristics Prior to Bariatric Surgery. Obes. Surg. 2018, 28, 3902–3909. [Google Scholar] [CrossRef] [Green Version]
  28. Wrzosek, M.; Sawicka, A.; Wrzosek, M.; Piątkiewicz, P.; Tałałaj, M.; Nowicka, G. Age at onset of obesity, transcription factor 7-like 2 (TCF7L2) rs7903146 polymorphism, adiponectin levels and the risk of type 2 diabetes in obese patients. Arch. Med. Sci. 2019, 15, 321–329. [Google Scholar] [CrossRef]
  29. Ghaben, A.L.; Scherer, P.E. Adipogenesis and metabolic health. Nat. Rev. Mol. Cell Biol. 2019, 20, 242–258. [Google Scholar] [CrossRef]
  30. Spalding, K.L.; Arner, E.; Westermark, P.O.; Bernard, S.; Buchholz, B.A.; Bergmann, O.; Blomqvist, L.; Hoffstedt, J.; Näslund, E.; Britton, T.; et al. Dynamics of fat cell turnover in humans. Nature 2008, 453, 783–787. [Google Scholar] [CrossRef]
  31. Giordano, A.; Murano, I.; Mondini, E.; Perugini, J.; Smorlesi, A.; Severi, I.; Barazzoni, R.; Scherer, P.E.; Cinti, S. Obese adipocytes show ultrastructural features of stressed cells and die of pyroptosis. J. Lipid Res. 2013, 54, 2423–2436. [Google Scholar] [CrossRef] [Green Version]
  32. Murano, I.; Rutkowski, J.; Wang, Q.; Cho, Y.-R.; Scherer, P.; Cinti, S. Time course of histomorphological changes in adipose tissue upon acute lipoatrophy. Nutr. Metab. Cardiovasc. Dis. 2013, 23, 723–731. [Google Scholar] [CrossRef]
  33. Baez-Duarte, B.G.; Zamora-Ginez, I.; González-Duarte, R.; Torres-Rasgado, E.; Ruiz-Vivanco, G.; Pérez-Fuentes, R. Triglyceride/high-density lipoprotein cholesterol (TG/HDL-C) index as a reference criterion of risk for metabolic syndrome (MetS) and low insulin sensitivity in apparently healthy subjects. Gac. Med. Mex. 2017, 153, 152–158. [Google Scholar]
Figure 1. Receiver operating characteristic (ROC) curves of the TG/HDL-c ratio for (a) early ages (childhood) and (b) late ages (adulthood) of obesity onset.
Obesities 02 00030 g001
Table 1. General characteristics.
VariableTotal Sample (n = 47)
(Mean + SD)
% of MetS Parameters Altered *
Age (years)40.68 ± 8.63-
Weight (kg)122.22 ± 17.74-
Height (m)1.59 ± 0.60-
BMI (kg/m2)48.38 ± 6.72100%
WC (cm)130.93 ± 12.34100%
HC (cm)145.24 ± 13.45-
WHR0.903 ± 0.06-
Glucose (mg/dL)114.55 ± 48.3446.8%
Fasting Insulin (μUI/mL) 27.10 ± 14.27-
HOMA-IR7.06 ± 3.77-
HBA1c (%)6.315 ± 1.30-
QUICKI0.29 ± 0.02-
TG (mg/dL)146 ± 65.6042.6%
HDL-c (mg/dL)46.79 ± 10.3566%
TG/HDL-c 3.32 ± 1,87-
SBP (mmHg)138.42 ± 14.6382.2%
DBP (mmHg)85.80 ± 9.5744.4%
WC, waist circumference; HC, hip circumference; WHR, waist-to-hip circumference ratio; HBA1c, glycated hemoglobin; QUICKI, quantitative insulin sensitivity check index; TG, triglycerides; HDL-c, high-density lipoprotein cholesterol; TG/HDL-c, serum triglyceride-to-HDL-c ratio; SBP, systolic blood pressure; DBP, diastolic blood pressure; CRP, C-reactive protein. * Classified according to the International Diabetes Federation, 2006 [4].
Table 2. Association of the life stage at obesity onset with anthropometric and metabolic parameters and metabolic syndrome prevalence.
VariableEarly (n = 17)
(Mean + SD)
Late (n = 30)
(Mean + SD)
p *Effect Size
Weight (kg)131.17 ± 20.61117.15 ± 13.830.0080.800
Height (m)1.60 ± 0.051.58 ± 0.060.3660.362
BMI (kg/m2)51.16 ± 7.2646.81 ± 5.950.0310.655
WC (cm) 135.40 ± 14.54128.39 ± 10.320.0610.556
HC (cm)150.66 ± 14.89142.17 ± 11.730.0360.633
WHR0.901 ± 0.080.905 ± 0.0580.8660.096
Glucose (mg/dL)106.41 ± 35.07119.17 ± 54.470.3910.278
Fasting Insulin (μUI/mL)33.48 ± 19.0323.49 ± 9.260.0550.667
QUICKI0.29 ± 0.0160.29 ± 0.020.1590
HOMA-IR 7.23 ± 3.556.96 ± 3.940.8140.072
HBA1c (%)6.147 ± 1.096.410 ± 1.420.5132.077
SBP (mmHg)140.31 ± 13.32137.38 ± 15.44 0.5260.203
DBP (mmHg)86.19 ± 7.95285.59 ± 10.490.8430.010
TG (mg/dL)137.12 ± 61.37151.03 ± 68.380.4910.214
HDL-c48.41 ± 12.9645.87 ± 8.650.4240.230
WC, waist circumference; HC, hip circumference; WHR, waist-to-hip circumference ratio; QUICKI, quantitative insulin sensitivity check index; HOMA-IR, homeostasis model assessment of insulin resistance; HBA1c, glycated hemoglobin; SBP, systolic blood pressure; DBP, diastolic blood pressure; TG, triglycerides; HDL-c, high-density lipoprotein cholesterol; CRP, C-reactive protein. * General Linear Model (GLM).
Table 3. Association of the presence or absence of alterations related to MetS parameters with the life stage at obesity onset.
PresenceAbsence
VariableEarlyLateTotalEarlyLateTotalp
Diabetes 17.6%30%25.5%82.4%70%74.5%0.351
Glucose *29.4%56.7%46.8%70.6%43.3%53.2%0.072
SAH47.1%66.7%59.6%52.9%33.3%40.4%0.188
SBP *81.3%82.8%82.2%18.8%17.2%17.8%0.899
DBP *43.8%44.8%44.4%56.3%55.2%55.6%0.944
TG *47.1%40%42.6%52.9%60%57.4%0.638
TG/HDL-c **41.2%46.7%44.7%58.8%53.3%55.3%0.716
MetS, metabolic syndrome; SAH, systemic arterial hypertension. * Glucose; SBP, systolic blood pressure; DBP, diastolic blood pressure; (TG) triglycerides: presence = high levels; absence = normal levels. ** presence ≥ 3; normal < 3 [6].
Publisher’s Note: MDPI stays neutral with regard to jurisdictional claims in published maps and institutional affiliations.

