Article

Design of LPSO Phases in Mg-Y-Ni Alloys to Impact Hydrogenation Kinetics

1
Institute for Frontier Materials, Deakin University, Waurn Ponds, VIC 3216, Australia
2
Department of Materials Science and Engineering, Technion—Israel Institute of Technology, Haifa 32000, Israel
3
School of Materials Science and Engineering, Xi’an University of Technology, Xi’an 710048, China
4
Department of Materials Science and Engineering, Monash University, Notting Hill, VIC 3168, Australia
*
Author to whom correspondence should be addressed.
Hydrogen 2023, 4(3), 658-678; https://doi.org/10.3390/hydrogen4030042
Submission received: 2 August 2023 / Revised: 6 September 2023 / Accepted: 7 September 2023 / Published: 10 September 2023
(This article belongs to the Topic Metal Hydrides: Fundamentals and Applications)

Abstract

:
A series of Mg-Y-Ni alloys with different volume fractions of long-period stacking-ordered (LPSO) phase were prepared, by controlling the alloy composition, heat treatment, and single-pass extrusion, to assess the influence of increasing LPSO phase volume fraction on the hydrogen absorption and desorption properties of the extruded alloys. The LPSO phase volume fraction in the alloys increased with increasing solute concentration, from ~24% LPSO in Mg97Y2Ni1 (at.%) to ~60% LPSO in Mg93Y4Ni3 (at.%) up to ~92% LPSO in Mg91Y5Ni4 (at.%). The most refined microstructure was obtained in the alloy with highest volume fraction of LPSO phase. After 100 s at 300 °C, the Mg91Y5Ni4 alloy absorbed 4.6 ± 0.2 wt.% H while the Mg97Y2Ni1 and Mg93Y4Ni3 alloys each absorbed 3.8 ± 0.2 wt.% H. After 10,000 s at 300 °C, all three alloys had absorbed a maximum of 5.3 ± 0.2 wt.% H with no further significant difference in hydrogen absorption kinetics. The Mg91Y5Ni4 alloy desorbed 1.8 ± 0.2 wt.% H after 100 s at 300 °C against a vacuum while the Mg97Y2Ni1 and Mg93Y4Ni3 alloys desorbed 0.8 ± 0.2 wt. H and 0.6 ± 0.2 wt.% H, respectively. After 10,000 s at 300 °C, the Mg91Y5Ni4 and Mg97Y2Ni1 alloys completely desorbed 5.2 ± 0.2 wt.% H and 5.4 ± 0.2 wt.% H, respectively, but the Mg93Y4Ni3 alloy desorbed only 3.7 ± 0.2 wt.% H. Hydrogen absorption and desorption kinetics were fastest in the Mg91Y5Ni4 alloy with the highest LPSO volume fraction, but no consistent trend with LPSO phase volume fraction was observed with the Mg93Y4Ni3 alloy, which showed the slowest absorption and desorption kinetics. The hydrogen pressures corresponding to metal–hydride equilibrium did not vary with LPSO phase volume fraction or alloy composition, indicating that the (de)hydrogenation thermodynamics were not significantly changed in any of the alloys. Hydrogen absorption experiments with thin foils, made of extruded Mg91Y5Ni4 alloy with the highest LPSO phase fraction, demonstrated that the LPSO structures decompose into Mg phase, Mg2Ni phase, lamellar Mg/Mg-Y structures, and YHx particles. This study shows that hydrogen kinetics can be impacted in Mg-Y-Ni alloys by controlling the LPSO phases using common metallurgical techniques.

Graphical Abstract

1. Introduction

Magnesium is a material that has been extensively studied as a potential storage medium for hydrogen. This is because it can form stable MgH2, which has a high hydrogen storage capacity of 7.6 wt.%, and the corresponding hydrogenation reaction is reversible [1,2,3,4]. However, pure magnesium has some limitations, such as slow absorption and desorption kinetics and a high desorption enthalpy. To address these issues, research has focused on alloy design to improve the hydrogenation properties while maintaining absorption capacity. Different techniques have been explored to improve the hydrogenation kinetics via the refinement of magnesium microstructure, such as ball-milling [5,6,7,8,9,10], melt-spinning [11,12,13,14], and severe plastic deformation [15,16,17,18,19]. Additionally, the addition of catalysts [6,20,21,22,23] has been investigated as a means to improve hydrogenation kinetics.
Over the last two decades, there has been a growing interest in magnesium alloys containing specific combinations of rare-earth elements (RE) and transition metals (TM). Proper ratios of at least one RE and TM form unique long-period stacking-ordered (LPSO) structures, which are essentially repeated stacking faults with consistent spacing within the magnesium lattice that are parallel to the magnesium (001) plane; the RE and TM concentrate within four atomic planes at the stacking faults and form ordered clusters with an atomic arrangement different from the magnesium matrix [24,25,26,27,28,29,30,31]. Improvements in the strength, ductility, and high-temperature creep resistance of magnesium alloys have been reported due to differing LPSO polytype variants and volume fractions [32,33,34,35,36]. Recently, research has also explored how LPSO structures could potentially enhance the hydrogenation properties of magnesium [37,38,39,40]. The LPSO structures combine different refinement strategies used to enhance hydrogen storage properties by incorporating elements that act as hydrogen catalysts and evenly dispersing these catalysts throughout the microstructure at the nanoscale.
Wrought magnesium alloys with high fractions of LPSO phase have been observed to undergo accelerated dynamic recrystallization during hot deformation, resulting in the formation of ultrafine grains [32,33,34,35,41,42,43]. This phenomenon occurs at various locations, including the LPSO phase-Mg matrix interface, LPSO fragments within the Mg matrix, and grain boundaries and kinks in the LPSO phase. The increase in the volume fraction of ultrafine grains is attributed to a combination of stress concentration caused by an increase in the Mg-LPSO interface area, a higher density of LPSO fragments that trigger particle stimulated nucleation (PSN), and the pinning of dynamically recrystallized grain boundaries. There is potential to produce effective hydrogen storage materials through the deformation of the LPSO phase during microstructure refinement of wrought Mg-RE-TM alloys.
Although there has been growing interest in magnesium alloys with LPSO structures, there remain many uncertainties and unknowns about their fundamental properties and the mechanisms of their formation. The stability of different LPSO polytypes, such as 24R, 14H, 18R, and 10H, can be influenced by the choice of alloying elements and thermo-mechanical process history. These polytypes can form directly in the course of solidification, or through phase transformations during the heat treatment and/or precipitation of new phases.
There is limited information available about the hydrogenation properties of magnesium alloys with LPSO structures. However, it has been established that the RE hydrides formed in hydrogenated LPSO alloys act as catalysts that facilitate the transportation of hydrogen at the hydride-Mg matrix interface through the hydrogen pump effect via a chain of low-energy interstitial sites and vacancies [38,44]. In addition, transition metals such as Co, Fe, Ni, Ti, and V that form LPSO structures are known to catalyse the dissociation of H2 [40].
Although additives such as transition metals and rare-earth elements can enhance the kinetics of hydrogen absorption and desorption by providing fast hydrogen transport pathways, they can also increase the average density of the material, leading to a reduction in the gravimetric hydrogen storage capacity. Therefore, varying the solute content in LPSO alloys is instrumental in the optimization of both hydrogenation kinetics and hydrogen storage capacity through the effective distribution of minimal alloy additions. However, most studies have focused on a single alloy composition and/or process condition [37,38,39,45,46,47,48,49].
As the LPSO phase volume fraction has traits that align with the grain refinement and catalyst strategies, it would be interesting to correlate LPSO phase volume fractions with hydrogenation properties in Mg-RE-TM alloys. A correlation of this type has been found in our recent work on Mg-Y-Zn alloy [50,51] where, in general, the kinetics of (de)hydrogenation increase with the increasing volume fraction of the LPSO phase, yet the maxima in absorption and desorption kinetics are achieved for different alloy compositions.
The aim of the present study is to modify the LPSO phase volume fraction in Mg-Y-Ni alloys by adjusting the chemical composition and applying thermo-mechanical treatment. By varying the quantity of LPSO phase present in the extruded alloys, we will establish a correlation between the volume fraction of LPSO phase and the hydrogen kinetics of the extruded alloys.

2. Materials and Methods

2.1. Alloy and Samples Preparation

For the study, three alloys were prepared with ternary compositions (Mg97Y2Ni1 (at%.), Mg93Y4Ni3 (at%.), and Mg91Y5Ni4 (at%.)) that closely followed the Ni:Y 3:4 composition line, as presented in Figure 1. These selections aimed to minimize the occurrence of phases other than Mg and the LPSO phase. Induction casting was performed within an argon environment at 760 °C utilizing 99.9% pure Mg, a Mg-25 wt.% Y master alloy, and a Mg-25 wt.% Ni master alloy. The molten mixture was stirred under argon at 720 °C, then cast in a water-cooled cylindrical mould. The resulting alloys were divided into pieces, with one piece set aside for as-cast state characterization (referred to as NC alloys, where ‘N’ indicates the use of Ni as the transition metal and ‘C’ signifies the as-cast condition). The remaining alloy pieces underwent a further heat treatment process.
The subsequent heat treatment of the Mg-Y-Ni alloy sections was carried out under an argon atmosphere using a Labec muffle furnace. The material was heated incrementally from 25 °C to 520 °C at a controlled rate of 5 °C/min. After being maintained at 520 °C for a duration of 10 hours, the alloys were quickly cooled via rapid water quenching to 70 °C. One piece from each alloy was reserved for characterization after heat treatment (designated as NHT, indicating heat-treated alloys), while the last piece from each alloy was utilized for the extrusion step.
For extrusion, cylindrical billets measuring 29.5 mm in diameter and 20.0 mm in height were machined from the remaining material. The extrusion rig was a modified HafCo Metal Master HP-150 industrial hydraulic press, equipped with a custom sleeve for billet and die heating. The billets were extruded at 450 °C with a ram velocity of 0.5 mm/s, resulting in a reduction in the billet diameter from 29.5 mm to 10 mm and generating an equivalent strain of 2.16. Immediately following extrusion, the samples (referred to as NE, with ‘E’ denoting extruded alloys) were promptly quenched in a water bath situated directly beneath the sleeve.
For the investigation of hydrogen absorption, desorption, and pressure-composition (PC) behaviour, powders were produced from the extruded alloys. Portions of the extruded material were manually shaved into millimetre-scale chips, which were subsequently ball-milled. The milling process took place within a planetary ball mill for a duration of 4 h at 800 rpm, utilizing stainless steel balls (10 mm in diameter) as the milling media with a ball-to-media ratio of 20:1. To avert powder oxidation during milling, hexane was added to the milling vessel.
To examine the microstructure following the hydrogen-induced decomposition of the LPSO phases without any damage from ball-milling, thin foils of the extruded Mg91Y5 Ni4 alloy were employed. These foils, thinned to a thickness of less than 100 µm, enabled substantial hydrogenation, facilitating hydrogen diffusion to approximately 30 µm inside the foil until the hydride surface layer impeded further absorption [4]. Polished and hydrogenated foils were stored in membrane boxes to avoid oxidation.

2.2. Characterization Methods

Preparations were made for SEM observation and EDS measurement on samples from the as-cast, heat-treated, and extruded alloys. Plates were sectioned from the alloys, including both parallel and perpendicular orientations to the extrusion direction. The plates were then polished following standard protocols on a Struers Labopol-21 polishing wheel. A polishing process was also applied to the hydrogenated thin foils to expose their microstructure. Micrographs were captured using a JEOL JSM-7800F SEM with a spatial resolution of 3.0 nm. An accelerating voltage of 20 kV was applied for secondary electron (SE) and backscatter electron (BSE) imaging, with working distances set at 13.1 mm and 6.0 mm, respectively.
The processing of SEM BSE micrographs employed the Fiji/ImageJ image analysis application. A modified manual point count method was implemented to determine phase volume fractions. Grayscale pixels were treated as points within the testing grid, and grayscale value ranges for each phase within the SEM micrographs were established using grayscale histograms collected from selected regions of interest (ROI). The grayscale range for each phase was correlated with EDS composition data for the phase, with composition accuracy validated through multiple EDS measurements. To compute the volume fraction of each LPSO phase and Mg phase, the pixel count within the designated grayscale range was divided by the total count within the micrograph. The phase volume fractions of each alloy-process state-combination were determined from three SEM BSE micrographs, and the volume fractions corresponding to each phase were subsequently averaged.
Phase elemental compositions were ascertained through EDS point scans and line scans employing an integrated Oxford Instruments X-max 50 mm2 EDS detector with a spatial resolution of 3.0 nm. EDS spectra were gathered with a 5 kV accelerating voltage, chosen to minimize the interaction volume of Mg. Although EDS error values cannot be clearly depicted due to scale within Figure 1, these values have been approximated and are documented in [50]. Oxford Instruments’ Aztec application was configured to gather one million detector counts for each spectrum. Elemental data were extracted by processing spectra within Aztec, with phase compositions being determined by averaging multiple data points.
For the observation of LPSO phases through transmission electron microscopy (TEM), foils were prepared using standard methodologies. Then, 3 mm discs of the heat-treated and extruded alloys underwent electrolytic thinning using a Struers Tenupol 5 twin jet electropolishing unit at 100 V. Afterwards, the discs were perforated via a Gatan 691 precision ion polishing system (PIPS) at 5 keV and a 4° angle. A final ion polishing step was conducted for 30 min at 3 keV and a 2° angle. TEM brightfield images and diffraction patterns were obtained through a FEI Tecnai G2 T20 Twin TEM, with a LaB6 emitter operating at 200 kV, and equipped with a Gatan Orius SC200D CCD digital camera. Additional images were captured using a JEOL JEM 2100 TEM, also with a LaB6 emitter operating at 200 kV, and equipped with a Gatan Orius SC1000 CCD digital camera.
X-ray diffraction (XRD) patterns were acquired from 3 mm-thick plates taken from the extruded alloys and from samples of the Mg91Y5Ni4 alloy before and after hydrogen experiments. Pattern acquisitions were conducted parallel to the extrusion direction with a Malvern Panalytical X’pert3 Pro Powder X-ray diffractometer, using Cu Kα X-ray radiation over a range of 2θ 6.681° to 80.000° with a step size of 0.0131°. Kapton polyimide tape (0.03 mm polyimide + 0.04 mm silicon adhesive) was used to seal powder samples during measurements. Phase identification was carried out utilizing Malvern Panalytical Highscore Plus software version 5.1, interfaced with the International Centre for Diffraction Data (ICDD) Powder Diffraction File (PDF4+) database. The d-spacings and corresponding 2θ positions of XRD peaks relating to the LPSO phases were simulated using the Highscore Plus Bragg calculator. This simulation involved space groups and lattice parameters, as reported by Egusa and Abe [29] for the 18R and 14H LPSO polytypes, along with Yamasaki et al. [30] for the 10H LPSO polytype.

2.3. Hydrogenation Experiments

Assessments of hydrogen absorption and desorption kinetics, as well as thermodynamics, were carried out utilizing a custom-designed Sieverts’ apparatus [15]. The apparatus was configured as a closed volume system housing a stainless-steel reactor vessel with a volume of 21 ± 1 cm3, heated externally using a resistance furnace equipped with temperature control accurate to ±1 °C. Highly pure hydrogen (99.99999 at%) was piped into the system through desorption from a LaNi4.15Fe0.85Hx hydride source. The LABView application was employed for data monitoring and acquisition.
Prior to official measurements of each powder, samples of about 2 grams each were subjected to preheating within the reactor at 400 °C for a span of two hours. This was followed by a sequence of ten rapid activation cycles, between 420 °C and 30 atm during adsorption and 280 °C and 2 atm during desorption. Hydrogen kinetics were assessed during two cycles of (de)hydrogenation at 300 °C, with desorption measured relative to vacuum conditions within the reference cell. Following the second desorption cycle, pressure-composition measurements were conducted at 300 °C.
The hydrogenation of the thin foils prepared from the extruded Mg91Y5Ni4 (NE3) alloy occurred within the Sieverts’ apparatus at 440 °C. The hydrogen pressure corresponding to the metal–hydride equilibrium at this temperature was approximately 20 atm; pressures below this value only produced YHx hydrides, while at and above this pressure the formation of MgH2 becomes feasible [54]. The first foil, designated as the partially hydrogenated NE3-P foil, underwent hydrogenation at 2 atm for a duration of 24 h, resulting in the formation of YHx exclusively. This was carried out to ascertain whether YHx formation alone could induce LPSO phase decomposition. The second foil, designated as the fully hydrogenated NE3-F foil, underwent hydrogenation first at 2 atm for 24 h and then at 50 atm for an additional 24 h, resulting in the formation of both YHX and MgH2.

3. Results and Discussion

3.1. Tailoring LPSO Phase Volume Fraction via Composition and Processing in Mg-Y-Ni Aloys

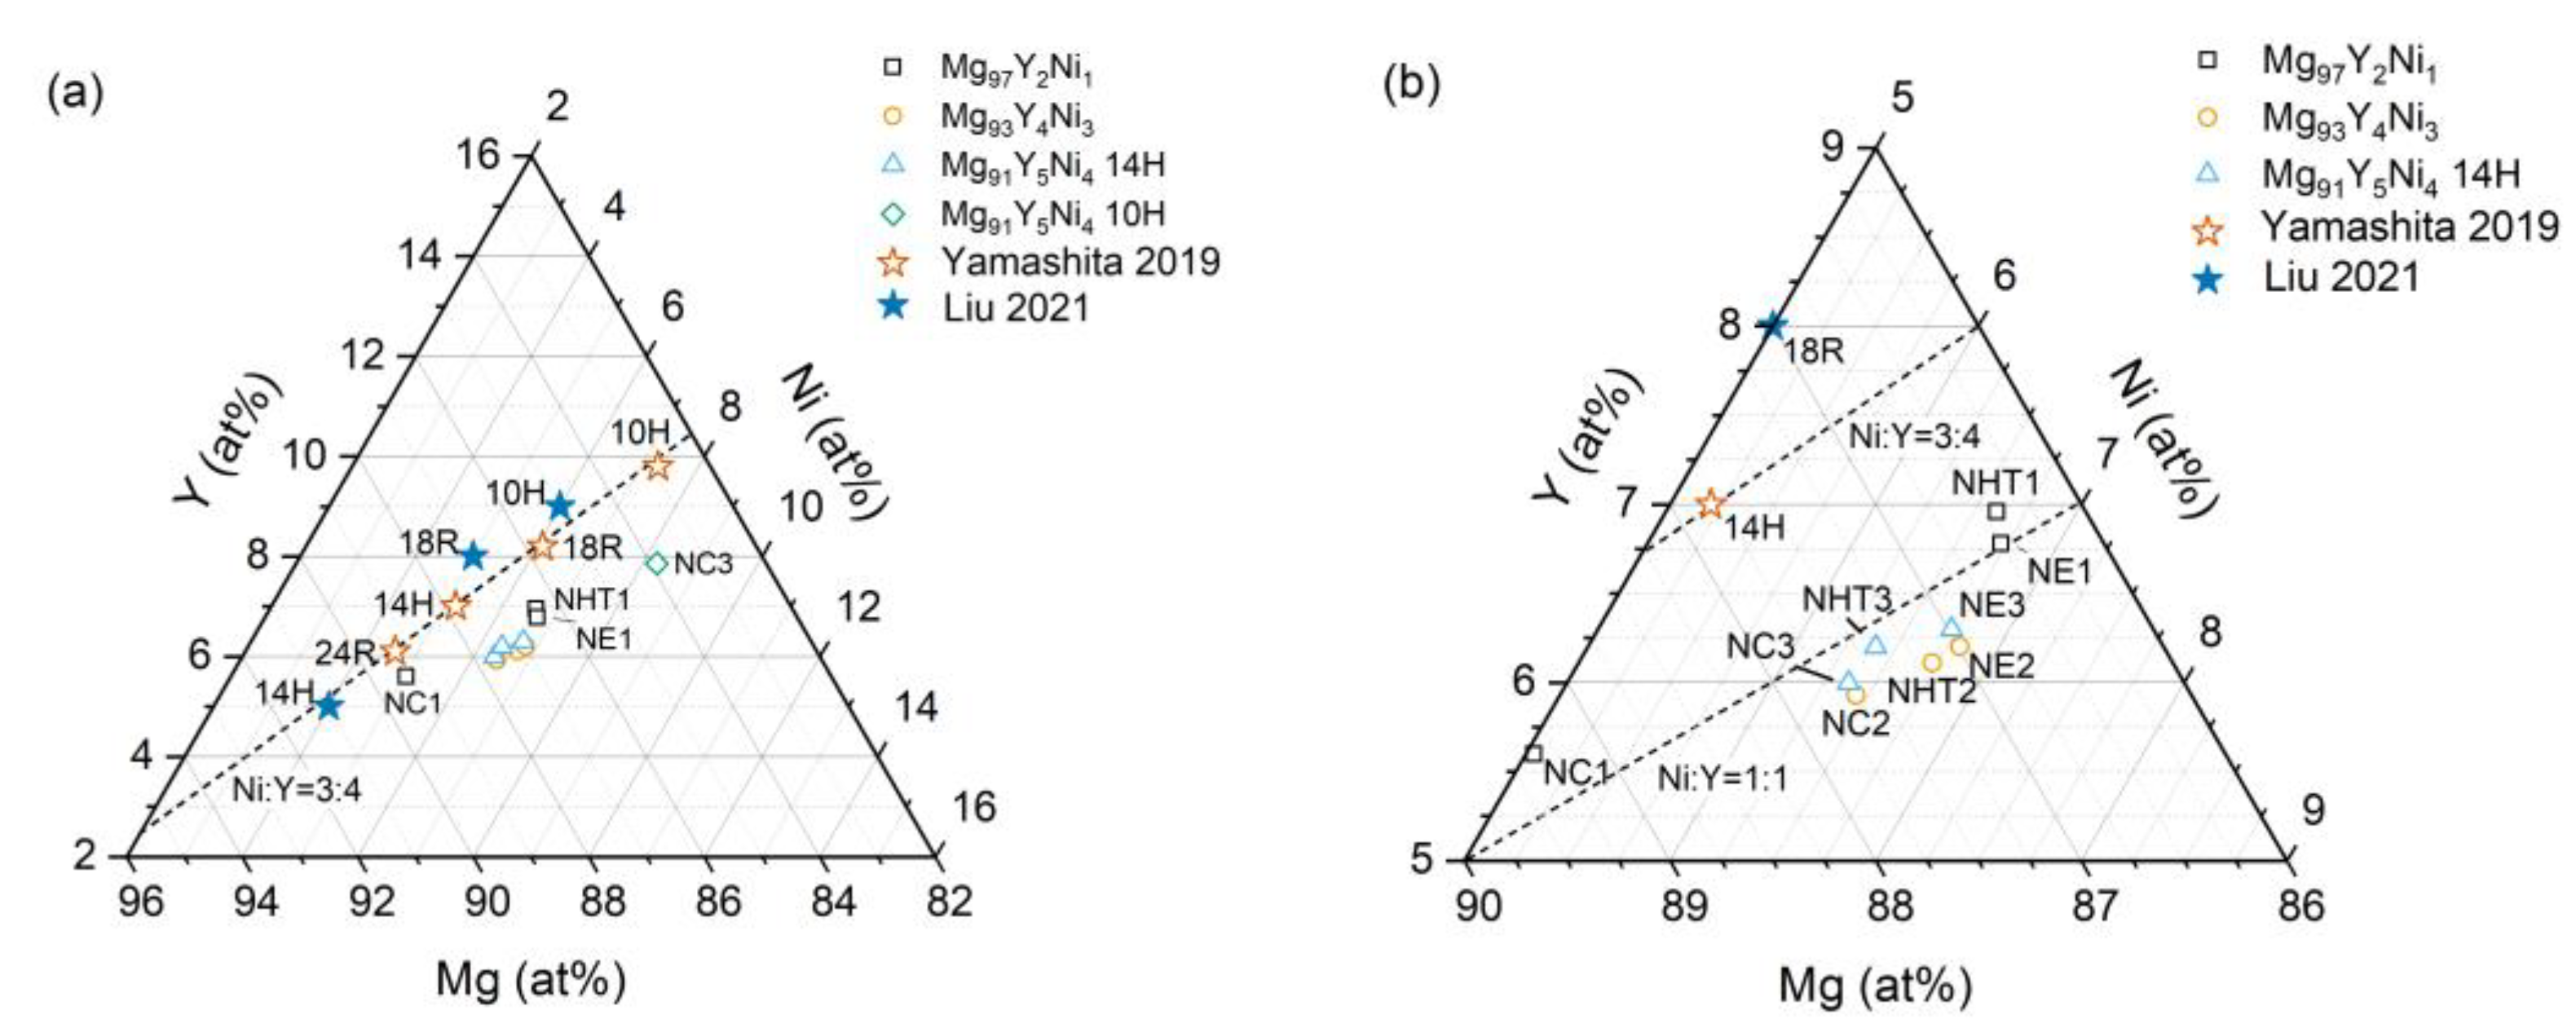
3.1.1. LPSO Phase Composition

The ternary composition of the LPSO phases as measured by EDS are given in Table 1 and plotted in Figure 1 alongside ideal LPSO polytypes in Mg-Y-Ni alloys [52,53]. The ratio of nickel to yttrium for all the LPSO phases was between 0.90 and 1.10, which exceeds the ideal Ni:Y ratio of 0.75. The Mg:Y and Mg:Ni ratios placed the majority of LPSO phases in this study between the ideal 14H and 18R stoichiometries, with the phases having excess nickel and/or deficient yttrium. The Mg93Y4Ni3 and Mg91Y5Ni4 alloys all showed the LPSO phase changing from 14H to 18R through the increase in Ni and Y content with heat treatment and extrusion. Heat treatment has a significant effect on the LPSO phase content in the Mg97Y2Ni1 alloy, but extrusion has less of an effect compared to the Mg93Y4Ni3 and Mg91Y5Ni4 alloys.
The LPSO polytypes in this study had compositions between the stoichiometric models of Mg87Ni5Y7 for 18R and Mg85Ni6Y9 for 10H proposed by Liu et al. [52]. They were also consistent with experimental 14H, 18R, and 10H compositions close to the Ni:Y=1:1 ratio (after annealing at 400 °) and close to the 3:4 ratio (after annealing at 500 °) reported by Wang et al. [55]. Similarly to Jin et al.’s [56] study, as-cast Mg88Ni5Y7 alloy had a predominantly 18R LPSO phase with a composition of Mg86Ni7Y7 (at.%), but coexisting with the 14H phase.
Using these results and the results of previous studies, the LPSO phases in the majority of as-cast alloys were identified as non-stoichiometric 18R polytypes based on the measured EDS compositions, while LPSO phase in the as-cast Mg97Y2Ni1 alloy aligned most with the ideal 24R composition with an in-plane 6M modulated order proposed by Yamashita et al. [53]. It has been shown that LPSO phases can have non-stoichiometric compositions due to the imperfect ordering of the Ni6Y8 clusters and the occupation of the cluster interstitial by Mg [57]. Furthermore, the alloys are unlikely to be at equilibrium after heat treatment as the time spent at elevated temperatures is significantly less than the treatment period used in Mg-Y-Ni thermodynamics studies [52,55,58]. However, recent work on the in-plane order modulation of LPSO structures was used to assign LPSO polytypes in Table 1 based on proximity to the ideal stoichiometric compositions given by Yamashita et al. [53]. This assigned the 14H polytype to the majority of the LPSO phases in the Mg93Y4Ni3 and Mg91Y5Ni4 alloys after heat treatment and extrusion.
In addition to the LPSO phases, a small number of additional phases were identified by EDS. The other abundant phase in the Mg-Y-Ni alloys is α-Mg, which all contain trace amounts of yttrium and nickel within solubility limits at 400 °C [59]. Eutectic structures of Mg/Mg2Ni are observed in the as-cast Mg93Y4Ni3 and Mg91Y5Ni4 alloys, but these structures are not present after heat treatment. Mg2Ni is detected in the Mg93Y4Ni3 after heat treatment and extrusion, but none is identified by EDS in the Mg91Y5Ni4 alloy after the same treatments. The absence of Mg2Ni in the heat-treated Mg91Y5Ni4 alloy is supported by no visible corrosion of samples after extended periods of storage in ambient conditions. In comparison, samples of the Mg93Y4Ni3 alloy formed corrosion spots within days in ambient conditions through the action of galvanic couples formed by Mg/Mg2Ni and Mg/LPSO phases that contain nickel. Small cubic particles were also present in all the alloys in all process conditions. Some of the particles consisted of predominantly yttrium in excess of 98 (at.%) with the balance made up by Mg. Other particles were identified as the ternary MgNi4Y phase, which has been observed in annealed Mg-Y-Ni alloys with a similar alloy content [55].

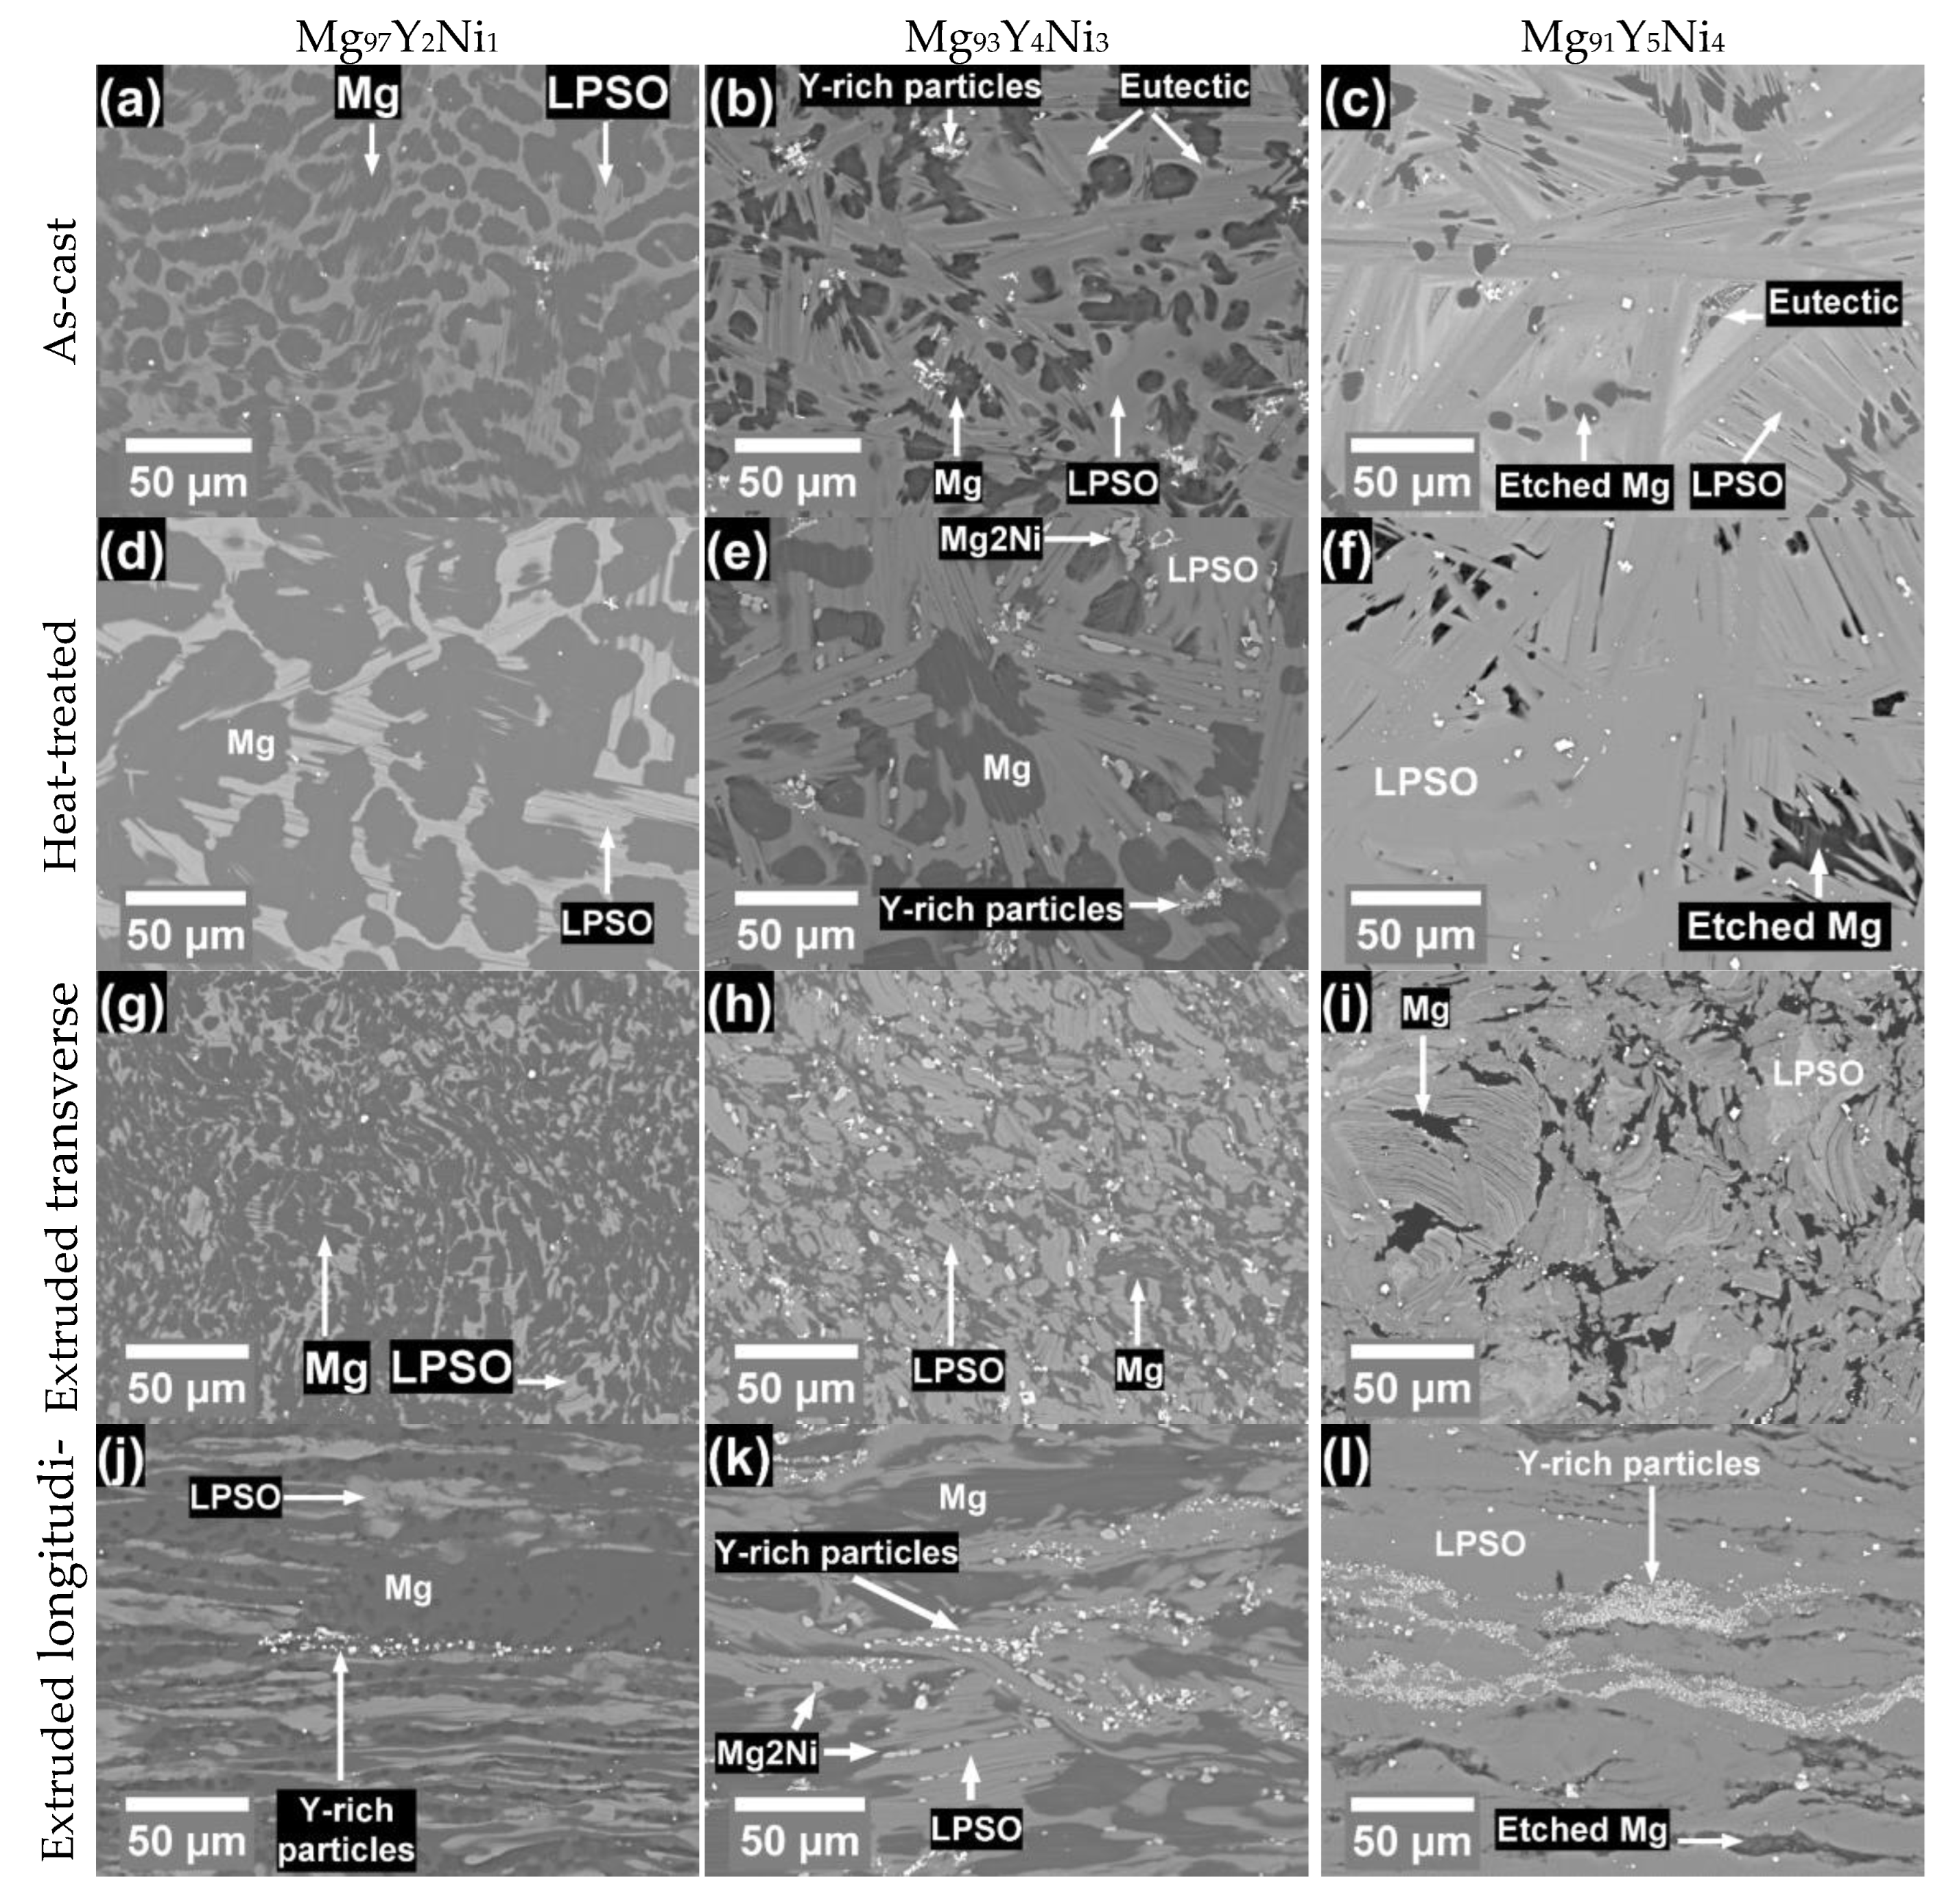
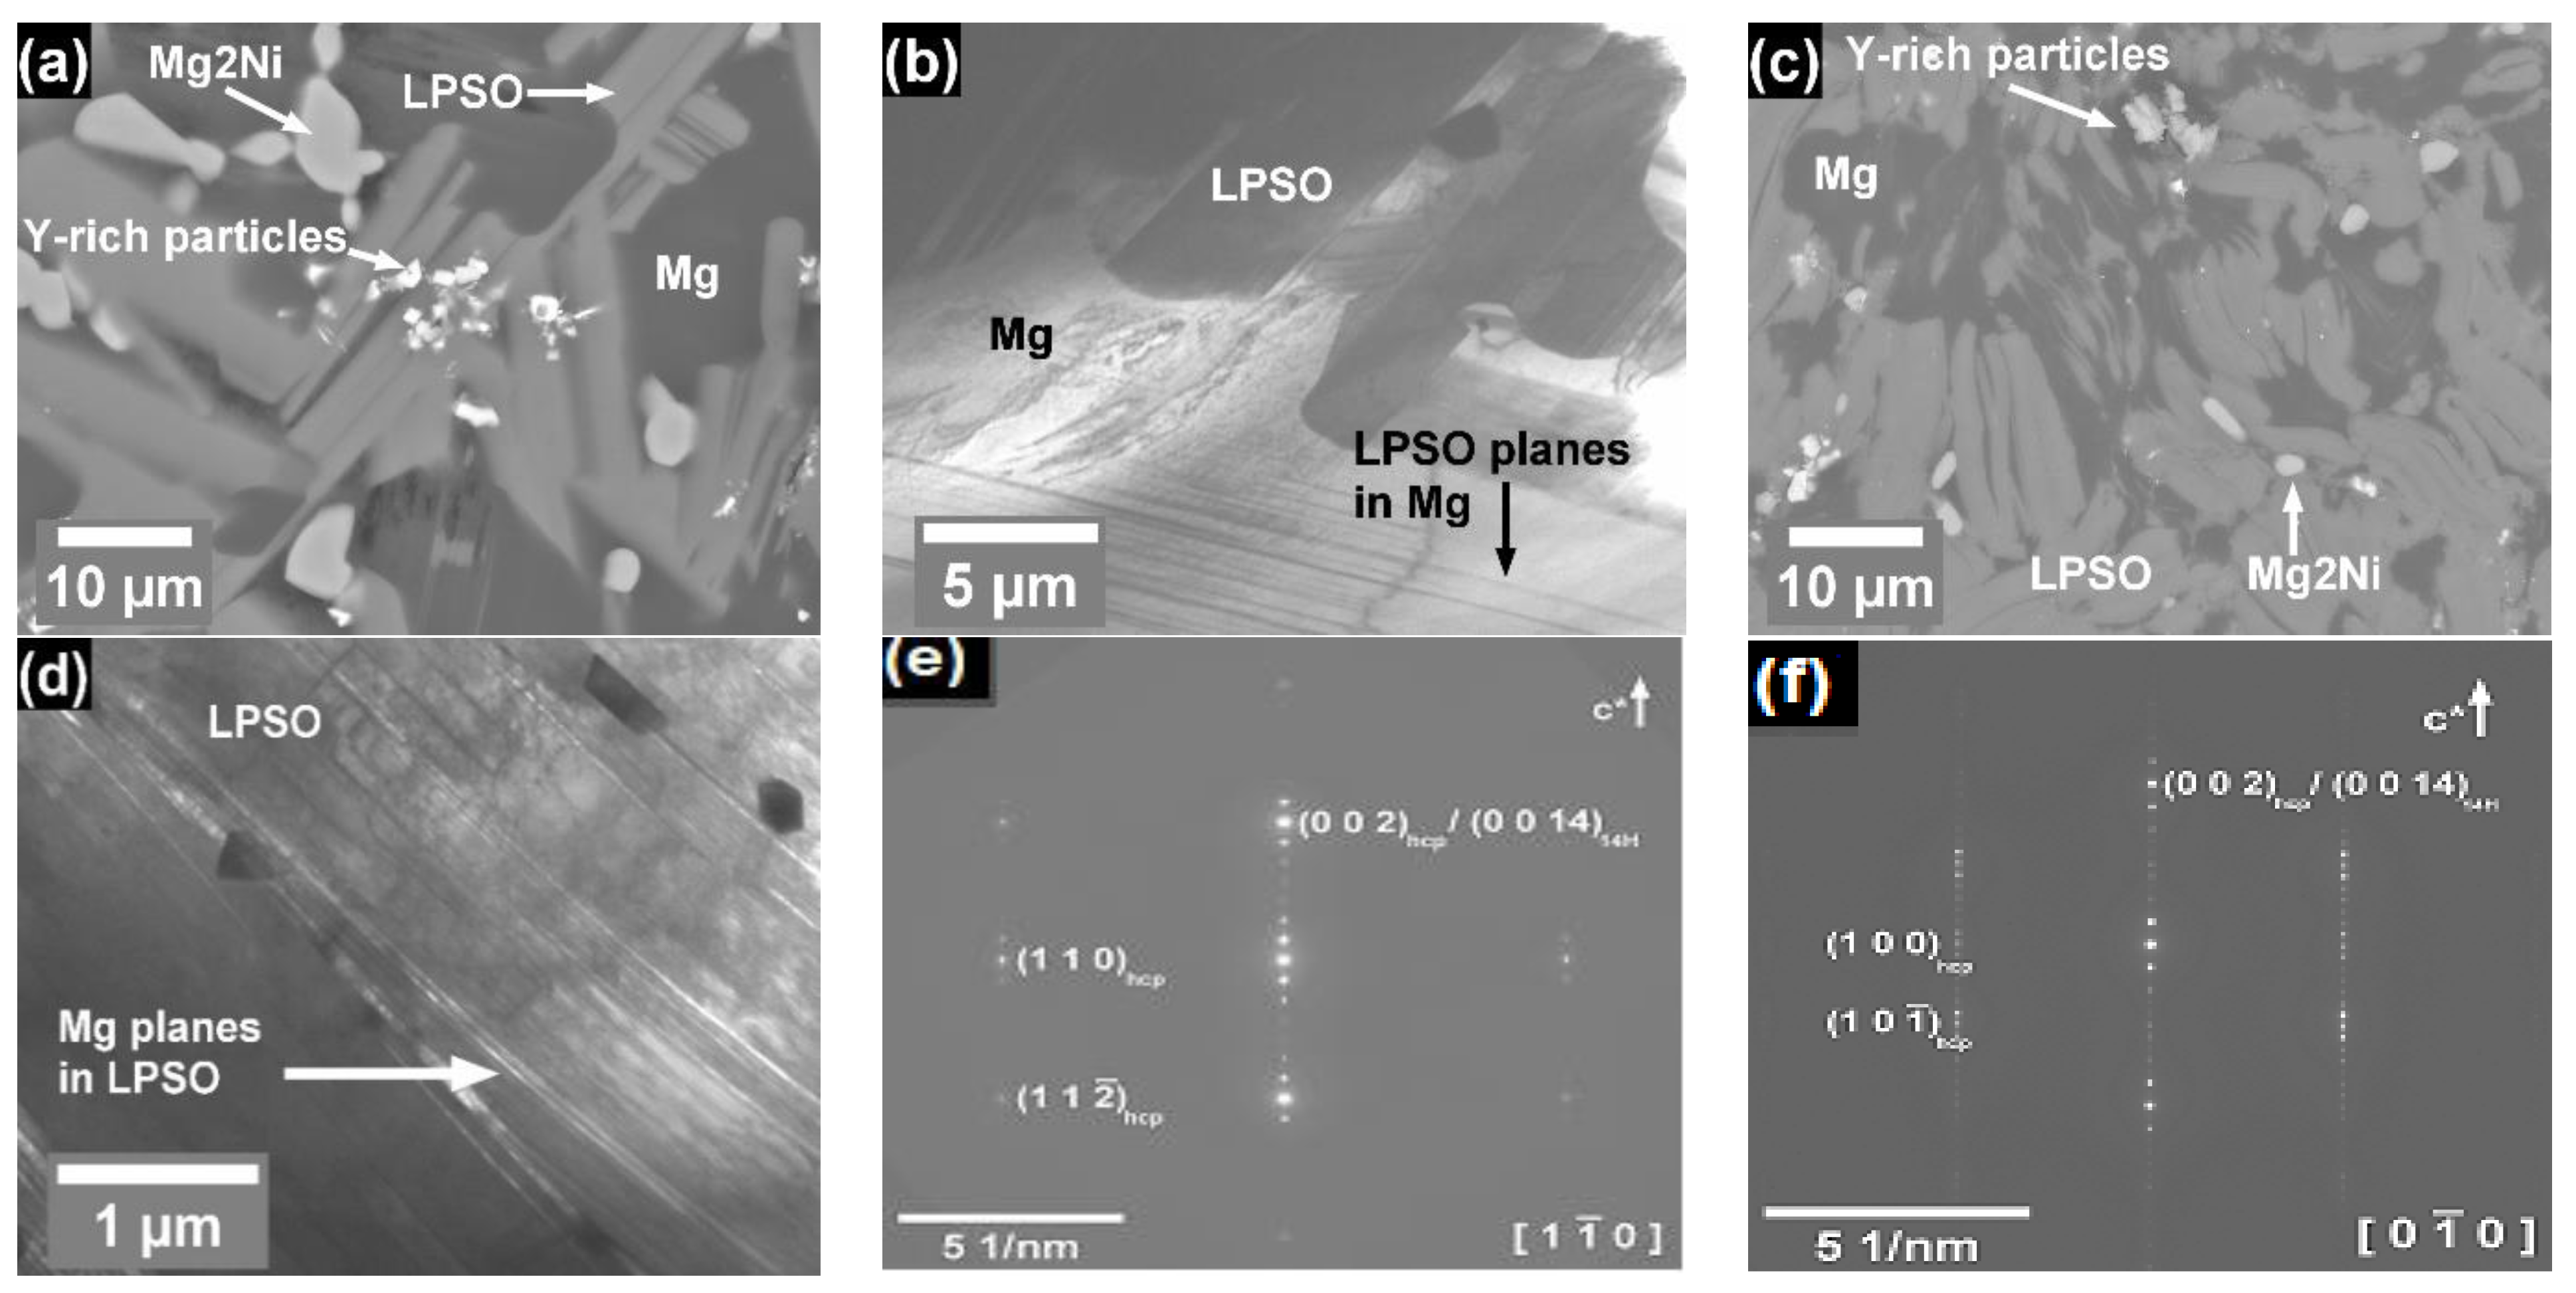
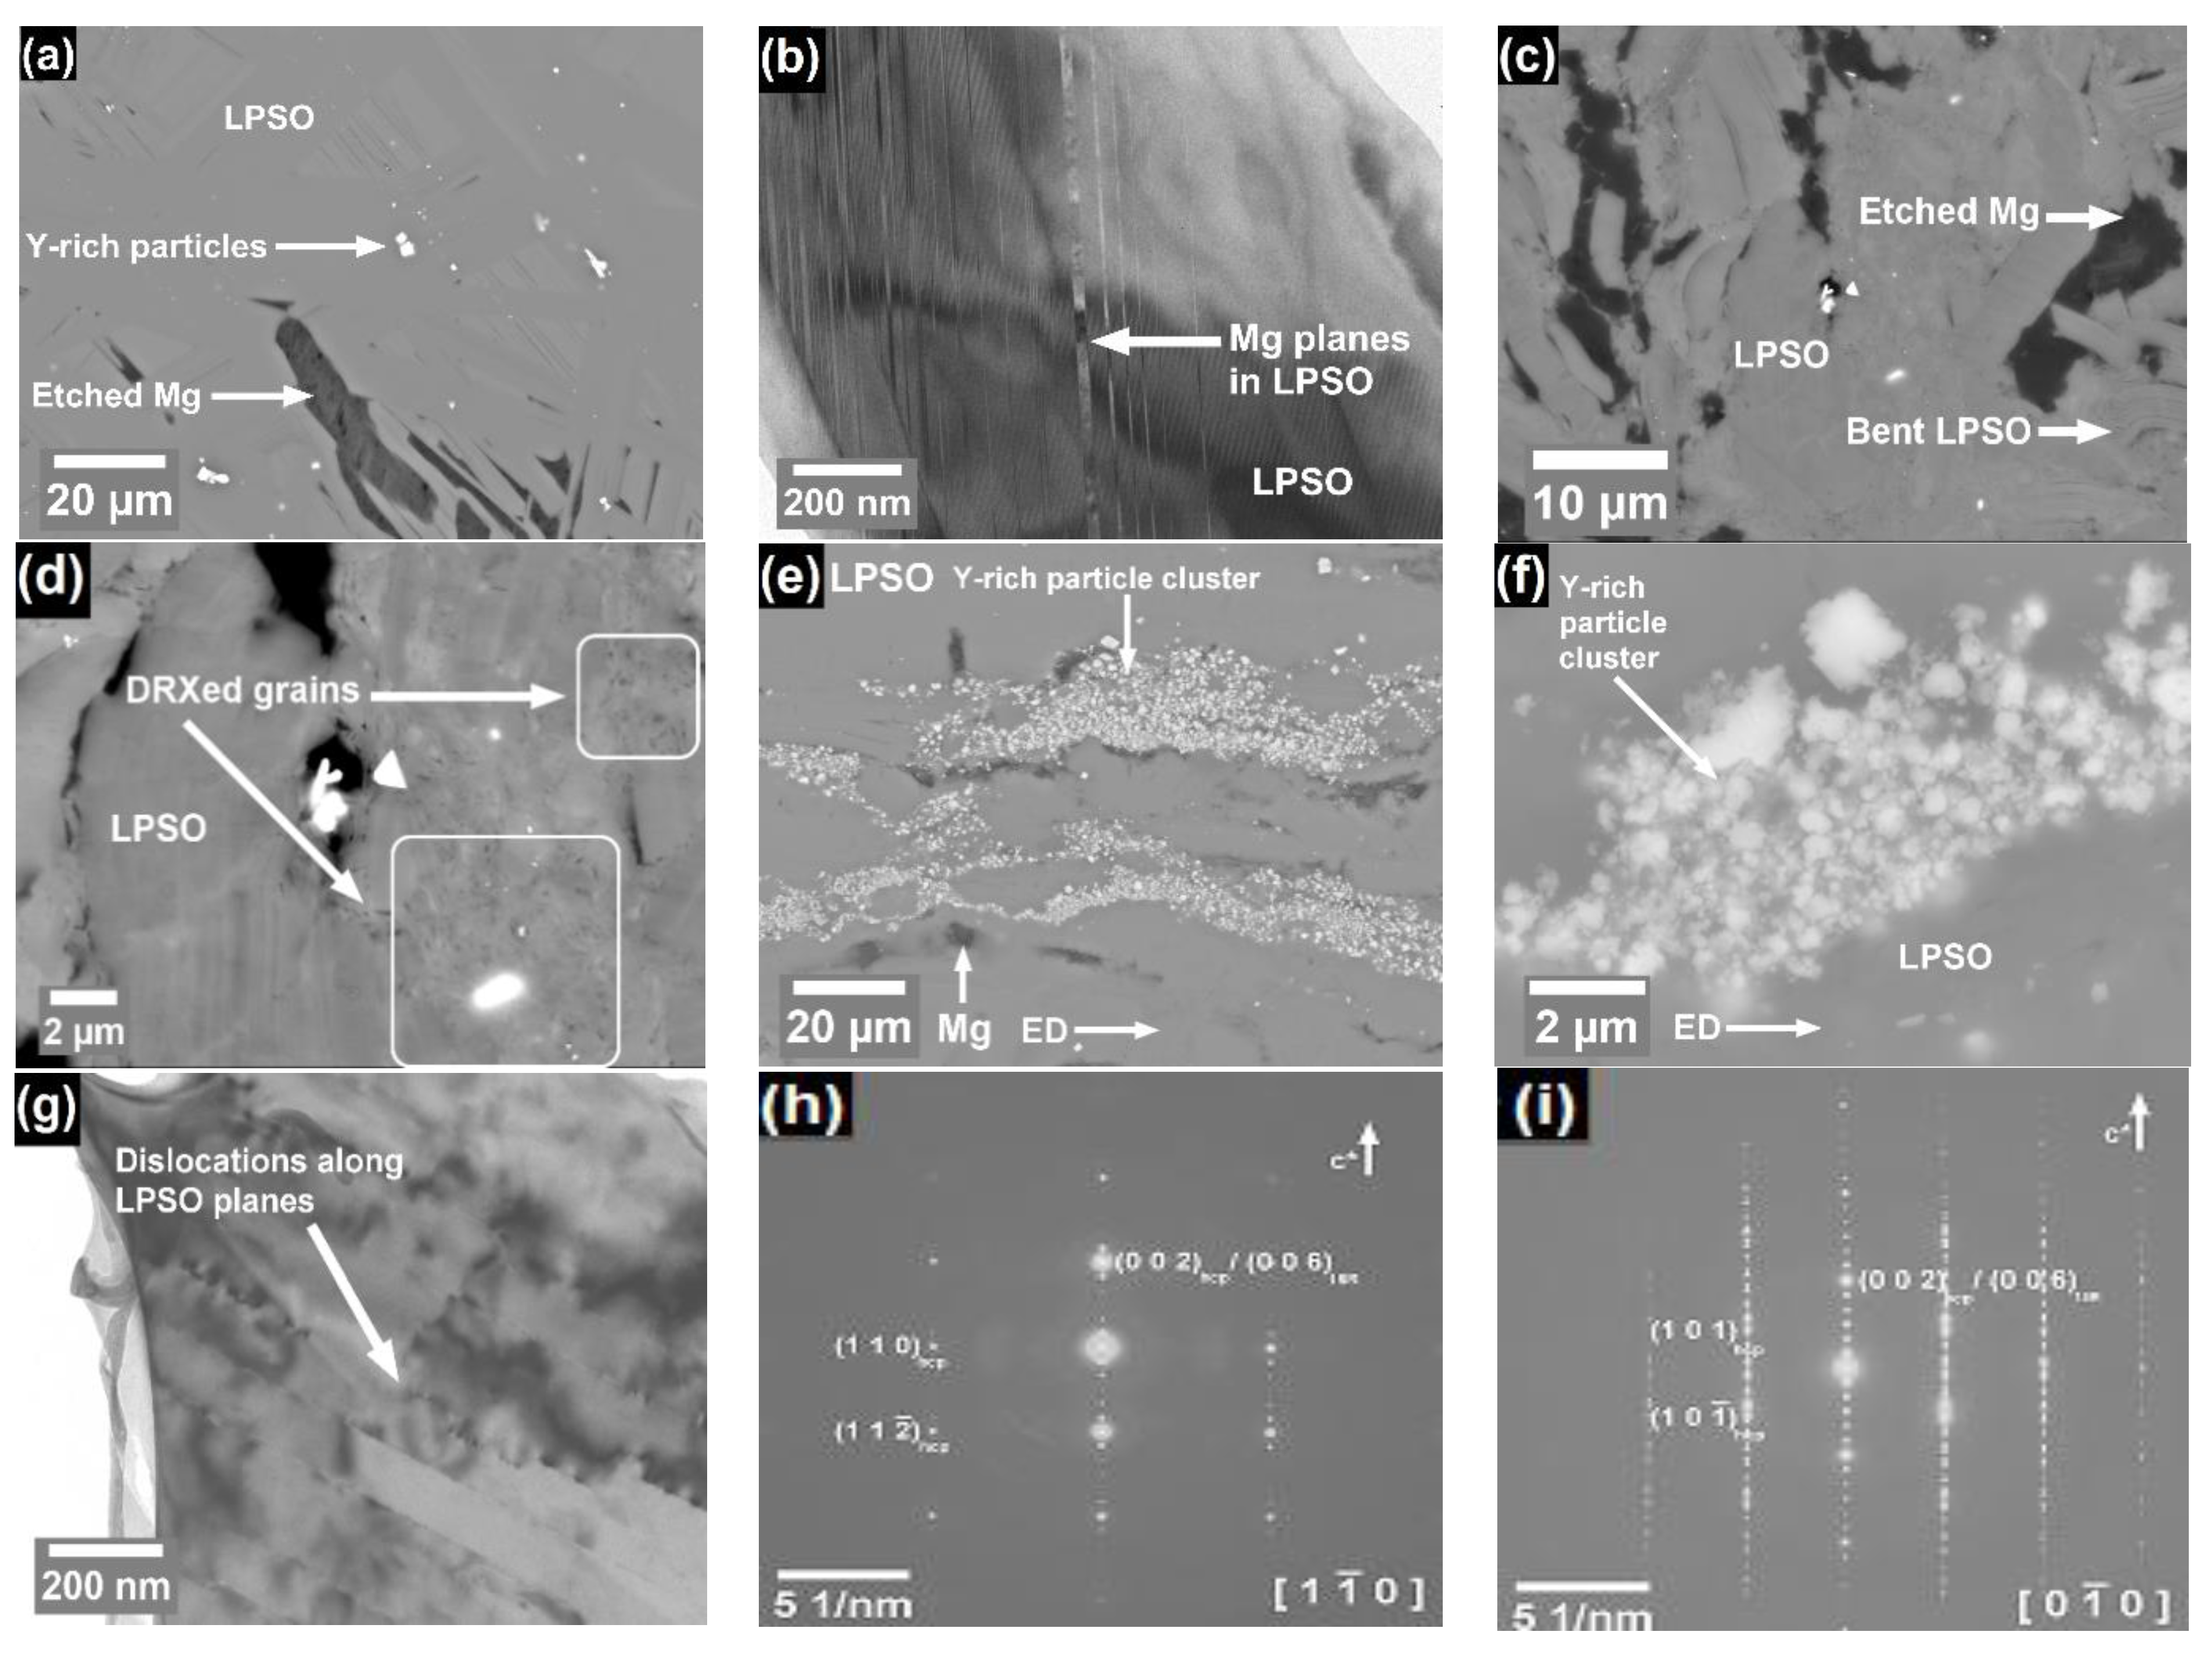
3.1.2. Microstructure

The microstructure of the three Mg-Y-Ni alloys in different process conditions are compared in Figure 2. The phases identified by EDS are labelled, with α-Mg and LPSO phases being the dominant phases in all the alloys.
The Mg phase in all the as-cast alloys was globular, with a similar size at approximately 10 µm, with some Mg phase domains increasing up to approximately 50 µm in the Mg97Y2Ni1 alloy. After heat treatment, the size of the Mg phase increased in all the alloys, with the effect diminishing with increasing alloy content. After extrusion, the Mg phase elongated following the extrusion direction, with the phase width decreasing in the transverse direction. The width of the Mg phase in the longitudinal direction was approximately the same as it was in the related heat-treated alloys.
The LPSO phase forms as a network along the Mg phase boundaries in the as-cast Mg97Y2Ni1 alloy, with micron-wide branches and larger nodes tens of microns in size. Within the LPSO phase, parallel plates of Mg phase can be observed that have the same alignment over hundreds of microns. Micro plates of LPSO phase are also seen within the Mg matrix. As the alloy content increases, the LPSO phase volume fraction increases in the as-cast Mg93Y4Ni3 and Mg91Y5Ni4 alloys and becomes a block-like matrix, with the alignment of LPSO phase domains clearly seen in Figure 2b,c,e,f.
Figure 3, Figure 4 and Figure 5 present a comparison of the microstructures of the Mg97Y2Ni1, Mg93Y4Ni3, and Mg91Y5Ni4 alloys in the heat-treated and extruded conditions, respectively, to see the effect of processing on refining the phases and grain size.
The morphologies of the LPSO phases were similar in the as-cast and heat-treated alloys, but the growth of the Mg phase in the heat-treaded Mg97Y2Ni1 alloy increased the distance between LPSO phase regions. This spacing effect was less pronounced in the Mg93Y4Ni3 and Mg91Y5Ni4 alloys as the size and volume of the LPSO phase increased. The block-like matrix of the LPSO phase did not change significantly in size or shape in the heat-treated Mg93Y4Ni3 and Mg91Y5Ni4 alloys. Polygonal areas of the eutectic Mg/Mg2Ni structure in the as-cast Mg93Y4Ni3 and Mg91Y5Ni4 alloys were not observed after heat treatment in either alloy. The Mg2Ni phase in the Mg93Y4Ni3 alloy coarsened into micron-sized ellipsoid particles, while the absence of Mg2Ni in the heat-treated Mg91Y5Ni4 alloy suggests the eutectic structure transformed into the MgYNi4 phase identified by EDS.
The deformation microstructures after extrusion are similar to those previously reported in extruded or ECAP-processed LPSO alloys [36,60]. The size of both the Mg and LPSO phases decreased in the Mg97Y2Ni1 alloy in the transverse plane, reducing the spacing between the phases. Along the extrusion direction the LPSO phase was fragmented into smaller plates between 1 µm and 10 µm that aligned parallel to the Mg phase. The block-like LPSO phases in the extruded Mg93Y4Ni3 and Mg91Y5Ni4 alloys were similar in size compared to the heat-treated condition, but bending and kinking was introduced into the phase and is most obvious in Figure 3i within LPSO structures containing thin Mg plates. The LPSO phases were also elongated along the extrusion direction in the Mg93Y4Ni3 and Mg91Y5Ni4 alloys, but the fragmentation reduced as the amount of block-type morphology increased.
The clusters of Y-rich particles seen in the microstructure may be the cause of the yttrium deficiency in the LPSO phases. The Ni:Y ratio of 1:1 deviated from the ideal stoichiometric 3:4 ratio and implied that there is a significant substitution of Ni for Y in the Ni6Y8 clusters.

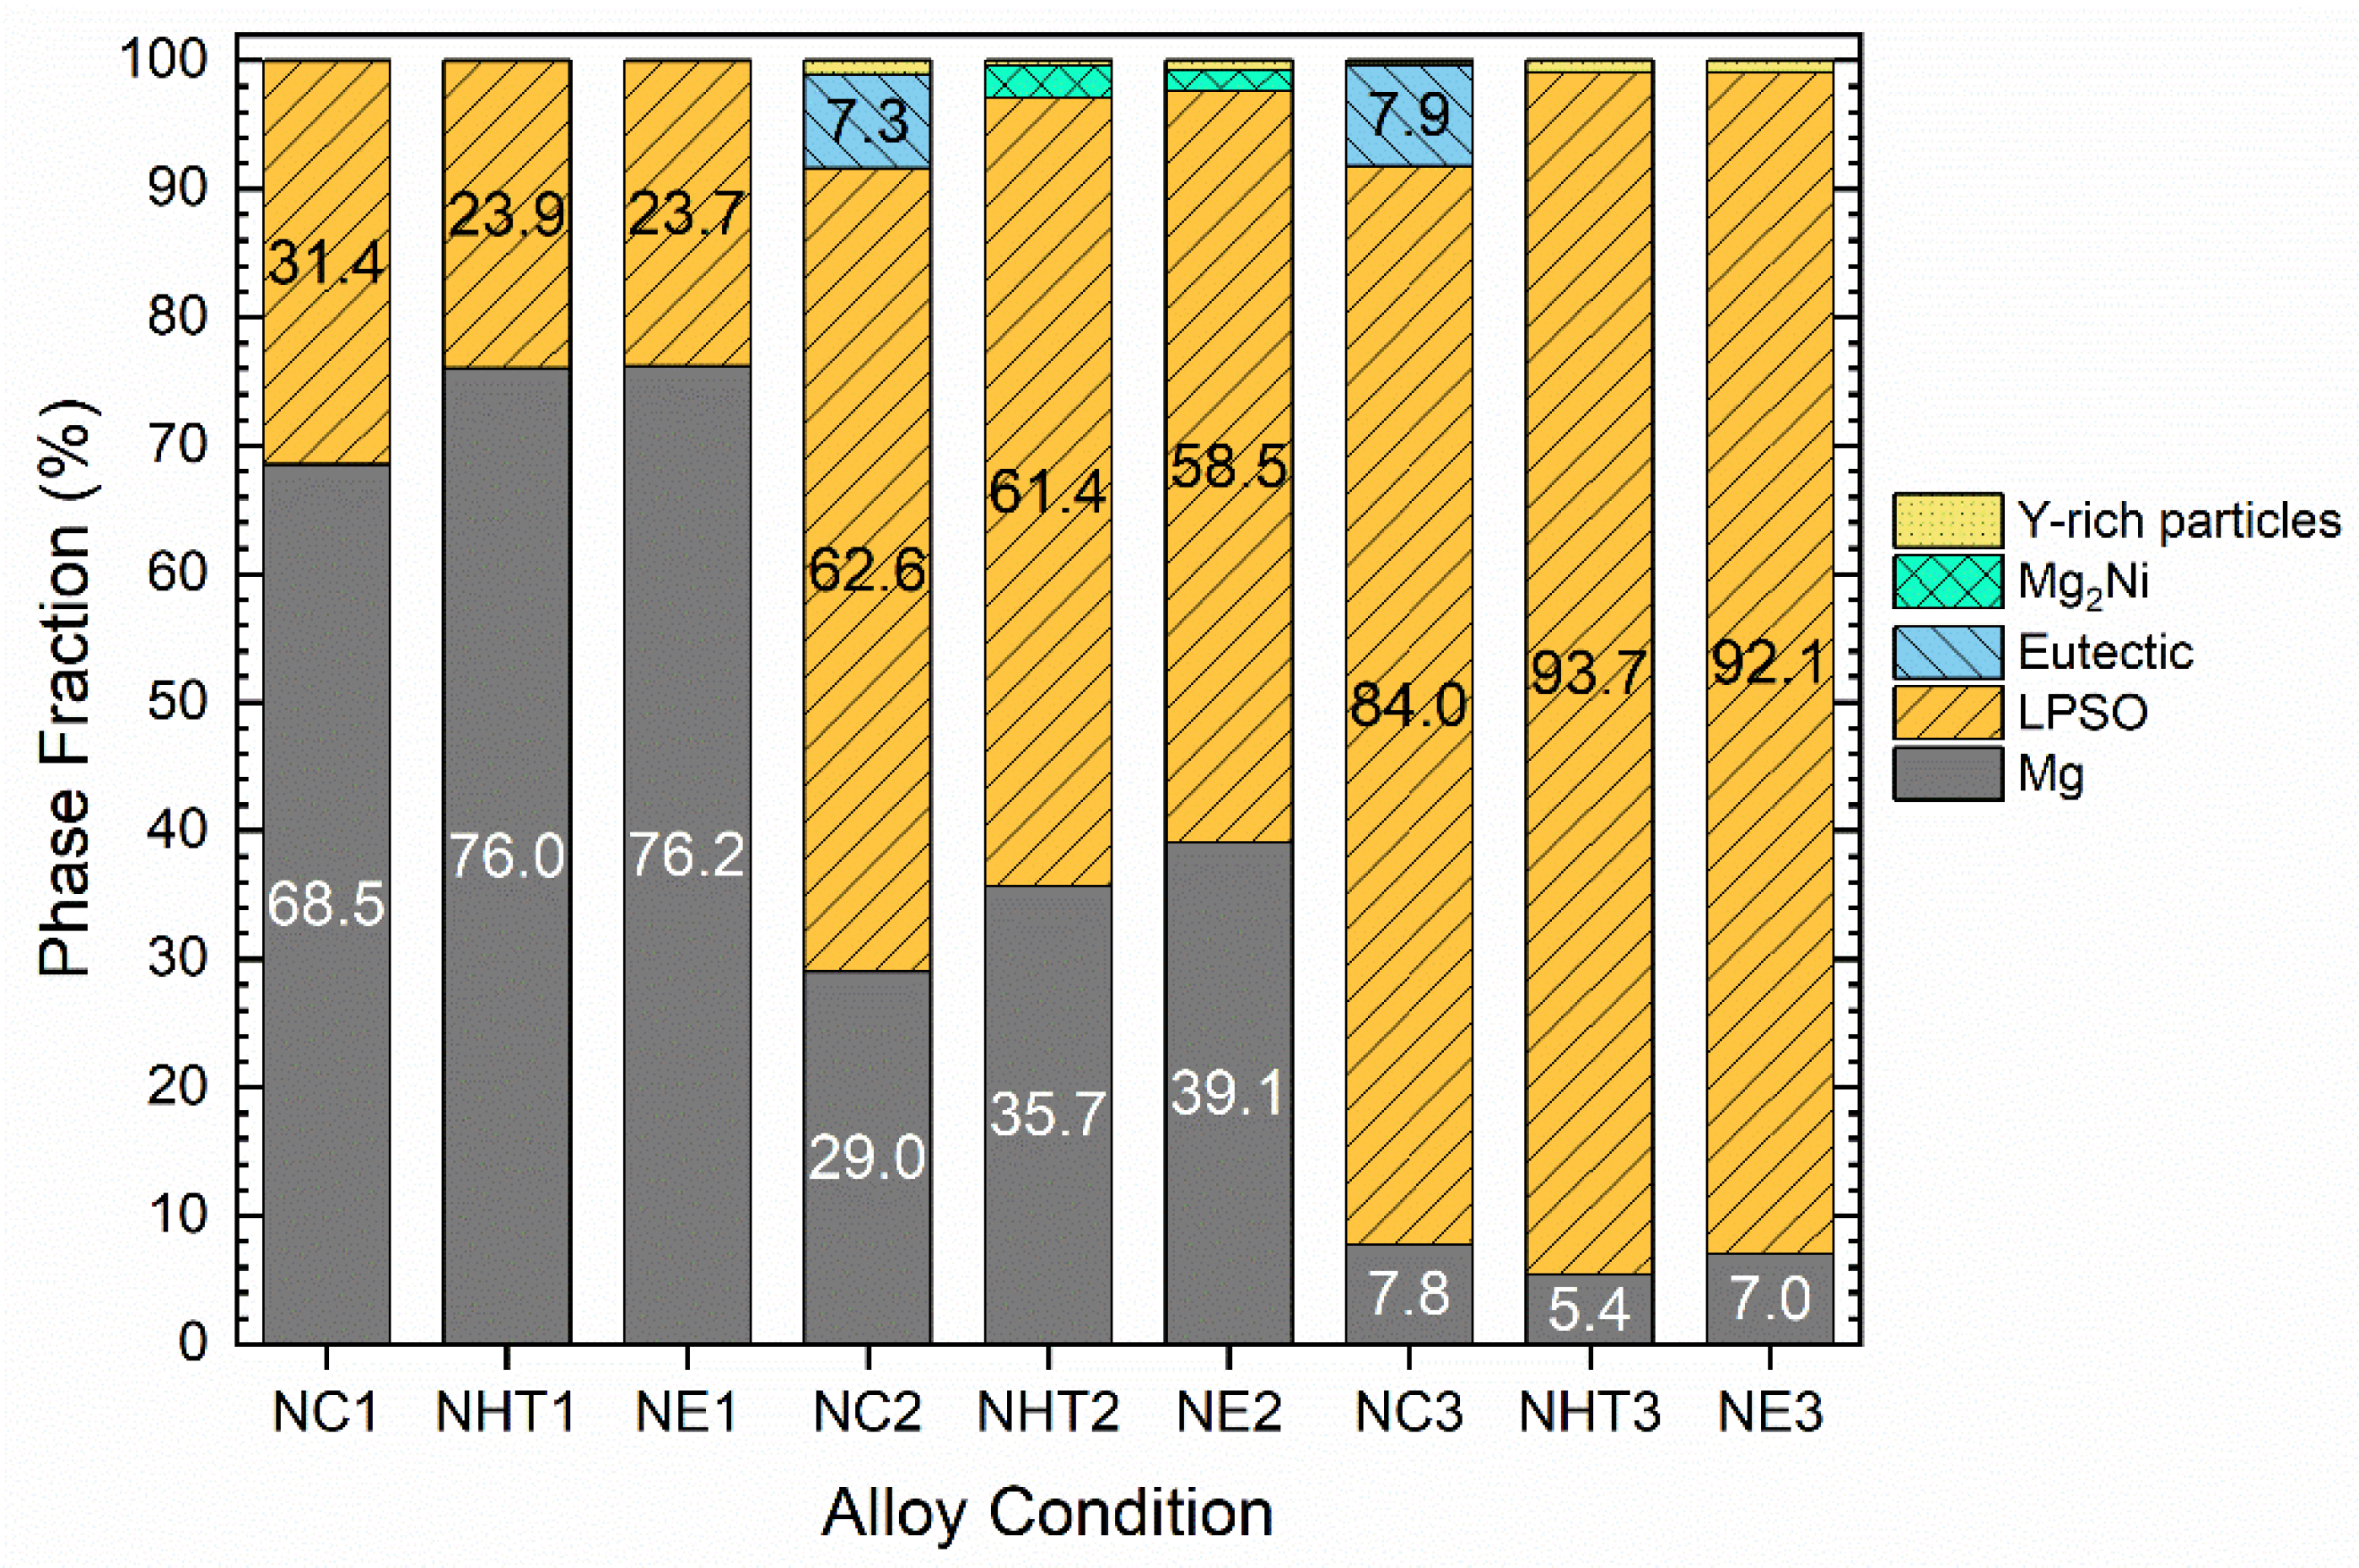
3.1.3. Phase Volume Fractions

Figure 6 shows the phase volume fractions of the Mg-Y-Ni alloys arranged by alloy content and process condition. Standard errors have been calculated for the phases, but the values are too small to clearly show in Figure 6. The standard error for LPSO phase volume fractions is between 1 and 2%, while for the other phases it is less than 1%. Mg and LPSO phases were the most abundant phases, with a Mg/Mg2Ni eutectic forming a minor fraction in the as-cast Mg93Y4Ni3 and Mg91Y5Ni4 alloys. Y-rich particles could also be observed in each of the alloys in fractions of less than 1%. The volumes of Mg phase and LPSO phases were determined foremost by alloy content, with the LPSO phase increasing and Mg phase decreasing as the alloy content increased. Heat treatment had a moderate effect on the relative amounts of Mg phase and LPSO phase, while extrusion showed little to no effect in changing phase fractions.
The LPSO phase volume fraction in the Mg97Y2Ni1 and Mg93Y4Ni3 alloys decreased after heat treatment, with the greater change in the phase volume fraction occurring in the Mg93Y4Ni3 alloy. The decrease in LPSO phase in both alloys was concurrent with an increase in the Mg phase. After extrusion, the Mg93Y4Ni3 alloy showed a further decrease in the LPSO phase volume fraction, while the Mg97Y2Ni1 alloy showed no change in phase volumes. The increase in the Mg phase fraction was correlated with the decrease in Mg content in the LPSO phases after heat treatment and extrusion, which shows that Mg diffuses out from the LPSO phase and increases the volume of the Mg phase in the Mg97Y2Ni1 and Mg93Y4Ni3 alloys. In contrast, the LPSO phase volume fraction increases in the Mg91Y5Ni4 alloy after heat treatment, with the increase apparently due to the elimination of the eutectic structure and a small decrease in the Mg phase. After extrusion, the LPSO phase volume decreased slightly in the Mg91Y5Ni4 alloy, with the Mg phase showing an increase. However, the 1–2% standard error for the LPSO phase volume means the phase volume change in the Mg91Y5Ni4 alloy between heat treatment and extrusion is not significant.
Therefore, the concentration of alloying elements had the most influence on LPSO phase volume fraction in Mg-Y-Ni alloys, while the effect of heat treatment and extrusion was weaker. Yang et al. [43] found, by studying a series of as-cast Mg100-xNixY1 (x = 0.2, 0.5, 0.8, 1.0, 1.5) (at.%) alloys, that the LPSO phase volume fraction increased to 20% at Ni=0.8 (at.%) and then decreased to 15% with a further increase in Ni content, while the secondary phases’ volume fraction always increased with increasing Ni content. This trend of increasing the secondary phase volume fraction with increasing alloy content is also seen in this study.

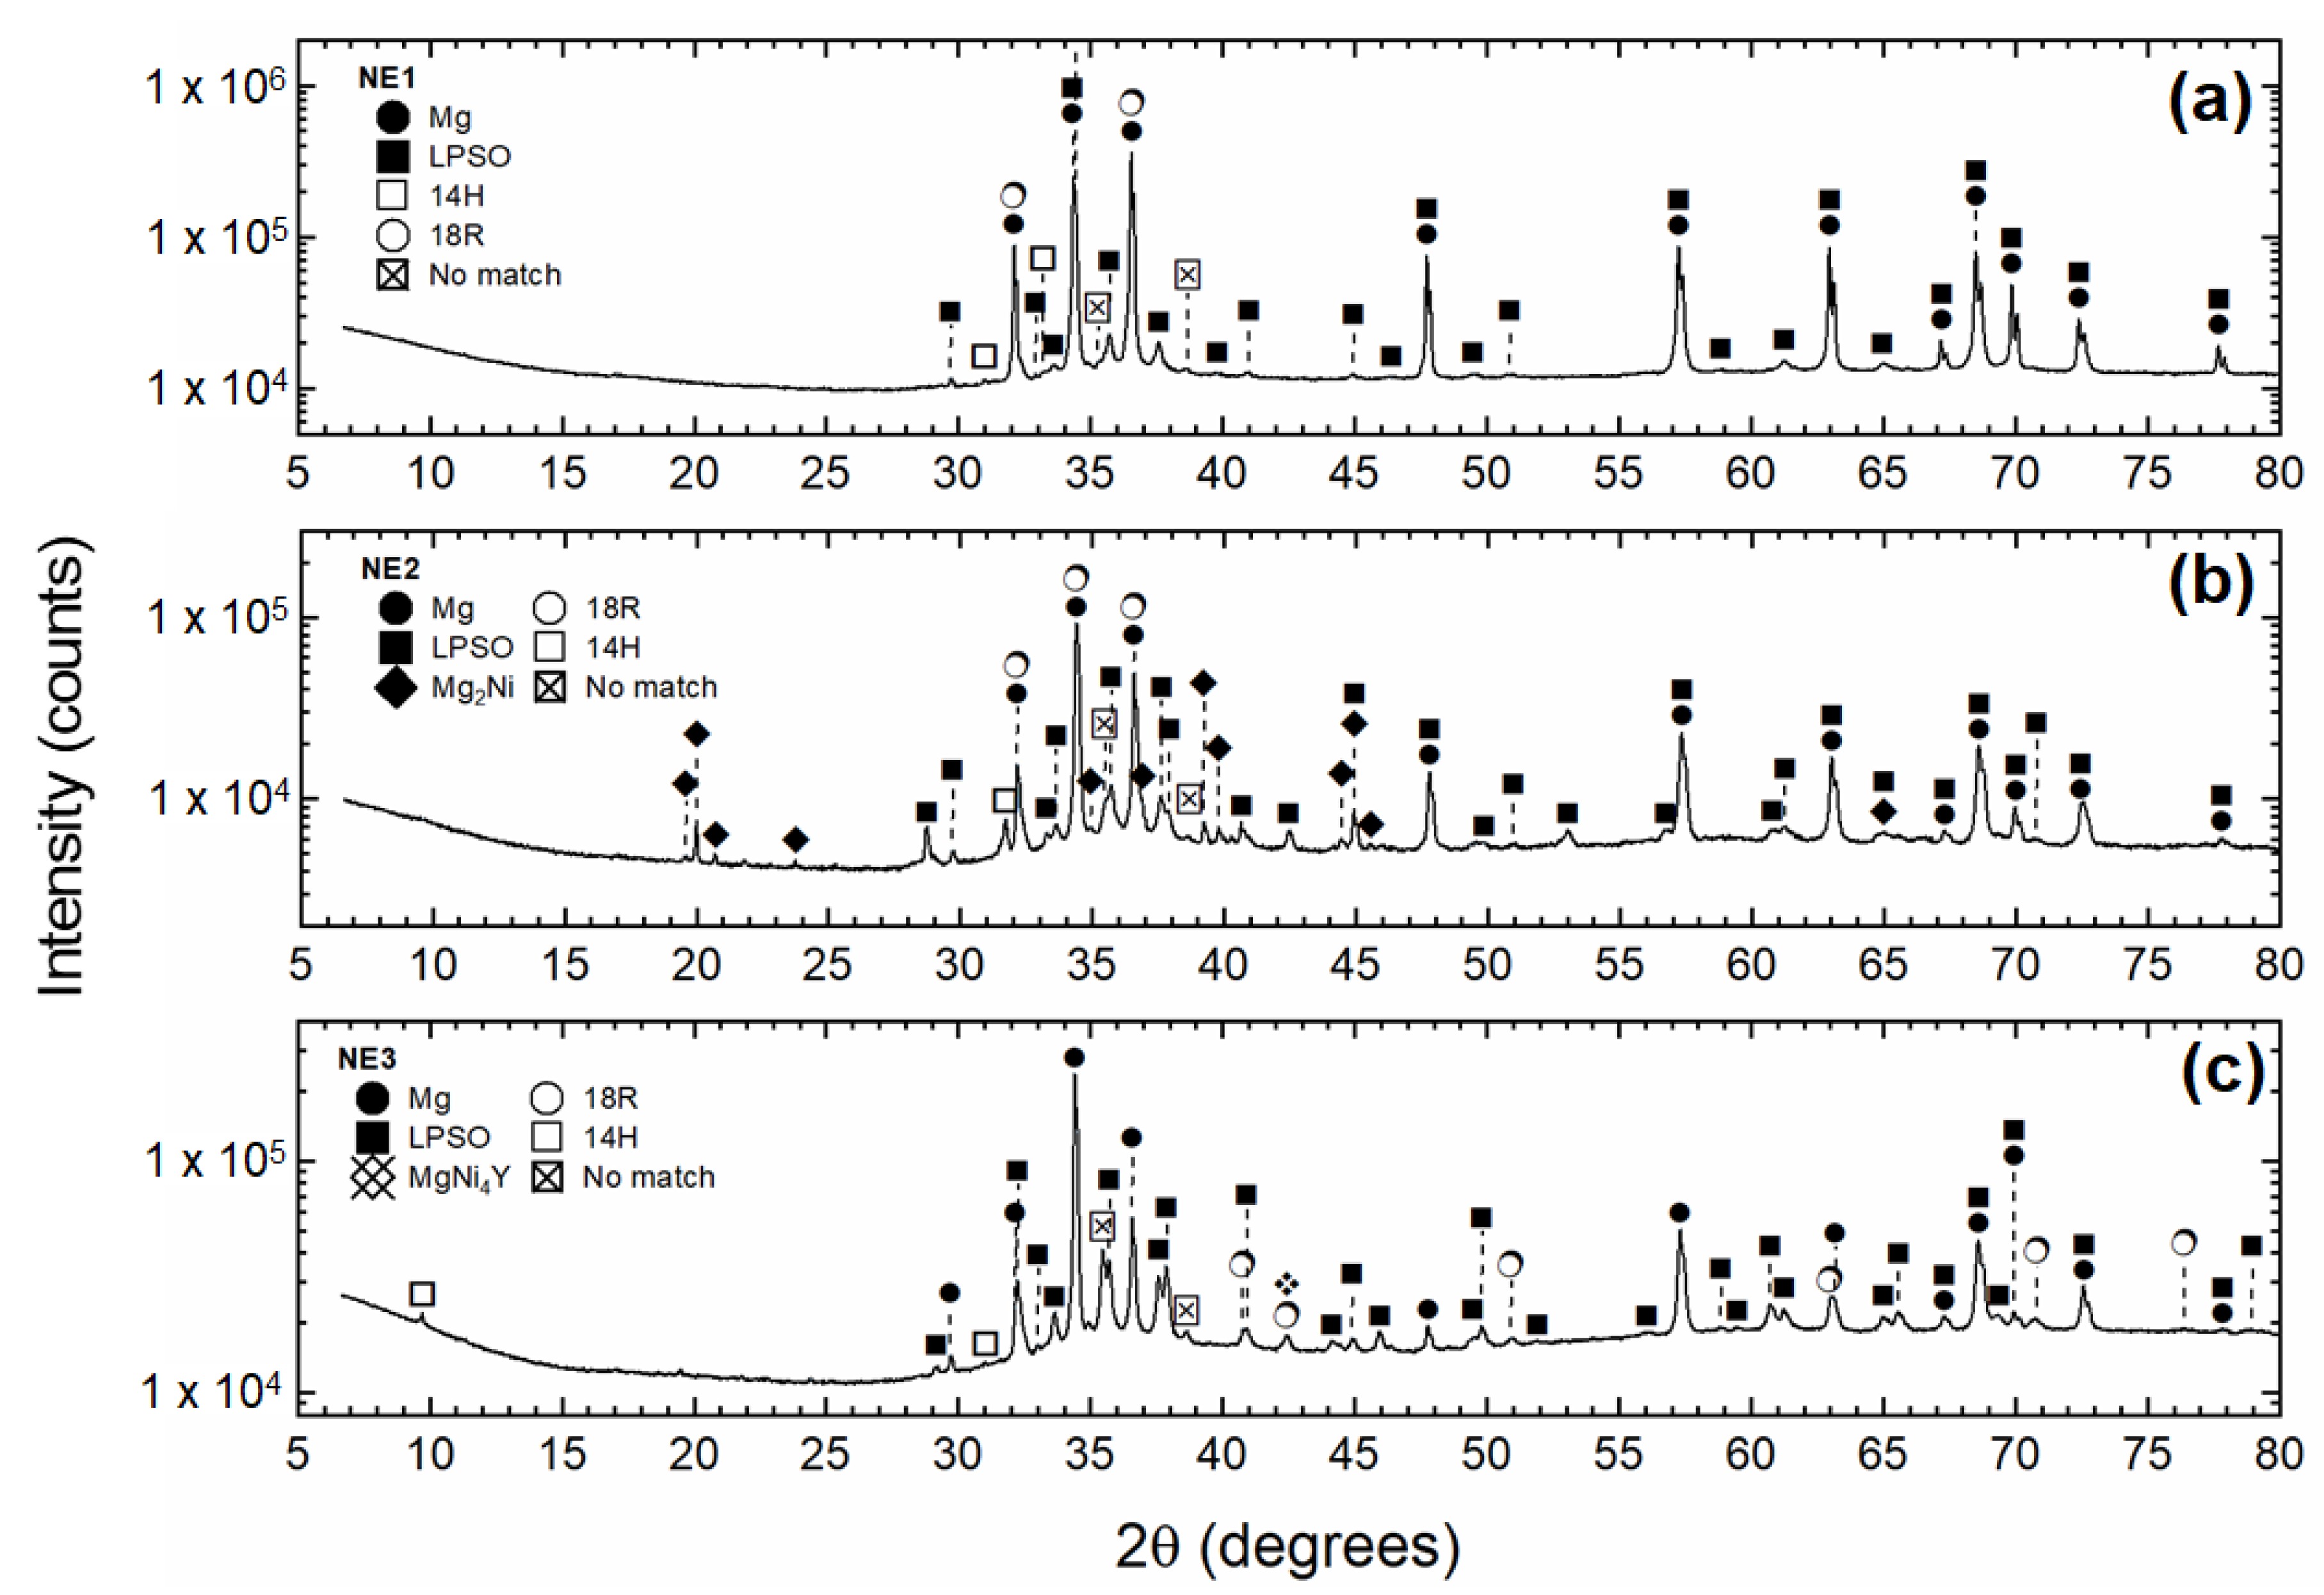
3.1.4. X-ray Diffraction

The XRD patterns of the three extruded Mg-Y-Ni alloys are compared in Figure 7. All three XRD patterns show peaks from the dominant LPSO phases and Mg phase. A limited number of peaks in the Mg97Y2Ni1 and Mg93Y4Ni3 alloys are unique to the 14H polytype, while the 18R polytype has no distinct peaks. The Mg91Y5Ni4 alloy shows distinct XRD peaks for 14H and 18R polytypes, which suggests both LPSO types are present in sufficient volumes for detection.
The pattern for the Mg93Y4Ni3 alloy also shows peaks for Mg2Ni. No XRD peaks are matched to MgYNi4 or yttrium-rich phases, which may be due to the volume fraction of Y-rich particles in the alloys being below the detection limit. There are also a small number of peaks common to the alloys that are not matched by Mg, Mg2Ni, or the simulated LPSO polytypes. The strongest unmatched peak occurs in between the Mg peaks with highest intensity, which is a feature of superlattice structures that include LPSO phases. Therefore, the unidentified peaks could be attributed to unknown LPSO polytypes that are not included in the pattern simulations.

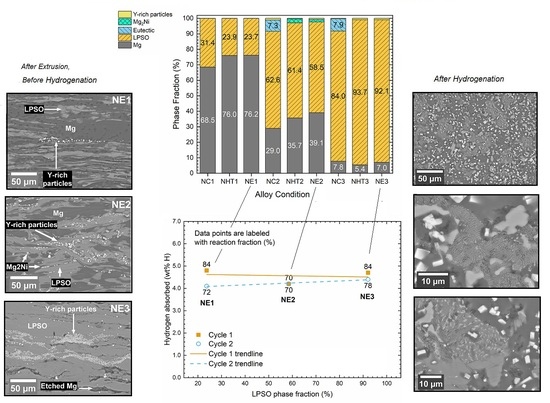
3.2. The Effect of LPSO Phases on Hydrogenation Properties of Mg-Y-Ni Alloys

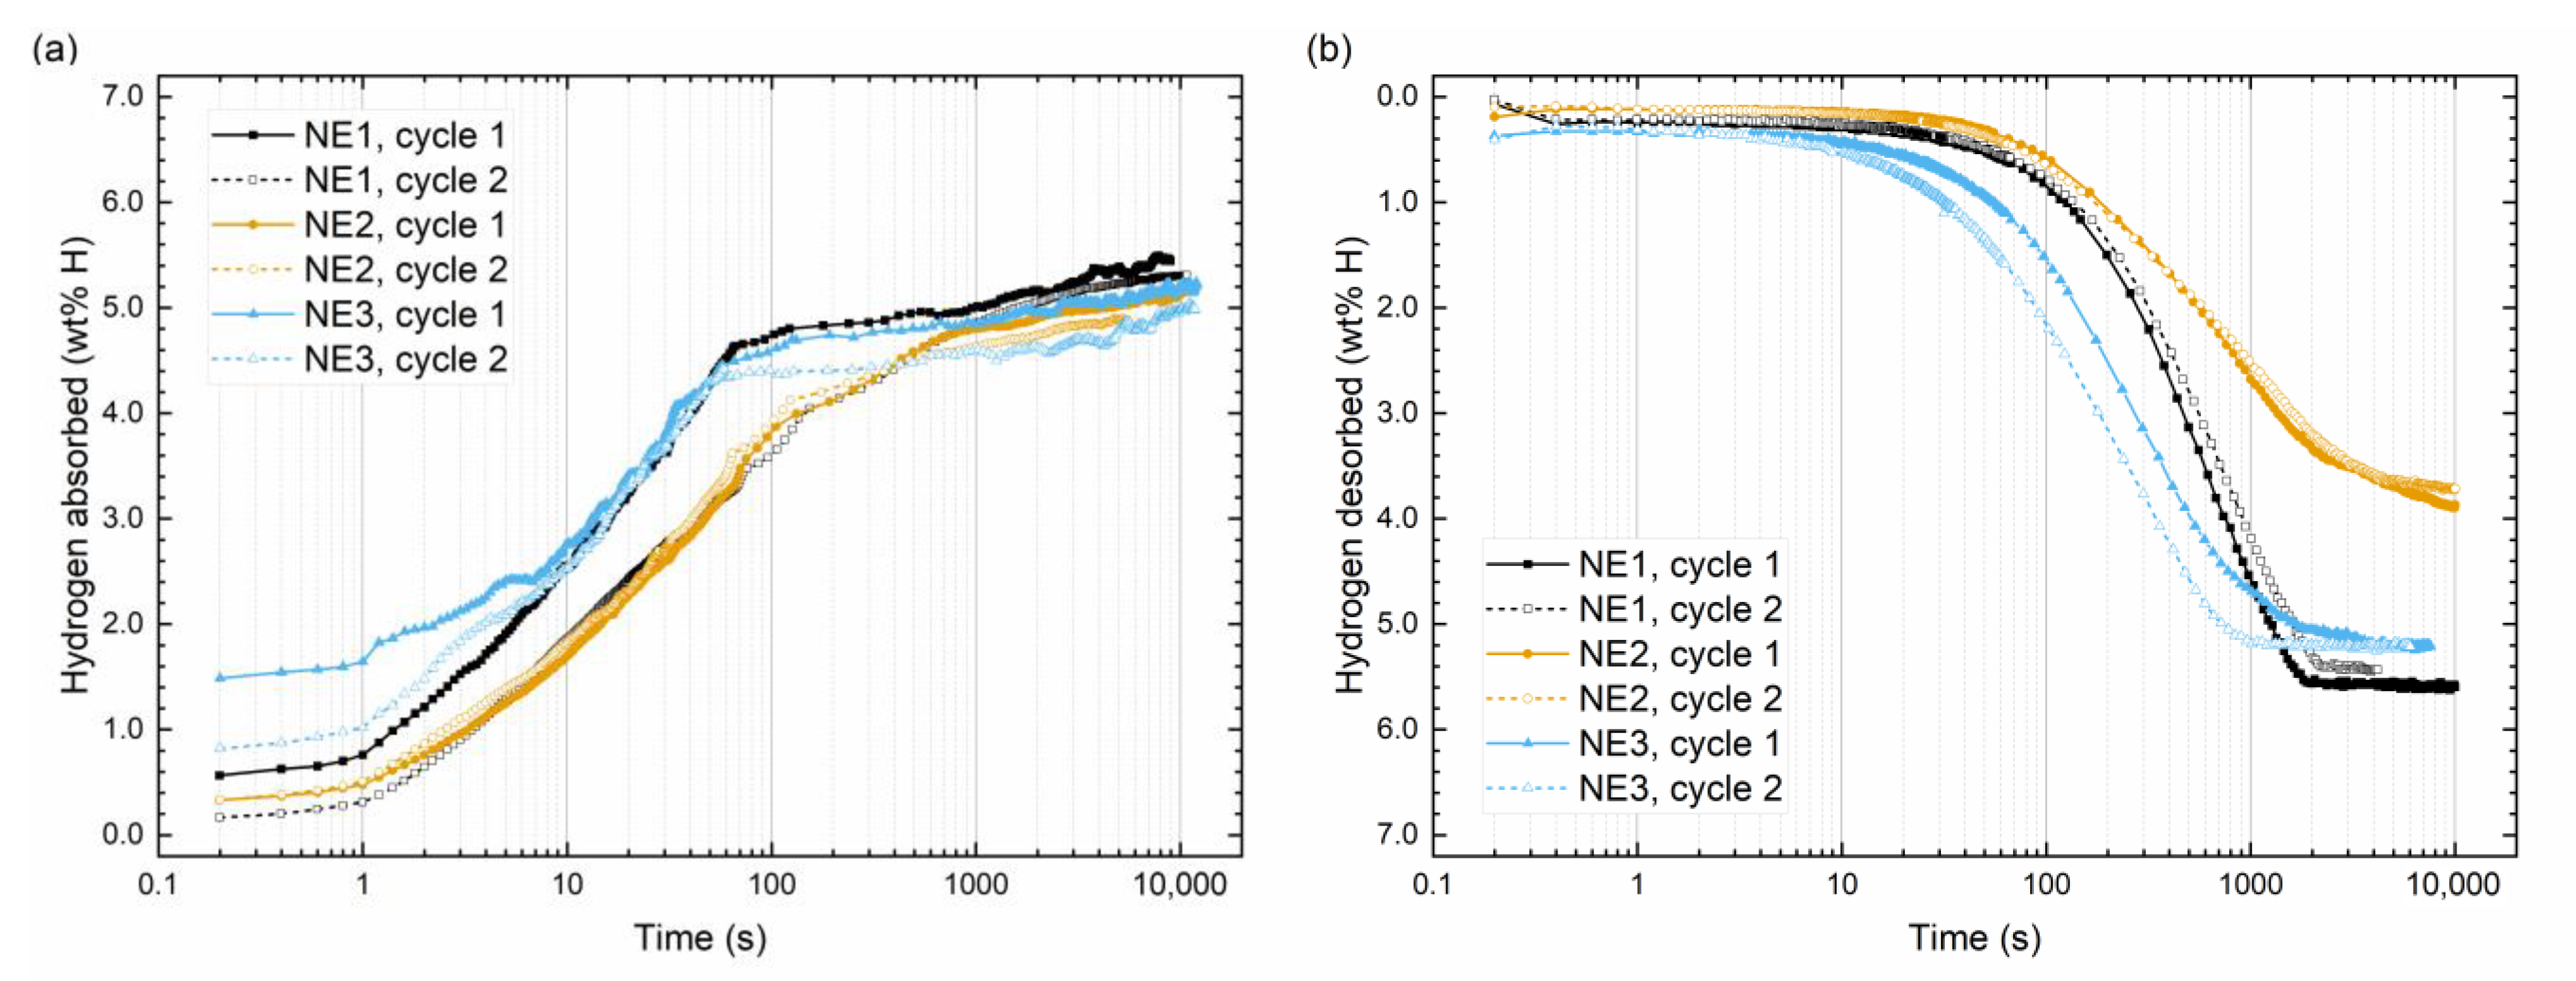
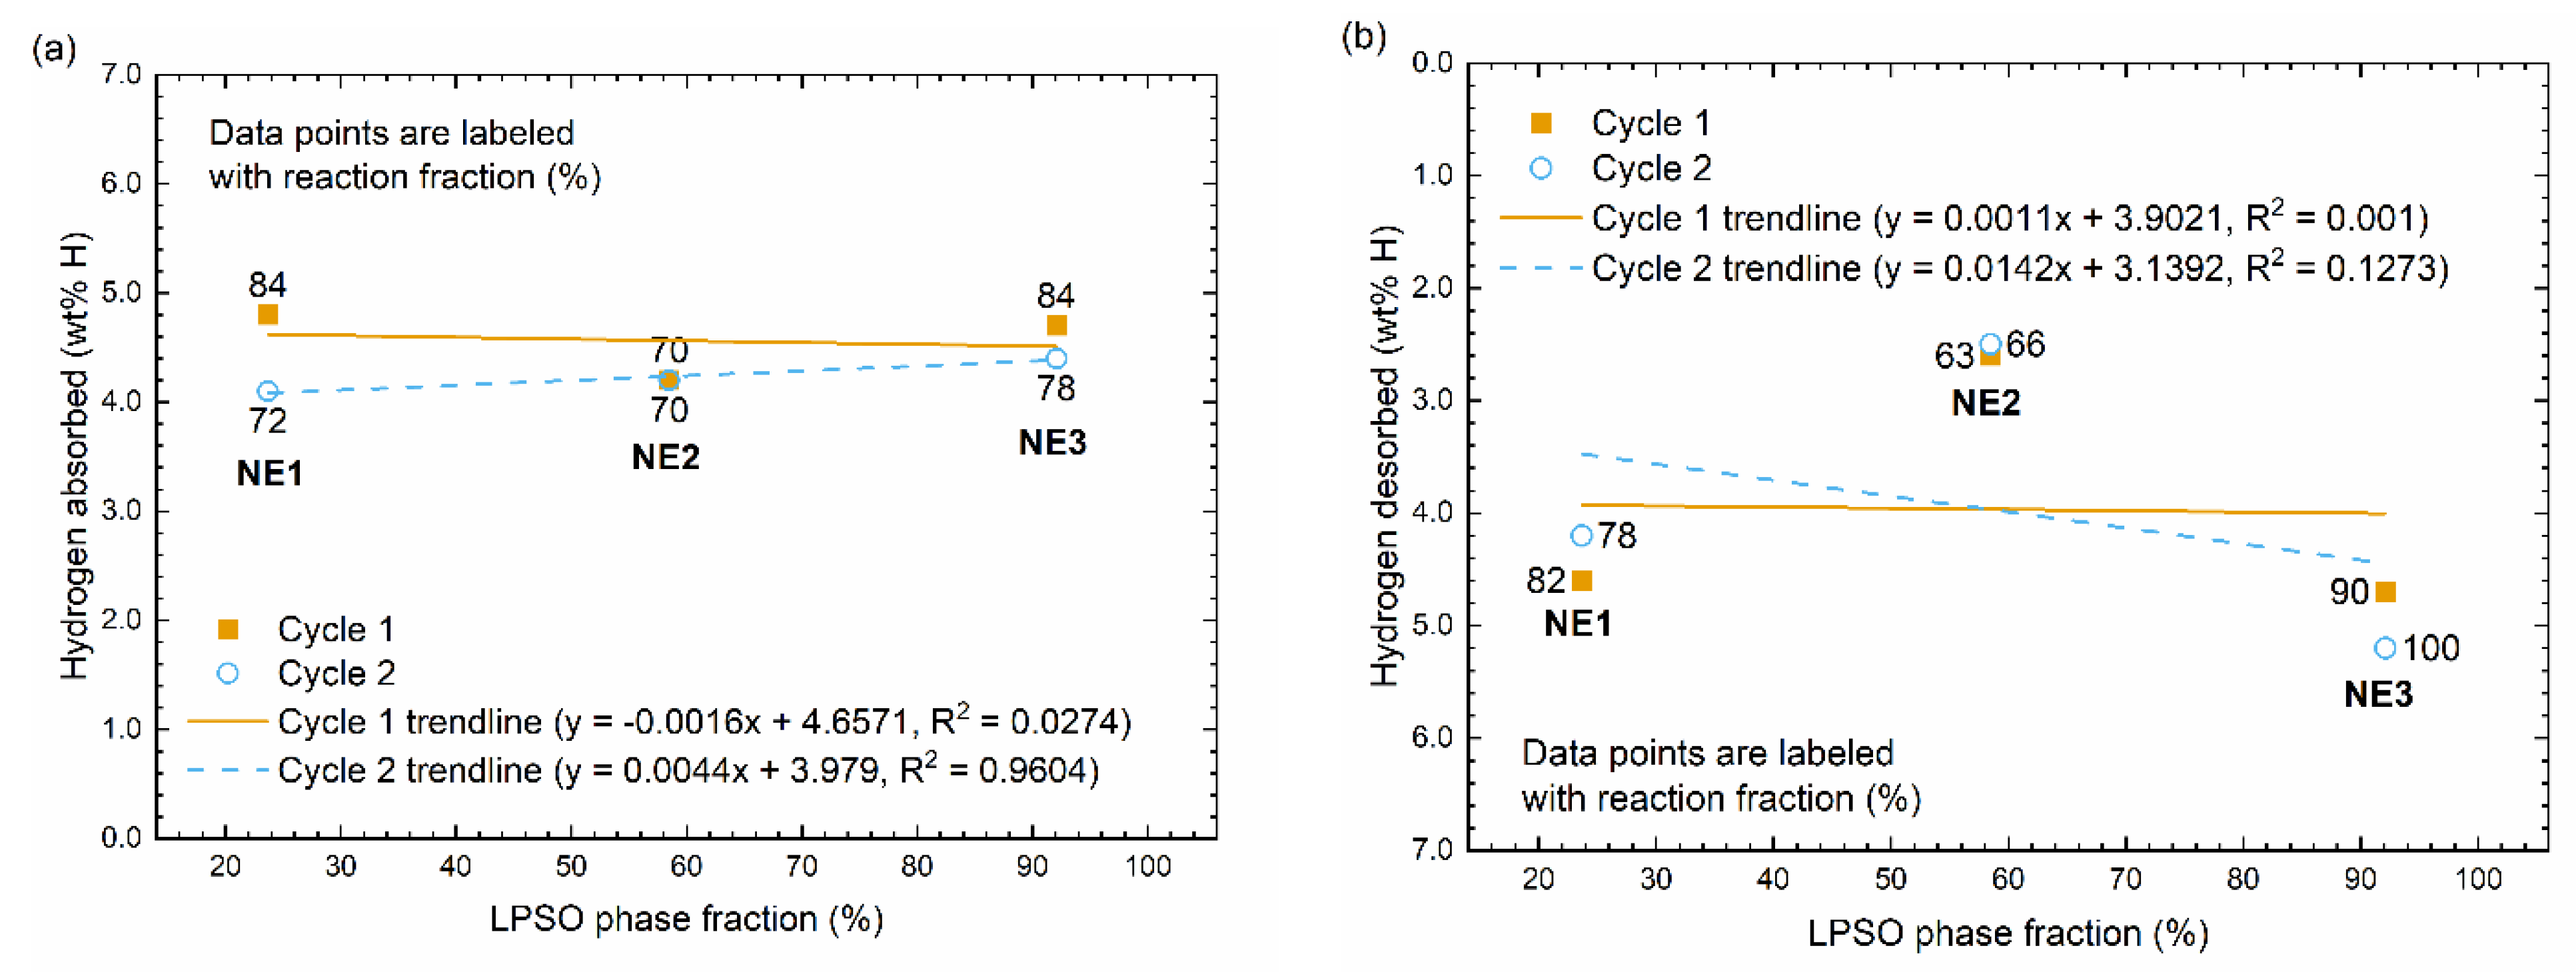
3.2.1. Absorption/Desorption Kinetics

Figure 8 presents the hydrogen absorption and desorption kinetics for the three extruded Mg-Ni-Y alloys at 300 °C. Measurements were taken after the ball-milled powders were activated by hydrogen cycling. Absorption measurements in Figure 8a were immediately followed by the corresponding desorption measurements in Figure 8b.
All three extruded Mg-Y-Ni alloys have absorption curves with three ‘low-rapid-plateau’ stages. Absorption kinetics increase with increasing solute content within 100 s, but after 10,000 s the effective absorption capacity is comparable for the three alloys within an experimental error at 5.3 ± 0.2 wt.% H. At this point, all three alloys achieved the reversible hydrogen capacities, as determined by PCT measurements. The extruded alloys in this study show comparable effective absorption capacities and kinetics to previous studies on the hydrogen storage properties of Mg-Y-Ni alloys [37,38,45,61], which generally report a hydrogen absorption of 5.0 wt.% H within a few thousand seconds at 300 °C. The hydrogen desorption curves also show the same three stages, but the desorption kinetics are much slower compared to absorption at the same temperature. After 10,000 s Mg97Y2Ni1 and Mg91Y5Ni4 completely desorbed 5.4 ± 0.2 wt.% H and 5.2 ± 0.2 wt.% H, respectively, but Mg93Y4Ni3 alloy desorbed only 3.7 ± 0.2 wt.% H without reaching a plateau. The Mg-Y-Ni alloys all have slower desorption kinetics compared to previous studies [37,45,61], as the previous works report alloys with similar desorption capacities realized within several hundreds of seconds instead of the few thousands of seconds seen in Figure 8b.
To illustrate the effect of increasing the LPSO phase volume fraction on hydrogen absorption and desorption kinetics, the effective hydrogen capacities of the alloys are plotted as a function of LPSO phase volume fraction in Figure 9. Figure 9a shows there are no significant differences in hydrogen absorption capacity between the alloys. Moreover, no consistent trend is seen between hydrogen desorption capacity and LPSO phase volume fraction in Figure 9b. It is curious that Mg93Y4 Ni3 diverges so significantly from Mg97Y2Ni1 and Mg91Y5Ni4 in desorption kinetics, while being quite comparable in its absorption kinetics. The expectation is that all hydrogen kinetics would increase with increasing LPSO phase volume fraction, given that alloy and powder preparation has been controlled in all other aspects. The divergence of Mg93Y4Ni3 is considered further with an informed discussion of the literature.
The relatively slow desorption kinetics of Mg93Y4Ni3 cannot be explained by insufficient catalyst content, as Mg97Y2Ni1 contains less nickel and yttrium yet has faster desorption kinetics. The similarity between the absorption kinetics of previous studies [11,37,38,45,62,63,64,65] and this study indicates that the Mg-Y-Ni powders contain nanocomposites with similar features shown to improve hydrogenation properties, which are generally 50 nm Mg grains decorated with 10–20 nm YH2 nanocatalysts. As the type and size of structures in the nanocomposites are quite similar for all the alloys to show increased absorption kinetics, hydrogen desorption has to be impacted at the MgH2/nanocatalyst interface. Li et al. [38] have shown that hydrogen capacities and kinetics degrade in decomposed LPSO nanocomposites due to nanocatalyst agglomeration on the surface of Mg/MgH2 grains, and it is assumed that the slow desorption kinetics of Mg93Y4Ni3 alloys in this study are similarly associated with heterogeneous nanocatalyst distribution in the decomposed LPSO nanocomposites. It is also assumed that any irregular nanocatalyst distribution in Mg91Y5Ni4 alloy is overturned by an increase in MgH2/nanocatalyst interfaces.

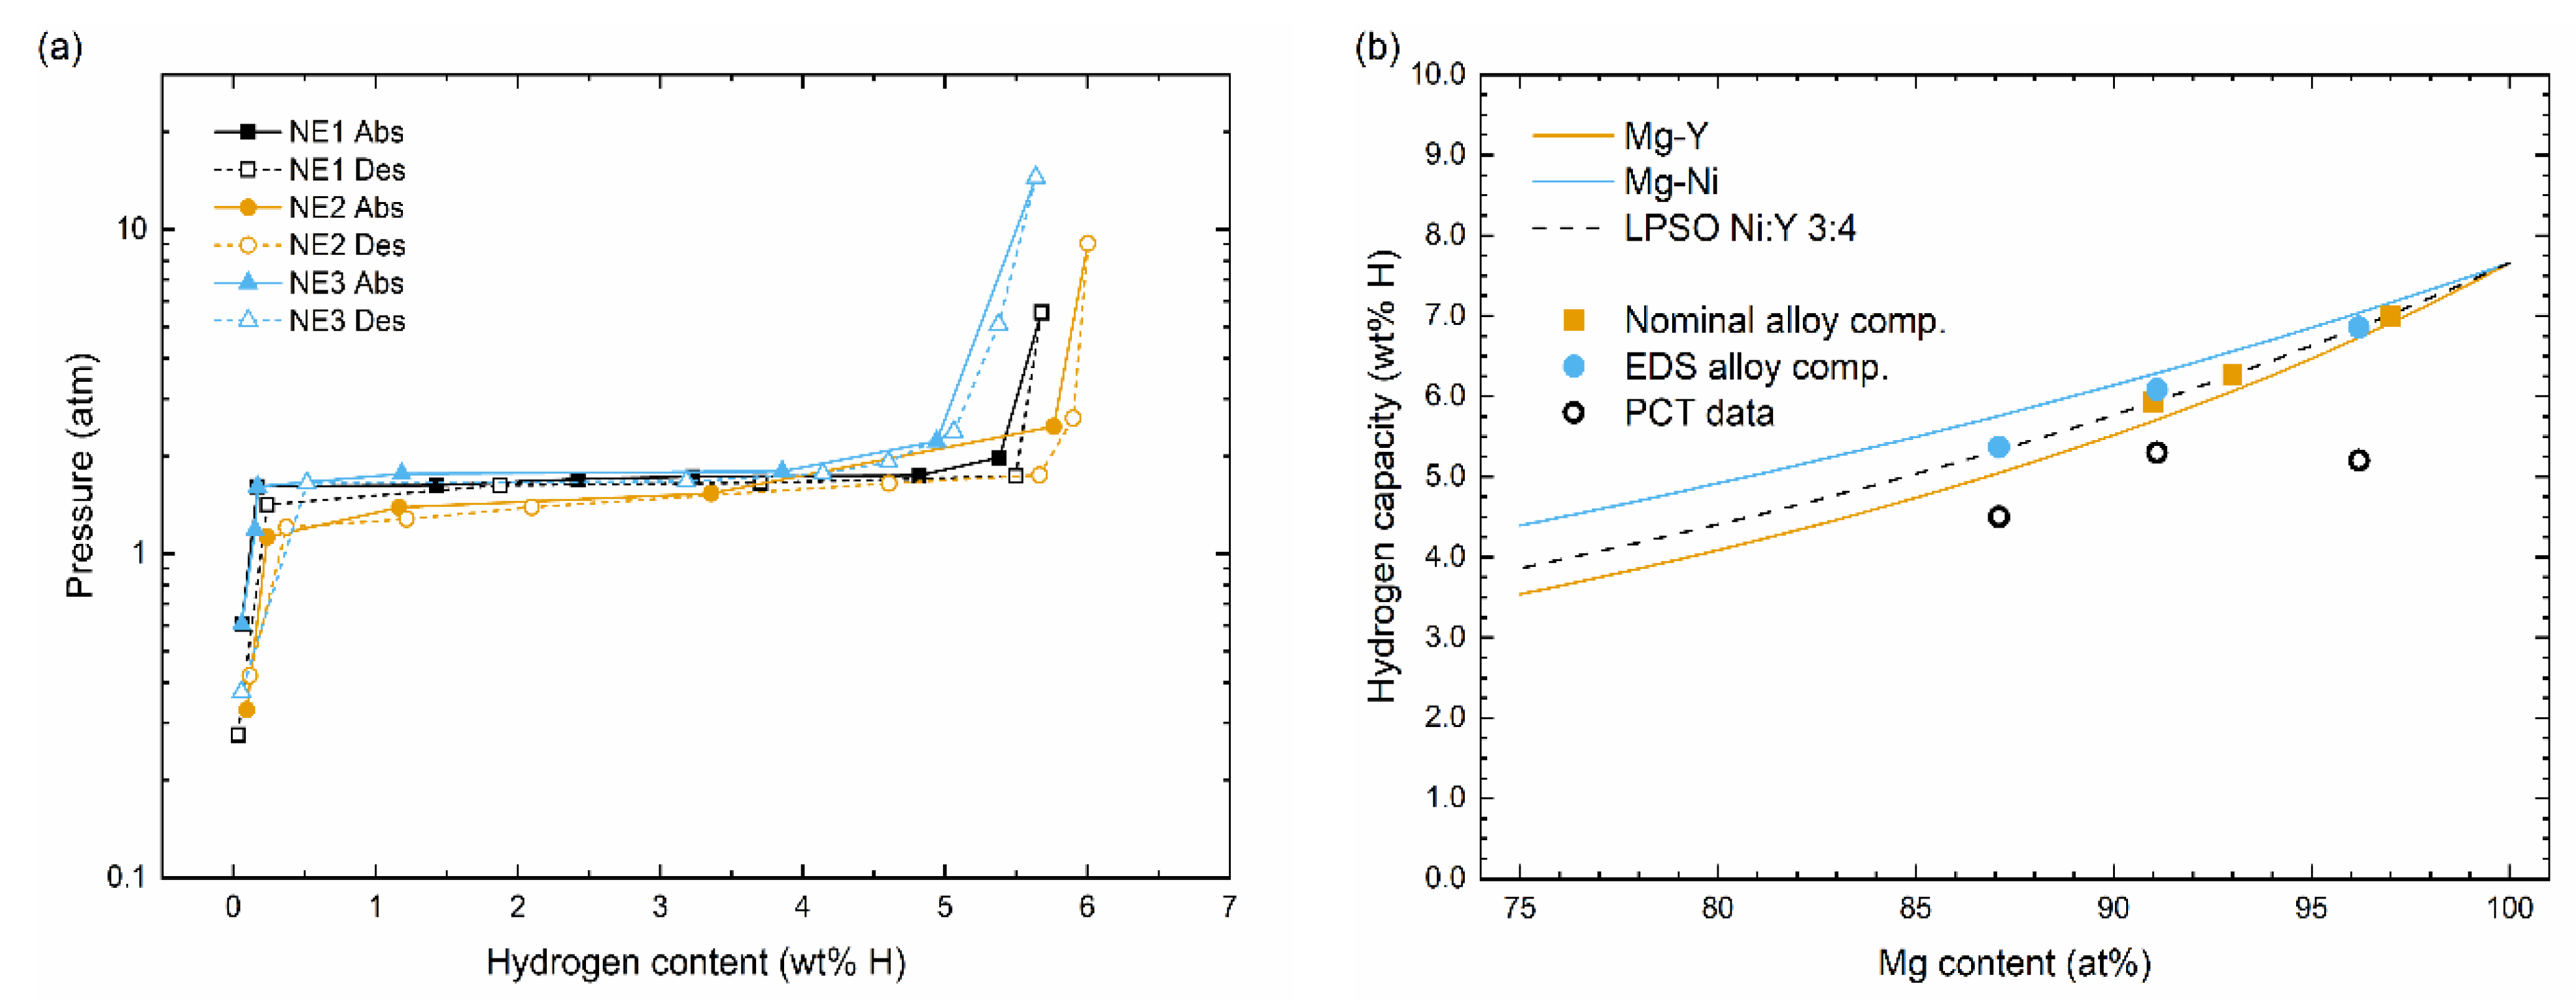
3.2.2. Pressure–Composition Isotherms

Figure 10a shows the pressure–composition isotherms for the powders of extruded Mg-Y-Ni alloys at 300 °C. All three alloys exhibit a broad pressure plateau with low hysteresis, which indicates that the Mg/MgH2 reaction is reversible. No abrupt changes are observed in any of the curves that would indicate the formation of other hydride phases in the alloy powders, although the positions of the data points for Mg93Y4Ni3 (NE2) and Mg91Y5Ni4 (NE3) may obscure the formation of Mg2NiH4 at the right-hand edge of the pressure plateau; Mg2NiH4 has been observed in PC isotherms of Mg-Y-Ni alloys in other studies [37,40,62]. There are no significant differences in the plateau pressures of the Mg-Y-Ni powders, which indicates that the thermodynamics of the Mg-MgH2 reaction are unaltered by alloying elements.
Figure 10b compares the reversible hydrogen capacities from Figure 10a with the calculated hydrogen capacities of the alloys. The calculated hydrogen curves in Figure 10b assume that all hydride-forming atoms are available for reaction and that alloys of the given compositions are fully hydrogenated. The plateau pressures, maximum hydrogen capacities, and reversible hydrogen capacities are further summarized in Table 2. The reversible capacities of the alloys in this study are all lower than the calculated capacities, although the maximum hydrogen capacities of the Mg93Y4Ni3 (NE2) and Mg91Y5Ni4 (NE3) alloys in Figure 10a do match the calculated capacities. When these results are considered together with Figure 8 it can be seen that the Mg-Y-Ni alloys in this study generally absorb and desorb 5.3 ± 0.3 wt.% H, which is consistent with results from Mg-Y-Ni alloys with varied compositions by Sun et al. [66], Yang et al. [67], and others [37,46,47].

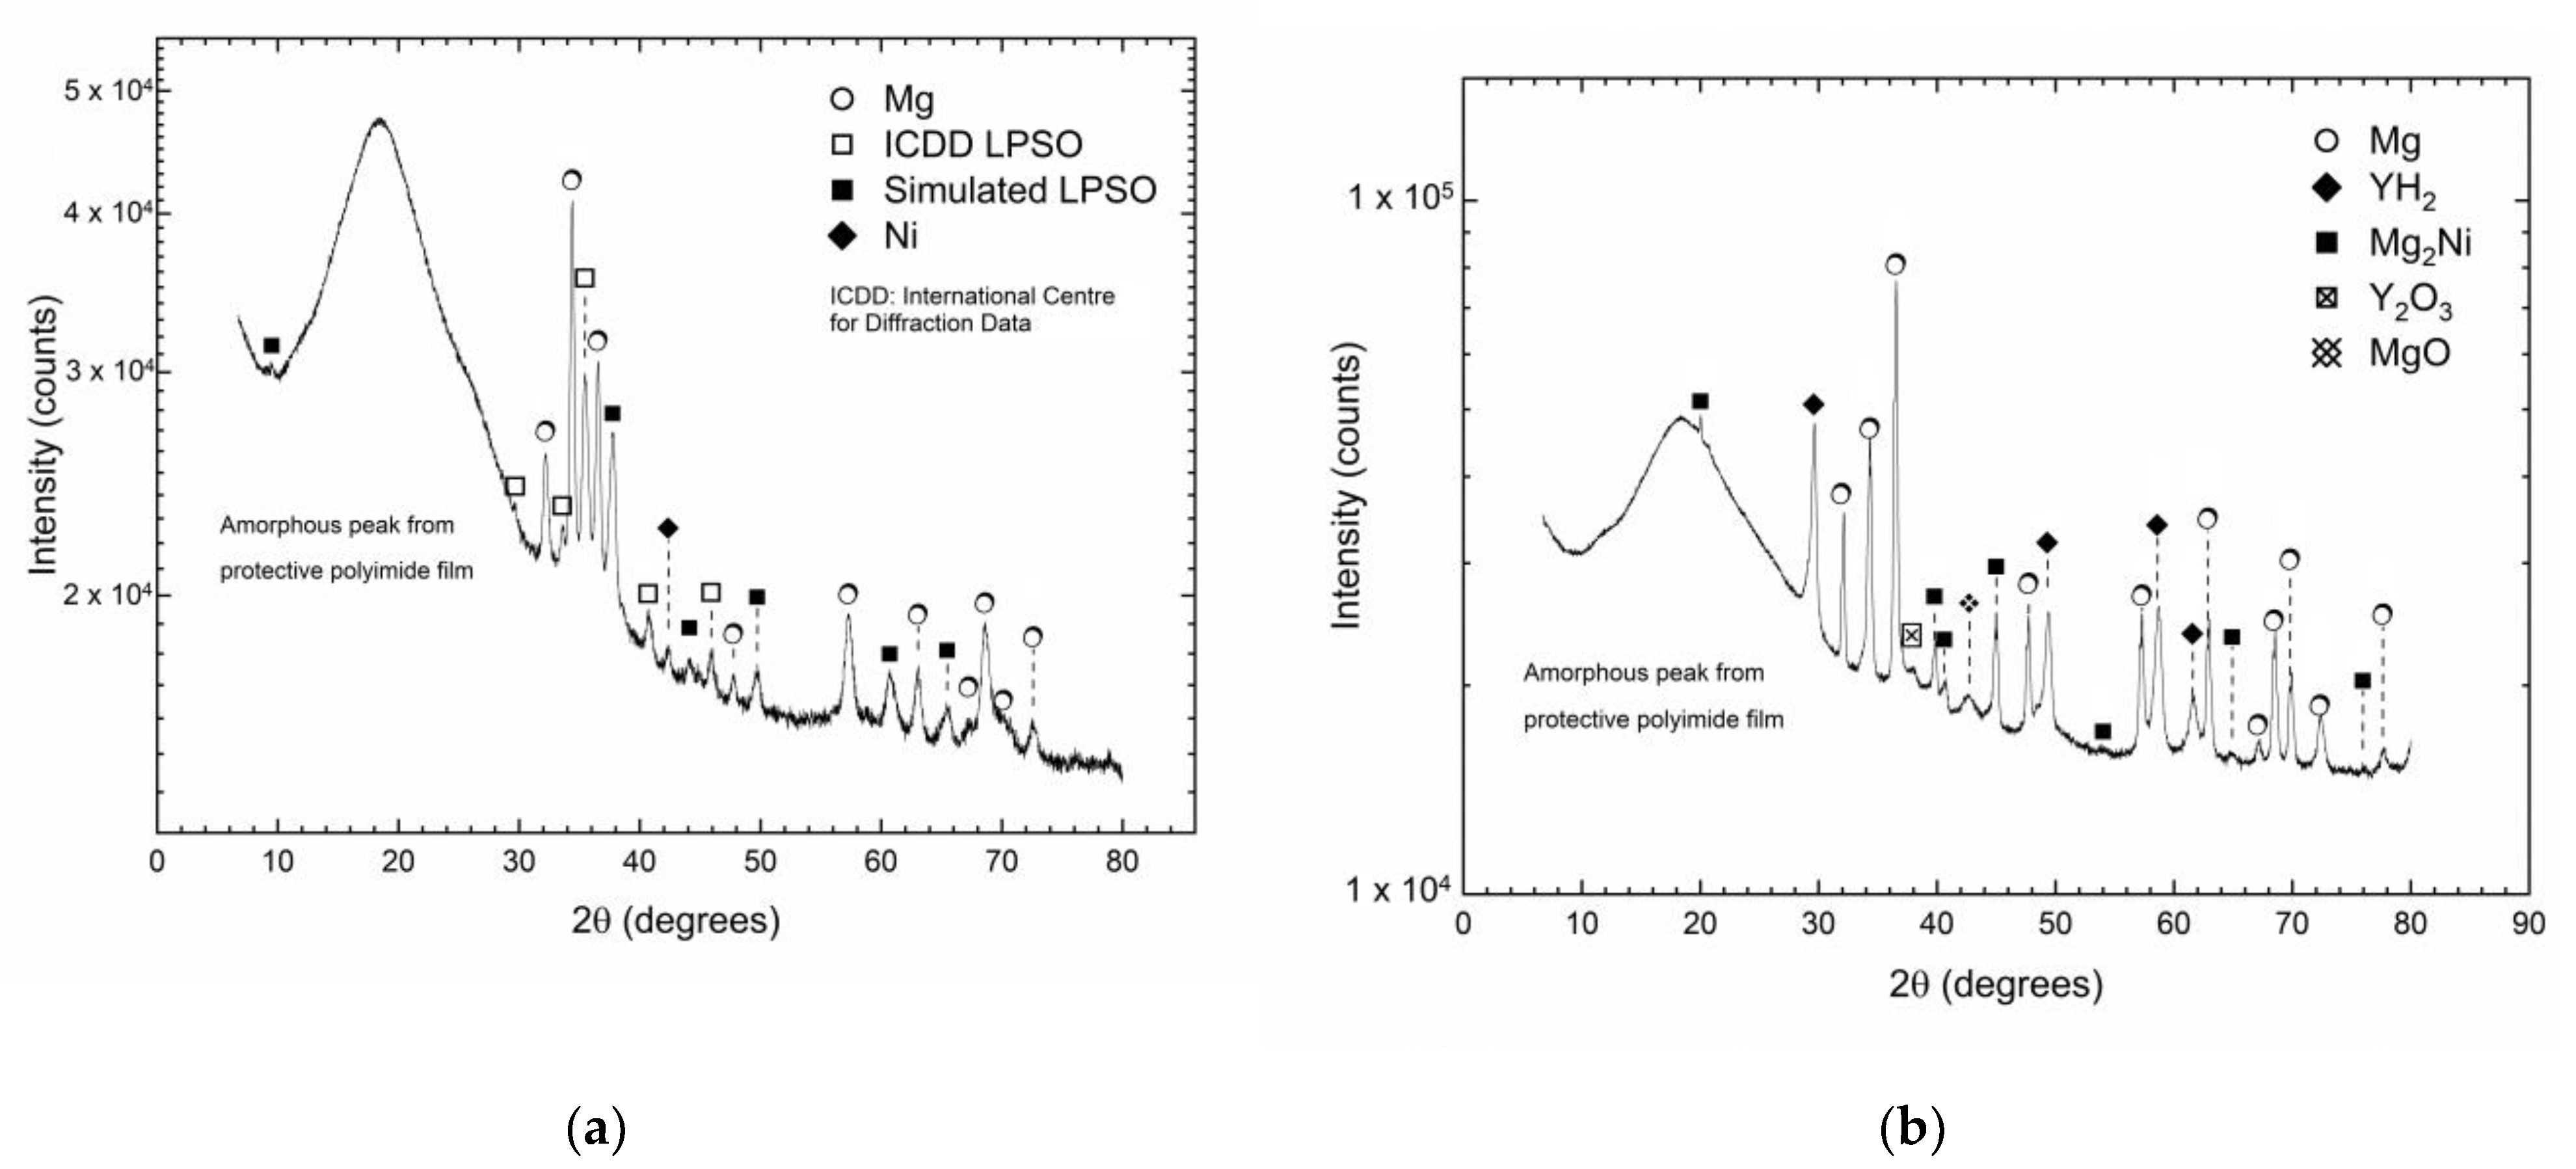
3.2.3. XRD of Mg91Y5Ni4 before and after Hydrogen Experiments

LPSO phase decomposition after the hydrogenation of Mg-RE alloys has been reported by attributing the absence of characteristic LPSO peaks in XRD patterns of dehydrogenated samples to the breakdown of long-range order during decomposition [37,39,40,45,46]. XRD patterns are presented for the Mg91Y5Ni4 alloy with the highest LPSO phase fraction in Figure 11, where two patterns collected before and after (de)hydrogenation are compared to see if the same absence of LPSO peaks occurs. Figure 11a shows the XRD pattern for swarf machined from the heat-treated Mg91Y5Ni4 alloy (XRD measurements were carried out on the heat-treated alloy, as not enough of the extruded alloy was available, but XRD results presented in [50] confirm that the LPSO phases for both process conditions are the same). The LPSO phase is identified in the machined material before hydrogenation from peaks that match LPSO phase (00-036-1273) in the International Centre for Diffraction Data (ICDD) PDF4+ database, with additional peaks matched to the simulated LPSO patterns used for the analysis of the XRD patterns in Figure 7.
Figure 11b shows the XRD pattern of the dehydrogenated Mg91Y5Ni4 powder after all hydrogen experiments were completed. Low intensity peaks of Y2O3 and MgO indicate a small amount of the sample oxidized before XRD measurement. No peaks can be observed for the additional reflections produced by the LPSO phase, which is interpreted to mean that the long-range order of the phase has been destroyed. Furthermore, the expected decomposition products of Mg, Mg2Ni, and YH2 are all present in the dehydrogenated powder. Taken together, these observations show that the LPSO phase has decomposed in the Mg91Y5Ni4 powder after (de)hydrogenation. As this has been shown for the alloy with the highest LPSO phase fraction, it is reasonable to extend the same behaviour to the other alloys. No other hydride phases are identified in the powder, including MgH2 and Mg2NiHx, which indicates the effective desorption of hydrogen from the Mg91Y5Ni4 alloy.

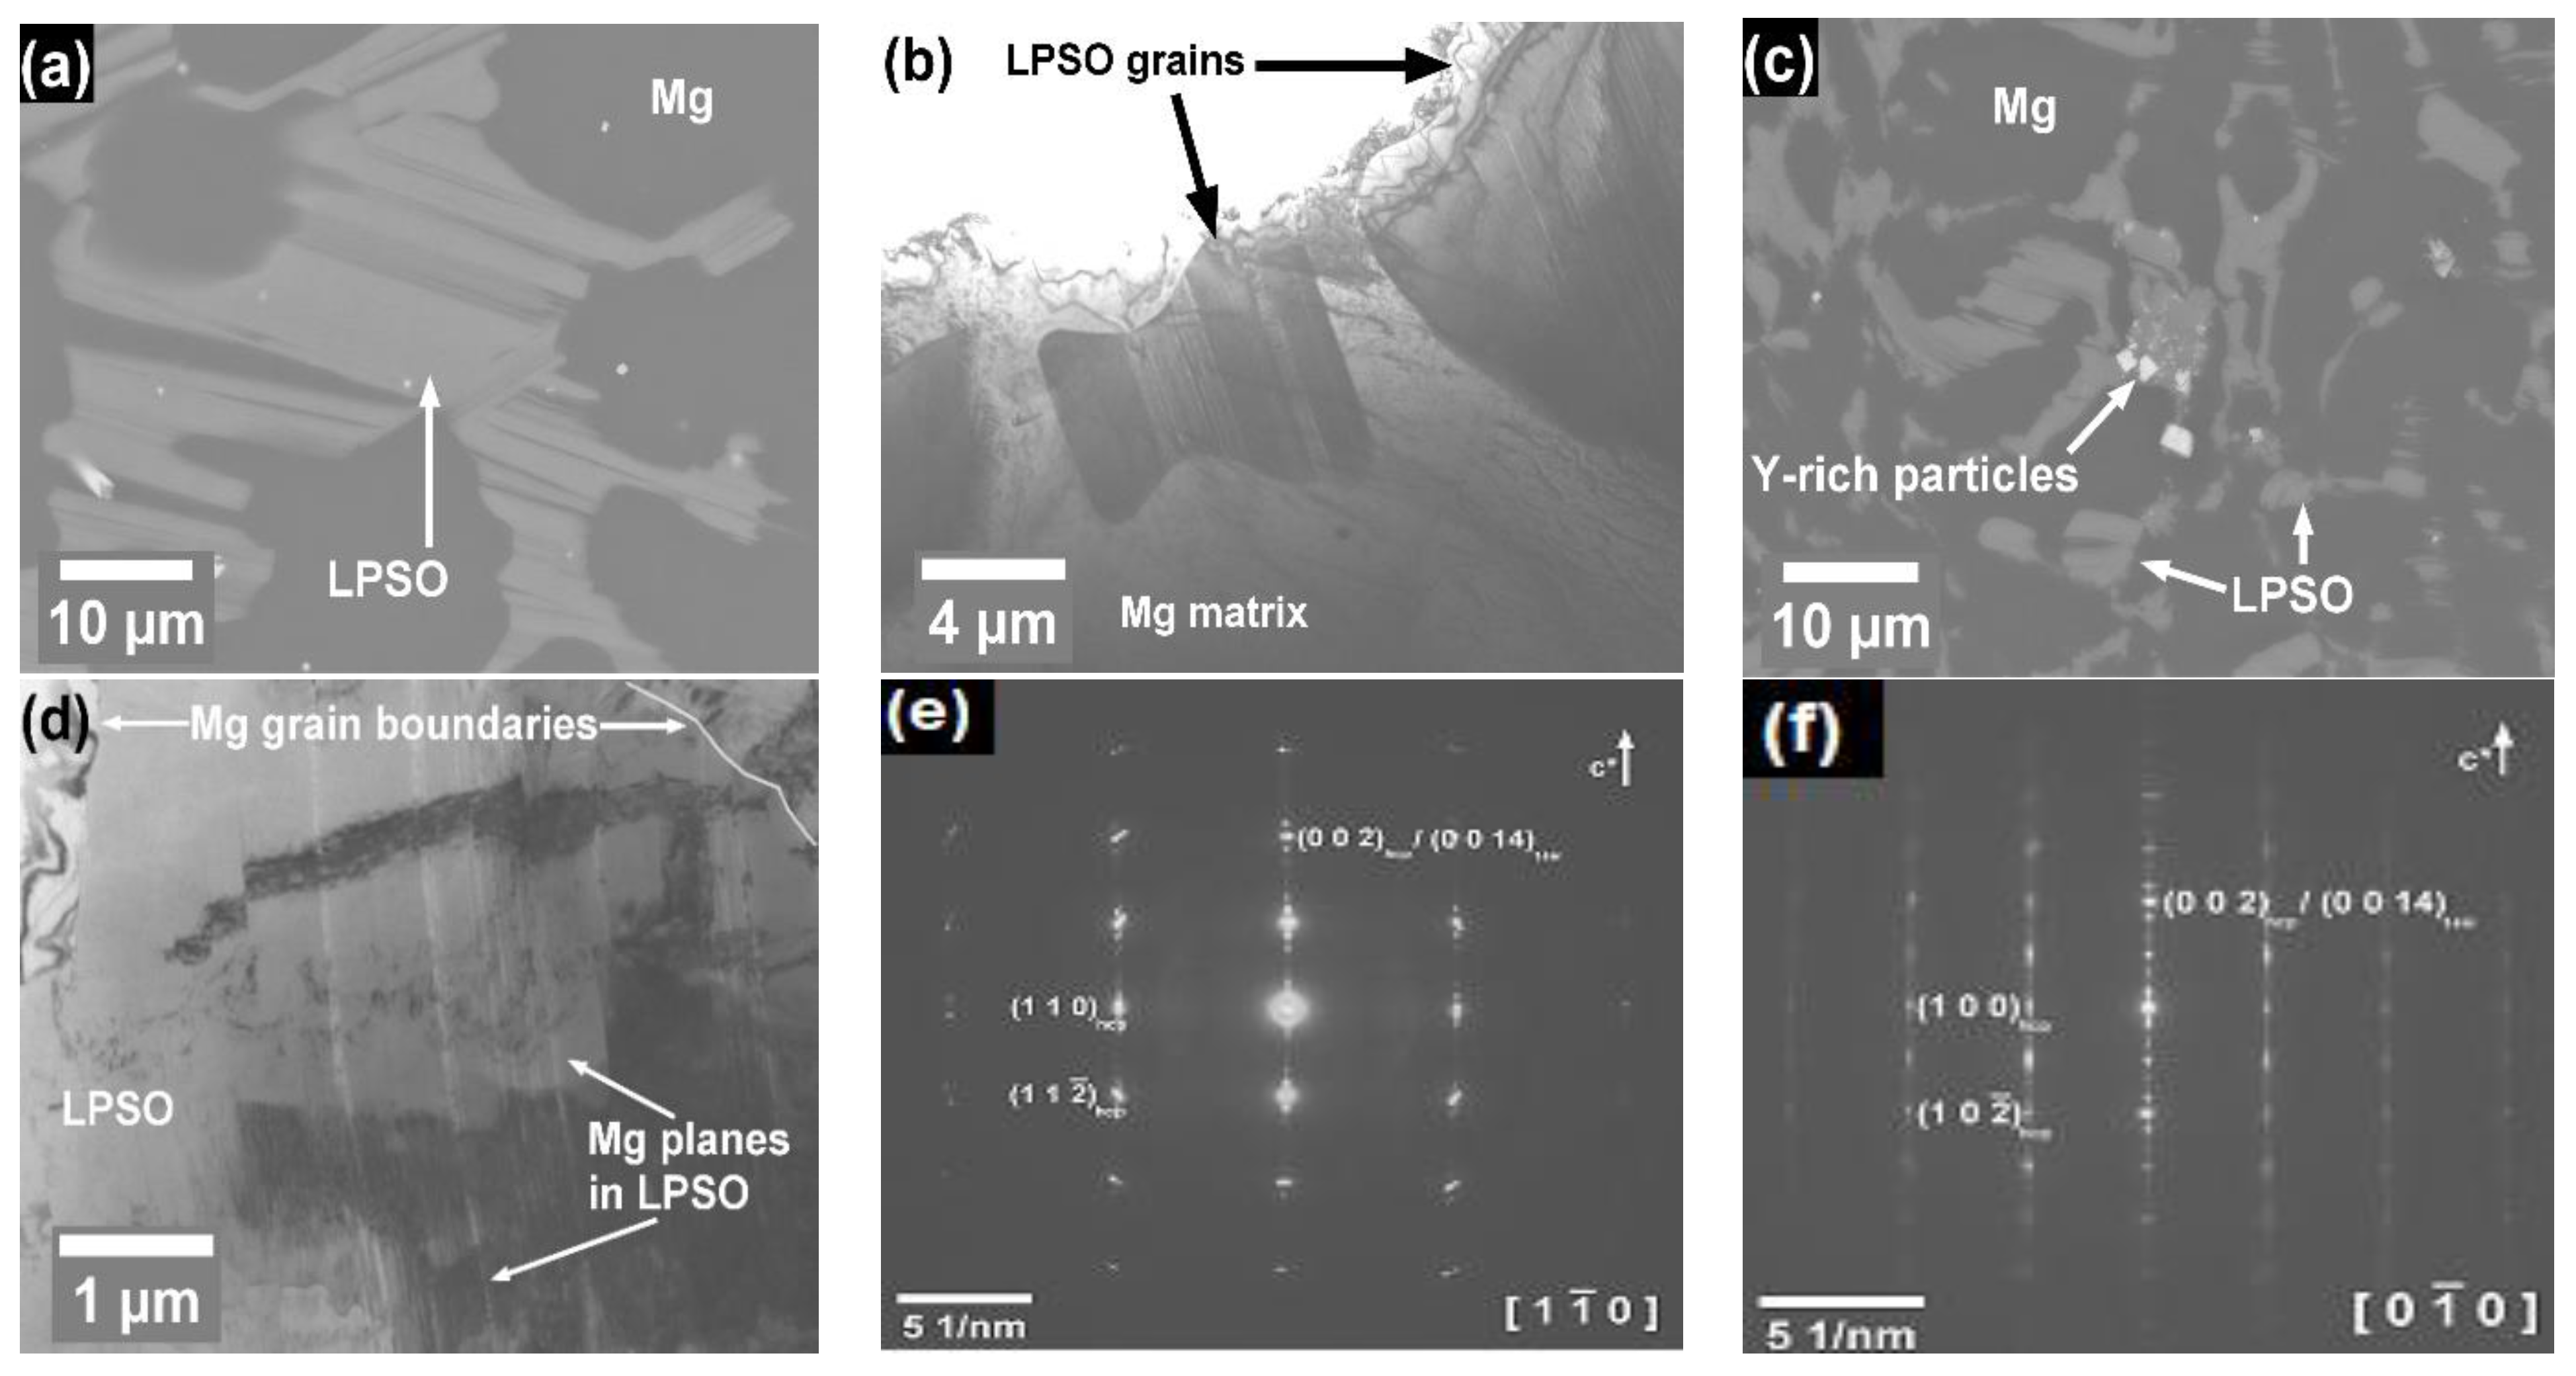
3.2.4. Thin Foil Experiments

Most available studies on hydrogenation properties of Mg alloys with LPSO phases have used powders made through manual filing or ball-milling of the alloys, which makes hydrogen-induced LPSO phase decomposition difficult to observe. Rare-earth hydrides form readily during absorption, and nucleation-induced strain is thought to provide the driving force for LPSO phase decomposition. It is also hypothesized that, as rare-earth hydride form, the hydride binds the necessary element for stabilizing the long period stacking order, leading to LPSO phase decomposition. To learn more about the LPSO decomposition process, thin Mg91Y5Ni4 foils prepared by the method in Section 2.1 were hydrogenated under two different hydrogen partial pressures. Hydrogenation curled the foils and roughened the surfaces, which resulted in a variety of microstructures at varying depths below the foils’ surfaces being exposed during SEM preparation. These variations were observed throughout both foils during SEM imaging.
The microstructural variations observed in the NE3-P foil are seen in Figure 12, where hydrogenation was carried out to form only YH3 without also forming MgH2. The exact depth of Figure 12b–j in the foil is unknown, but limited hydrogen diffusion into magnesium means the structures are located within 30 µm of the surface [4]. Figure 12b,c show a region where the fine lamellae of the initial microstructure seen in Figure 12a have been replaced with blocks of LPSO phase and coarse LPSO phase plates, with Mg forming the secondary phase. In addition, a significant number of 1–5 µm Y-rich particles and the Mg2Ni phase have formed within the Mg phase. In Figure 12d–f, the Mg phase has increased to become the primary phase. The LPSO phase blocks are not observed, but a eutectic-like structure of sub-micron lamellae has formed within the boundaries where the blocks previously existed. A region where the LPSO phase has partially transformed into the eutectic-like structure and is shown at different magnifications in Figure 12g–i. The co-existence of intact LPSO phase and the eutectic-like structure at the same observation depth indicates that hydrogen diffusion is faster in the region where the eutectic-like structure formed. In addition, the growth front of the lamellae appears to be perpendicular to the direction of lamella alignment in the eutectic-like structure. These observations suggest that hydrogen diffusivity is anisotropic in LPSO phases and may be faster in directions that are parallel to the Mg basal planes and/or Ni/Y stacking faults.
Data collected from the EDS scan lines in Figure 12j show that the lamellae in the NE3-P foil are Mg-Y phase. An example of data from one scan line is shown in Figure 12k. The composition of the Mg-Y lamellae, neglecting oxygen, is 30 ± 20 (at.%) Y with Mg forming the remainder; the size of the SEM electron probe compared to the lamellae is too large to determine a precise composition. The composition is closest to Mg2Y in the Mg-Y phase diagram, but the range also includes MgY as a potential phase. Nickel is not detected within the lamellae, which shows it segregated out of the LPSO phase as it decomposed and formed Mg2Ni. It is concluded that the Y-rich particles are YH2 based on the expected formation of rare-earth hydrides in hydrogenated Mg-RE alloys; GdH2 particles of similar size were observed recently during hydrogenation studies of Mg (Gd) solid solutions [68].
The results of the NE3-P foil experiment show that LPSO phase decomposition does not require MgH2 formation. To study the effect of full hydrogenation on LPSO phase decomposition, the NE3-F foil was hydrogenated to form both YH3 and MgH2, with the resulting microstructure seen in Figure 13. As before, limited hydrogen diffusion into magnesium means the structures seen in Figure 13a–d are located within 30 µm of the surface [4]. No LPSO phase blocks can be observed in the NE3-F foil; the LPSO phase in the foil appears to have transformed completely into the eutectic-like structure with associated Y-rich particles and Mg2Ni phase. The eutectic-like structure is the same as the NE3-P foil with alternating lamellae that are sub-micron in width. Fewer Y-rich particles are seen in the NE3-F foil compared to the NE3-P foil, while the density of the Mg2Ni phase appears to be higher in Figure 13a,b. However, these differences in phase distribution between the two foils may be attributed to limited observation areas. In general, greater hydrogenation is not observed to produce any significant microstructural differences in phases or morphology between the NE3-P and NE3-F foils. This shows that any hydrogen absorption sufficient to form YH2 triggers LPSO phase decomposition, which supports the removal of rare-earth atoms from LPSO structures as the initiation of LPSO phase decomposition.
Data collected from EDS scan lines in Figure 13d show that the composition of the eutectic-like lamellae in the NE3-F foil are similar to the NE3-P foil; data from a representative EDS scan line are plotted in Figure 13e. The lamella composition is 40 ± 20 (at.%) Y with the remainder Mg. The composition of the lamellae in the NE3-F foil is close to MgY, but this range also includes Mg2Y as a potential phase. The scan line in Figure 13e also crosses a Y-rich particle and a part of the Mg2Ni phase. Nickel is not found in significant amounts in the Mg-Y lamellae and seems to have fully segregated to the Mg2Ni phase. The Y-rich particle is assumed to be YH2, as it has no significant Ni or Mg content.
It should be noted that exaggerated LPSO decomposition is observed in the Mg91Y5Ni4 foils due to the size effect, as the foils’ thickness was less than 100 µm and on the same order of magnitude as the grain size. It is possible that the diffusion of hydrogen and nickel atoms was accelerated, causing the LPSO phase to more easily decompose. The thinness of the foils would also improve heat transfer, which again promotes faster diffusion. However, other works have also shown the decomposition of LPSO structures without MgH2 formation, such as [39], where bulk Mg-Gd-Y-Zn-Zr alloys were hydrogenated. The same mechanisms should equally apply to the Mg-Y-Ni foils.

4. Summary and Conclusions

The effect of the LPSO phase volume fraction on the hydrogen absorption and desorption properties of extruded Mg-Y-Ni alloys has been investigated. The outcomes of the research are as follows.
Mg-Y-Ni alloys were prepared with varying volume fractions of the LPSO phase through a choice of solute content and process conditions during casting, heat treatment, and extrusion. The results showed that increasing the solute content led to an increase in LPSO phase volume fraction, from ~24% LPSO in Mg97Y2Ni1 (at.%) to ~60% LPSO in Mg93Y4Ni3 (at.%) up to ~92% LPSO in Mg91Y5Ni4 (at.%).
The Mg93Y4Ni3 alloy was found to be the most sensitive to thermomechanical processing, as the as-cast LPSO phase volume fraction of 62.6% decreased to 61.4% after heat treatment and down to 58.5% after extrusion. After heat treatment, the LPSO phase volume fractions in the Mg97Y2Ni1 and Mg91Y5Ni4 alloys decreased by 7.5% and increased by 9.7%, respectively, but the fractions remained relatively stable in both alloys after extrusion.
After 100 s at 300 °C, the Mg91Y5Ni4 alloy absorbed 4.6 ± 0.2 wt.% H while the Mg97Y2Ni1 and Mg93Y4Ni3 alloys each absorbed 3.8 ± 0.2 wt.% H. After 10,000 s at 300 °C, all three alloys had absorbed 5.3 ± 0.2 wt.% H with no further significant difference in hydrogen absorption kinetics.
The hydrogen desorption kinetics do not show a consistent relationship with the LPSO phase volume fraction. The Mg91Y5Ni4 alloy desorbed 1.8 ± 0.2 wt.% H after 100 s at 300 °C against a vacuum, while the Mg97Y2Ni1 and Mg93Y4Ni3 alloys desorbed 0.8 ± 0.2 wt. H and 0.6 ± 0.2 wt.% H, respectively. After 10,000 s at 300 °C, the Mg91Y5Ni4 and Mg97Y2Ni1 alloys completely desorbed 5.2 ± 0.2 wt.% H and 5.4 ± 0.2 wt.% H, respectively, but the Mg93Y4Ni3 alloy only desorbed 3.7 ± 0.2 wt.% H. The slow desorption kinetics of Mg93 Y4Ni3 alloy can be attributed to non-uniform nanocatalyst distribution at the Mg–catalyst interface in the nanocomposites.
The equilibrium hydrogen pressures of the three Mg-Y-Ni alloys at 300 °C, which correspond to the Mg-MgH2 equilibrium, were nearly identical at 1.6 ± 0.2 atm. This similarity indicates that neither solute content nor LPSO phase volume fraction affects the Mg-MgH2 reaction thermodynamics.
The decomposition microstructures and phase compositions of thin foils of Mg91Y5Ni4 alloy hydrogenated at low and high partial pressures were similar, indicating that LPSO phase decomposition can be triggered by sufficient hydrogen absorption, leading to the formation of stable YH2 hydride. This supports the idea that rare-earth hydride formation is the initial step in destabilizing LPSO structures.

Author Contributions

K.S.N.—advancement of the main concept, involvement in all experiments, discussions, analysis of results, writing; V.S.—experiments on hydrogen kinetics on Sieverts’ apparatus, discussion of results; C.X.—casting of samples, analysis of results, discussion of results; X.G.—TEM, analysis of results, discussion of results. E.R.—examination of hydrogen kinetics results, discussion of results; P.D.H.—development of main idea, analysis of Mg with LPSO characterization techniques, discussion of results; R.L.—essence of core principles, analysis of Mg with LPSO structures, discussion of results. All authors have read and agreed to the published version of the manuscript.

Funding

This research received no external funding.

Data Availability Statement

The authors confirm that the data supporting the findings of this study are available within the article. The data set and results that support the findings of this study are openly available in https://hdl.handle.net/10779/DRO/DU:21366234.v1 (accessed on 6 September 2023).

Acknowledgments

The authors acknowledge Deakin University’s Advanced Characterization Facility for use of the EM and X-ray instruments and assistance from Andrew Sullivan, Pavel Cizek, and Peter Lynch. The authors acknowledge Monash University’s Department of Materials Science and Engineering for the use of the extrusion facilities and assistance from Daniel Curtis and Enrico Seeman. The authors acknowledge the use of the instruments and scientific and technical assistance at the Monash Centre for Electron Microscopy, a Node of Microscopy Australia.

Conflicts of Interest

The authors declare no conflict of interest.

References

  1. Yartys, V.; Lototskyy, M.; Akiba, E.; Albert, R.; Antonov, V.; Ares, J.; Baricco, M.; Bourgeois, N.; Buckley, C.; von Colbe, J.B.; et al. Magnesium based materials for hydrogen based energy storage: Past, present and future. Int. J. Hydrogen Energy 2019, 44, 7809–7859. [Google Scholar] [CrossRef]
  2. Rabkin, E.; Skripnyuk, V.; Estrin, Y. Ultrafine-Grained Magnesium Alloys for Hydrogen Storage Obtained by Severe Plastic Deformation. Front. Mater. 2019, 6, 240. [Google Scholar] [CrossRef]
  3. Wang, H.; Lin, H.; Cai, W.; Ouyang, L.; Zhu, M. Tuning kinetics and thermodynamics of hydrogen storage in light metal element based systems—A review of recent progress. J. Alloys Compd. 2016, 658, 280–300. [Google Scholar] [CrossRef]
  4. Sakintuna, B.; Lamari-Darkrim, F.; Hirscher, M. Metal hydride materials for solid hydrogen storage: A review. Int. J. Hydrogen Energy 2007, 32, 1121–1140. [Google Scholar] [CrossRef]
  5. Huot, J.; Liang, G.; Boily, S.; Van Neste, A.; Schulz, R. Structural study and hydrogen sorption kinetics of ball-milled magnesium hydride. J. Alloys Compd. 1999, 293, 495–500. [Google Scholar] [CrossRef]
  6. Hanada, N.; Ichikawa, T.; Fujii, H. Catalytic effect of nanoparticle 3d-transition metals on hydrogen storage properties in magnesium hydride MgH2 prepared by mechanical milling. J. Phys. Chem. B 2005, 109, 7188–7194. [Google Scholar] [CrossRef]
  7. Yamasaki, N.; Miyazawa, H.; Ohyanagi, M.; Munir, Z.A. Accelerated hydrogen desorption from MgH2 by high-energy ball-milling with Al2O3. J. Mater. Sci. 2011, 47, 3577–3584. [Google Scholar] [CrossRef]
  8. Popilevsky, L.; Skripnyuk, V.; Beregovsky, M.; Sezen, M.; Amouyal, Y.; Rabkin, E. Hydrogen storage and thermal transport properties of pelletized porous Mg-2 wt.% multiwall carbon nanotubes and Mg-2 wt.% graphite composites. Int. J. Hydrogen Energy 2016, 41, 14461–14474. [Google Scholar] [CrossRef]
  9. Silva, R.; Neto, R.L.; Leiva, D.; Ishikawa, T.; Kiminami, C.; Jorge, A.; Botta, W. Room temperature hydrogen absorption by Mg and Mg TiFe nanocomposites processed by high-energy ball milling. Int. J. Hydrogen Energy 2018, 43, 12251–12259. [Google Scholar] [CrossRef]
  10. Alsabawi, K.; Gray, E.; Webb, C. The effect of ball-milling gas environment on the sorption kinetics of MgH2 with/without additives for hydrogen storage. Int. J. Hydrogen Energy 2019, 44, 2976–2980. [Google Scholar] [CrossRef]
  11. Kalinichenka, S.; Rontzsch, L.; Kieback, B. Structural and hydrogen storage properties of melt-spun Mg-Ni-Y alloys. Int. J. Hydrogen Energy 2009, 34, 7749–7755. [Google Scholar] [CrossRef]
  12. Bendersky, L.; Chiu, C.; Skripnyuk, V.; Rabkin, E. Effect of rapid solidification on hydrogen solubility in Mg-rich Mg–Ni alloys. Int. J. Hydrogen Energy 2011, 36, 5388–5399. [Google Scholar] [CrossRef]
  13. Leiva, D.R.; Costa, H.C.d.A.; Huot, J.; Pinheiro, T.S.; Junior, A.M.J.; Ishikawa, T.T.; Filho, W.J.B. Magnesium-Nickel alloy for hydrogen storage produced by melt spinning followed by cold rolling. Mater. Res. 2012, 15, 813–817. [Google Scholar] [CrossRef]
  14. Song, W.; Li, J.; Zhang, T.; Hou, X.; Kou, H. Dehydrogenation behavior and microstructure evolution of hydrogenated magnesium-nickel-yttrium melt-spun ribbons. RSC Adv. 2015, 5, 54258–54265. [Google Scholar] [CrossRef]
  15. Skripnyuk, V.M.; Rabkin, E.; Estrin, Y.; Lapovok, R. The effect of ball milling and equal channel angular pressing on the hydrogen absorption/desorption properties of Mg–4.95 wt% Zn–0.71 wt% Zr (ZK60) alloy. Acta Mater. 2004, 52, 405–414. [Google Scholar] [CrossRef]
  16. Leiva, D.R.; Huot, J.; Ishikawa, T.T.; Bolfarini, C.; Kiminami, C.S.; Jorge, A.M.; Filho, W.J.B. Hydrogen Activation Behavior of Commercial Magnesium Processed by Different Severe Plastic Deformation Routes. Mater. Sci. Forum 2010, 667–669, 1047–1051. [Google Scholar] [CrossRef]
  17. Jorge, A.M.; Prokofiev, E.; de Lima, G.F.; Rauch, E.; Veron, M.; Botta, W.J.; Kawasaki, M.; Langdon, T.G. An investigation of hydrogen storage in a magnesium-based alloy processed by equal-channel angular pressing. Int. J. Hydrogen Energy 2013, 38, 8306–8312. [Google Scholar] [CrossRef]
  18. Skryabina, N.; Aptukov, V.; Romanov, P.; Fruchart, D.; de Rango, P.; Girard, G.; Grandini, C.; Sandim, H.; Huot, J.; Lang, J.; et al. Microstructure Optimization of Mg-Alloys by the ECAP Process Including Numerical Simulation, SPD Treatments, Characterization, and Hydrogen Sorption Properties. Molecules 2018, 24, 89. [Google Scholar] [CrossRef]
  19. Wang, L.; Jiang, J.; Ma, A.; Li, Y.; Song, D. A Critical Review of Mg-Based Hydrogen Storage Materials Processed by Equal Channel Angular Pressing. Metals 2017, 7, 324. [Google Scholar] [CrossRef]
  20. Liang, G.X.; Huot, J.; Boily, S.; Van Neste, A.; Schulz, R. Catalytic effect of transition metals on hydrogen sorption in nanocrystalline ball milled MgH2-Tm (Tm = Ti, V, Mn, Fe and Ni) systems. J. Alloys Compd. 1999, 292, 247–252. [Google Scholar] [CrossRef]
  21. Cui, J.; Wang, H.; Liu, J.; Ouyang, L.; Zhang, Q.; Sun, D.; Yao, X.; Zhu, M. Remarkable enhancement in dehydrogenation of MgH2 by a nano-coating of multi-valence Ti-based catalysts. J. Mater. Chem. A 2013, 1, 5603–5611. [Google Scholar] [CrossRef]
  22. House, S.D.; Vajo, J.J.; Ren, C.; Rockett, A.A.; Robertson, I.M. Effect of ball-milling duration and dehydrogenation on the morphology, microstructure and catalyst dispersion in Ni-catalyzed MgH2 hydrogen storage materials. Acta Mater. 2015, 86, 55–68. [Google Scholar] [CrossRef]
  23. Tarasov, B.P.; Arbuzov, A.A.; Mozhzhuhin, S.A.; Volodin, A.A.; Fursikov, P.V.; Lototskyy, M.V.; Yartys, V.A. Hydrogen storage behavior of magnesium catalyzed by nickel-graphene nanocomposites. Int. J. Hydrogen Energy 2019, 44, 29212–29223. [Google Scholar] [CrossRef]
  24. Itoi, T.; Seimiya, T.; Kawamura, Y.; Hirohashi, M. Long period stacking structures observed in Mg97Zn1Y2 alloy. Scr. Mater. 2004, 51, 107–111. [Google Scholar] [CrossRef]
  25. Kawamura, Y.; Yamasaki, M. Formation and mechanical properties of Mg97Zn1RE2 alloys with long-period stacking ordered structure. Mater. Trans. 2007, 48, 2986–2992. [Google Scholar] [CrossRef]
  26. Zhu, Y.M.; Morton, A.J.; Nie, J.F. The 18R and 14H long-period stacking ordered structures in Mg-Y-Zn alloys. Acta Mater. 2010, 58, 2936–2947. [Google Scholar] [CrossRef]
  27. Kishida, K.; Yokobayashi, H.; Inui, H.; Yamasaki, M.; Kawamura, Y. The crystal structure of the LPSO phase of the 14H-type in the Mg–Al–Gd alloy system. Intermetallics 2012, 31, 55–64. [Google Scholar] [CrossRef]
  28. Egusa, D.; Abe, E. The structure of long period stacking/order Mg–Zn–RE phases with extended non-stoichiometry ranges. Acta Mater. 2012, 60, 166–178. [Google Scholar] [CrossRef]
  29. Yamasaki, M.; Matsushita, M.; Hagihara, K.; Izuno, H.; Abe, E.; Kawamura, Y. Highly ordered 10H-type long-period stacking order phase in a Mg–Zn–Y ternary alloy. Scr. Mater. 2014, 78–79, 13–16. [Google Scholar] [CrossRef]
  30. Nie, J.F.; Zhu, Y.M.; Morton, A.J. On the Structure, Transformation and Deformation of Long-Period Stacking Ordered Phases in Mg-Y-Zn Alloys. Metall. Mater. Trans. A Phys. Metall. Mater. Sci. 2014, 45, 3338–3348. [Google Scholar] [CrossRef]
  31. Kishida, K.; Nagai, K.; Matsumoto, A.; Yasuhara, A.; Inui, H. Crystal structures of highly-ordered long-period stacking-ordered phases with 18R, 14H and 10H-type stacking sequences in the Mg–Zn–Y system. Acta Mater. 2015, 99, 228–239. [Google Scholar] [CrossRef]
  32. Oñorbe, E.; Garcés, G.; Pérez, P.; Adeva, P. Effect of the LPSO volume fraction on the microstructure and mechanical properties of Mg–Y2X–ZnX alloys. J. Mater. Sci. 2011, 47, 1085–1093. [Google Scholar] [CrossRef]
  33. Tong, L.; Li, X.; Zhang, D.; Cheng, L.; Meng, J.; Zhang, H. Dynamic recrystallization and texture evolution of Mg–Y–Zn alloy during hot extrusion process. Mater. Charact. 2014, 92, 77–83. [Google Scholar] [CrossRef]
  34. Drozdenko, D.; Farkas, G.; Šimko, P.; Fekete, K.; Čapek, J.; Garcés, G.; Ma, D.; An, K.; Máthis, K. Influence of Volume Fraction of Long-Period Stacking Ordered Structure Phase on the Deformation Processes during Cyclic Deformation of Mg-Y-Zn Alloys. Crystals 2020, 11, 11. [Google Scholar] [CrossRef]
  35. Hagihara, K.; Kinoshita, A.; Sugino, Y.; Yamasaki, M.; Kawamura, Y.; Yasuda, H.; Umakoshi, Y. Effect of long-period stacking ordered phase on mechanical properties of Mg97Zn1Y2 extruded alloy. Acta Mater. 2010, 58, 6282–6293. [Google Scholar] [CrossRef]
  36. Hagihara, K.; Li, Z.; Yamasaki, M.; Kawamura, Y.; Nakano, T. Strengthening mechanisms acting in extruded Mg-based long-period stacking ordered (LPSO)-phase alloys. Acta Mater. 2019, 163, 226–239. [Google Scholar] [CrossRef]
  37. Liu, J.; Zou, C.; Wang, H.; Ouyang, L.; Zhu, M. Facilitating de/hydrogenation by long-period stacking ordered structure in Mg based alloys. Int. J. Hydrogen Energy 2013, 38, 10438–10445. [Google Scholar] [CrossRef]
  38. Li, Q.; Li, Y.; Liu, B.; Lu, X.; Zhang, T.; Gu, Q. The cycling stability of the in situ formed Mg-based nanocomposite catalyzed by YH2. J. Mater. Chem. A 2017, 5, 17532–17543. [Google Scholar] [CrossRef]
  39. Lapovok, R.; Zolotoyabko, E.; Berner, A.; Skripnyuk, V.; Lakin, E.; Larianovsky, N.; Xu, C.; Rabkin, E. Hydrogenation effect on microstructure and mechanical properties of Mg-Gd-Y-Zn-Zr alloys. Mater. Sci. Eng. A Struct. Mater. Prop. Microstruct. Process. 2018, 719, 171–177. [Google Scholar] [CrossRef]
  40. Yang, T.; Li, Q.; Liang, C.; Wang, X.; Xia, C.; Wang, H.; Yin, F.; Zhang, Y. Microstructure and hydrogen absorption/desorption properties of Mg24Y3M (M = Ni, Co, Cu, Al) alloys. Int. J. Hydrogen Energy 2018, 43, 8877–8887. [Google Scholar] [CrossRef]
  41. Hagihara, K.; Kinoshita, A.; Sugino, Y.; Yamasaki, M.; Kawamura, Y.; Yasuda, H.; Umakoshi, Y. Plastic deformation behavior of Mg89Zn4Y7 extruded alloy composed of long-period stacking ordered phase. Intermetallics 2010, 18, 1079–1085. [Google Scholar] [CrossRef]
  42. Itoi, T.; Takahashi, K.; Moriyama, H.; Hirohashi, M. A high-strength Mg–Ni–Y alloy sheet with a long-period ordered phase prepared by hot-rolling. Scr. Mater. 2008, 59, 1155–1158. [Google Scholar] [CrossRef]
  43. Yang, X.; Wu, S.; Lü, S.; Hao, L.; Fang, X. Effects of Ni levels on microstructure and mechanical properties of Mg-Ni-Y alloy reinforced with LPSO structure. J. Alloys Compd. 2017, 726, 276–283. [Google Scholar] [CrossRef]
  44. Klebanoff, L.E.; Ott, K.C.; Simpson, L.J.; O’malley, K.; Stetson, N.T. Accelerating the Understanding and Development of Hydrogen Storage Materials: A Review of the Five-Year Efforts of the Three DOE Hydrogen Storage Materials Centers of Excellence. Met. Mater. Trans. E 2014, 1, 81–117. [Google Scholar] [CrossRef]
  45. Zhang, Q.; Liu, D.; Wang, Q.; Fang, F.; Sun, D.; Ouyang, L.; Zhu, M. Superior hydrogen storage kinetics of Mg12YNi alloy with a long-period stacking ordered phase. Scr. Mater. 2011, 65, 233–236. [Google Scholar] [CrossRef]
  46. Li, Y.; Gu, Q.; Li, Q.; Zhang, T. In-situ synchrotron X-ray diffraction investigation on hydrogen-induced decomposition of long period stacking ordered structure in Mg–Ni–Y system. Scr. Mater. 2017, 127, 102–107. [Google Scholar] [CrossRef]
  47. Song, W.; Dong, H.; Zhang, G.; Liu, J.; Yang, G.; Liu, Y.; Li, Y.; Li, J.; Shen, J.; Chen, Y.; et al. Enhanced hydrogen absorption kinetics by introducing fine eutectic and long-period stacking ordered structure in ternary eutectic Mg–Ni–Y alloy. J. Alloys Compd. 2019, 820, 153187. [Google Scholar] [CrossRef]
  48. Xie, L.; Xu, M. Improved Absorption and Desorption Kinetics of Mg–Ni–Ce Alloy Activated under Elevated Hydrogen Pressure. Mater. Trans. 2020, 61, 534–539. [Google Scholar] [CrossRef]
  49. Si, T.; Liu, Y.; Zhang, Q. Hydrogen storage properties of the supersaturated Mg12YNi solid solution. J. Alloys Compd. 2010, 507, 489–493. [Google Scholar] [CrossRef]
  50. Nicholson, K.S. Controlling long period stacking ordered phases in magnesium rare-earth alloys to alter hydrogenation behavior. In Institute for Frontier Materials; Deakin University: Geelong, VIC, Australia, 2021; p. 261. Available online: https://hdl.handle.net/10779/DRO/DU:21366234.v1 (accessed on 6 September 2023).
  51. Nicholson, K.S.; Skripnyuk, V.; Xu, C.; Gao, X.; Rabkin, E.; Hodgson, P.D.; Lapovok, R. Tailoring LPSO phases in Mg–Y–Zn alloys to govern hydrogenation kinetics. J. Mater. Sci. 2023, 58, 8572–8596. [Google Scholar] [CrossRef]
  52. Liu, C.; Luo, Q.; Gu, Q.-F.; Li, Q.; Chou, K.-C. Thermodynamic assessment of Mg−Ni−Y system focusing on long-period stacking ordered phases in the Mg-rich corner. J. Magnes. Alloys 2021, 10, 3250–3266. [Google Scholar] [CrossRef]
  53. Yamashita, K.; Itoi, T.; Yamasaki, M.; Kawamura, Y.; Abe, E. A novel long-period stacking/order structure in Mg-Ni-Y alloys. J. Alloys Compd. 2019, 788, 277–282. [Google Scholar] [CrossRef]
  54. Stampfer, J.F., Jr.; Holley, C.E., Jr.; Stuttle, J.F. The Magnesium-Hydrogen System. J. Am. Chem. Soc. 1960, 82, 3504–3508. [Google Scholar] [CrossRef]
  55. Wang, Z.; Luo, Q.; Chen, S.; Chou, K.C.; Li, Q. Experimental investigation and thermodynamic calculation of the Mg–Ni–Y system (Y<50 at.%) at 400 and 500 °C. J. Alloys Compd. 2015, 649, 1306–1314. [Google Scholar]
  56. Jin, Q.-Q.; Fang, C.-F.; Mi, S.-B. Formation of long-period stacking ordered structures in Mg88M5Y7 (M=Ti, Ni and Pb) casting alloys. J. Alloys Compd. 2013, 568, 21–25. [Google Scholar] [CrossRef]
  57. Kishida, K.; Nagai, K.; Matsumoto, A.; Inui, H. Data in support of crystal structures of highly-ordered long-period stacking-ordered phases with 18R, 14H and 10H-type stacking sequences in the Mg–Zn–Y system. Data Brief 2015, 5, 314–320. [Google Scholar] [CrossRef]
  58. Jiang, M.; Zhang, S.; Bi, Y.; Li, H.; Ren, Y.; Qin, G. Phase equilibria of the long-period stacking ordered phase in the Mg–Ni–Y system. Intermetallics 2015, 57, 127–132. [Google Scholar] [CrossRef]
  59. Rokhlin, L.L. Corrosion resistance of magnesium alloys with rare earth metals. In Magnesium Alloys Containing Rare Earth metals: Structure and Properties; Taylor & Francis: London, UK; New York, NY, USA, 2003; p. 205. [Google Scholar]
  60. Liu, H.; Ju, J.; Yang, X.; Yan, J.; Song, D.; Jiang, J.; Ma, A. A two-step dynamic recrystallization induced by LPSO phases and its impact on mechanical property of severe plastic deformation processed Mg97Y2Zn1 alloy. J. Alloys Compd. 2017, 704, 509–517. [Google Scholar] [CrossRef]
  61. Kalinichenka, S.; Röntzsch, L.; Riedl, T.; Weißgärber, T.; Kieback, B. Hydrogen storage properties and microstructure of melt-spun Mg90Ni8RE2 (RE = Y, Nd, Gd). Int. J. Hydrogen Energy 2011, 36, 10808–10815. [Google Scholar] [CrossRef]
  62. Xie, L.; Xu, M.; Zhang, C.; Wu, T. Composition dependent hydrogen storage performance and desorption factors of Mg–Ce based alloys. Int. J. Hydrogen Energy 2020, 45, 9865–9876. [Google Scholar] [CrossRef]
  63. Xie, L.; Li, J.; Zhang, T.; Song, L.; Kou, H. Microstructure and hydrogen storage properties of Mg-Ni-Ce alloys with a long-period stacking ordered phase. J. Power Sources 2017, 338, 91–102. [Google Scholar] [CrossRef]
  64. Xie, L.; Li, J.; Zhang, T.; Kou, H. De/hydrogenation kinetics against air exposure and microstructure evolution during hydrogen absorption/desorption of Mg-Ni-Ce alloys. Renew. Energy 2017, 113, 1399–1407. [Google Scholar] [CrossRef]
  65. Ouyang, L.Z.; Yang, X.S.; Zhu, M.; Liu, J.W.; Dong, H.W.; Sun, D.L.; Zou, J.; Yao, X.D. Enhanced Hydrogen Storage Kinetics and Stability by Synergistic Effects of in Situ Formed CeH2.73 and Ni in CeH2.73-MgH2-Ni Nanocomposites. J. Phys. Chem. C 2014, 118, 7808–7820. [Google Scholar] [CrossRef]
  66. Sun, Y.; Wang, D.; Wang, J.; Liu, B.; Peng, Q. Hydrogen storage properties of ultrahigh pressure Mg12NiY alloys with a superfine LPSO structure. Int. J. Hydrogen Energy 2019, 44, 23179–23187. [Google Scholar] [CrossRef]
  67. Yang, T.; Wang, P.; Li, Q.; Xia, C.; Yin, F.; Liang, C.; Zhang, Y. Hydrogen absorption and desorption behavior of Ni catalyzed Mg-Y-C Ni nanocomposites. Energy 2018, 165, 709–719. [Google Scholar] [CrossRef]
  68. Chiu, C.; Su, C.J.; Yu, W.H.; Rabkin, E. Microstructure and mechanical properties of Mg–GdH2 composite prepared by internal hydrogenation. J. Mater. Sci. 2022, 57, 11649–11662. [Google Scholar] [CrossRef]
Figure 1. (a) Comparison of LPSO phase content in Mg-Y-Ni alloys with average EDS compositions and ideal LPSO polytype compositions from [52,53]. (b) Magnified view of ternary diagram showing LPSO phase content in Mg-Y-Ni alloys near Ni:Y = 1:1 ratio line.
Hydrogen 04 00042 g001
Figure 2. SEM BSE micrographs of Mg97Y2Ni1 (a,d,g,j), Mg93Y4Ni3 (b,e,h,k), and Mg91Y5Ni4 (c,f,i,l) alloys in the as-cast (ac), heat-treated (df), and extruded conditions (transverse section—gi; longitudinal section—jl).
Hydrogen 04 00042 g002
Figure 3. Micrographs of Mg97Y2Ni1 alloys; heat-treated NHT1 (a): SEM BSE; (b): TEM BF; extruded NE1 (c): SEM BSE; (d): TEM BF; (e,f): TEM diffraction.
Hydrogen 04 00042 g003
Figure 4. Micrographs of Mg93Y4Ni3 alloys; heat-treated NHT2 (a): SEM BSE; (b): TEM BF; extruded NE2 (c): SEM BSE; (d): TEM BF; (e,f): TEM diffraction.
Hydrogen 04 00042 g004
Figure 5. Micrographs of Mg91Y5Ni4 alloys; heat-treated NHT3 (a): SEM BSE, (b,c): TEM BF; extruded NE3 (cf): SEM BSE; (g): TEM BF; (h,i): TEM diffraction.
Hydrogen 04 00042 g005
Figure 6. Phase fractions of Mg-Y-Ni in as-cast (NC1, NC2, NC3), heat-treated (NHT1, NHT2, NHT3), and extruded (NE1, NE2, NE3) conditions.
Hydrogen 04 00042 g006
Figure 7. XRD patterns of Mg-Y-Ni alloys along extrusion direction. (a) Mg97Y2Ni1; (b) Mg93Y4Ni3; (c) Mg91Y5Ni4.
Hydrogen 04 00042 g007
Figure 8. Hydrogen (a) absorption and (b) desorption curves at 300 °C for extruded Mg-Y-Ni alloys processed into powders through ball-milling.
Hydrogen 04 00042 g008
Figure 9. Effective hydrogen capacity and reaction fractions of extruded Mg-Y-Ni alloys with LPSO phases at 300 °C. (a) Absorption capacity after 200 s; (b) desorption capacity after 1000 s.
Hydrogen 04 00042 g009
Figure 10. (a) Pressure–composition curves of Mg-Y-Ni powders during hydrogen absorption and desorption at 300 °C. (b) Comparison of reversible hydrogen capacity with calculated maximum reversible hydrogen capacity of Mg-Y, Mg-Ni, and Mg-Y-Ni alloys as a function of alloy content.
Hydrogen 04 00042 g010
Figure 11. XRD pattern of Mg91Y5Ni4 powder produced from extruded billet. (a) Before hydrogenation; (b) after dehydrogenation (broad peaks with elevated backgrounds between 10° and 20° are from the protective Kapton polyimide tape).
Hydrogen 04 00042 g011
Figure 12. SEM micrographs of Mg91Y5Ni4 NE3-P foil hydrogenated to form only YH3. A 20 keV accelerating voltage was used for BSE imaging. (a) Microstructure of extruded Mg91Y5Ni4 alloy without hydrogenation. (b) Coarsened LPSO phase blocks in hydrogenated NE3-P foil. (c) Magnified view of (b). (d) Eutectic-like structures of Mg-Y lamellae formed from decomposed LPSO phase. (e) Magnified view of (d). (f) Magnified view of (e). (g) Incomplete decomposition of LPSO phase into lamellar structure. (h) Magnified view of (g). (i) Magnified view of (h). (j) Acquisition area of EDS scan lines on decomposed LPSO phase microstructure. (k) Elemental composition along EDS scan line 35 in (j).
Hydrogen 04 00042 g012
Figure 13. SEM micrographs of Mg91Y5Ni4 NE3-F foil hydrogenated to form YH3 and MgH2. A 20 keV accelerating voltage was used for BSE imaging. (a) Eutectic-like structures of Mg-Y lamellae and Mg2Ni formed from decomposed LPSO phase. (b) Magnified view of (a). (c) Magnified view of (b). (d) Acquisition area of EDS scan lines on decomposed LPSO phase microstructure. (e) Elemental composition along EDS scan line 42 in (d).
Hydrogen 04 00042 g013
Table 1. Composition of LPSO phases in Mg-Y-Ni alloys measured by EDS.
AlloyConditionMg ± Std Err.Ni ± Std Err.Y ± Std Err.Mg:YMg:NiNi:YPolytype
Mg97Y2Ni1As-cast89.36 ± 0.205.04 ± 0.115.60 ± 0.1016.0017.820.9024R
Heat-treated86.43 ± 0.276.61 ± 0.136.96 ± 0.1412.4613.140.9518R
Extruded86.50 ± 0.196.72 ± 0.116.78 ± 0.0912.8012.920.9918R
Mg93Y4Ni3As-cast87.63 ± 0.456.44 ± 0.245.93 ± 0.2114.9413.801.0814H
Heat-treated87.17 ± 0.206.72 ± 0.116.11 ± 0.1014.3113.021.1014H
Extruded86.99 ± 0.196.81 ± 0.086.20 ± 0.1114.0812.801.1014H
Mg91Y5Ni4As-cast83.89 ± 0.348.25 ± 0.177.86 ± 0.1610.7110.211.0510H
87.65 ± 0.146.37 ± 0.065.99 ± 0.1014.6713.781.0614H
Heat-treated87.35 ± 0.076.41 ± 0.046.23 ± 0.0514.0714.021.0314H
87.51 ± 0.166.25 ± 0.076.23 ± 0.0914.0213.631.0014H
Extruded86.98 ± 0.116.72 ± 0.056.30 ± 0.0613.8312.961.0714H
Table 2. Equilibrium pressures and hydrogen capacities of Mg-Y-Ni alloys at 300 °C.
Composition * (Nominal/EDS)
(at.%)
Absorption Plateau Pressure (Atm)Desorption Plateau Pressure (Atm)Maximum Hydrogen Capacity
(wt.% H)
Reversible Hydrogen Capacity
(wt.% H)
Calculated Capacity
(wt.% H)
Mg97Y2Ni1/
Mg96.2Y2.2Ni1.6
1.6 ± 0.31.6 ± 0.25.75.27.0 ± 0.2
Mg93Y4Ni3/
Mg91.1Y3.7Ni4.8
1.5 ± 0.51.5 ± 0.36.05.36.1 ± 0.2
Mg91Y5Ni4/
Mg87.1Y6.7Ni6.2
1.8 ± 0.41.8 ± 0.25.64.55.9 ± 0.3
* Data and calculated capacities are presented for alloy compositions measured with EDS.
Disclaimer/Publisher’s Note: The statements, opinions and data contained in all publications are solely those of the individual author(s) and contributor(s) and not of MDPI and/or the editor(s). MDPI and/or the editor(s) disclaim responsibility for any injury to people or property resulting from any ideas, methods, instructions or products referred to in the content.

