1. Introduction
At the present time, combustion of fossil fuels serves as the dominant energy source for the world economy, but it is accompanied by pollutant and carbon emissions. The ongoing climate crisis is forcing humanity to find novel ways to generate and store useful energy without producing greenhouse gas emissions. Moreover, fossil fuel resources are expected to deplete before the end of this century with present consumption trends. Batteries, together with renewables, are often looked at as possible alternatives, but are resource intensive and benefit from complimentary energy vectors (i.e., usable energy forms derived from natural sources).
The main requirements for a fuel in the future environmentally friendly “green” economy include (i) minimization or elimination of pollutant emissions when it is consumed to produce useful energy, (ii) its renewable nature, so a fuel can be made by renewable energy sources such as solar and wind, and (iii) the convenience in generating, storing, and handling this fuel. Hydrogen is a promising candidate for the role of renewable fuel [
1] since it can be created by renewables and primarily emits water vapor when reacting with oxygen to generate useful energy. Hydrogen can be used for producing electricity and powering transportation vehicles in all domains. However, in the gaseous form, hydrogen occupies large volumes even in highly compressed states, limiting energy density. On the other hand, in the liquid form, hydrogen has the highest specific energy of any energy storage medium, making it convenient to store, transport, and utilize, but requiring cryogenic conditions to maintain hydrogen as a liquid.
The boiling of hydrogen at very low temperatures (around 20 K at atmospheric pressure) necessitates special, highly insulated storage tanks. However, even with significant insulation, inevitable heat leakage releases hydrogen from tanks (known as boil-off losses) to avoid high pressure build-up, unless expensive and complicated cryogenic cooling means (cryocooling) are applied. Predicting the evolution of hydrogen inside storage tanks, including pressurization rates and necessary venting rates, is important for safe operation and development of advanced liquid hydrogen storage systems. This paper presents such an analysis, utilizing the lumped-element approach and focusing on the effect of tank size on the storage performance. The reduced-order method of this sort allows tank designers and users to conduct quick studies at the early design stage, where higher-fidelity and very costly computational fluid dynamics simulations will be prohibitively expensive. However, to make results of this lumped-element model trustworthy, validation with respect to experimental data is necessary (as is performed in this study).
In recent years, several publications have appeared where reduced-order models were employed to predict the behavior of tanks with cryogenic liquids. They are summarized in
Table 1. Majumdar et al. [
2] used a multi-node approach for modeling a self-pressurization process and operations of a thermodynamic vent system. Bolshinskiy et al. [
3] described a lumped-element method, which includes multi-component fluids, and a computer program for simulating various processes in cryogenic propellant tanks for launch vehicles. Al Ghafri et al. [
4] demonstrated a comparison of predictions of the two-element method with several experimental studies involving liquid hydrogen storage. Using a modified approach, Wang et al. [
5] explored effects of the vapor temperature, interfacial mass transfer, and heat leakage on the self-pressurization rate.
There are also high-fidelity simulation studies of the relevant processes that employ numerically expensive computational fluid dynamics (CFD) tools. For example, Kartuzova et al. [
6] presented their CFD modeling approach and a comparison with self-pressurization and spray cooling tests, whereas Stewart and Moder [
7] described simulations of another liquid hydrogen tank, identified several CFD modeling issues, and discussed remedies. Hybrid methods involving both reduced-order models and CFD for different domains have also been utilized [
8,
9].
Table 1.
Methods and topics of reduced-order modeling studies of liquid hydrogen tanks.
Table 1.
Methods and topics of reduced-order modeling studies of liquid hydrogen tanks.
| Authors | Modeling Methods | Focus Areas |
|---|
| Majumdar et al. [2] | Finite-volume network flow analysis | Self-pressurization; thermodynamic vent system (TVS). |
| Bolshinskiy et al. [3] | Lumped, multi-node transient model | Locked-up tank; self-pressurization and pressure control venting; TVS operations. |
| Al Ghafri et al. [4] | Two-element model | Validation for self-pressurization, densification, and venting. |
| Wang et al. [5] | Multi-node model | Effects of fluid properties, initial conditions, and heat leakage on self-pressurization. |
| Huerta and Vesovic [8] | Lumped model for liquid and 2D CFD 1 for ullage | Temperature and velocity fields in the ullage in isobaric venting. |
| Matveev and Leachman [9] | Lumped model for liquid and CFD 1 model for ullage | Boil-off reduction using para-orthohydrogen conversion of vented gas. |
While many phenomena relevant to liquid hydrogen storage tanks have been explored, the scaling aspect of the tank storage capabilities is lacking, and the present paper addresses this gap. In addition, we have also applied a formal numerical uncertainty analysis with regard to selection of the time step, as discussed in the next section.
Many modeling studies, including the current work, perform validation using experimental data obtained with a multi-purpose hydrogen test bed (MHTB) and reported by Hastings et al. [
10]. The geometry of this tank is depicted in
Figure 1. This tank, made of aluminum and comparable to a full-scale cryogenic tank for space applications, was extensively used for experimentation by NASA. The tank has a vertical cylindrical insert of diameter 3.05 m and height 1.525 m, whereas the total tank height is 3.05 m. The top and bottom surfaces of the tank represent semi-elliptic caps with two (horizontal) axes of the same diameter as the cylindrical portion and the minor (vertical) axis of twice smaller size. The entire tank is positioned inside a vacuum chamber. The tank external surface is covered with 1.4-cm-thick spray-on insulation and 45-layer insulation blanket comprising Mylar sheets and Dacron netting. The control, transfer, and instrumentation systems are also integrated in the experimental tank setup.
The main objective and novelty of the present work is to demonstrate the implementation and results of the lumped-element modeling method for assessing effects of a storage tank size on (i) the self-pressurization processes inside closed tanks and (ii) the required venting rates in constant-pressure storing regimes. Consideration of both these processes is very important for practical users of such tanks who often need to conduct trade-off studies deciding on the tank capacities under constraints for space, cost, and complexity. We have not found a straightforward analysis addressing this tank scaling issue in the literature. The present model can also be employed for modeling of a variety of other operational regimes, including liquid supply/extraction and passive/active cryocooling, as one can add additional terms in the governing equations (shown in
Section 2) and/or modify initial and boundary conditions.
2. Mathematical Model
For approximate modeling of a liquid hydrogen tank, a lumped-element method is applied. Liquid in the lower portion of the tank and vapor in the upper (ullage) space are treated as two interacting elements. Using these two elements with averaged properties greatly simplifies the complexity of the problem (and computational cost) associated with non-uniformity of the properties inside those domains, but this assumption also reduces the fidelity of the model as processes inside those elements are modeled simplistically. A schematic of the system with main heat and mass transfer mechanisms is shown in
Figure 2. All symbols in this figure are explained in the following text. The mass and energy conservation equations for each phase can be expressed as follows [
3]:
where
is the mass of one of the phases,
is the corresponding specific enthalpy,
is a heat addition rate (the summation is carried over all inputs),
and
are the mass inflow rate and specific enthalpy at a port
,
is the volume of the considered phase, and
is the pressure in the tank (hydrostatic variation is neglected). Equation (1) simply states that the rate of change in mass inside each fluid domain equals to the net mass transfer rate into the corresponding phase. Equation (2) is written in a more convenient enthalpy form, since one of the terms on the right-hand side (related to the boundary work) contains the pressure rate of change, which becomes zero in the constant-pressure processes. The other terms are the summations of all heat transfer rates through the boundaries of each domain and the enthalpy differences carried by mass crossing the boundaries.
The heat addition rates include heat leakage into liquid and vapor from outside,
and
(treated here as known values), and heat transfer from each phase to the interface between them,
and
. The interface is assumed to be at the local equilibrium, so that its temperature
equals to the saturated temperature of hydrogen that depends on the ullage pressure:
As the infinitely thin interface is considered, the evaporation or condensation rate is determined from the difference between heat flows from the ullage and liquid,
where
and
are the specific enthalpies of the saturated vapor and liquid at the interface temperature. Equation (4) represents the energy conservation principle similar to Equation (2), but with zero mass and volume due to assumption of infinitely thin domain. The evaporation rate, calculated with Equation (4), enters Equations (1) and (2) through boundary mass flows.
Another boundary mass flow considered here is the venting from ullage to the environment. The vent rate is treated as a controlled parameter, e.g., to maintain certain pressure in the tank. The specific enthalpy of vented gas will exceed the average enthalpy in the ullage due to thermal stratification in the tank. Since the present model does not resolve this temperature distribution, the temperature of the vented hydrogen is taken to be greater than the ullage temperature by twice the difference between the ullage and interface temperatures, which is a rather approximate but realistic assumption given empirical information about thermal stratification, e.g., [
11].
The heat transfer rates between the interface and hydrogen phases are calculated in the common form via the heat transfer coefficients
,
where
is the liquid–vapor interface area, and
and
are the vapor and liquid temperatures. Assuming natural convection as the dominant mechanism for this heat transfer, a standard correlation for this type of heat transfer is applied [
12],
where
= 0.27 and
= 0.25 are commonly used constants,
is the calibration coefficient found from fitting numerical results to available experimental data,
is the fluid thermal conductivity,
is the characteristic vertical dimension (e.g., height of liquid and vapor domains), and
is the Rayleigh number that depends on Grashof and Prandtl numbers, with standard definitions as follows:
where
is the gravitational acceleration,
is the coefficient of thermal expansion,
is the characteristic temperature difference, and
,
and
, are the fluid density, viscosity, and specific heat capacity, respectively.
With specified external heat and mass transfer rates, four governing equations (mass and energy for each phase) expressed by Equations (1) and (2) can be integrated in time. In this study, the numerical implementation is accomplished in Matlab software (version R2020a). For hydrogen properties, data are gathered from CoolProp software (version 6.4.3) [
13,
14] and added into Matlab via look-up tables. CoolProp is freely available and utilizes the state-of-the-art property equations for cryogens, whereas Matlab is the most common numerical environment for implementations of reduced-order models.
To determine an appropriate time step
, solutions for one of the self-pressurization processes used for validation are obtained at several values of
, and the standard method for assessing the numerical uncertainty is applied [
15,
16]. The Richardson extrapolation is employed to evaluate a correction
to the solution (e.g., tank pressure at a given process time) found with the smallest time step [
15],
where
is the difference between solutions using the smallest and medium time steps,
is the solution difference with the medium and larger time steps,
is the time step refinement ratio (two in this study), and
is the observed order of accuracy. The correction
in Equation (10) represents the difference between the smallest-step solution and the solution expected at the infinitely small time step, whereas the observed order of accuracy describes how fast the numerical solutions converge with a reduction in the time step. Then,
is multiplied by a safety factor to assess numerical uncertainty [
16]. For the time step of 10 min (and process times about 14 h), the numerical uncertainty resulted in less 0.03% of the pressure value. This is deemed sufficient for the present study, as errors of several percent are usually acceptable at the preliminary design stage, for which the present model is developed.
3. Results
3.1. Validation Study
Experimental data for self-pressurization processes (i.e., pressure build-up in closed cryogenic space due to addition of external heat) in the MHTB tank [
10] are used for the present validation study. Some of these data were also employed for validation by other researchers [
5,
6]. Two experiments are considered here: (1) a 50%-filled tank with heat leak of 51 W (heat coming from the ambient environment to hydrogen stored in the tank) and initial pressure of 1.116 bar, and (2) a 25%-filled tank with heat leak of 18.8 W and initial pressure of 1.221 bar. The saturation temperatures (i.e., temperatures when a fluid is ready to undergo phase change) are used for the liquid in both cases, while the temperatures of superheated (i.e., having temperature above the saturation level) ullage vapor are estimated at 3 K above the saturation temperatures.
The time histories for the ullage pressure rise in the tank are shown in
Figure 3. The higher heat leak results in steeper pressure build-up. The numerical results obtained with the calibration constant of 0.055 (Equation (6)) demonstrate a reasonable agreement with test data. Due to assumptions involved in the model, such as treating the ullage and liquid as media with uniform properties, exact agreement is not expected. For geometries different from the tank studied here, this calibration constant may change.
3.2. Self-Pressurization Study
To investigate the effects of the tank scale on self-pressurization processes, four tank sizes are analyzed that have the same general shape as the one used for validation. Besides the original tank, the other tanks have the linear dimensions that are (i) twice smaller, (ii) twice bigger, and (iii) four times bigger. The volumes of these four tanks are 2.3, 18.6, 189, and 1189 m3, ranging from small to large practical tanks for liquid hydrogen storage. The initial conditions include a 50% fill level of liquid hydrogen (i.e., when half of the tank is occupied by liquid phase), 1-bar pressure, the saturated state for both liquid and vapor inside the tanks, and an average surface heat leak of 1 W/m2. The same distribution factor is applied to access heat leaks into the ullage and liquid domains, so that external heat input to the liquid is roughly twice larger than that to the vapor. The process time is chosen as 100 h.
The computational results from self-pressurization simulations are presented in
Figure 4. The tank pressure and bulk temperatures of the ullage and liquid domains naturally grow in time. The rates of pressure and liquid temperature evolutions (
Figure 4a,c), as well as the initial ullage temperature growth (
Figure 4b), are faster in smaller tanks. The ullage temperatures seem to approach similar values and rates of increase after the initial transient periods, which are longer in larger tanks. The liquid volume increases in time as well (
Figure 4d), as the reduction in liquid density overcomes the loss of liquid due to evaporation.
The recorded differences in pressure growth rates are consistent with expectations that larger tanks have better storage performance (it takes longer for the pressure to reach high values) due to the decreasing surface-to-volume ratio of bigger tanks. However, in some applications, e.g., on transportation vehicles, there are strict volumetric limitations on the tank size, and the presented results can help assess the possible dormancy times without hydrogen losses given the acceptable pressure build-up limit.
The evaporation rates are given in
Figure 4e as absolute values and in units of g/s, and in
Figure 4f, they are normalized by the total mass of hydrogen inside the tanks in units of 1/day. These rates follow similar trends in different tanks but with the different time scales. Initially, the ullage pressure rises relatively fast due to external heat leak (
Figure 4a), and this increases the saturation temperature at the liquid–vapor interface while forcing vapor condensation (
Figure 4e,f). As the ullage becomes warmer (
Figure 4b), more heat is transferred to the interface stimulating evaporation of liquid. The absolute phase-change rates are larger in bigger tanks, with more fluid and larger liquid–vapor interface (
Figure 4e). However, when normalized by the total mass of hydrogen in a tank, the relative phase-change rates become much higher in smaller tanks (
Figure 4f), as the effect of external heat leakage is stronger for tanks with bigger surface-to-volume ratios.
3.3. Constant-Pressure Venting Study
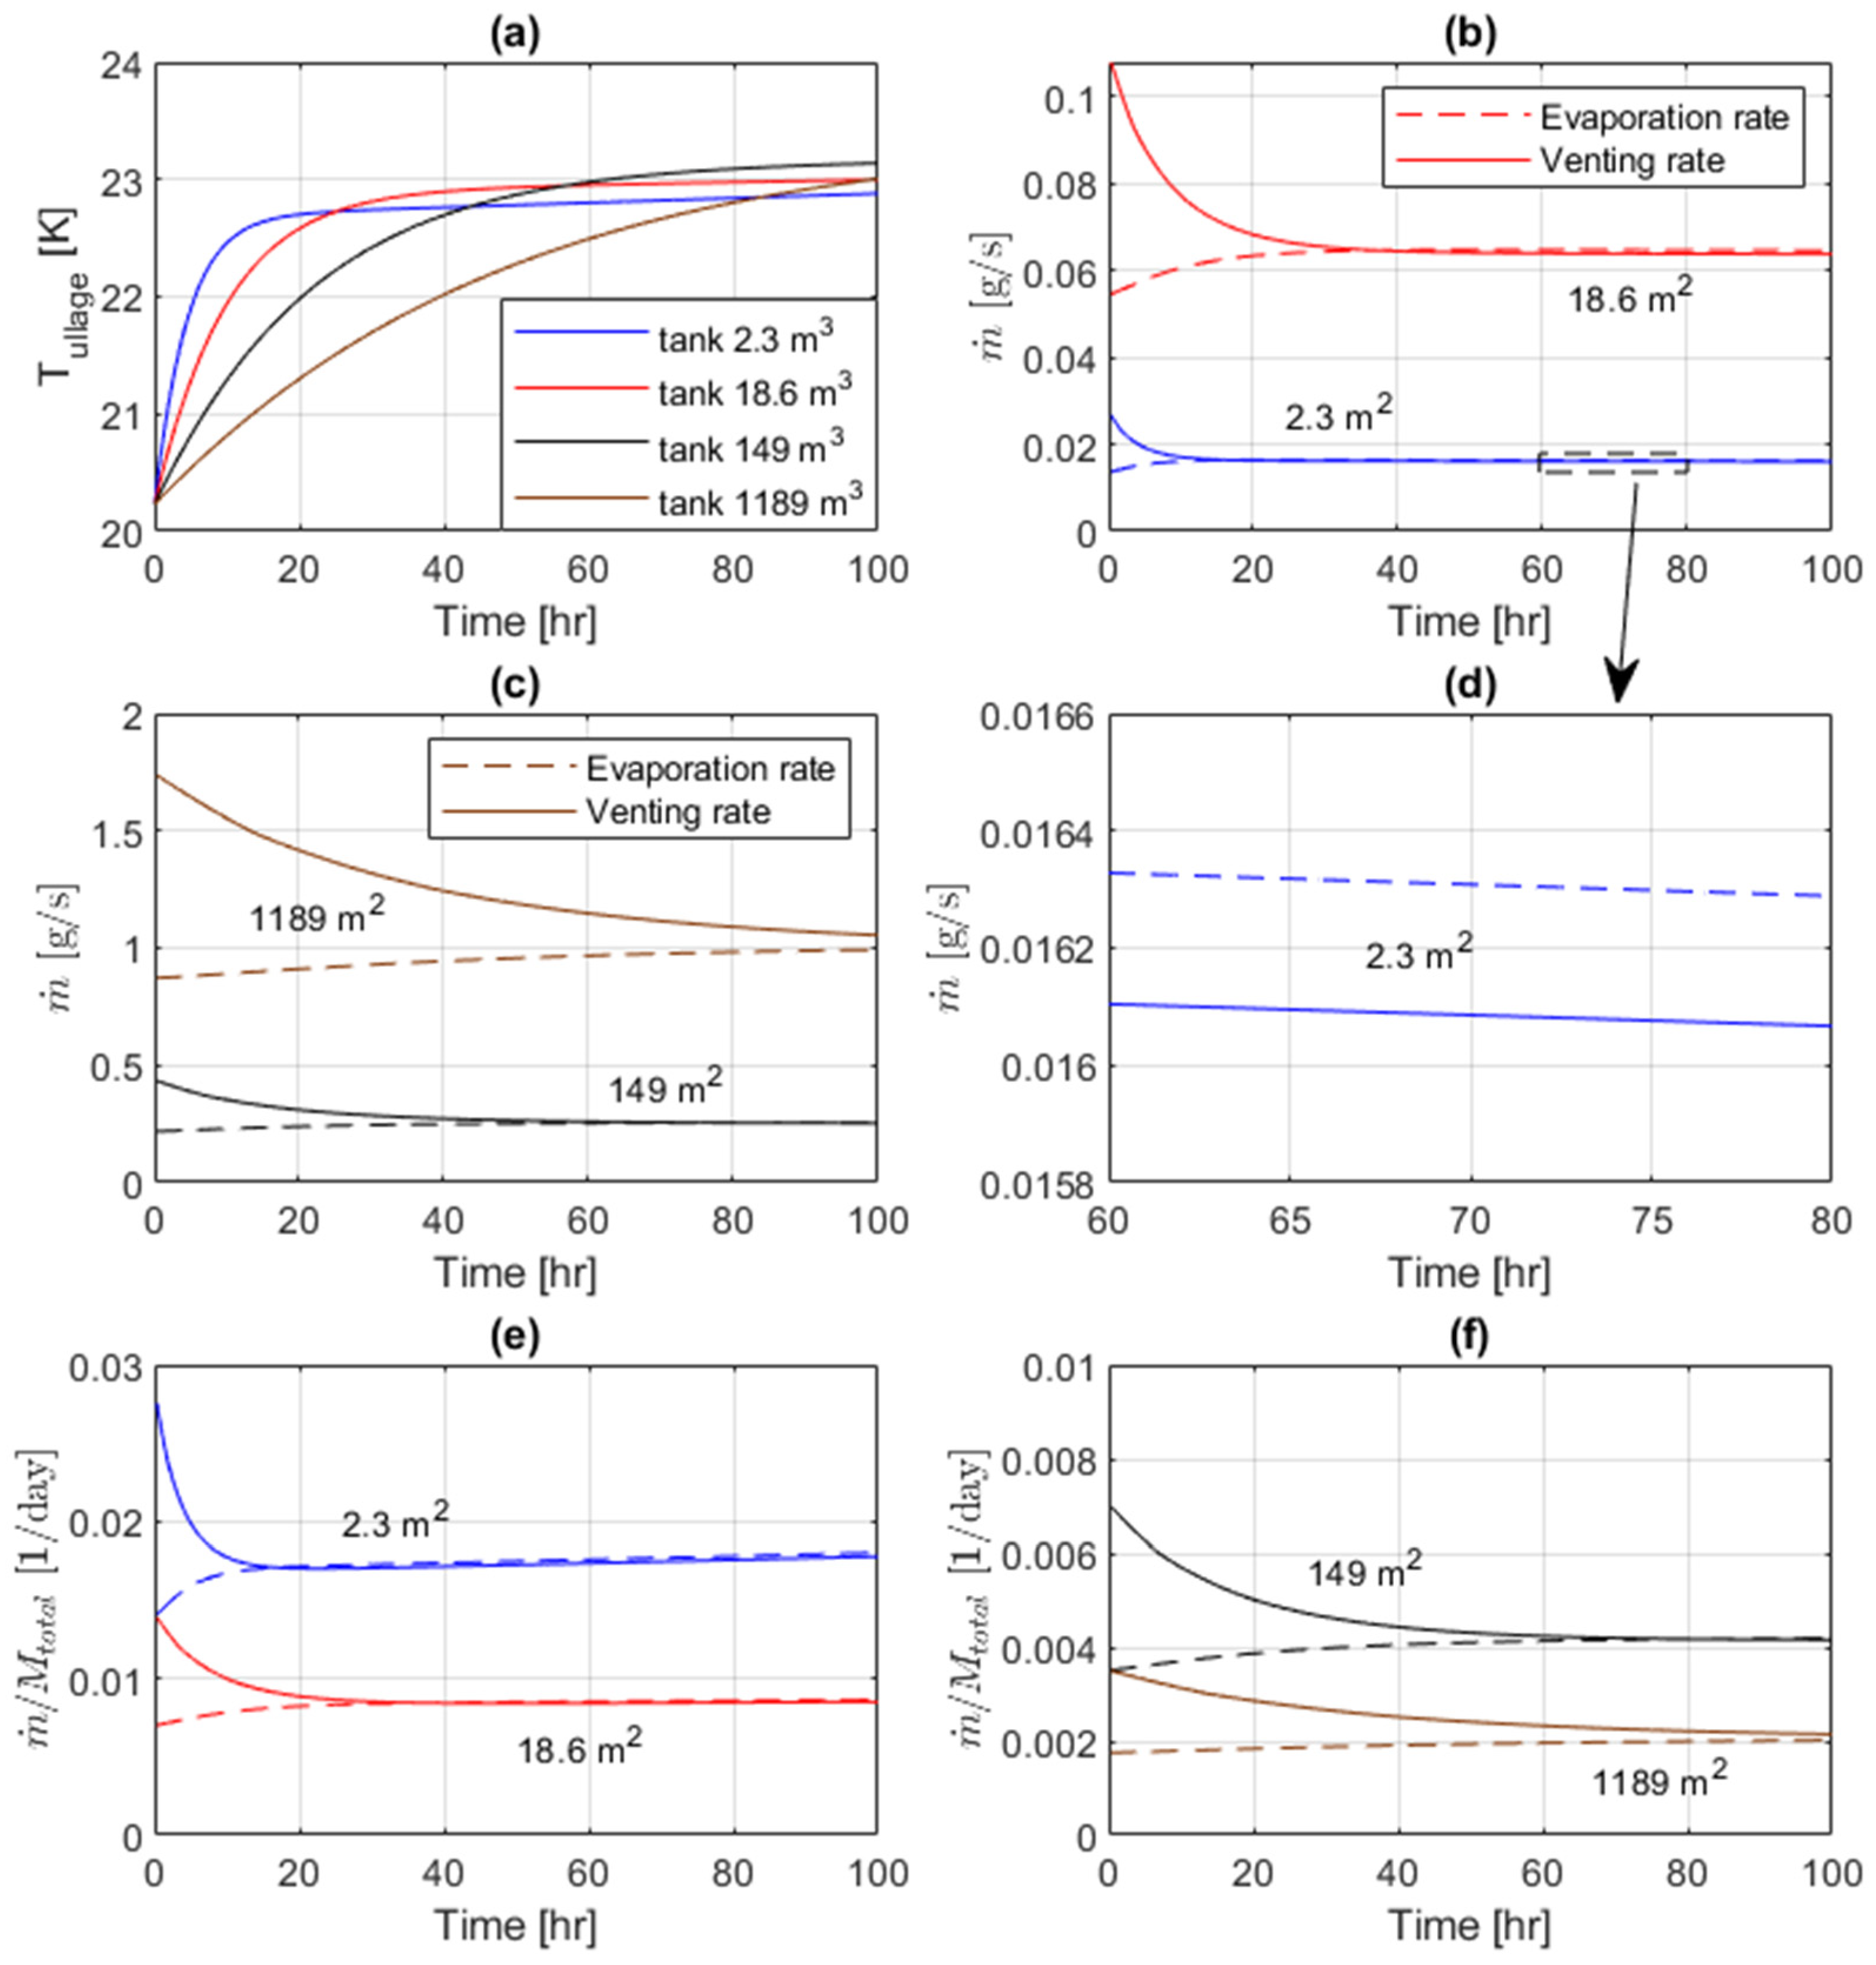
The other scenario explored in this study is the constant-pressure venting in liquid hydrogen tanks (i.e., when pressure in the tank is maintained constant by letting some of the heated hydrogen gas out of the tank). The same tanks, initial conditions, and external heat leaks are considered. However, the gas is vented from the top of the ullage space at a rate necessary to keep the tank pressure constant (which is 1 bar in the present cases). The computational results for the ullage temperature and the evaporation and venting rates are shown in
Figure 5 for different tanks over a 100-hour timeframe.
The ullage temperatures increase in time similar to the self-pressurization cases, but the absolute values of temperature increments and the rates of temperature growth after initial settling are significantly smaller (
Figure 5a), as the energy leaves from the system due to gas venting. Initially, the evaporation rates are noticeably smaller than the vent rates, since to prevent any pressure build-up in the heated ullage some more gas needs to be vented out. However, these rates approach each other after the transient period, which is longer for larger tanks (
Figure 5b,c). In such quasi-steady venting regimes, evaporation rates are slightly higher than vent rates, as one can observe from a magnified view of these rates for the 2.3-m
2 tank in
Figure 5d. Evaporated hydrogen not only needs to replace gas vented outside but also has to compensate for the reduction in liquid volume due to evaporation.
The absolute values of the evaporation and vent rates are again larger in bigger tanks due to more fluid present (
Figure 5b,c). When normalized by the current total mass of hydrogen inside a tank, the relative rates become smaller for larger tanks (
Figure 5e,f), as heat leaks have a lower effect in tanks with higher volume-to-surface ratio. This is again consistent with the fact that larger tanks are generally preferable for storing liquid hydrogen, as the relative losses of hydrogen will be smaller. In the case of operational or cost restrictions on the tank volume, one can assess the expected boil-off losses from the present results. It can be also noticed that the normalized vent rates slightly increase in time during later quasi-steady venting regimes (i.e., when variations with time become very small). This happens because the total mass of hydrogen decreases in time. The normalized vent rates in such regimes represent the daily boil-off losses of hydrogen. In the considered cases, they range from about 1.8% in the smallest tank to about 0.2% in the largest tank.
In the present model, the temperature of vented hydrogen is assumed to be to approximate thermal stratification in the ullage. The actual temperature variation in the vapor domain may depend on the history of the process, tank geometry, and the heat leak distribution. This assumption is an important limitation of the present model, and future work on establishing empirical correlations for thermal stratification would benefit the model accuracy.
3.4. Scaling Analysis
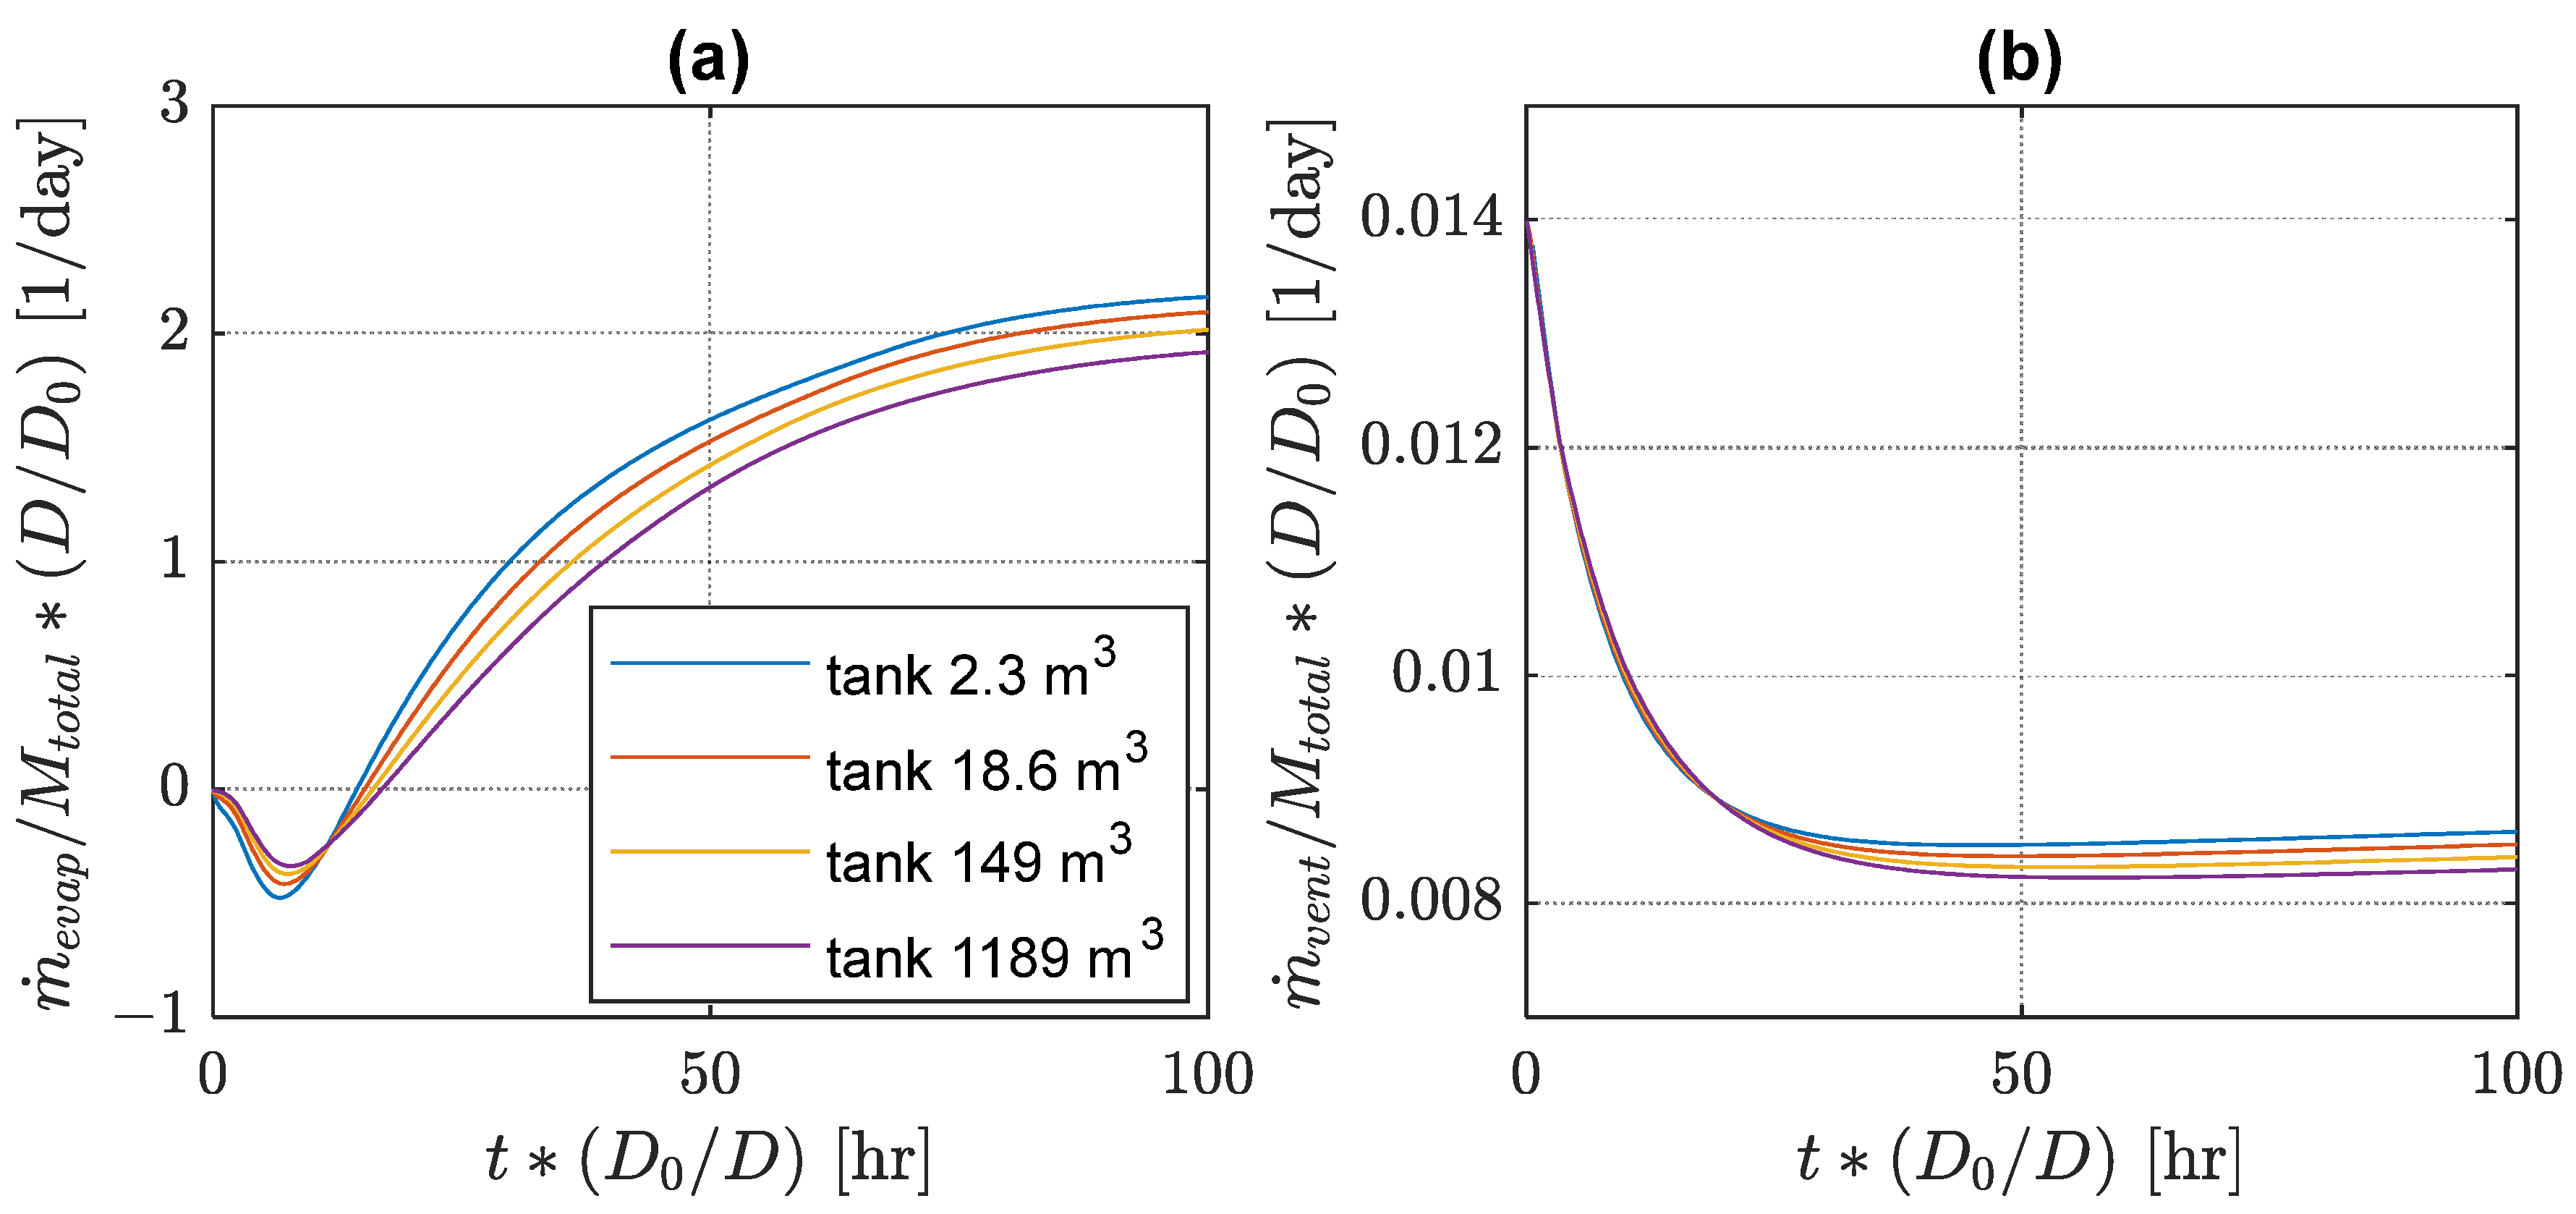
For designers and users of liquid hydrogen tanks, it is important to know whether tank performance characteristics are scalable, i.e., if one can estimate performance of a geometric replica of a tank at a different size. A long time ago, Galileo realized that the object surface area and volume scale as square and cube of the linear dimension. Thus, the mass of hydrogen in a tank can be scaled as a cube of the tank diameter, while the overall heat leak, and correspondingly evaporation and venting rates, may be expected to scale as a square of the tank diameter. Hence, it is instructive to compare relative mass transfer rates for tanks of different sizes in the form to check if this scaling assumption holds. and are the actual tank diameter and the reference fixed diameter, taken here as that of the original MHTB diameter (3.05 m). As the characteristic process time increases with the system size, a possible candidate for the scaled time is .
The results for the scaled evaporation rates in the self-pressurization process and the scaled vent rates in constant-pressure venting regimes are shown in
Figure 6. The assumed scaling is found to work reasonably well for the results obtained with the current model. Both scaled mass transfer rates and scaled characteristic transient periods are qualitatively very similar. However, there is still some deviation of the order of several percent between scaled results for different tank sizes. The scaled mass transfer rates are slightly smaller in larger tanks, while their scaled settling times are slightly longer. These differences are driven by the different characteristic lengths in heat transfer correlations shown in
Section 2. One implication is that larger tanks will have somewhat higher performance improvement than that following from a simple reduction in the tank surface-to-volume ratio. Additional experimental studies with tanks of different sizes or higher fidelity computational simulations may help determine the magnitude of this scale effect more accurately.
4. Conclusions
A simplified lumped-element model has been set up to simulate thermal processes in stationary tanks for liquid hydrogen storage. The main findings of the conducted analysis are that the normalized mass transfer rates (including vent rates) scale approximately with the inverse of the linear tank dimension, whereas the transient time periods are nearly proportional to the tank size. The low computational cost of the present model allows us to obtain results very fast even for multi-day physical processes. The validity of this model has been demonstrated for self-pressurization regimes of an experimental tank (i.e., pressure build-up in closed cryogenic tanks due to external heat addition). The new modeling results showed that the tank size strongly affected the pressure growth rates and the liquid temperature increases in closed tanks, whereas the ullage vapor temperature evolution after a tank-size-dependent settling period was less sensitive to the tank variations. At the starting conditions with saturated phases (i.e., being in equilibrium), relatively moderate condensation was found to occur in the beginning, followed by evaporation of much larger magnitude and duration.
For the simulated cases with constant-pressure venting, when some hydrogen gas is let out of the tank to keep the internal pressure fixed, smaller rises of the ullage temperature were recorded. High venting rate and low evaporation were detected in the initial settling stage. In the steady-state regime, evaporation slightly exceeded venting rate. The larger tanks manifested larger venting rates of hydrogen but significantly lower boil-off losses when normalized by the hydrogen mass. The daily losses for tanks with volumes ranging from roughly 2 to 1200 m3 and with a heat leak of 1 W/m2 were found to vary from about 1.8% to 0.2%, respectively. Simple Galilean scaling produced reasonable predictions for tanks of different sizes, but larger tanks still experience slightly lower scaled mass transfer rates.
The main contribution of this study is the obtained information on scaling effects due to variable tank size, contributing to the current state of liquid hydrogen tank analysis and benefiting both researchers and practitioners. The designers and users of liquid hydrogen tanks can employ similar models at the initial design stage to predict the tank performance under given constraints for expected operational scenarios.
The main limitations of the present work, similar to other reduced-order models, are the representations of large domains (e.g., liquid and ullage) as lumped nodes with averaged properties and the empirical correlations used for heat and mass transfer. Such approaches require calibration with experimental data and will have lower fidelity further from the conditions used for calibration.
The important potential of the present model is in its easy adaptation to simulate other important processes that may occur in LH2 tanks, including the addition and extraction of liquid hydrogen, effects of insulation structure on heat leakage, reduced boil-off losses using passive cooling (such as vapor cooled shielding and para-orthohydrogen conversion), zero-boil-off systems employing cryocoolers, and other processes. Modeling of these processes can be achieved by adding corresponding terms in the governing equations and formulating equations for additional nodes (e.g., tank walls or shielding channels). More comprehensive models can then be used to control processes and operations of liquid hydrogen tanks.


