3.1. Decomposition of Alcohols in Solution Plasma
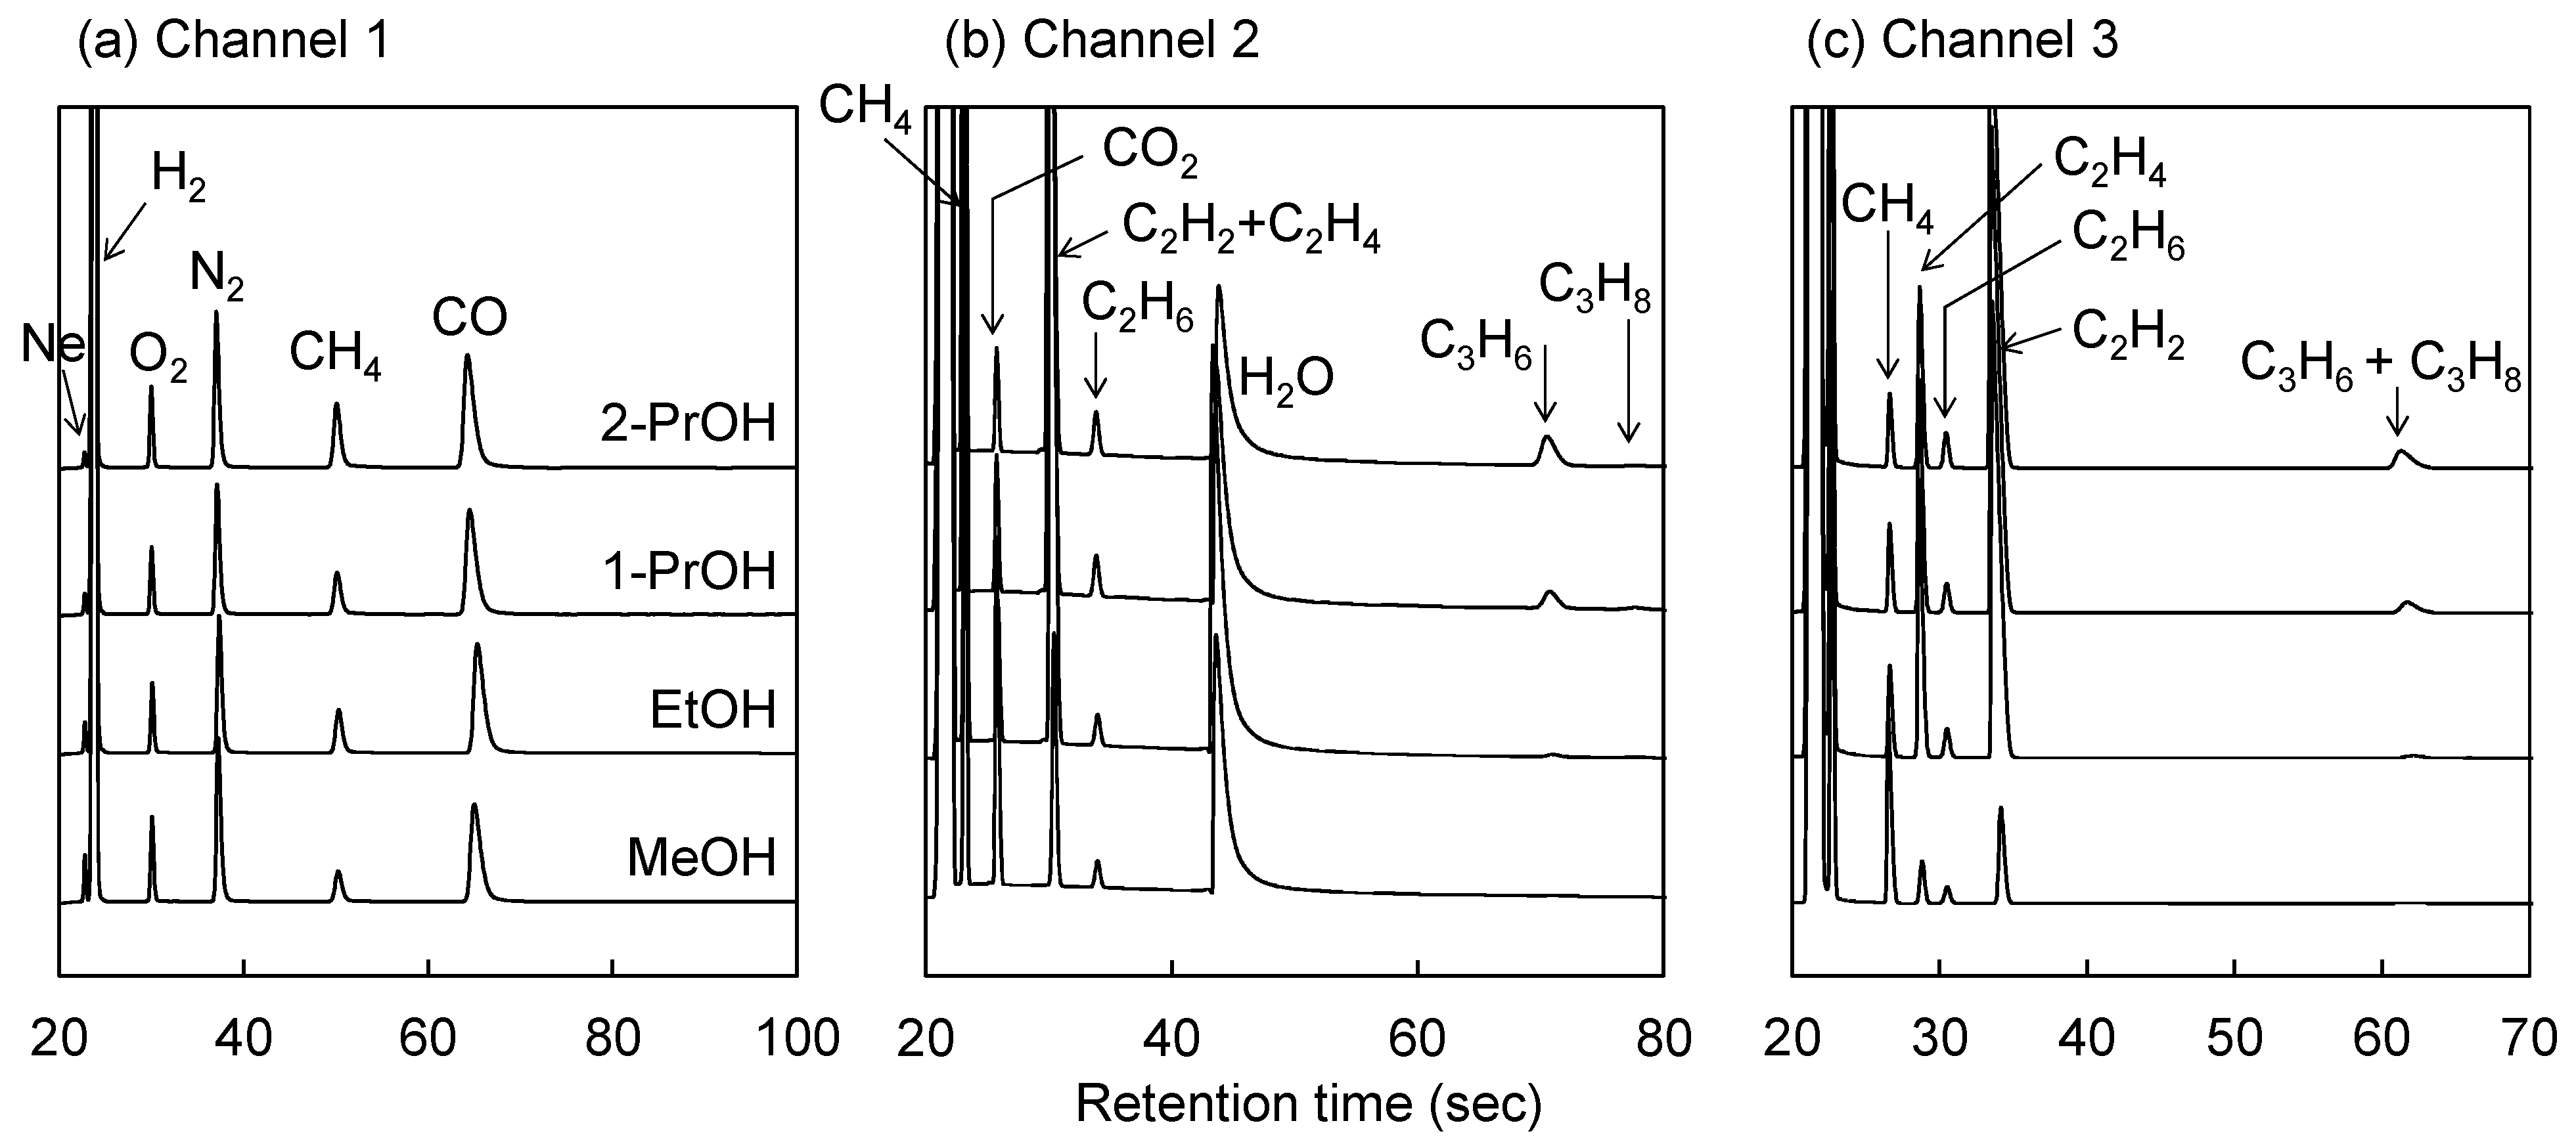
Figure 2 shows the micro-GC chromatograms of channels 1–3 for the product gases after the solution plasma treatment (approximately 20 W for 10 min) of each alcohol solution, with the cases of 20 wt% alcohol concentration being used as examples. Channel 1 could separate mainly inorganic gases; H
2, O
2, N
2, CH
4, and CO were detected from all the alcohol solutions along with standard Ne gas. Due to the structure of the micro-GC system, the air was always contaminated during the analysis; thus, the N
2 and O
2 were present due to air contamination. Since the ratio of N
2 to O
2 detected was always consistent with the air composition, no or negligible quantities of O
2 were generated from any of the aqueous alcohols in this study.
Channels 2 and 3 could separate mainly low-molecular-weight hydrocarbon gases (C
1–C
3). CH
4, CO
2, C
2H
2, C
2H
4, C
2H
6, H
2O, C
3H
6, and C
3H
8 were found in channel 2, and CH
4, C
2H
4, C
2H
6, C
2H
2, C
3H
6, and C
3H
8 were found in channel 3, from all the alcohol solutions. Because C
2H
2 and C
2H
4 overlapped in channel 2, and C
3H
6 and C
3H
8 overlapped in channel 3, these channels were used complementarily to quantify these hydrocarbon gases. Although H
2 was produced during solution plasma treatment even in the absence of alcohols, its quantity was small [
27] and almost negligible in this study.
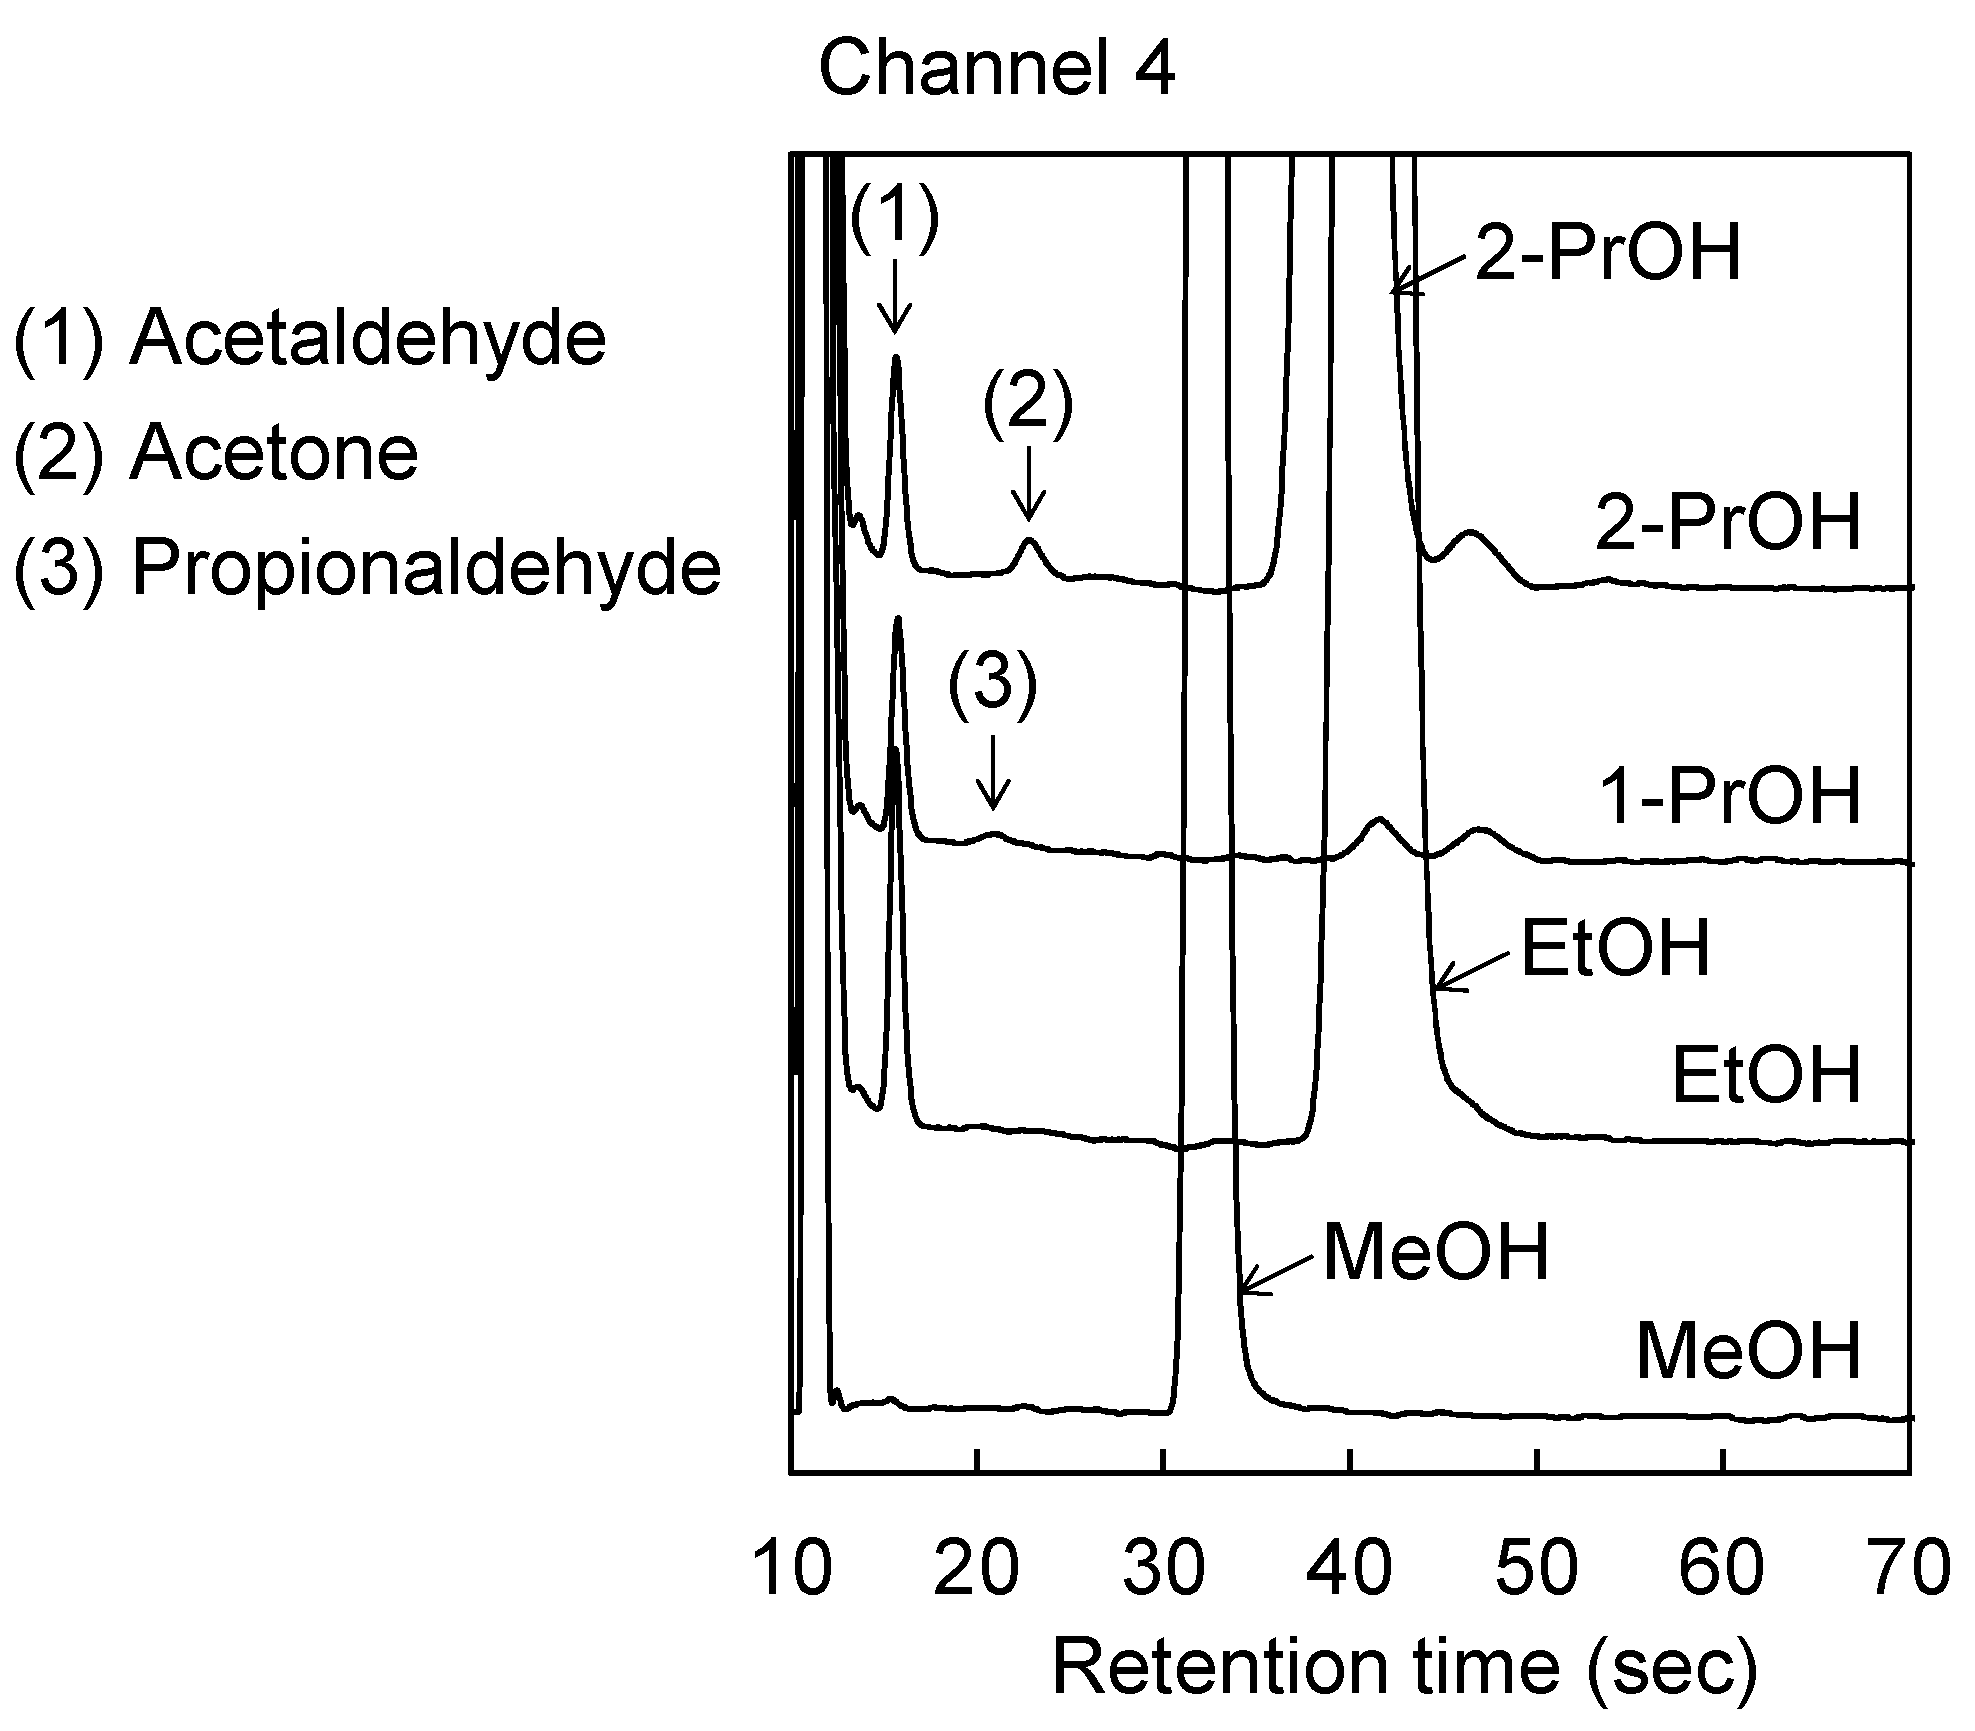
Figure 3 shows the micro-GC chromatograms obtained in channel 4, which could separate relatively large molecules. Acetaldehyde and some MeOH were detected from EtOH; acetaldehyde, propionaldehyde, and EtOH were detected from 1-PrOH, and as acetaldehyde and acetone were detected from 2-PrOH. An unidentified peak was also observed in EtOH, 1-PrOH, and 2-PrOH at 47 s. These detected compounds were considered to be intermediates to gases. They are almost liquid at room temperature and tended to condense at the inlet of the micro-GC. The slightly higher intensity of acetaldehyde was probably because of its comparatively lower boiling point (20.2 °C). Therefore, the results of channel 4 indicated the presence of products, but rendered quantification difficult. These compounds remained, to some extent, at the inlet of the micro-GC and contaminated the next analysis. Therefore, the data in
Figure 3 were obtained after 1 day of blank analyses to ensure that nothing was detected.
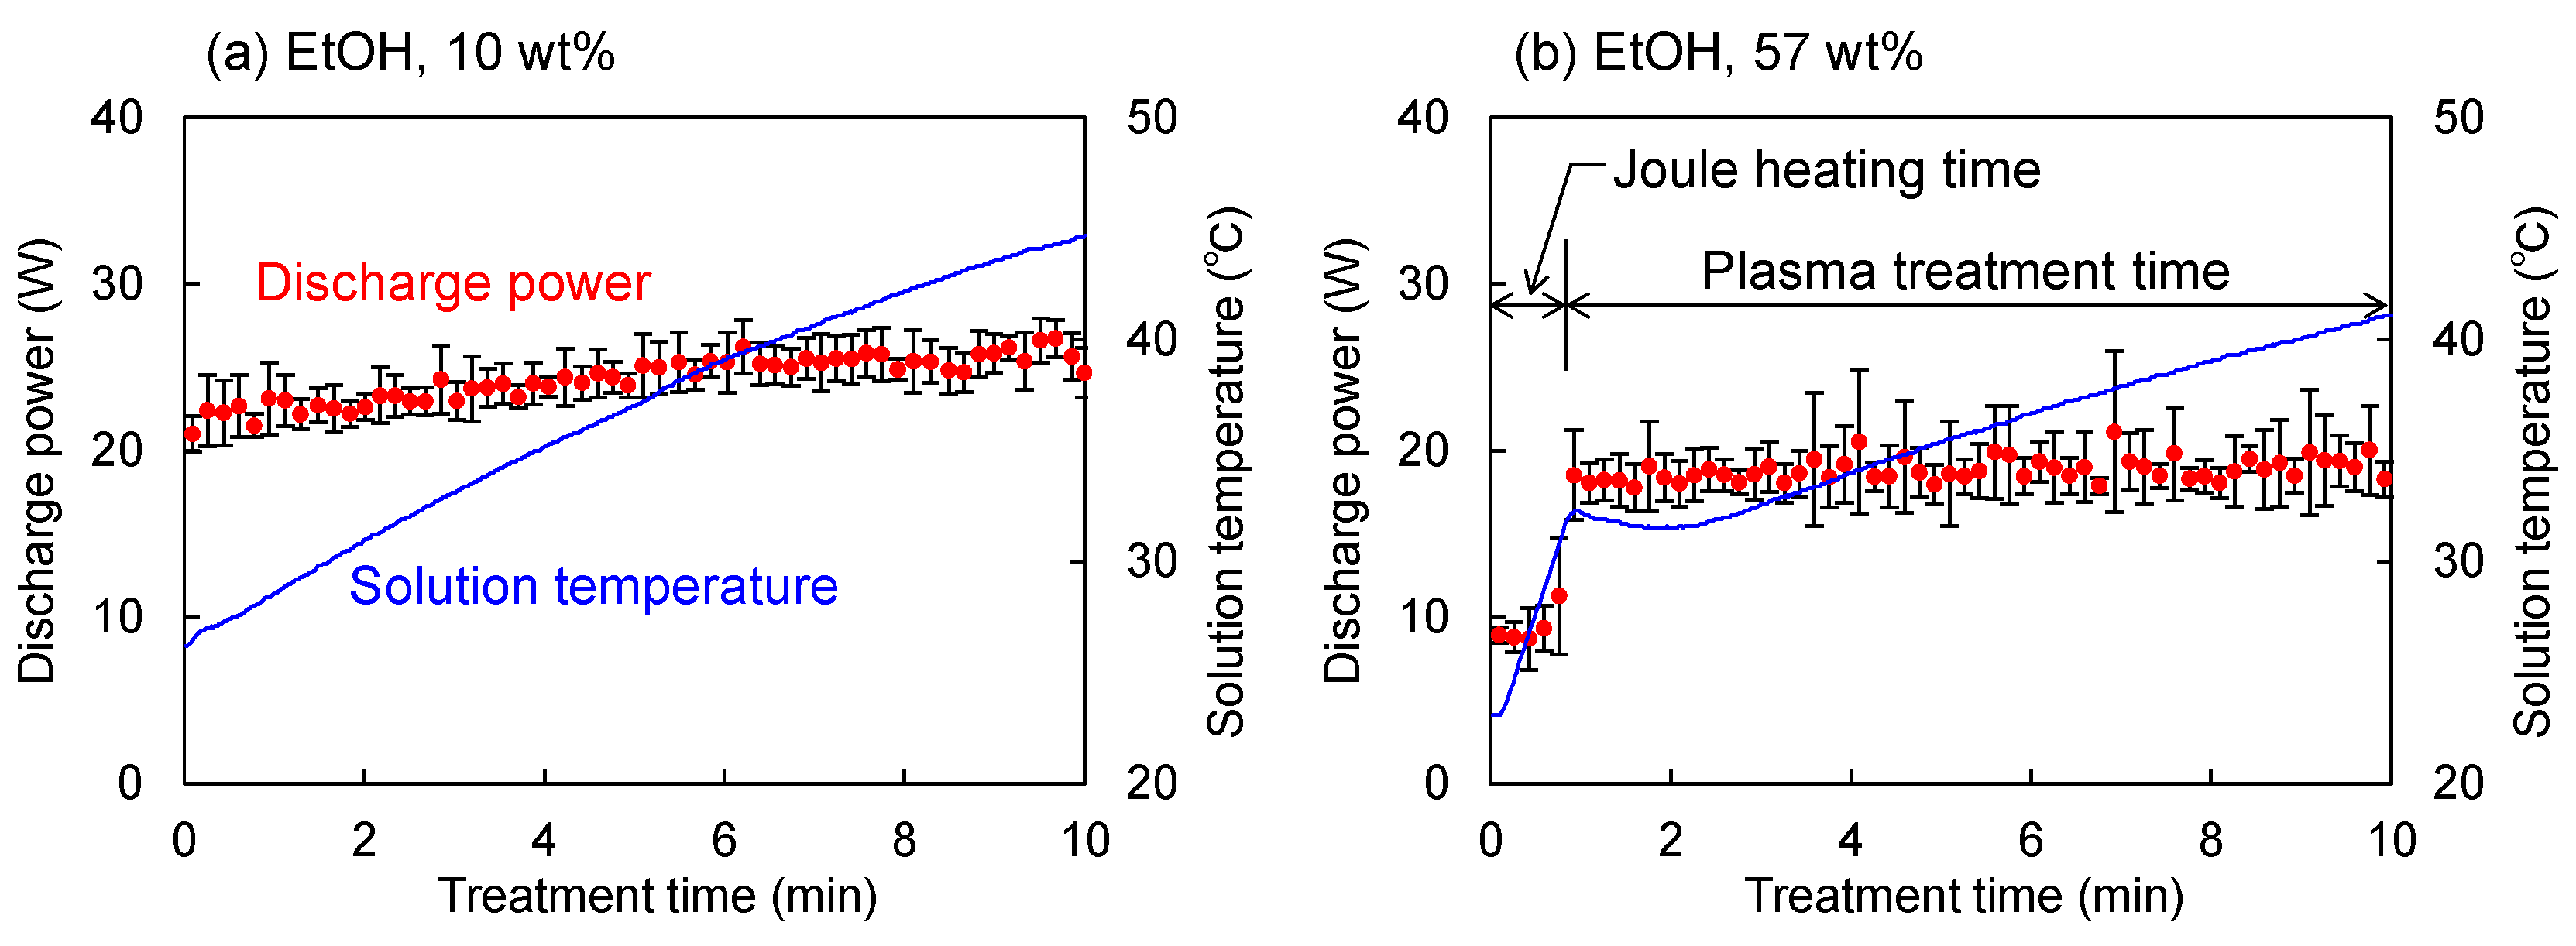
The average discharge power during solution plasma treatment was ca. 20 W under the conditions of this study, but there was some variation for each experiment. In addition, as explained in
Appendix A, when the alcohol concentration was >50 wt%, the solution plasma treatment time was <10 min because the start of the discharge was delayed. The present authors’ previous study indicates that a higher discharge power and a longer discharge time correspond to a higher gas yield [
27]. For comparison under the same conditions, the total quantity of gas produced per level of discharge power and discharge time was evaluated [Equation (1)] and defined as the gasification rate
.
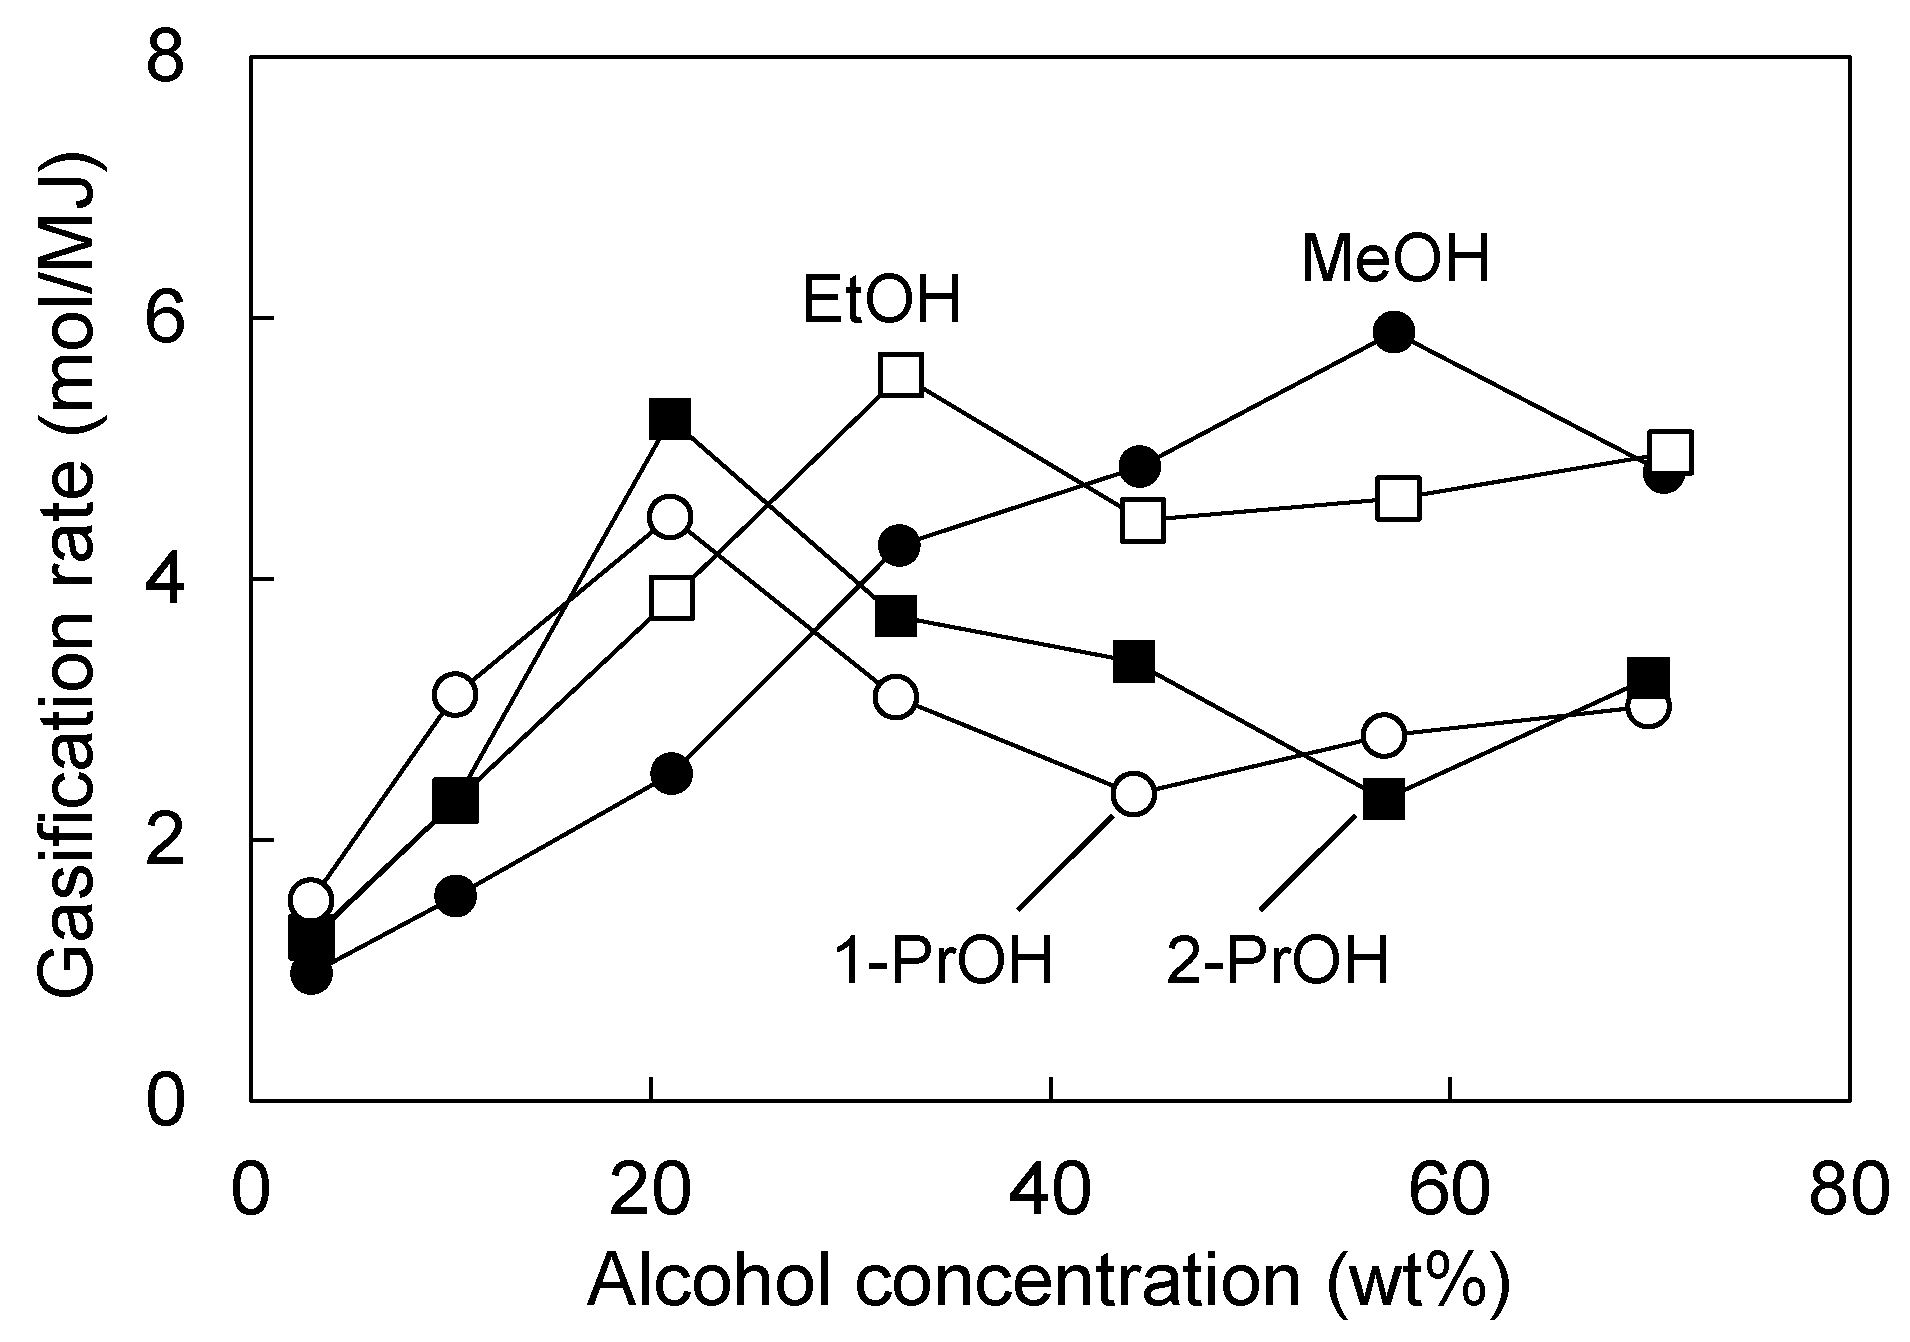
Figure 4 shows the relationship between the gasification rate and alcohol concentration in the solution plasma treatment of each alcohol solution. For all alcohols, the gasification rate increased with increasing alcohol concentration, reached a maximum value at a certain concentration, and then decreased. As the alcohol concentration was further increased, the gasification rate tended to either remain constant or increase again. The experiment could not be performed at alcohol concentrations greater than those indicated in
Figure 4 (>70 wt%) because there was no discharge. The alcohol concentration at which the gasification rate reached a maximum depended on the type of alcohol: for MeOH it was at 57 wt%, for EtOH at 32 wt%, and for both 1-PrOH as well as 2-PrOH, at 21 wt%.
Such behavior with maximum gasification rates is likely indicative of a second-order reaction. In the simplest second-order reaction involving alcohol and water, the gasification rate would be proportional to the product of the mole fraction of alcohol (
x) and that of water (1 −
x) [Equation (2)], wherein the maximum rate is at
x = 0.5.
The fact that the gasification rate had a maximum value suggests that both alcohol and water are involved in the gasification of alcohol. Because OH radicals form in the solution plasma of water [
21], it is likely that in the presently reported experiments, water-derived OH radicals, not water itself, caused the gasification of the alcohols. In accordance with Equation (2), as the alcohol concentration approaches 100%, the water concentration approaches 0%; thus, in this study, the gasification rate would also have approached zero.
However, the gasification rate tended to increase again at higher alcohol concentrations. This fact suggests that a first-order reaction was also involved in the gasification pathways of the alcohols with the second-order reaction. In other words, there is likely a pathway in which only an alcohol molecule is degraded, without the influence of water. In the simplest case, the gasification rate would be proportional to the alcohol concentration (
x), as below:
Consequently, the change in gasification rate with alcohol concentration in
Figure 4 was considered to be attributable to a combination of first- and second-order reactions.
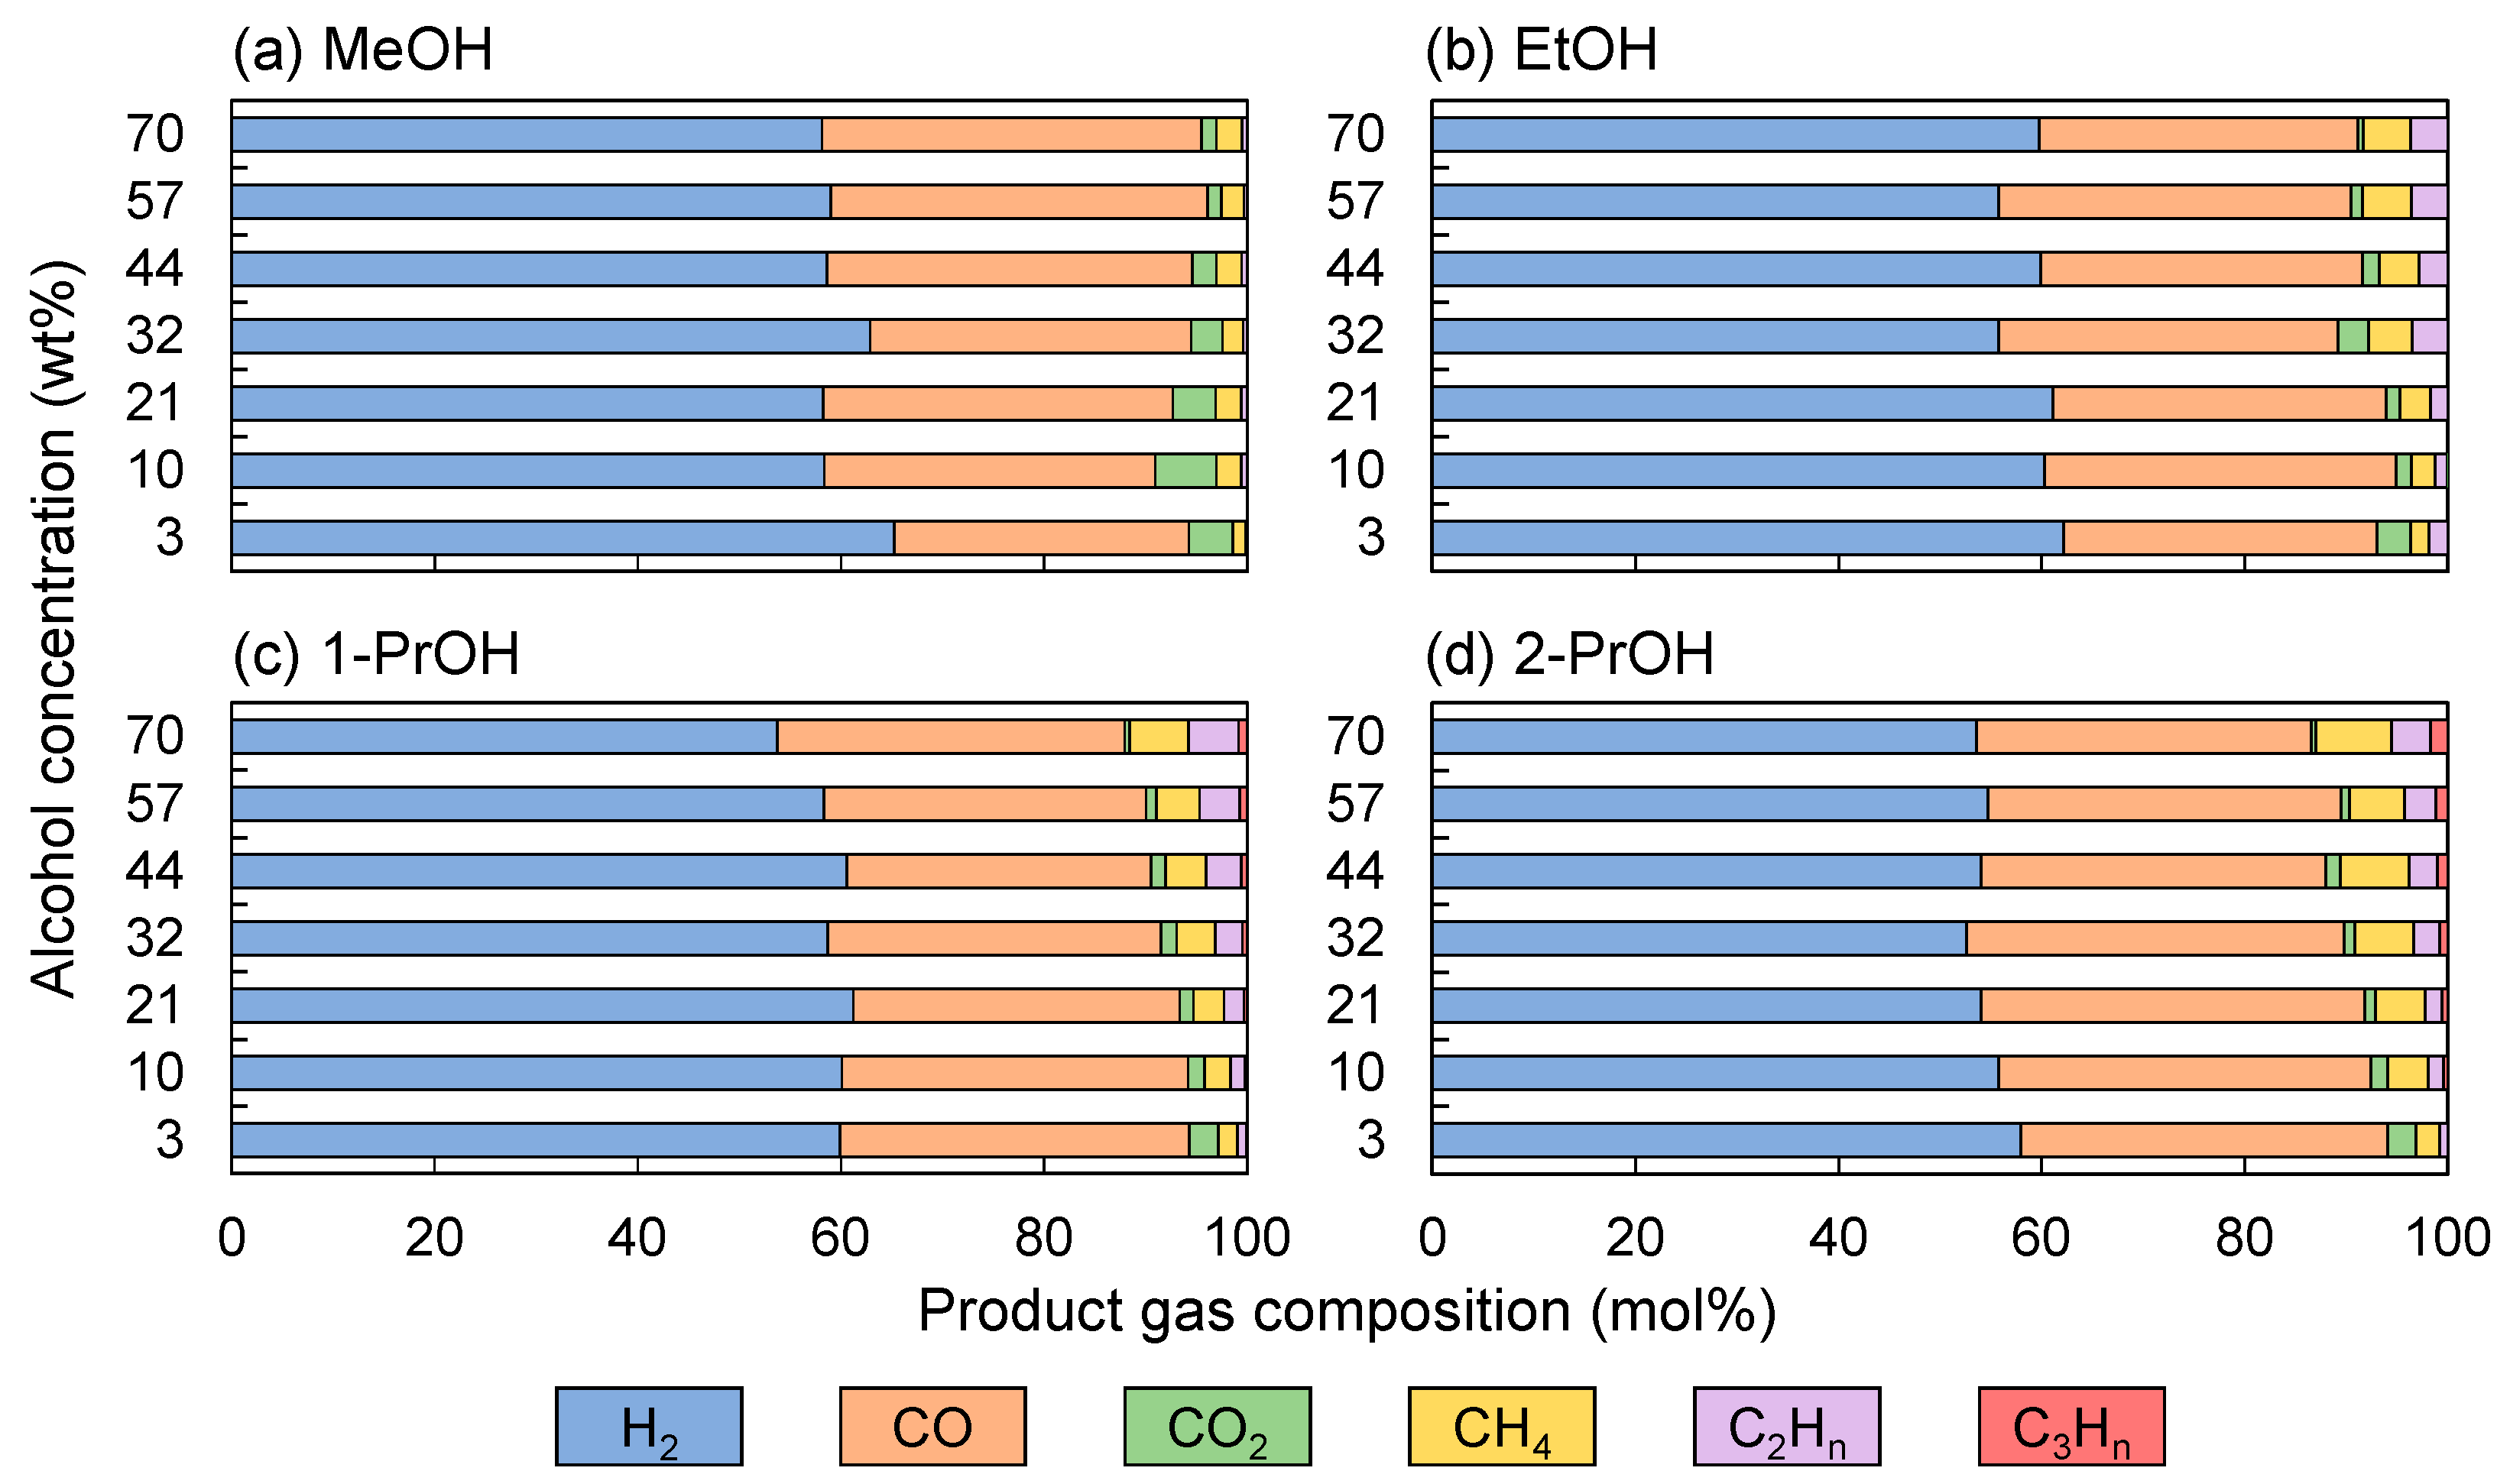
Figure 5 shows the composition of the gases produced from each alcohol solution. H
2 and CO were the major gases produced from all the aqueous alcohols, with small percentages of other gases. The H
2/CO ratio in the product gas was in the range of 1.4–2 for all alcohols and varied slightly with alcohol concentration, but there was no clear trend in the changes (
Table 1). The H
2/CO ratios for MeOH, EtOH, and 1-PrOH tended to be close to 2, whereas that for 2-PrOH was ca. 1.5—slightly lower than that of the other alcohols.
The CO
2 ratios were low for all alcohols and tended to decrease with increasing alcohol concentration, although there was some fluctuation. As discussed in a subsequent paragraph, because CO
2 was not formed during atmospheric pressure plasma treatment in the absence of water, the formation of CO
2 was attributed to the presence of water. This might have been because of the water–gas shift reaction (CO + H
2O → CO
2 + H
2) [
27]. The present authors assumed that a higher alcohol concentration corresponded to a lower concentration of water, thus reducing the opportunity for the water–gas shift reaction and resulting in lower CO
2 ratios. In the gasification of alcohols in supercritical water, Susanti et al. reported that the gasification of MeOH and EtOH at 740 °C/25 MPa produced H
2 and CO
2 as the main product gases, with a little CO [
28]. Due to the high temperature and density of supercritical water, the water–gas shift reaction would be more pronounced. In the solution plasma process, the decomposition of alcohol was mainly in the vapor bubbles of water and alcohol, where there were gas-phase discharges [
27]. Therefore, the water–gas shift reaction would not be pronounced because of the low density of water in the reaction field.
The ratios of hydrocarbon gases such as CH
4, C
2, and C
3 were small in all of the analyzed aqueous alcohols. For MeOH (
Figure 5a), the CH
4 ratio tended to increase with increasing alcohol concentration, and very small amounts of C
2 and C
3 hydrocarbons were produced. For EtOH (
Figure 5b), the ratios of CH
4 and C
2 hydrocarbons tended to increase with increasing alcohol concentration, with a limited formation of C
3 hydrocarbons. For 1-PrOH and 2-PrOH (
Figure 5c,d, respectively), C
3 hydrocarbons were formed to some extent in addition to CH
4 and C
2 hydrocarbons, and the ratios of these hydrocarbons increased with increasing alcohol concentration. Comparing 1-PrOH and 2-PrOH, the former produced a higher proportion of C
2 hydrocarbons, and the latter, a higher proportion of CH
4. Thus, for all alcohols, the ratios of hydrocarbon gases tended to increase with increasing alcohol concentration. This proportion to alcohol concentration is likely indicative of a first-order reaction. Combined with the discussion in
Figure 4, it is clear that the C
1–C
3 hydrocarbons would have been formed solely by the decomposition of alcohol without the influence of water.
3.2. Decomposition of Alcohols in Atmospheric Pressure Plasma
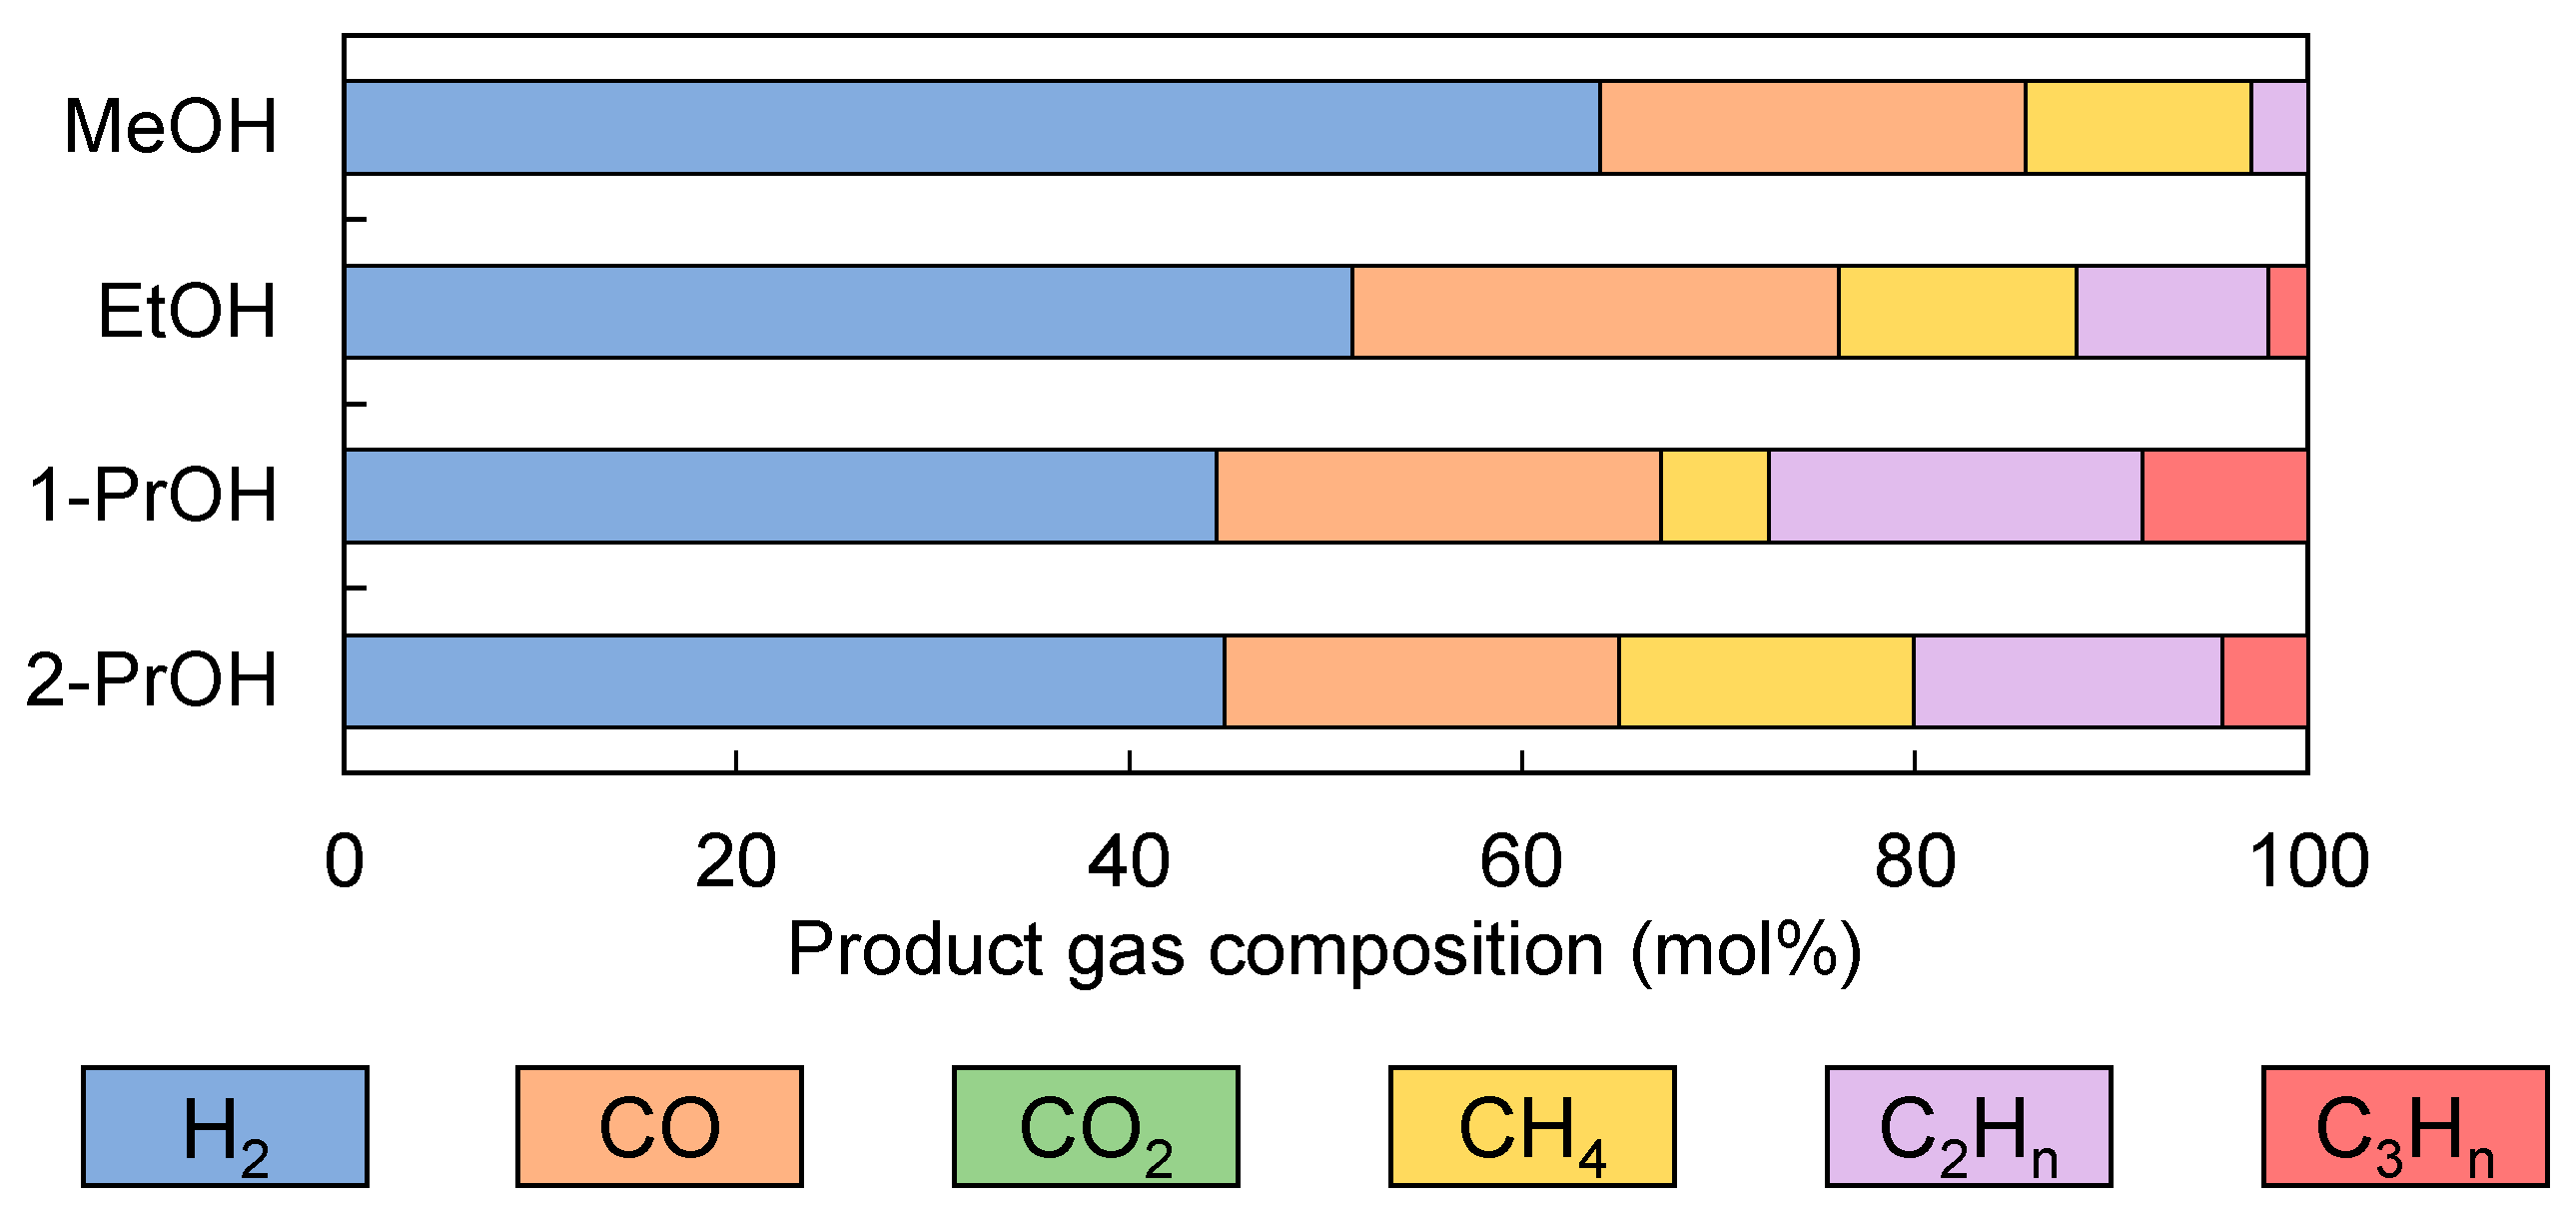
Figure 6 shows the composition of the gases produced from the selected alcohols treated in atmospheric pressure plasma (approximately 20 W for 4 min) without water. The solution plasma used in this study is a gas-phase discharge that occurs in vapor bubbles generated by the volatilization of water and alcohol by Joule heating [
27]. Both the atmospheric pressure plasma and the solution plasma in this study were gas-phase discharges, with the main difference between them being the presence/absence of water.
Similar to what had occurred in the solution plasma treatment, H
2 and CO were the first and second major gases produced, respectively, but the ratios of C
1–C
3 hydrocarbon gases were substantially larger than what had been noted in the case of the solution plasma. The percentages of hydrocarbon gases were even larger for alcohols with higher numbers of carbon atoms. Comparing 1-PrOH and 2-PrOH, the former produced C
2 hydrocarbons in higher ratios, whereas the latter produced more CH
4; this tendency was similar to what had been noted in the case of the solution plasma. Thus, the ratios of hydrocarbon gases in the product gas were large under the atmospheric pressure plasma treatment in the absence of water. Therefore, the increase in hydrocarbon gases with alcohol concentration in solution plasma (
Figure 5) can be attributed to an increase in decomposition reactions in which water is not involved. As suggested in a subsequent paragraph, this is probably because of gasification pathways in which solely the alcohol decomposes. In the case of the atmospheric plasma treatment, no CO
2 was produced; as discussed in
Section 3.1, the production of CO in solution plasma would have certainly occurred because of the water–gas shift reaction.
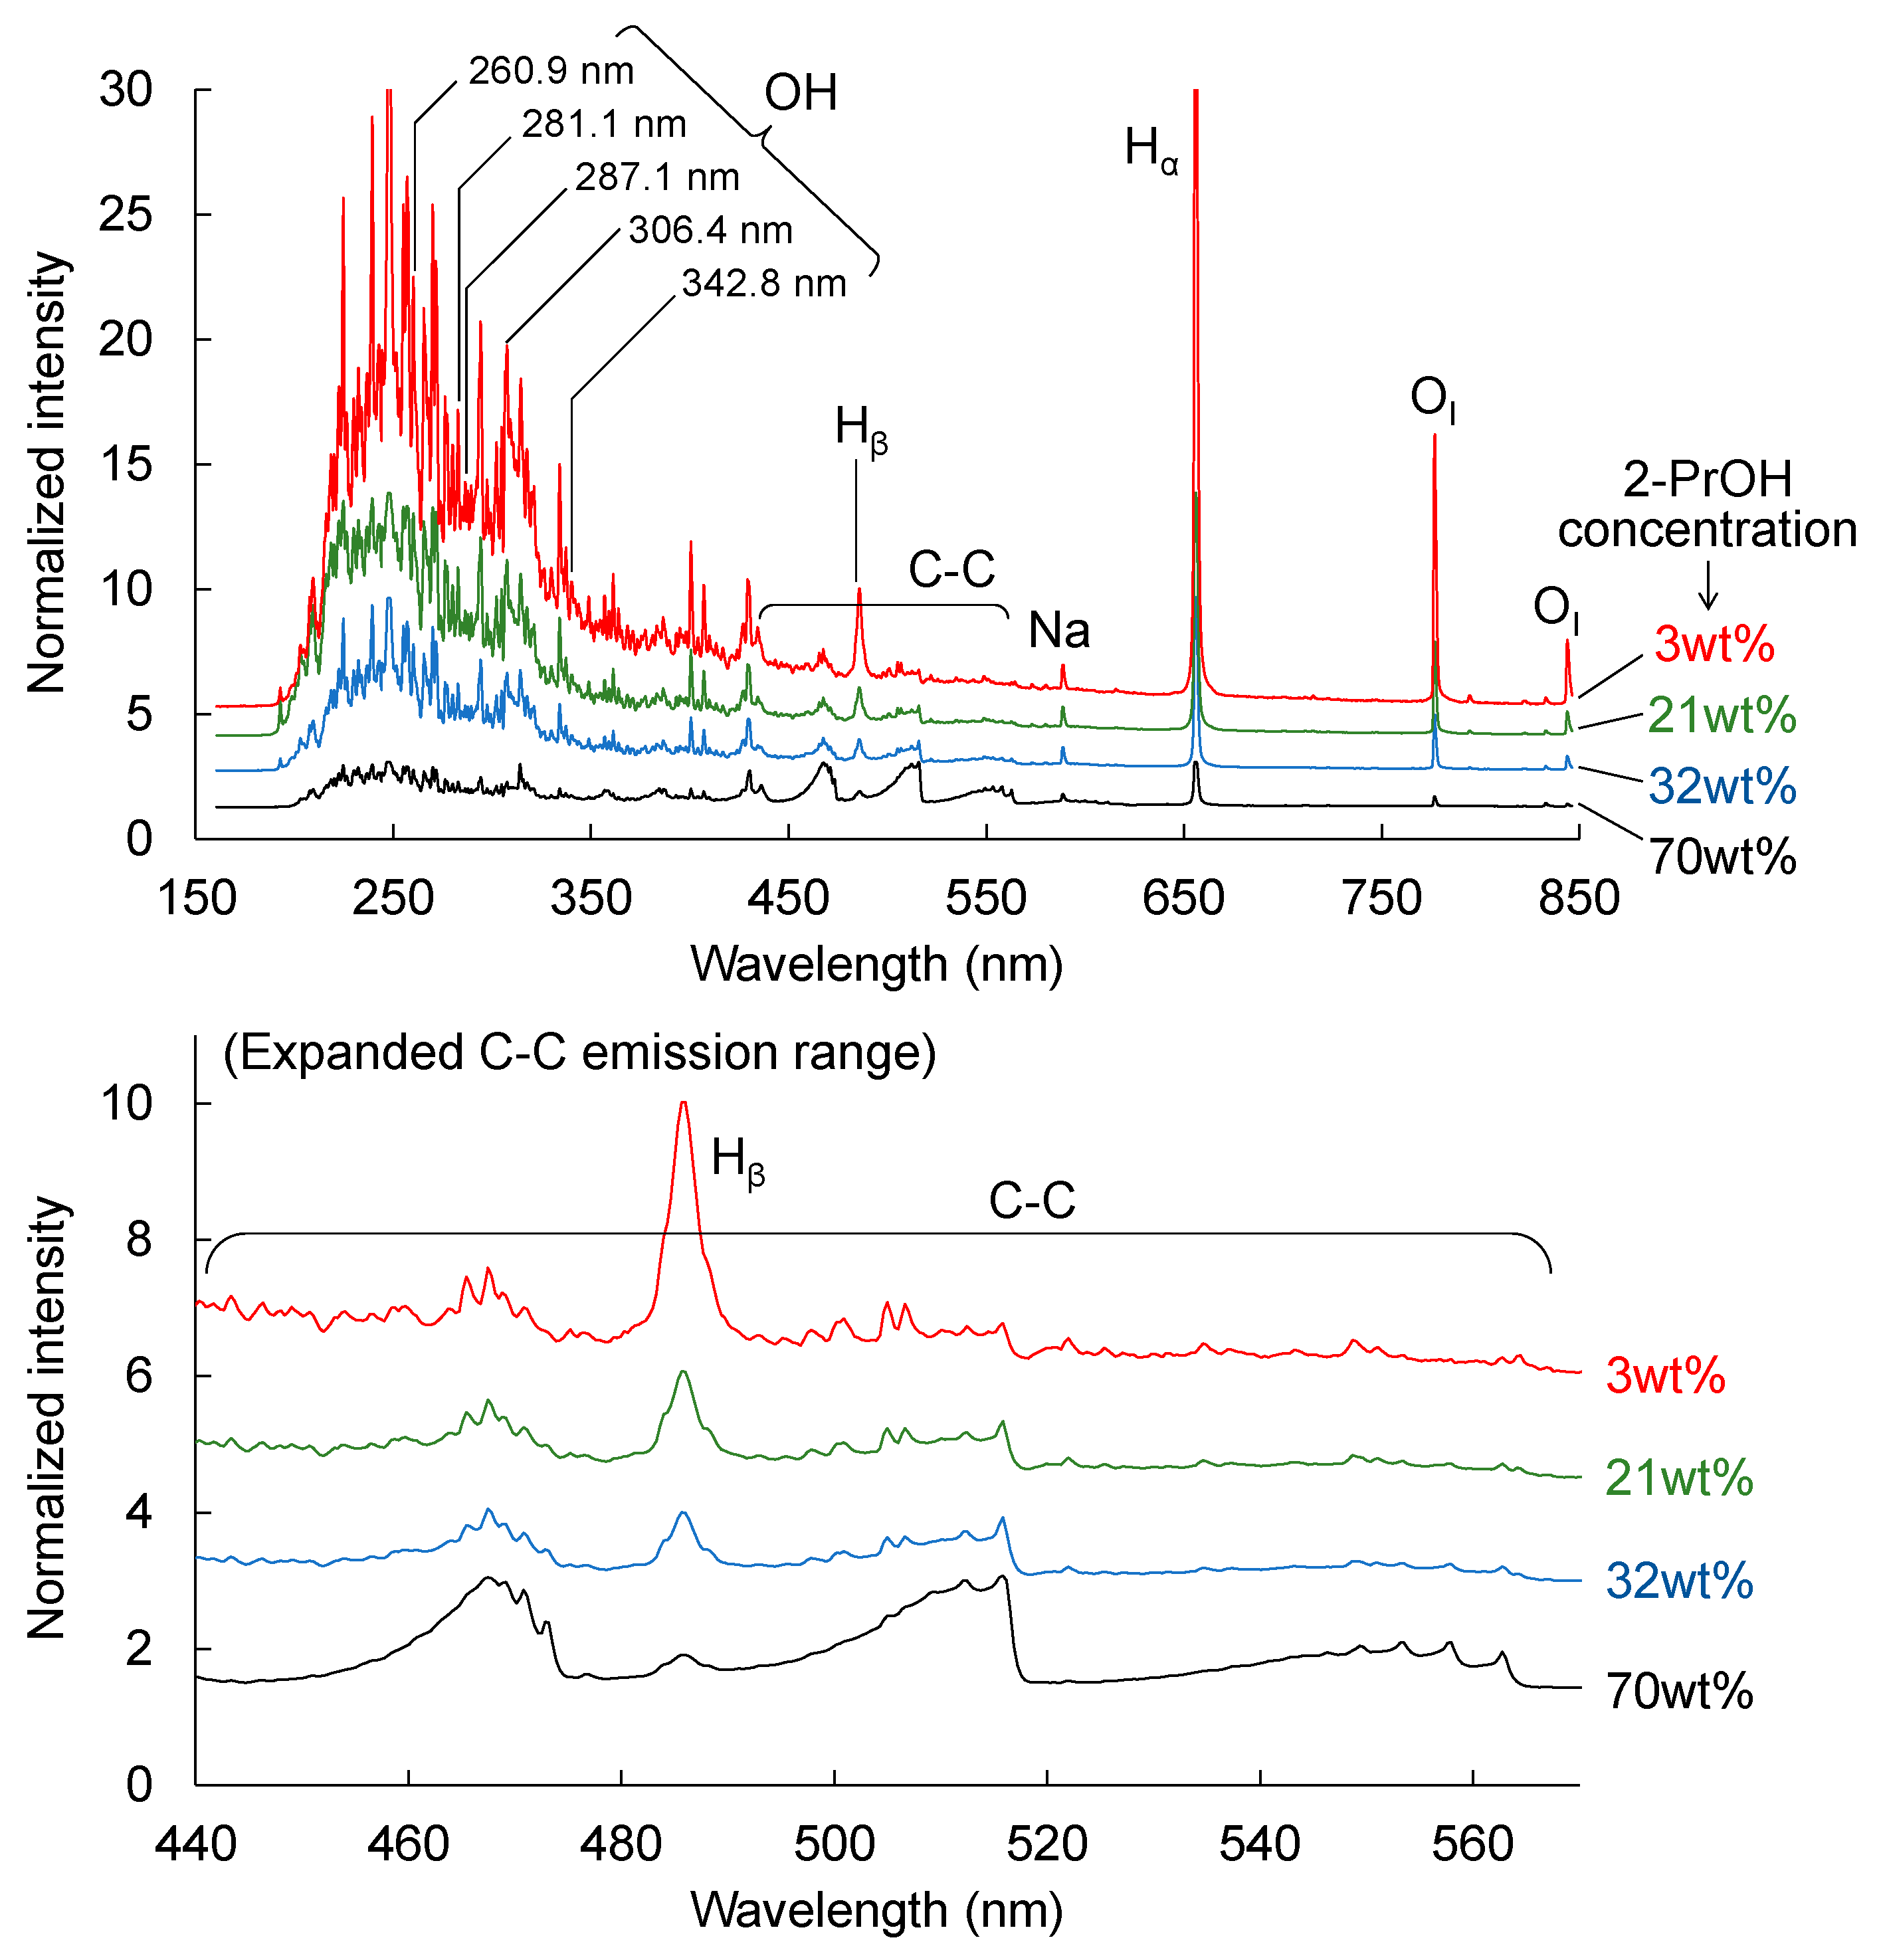
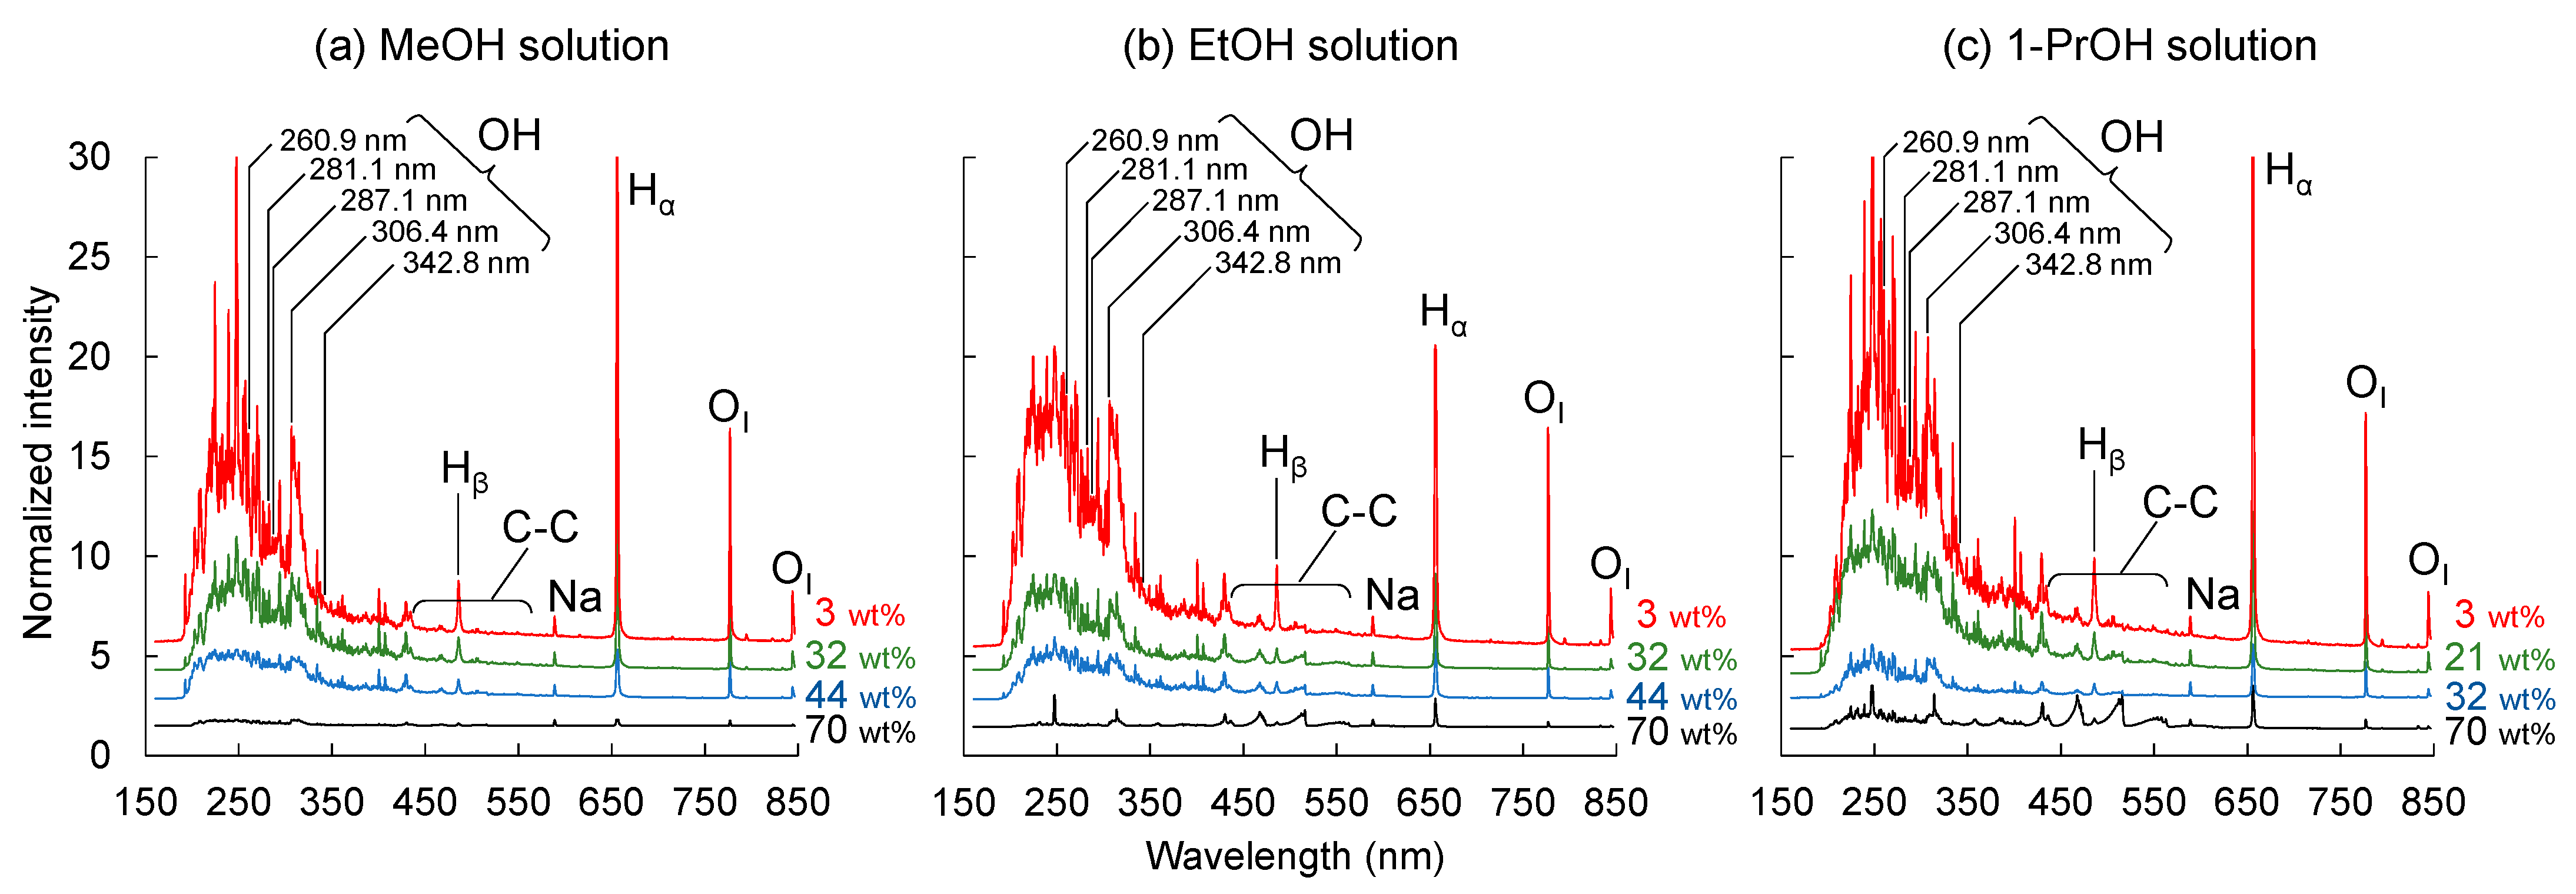
3.3. Plasma Emission Spectroscopy
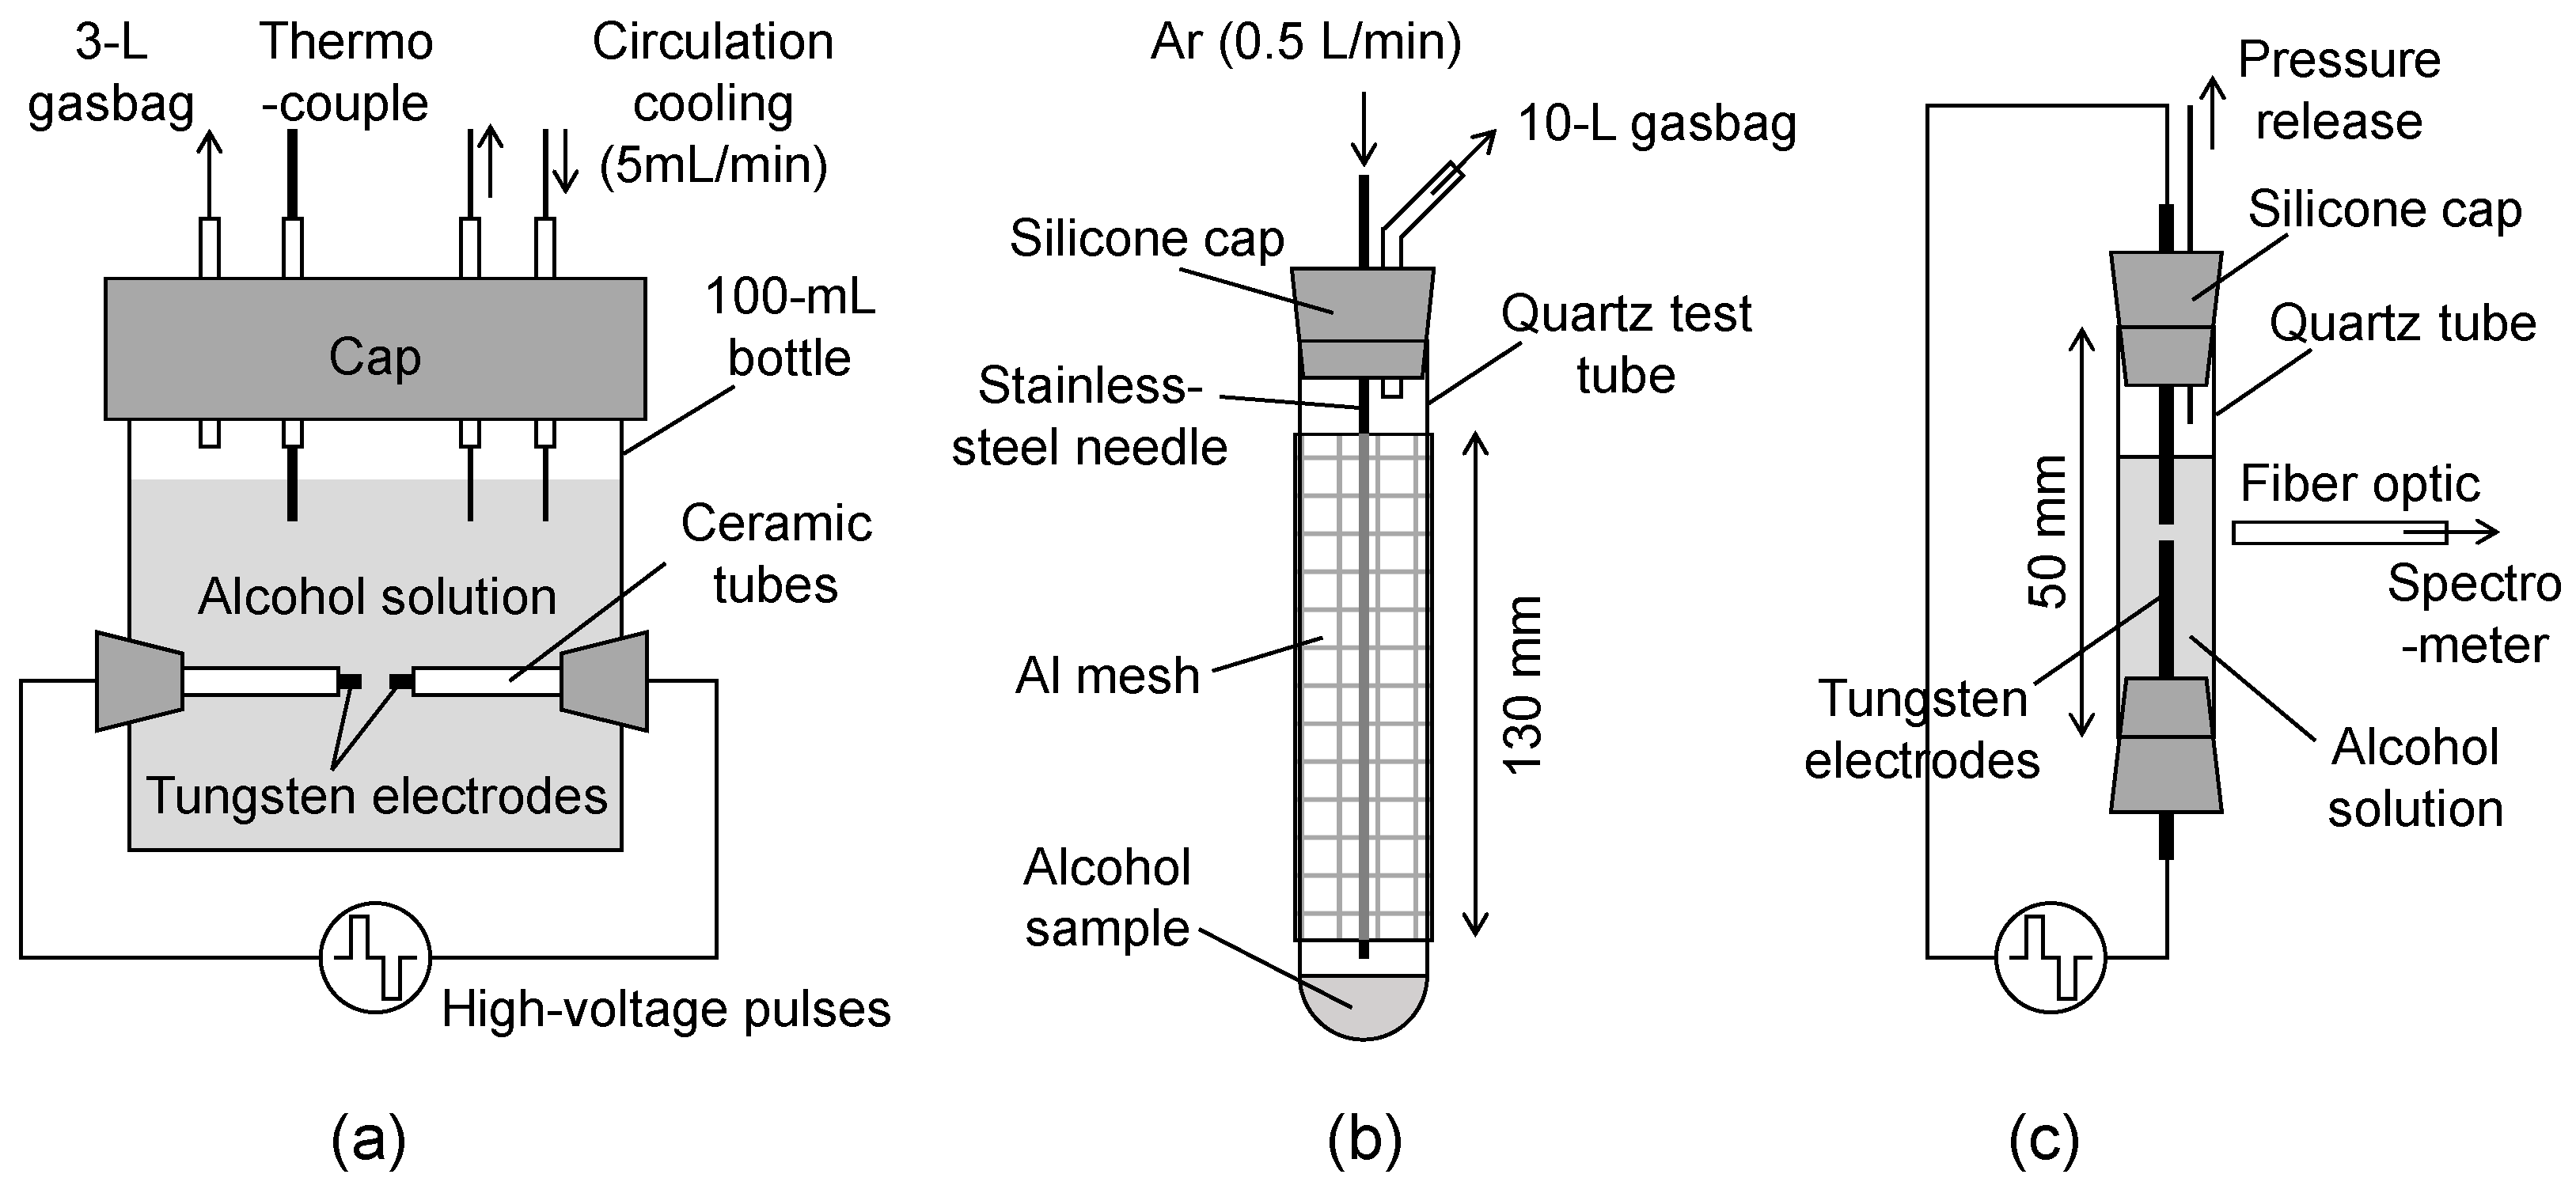
Using the reactor shown in
Figure 1c, the emission from solution plasma was analyzed spectroscopically. Since there were no substantial differences between the alcohols, only the spectra of aqueous 2-PrOH are shown in
Figure 7. The spectra for other alcohols are shown in
Appendix B (
Figure A2). Each peak was assigned according to the literature [
29]. Emissions from chemical species such as OH, C-C, H, O, and Na were observed in the spectra. The intensities of the emission from OH radicals at 260.9, 281.1, 287.1, 306.4, and 342.8 nm weakened as the alcohol concentration increased (i.e., as the water concentration decreased), and became almost nondetectable at an alcohol concentration of 70 wt%. This indicates that most of the OH radicals in the plasma had originated from water and none from the alcohols. The H and O peaks were similar to OH, and most of these would have also come from water. The contribution of OH radicals to the decomposition of EtOH in solution plasma was also mentioned by Zhao et al. [
21].
In
Section 3.1, the second-order reaction was discussed as a reason for the gasification rate having a maximum value.
Figure 7 indicates that OH radicals were generated almost proportionally to the water concentration, indicating that the gasification of alcohols with OH radicals might have led to the behavior reminiscent of a second-order reaction.
To further discuss the reaction between alcohols and OH radicals, it must be noted that the O/C ratio of the product gas was calculated from the gas composition in
Figure 5 (
Table 2). The O/C ratio of the product gas from MeOH was ca. 1 at any MeOH concentration. Since the O/C ratio of the MeOH molecule (CH
3OH) was also 1, this result was reasonable regardless of the decomposition path.
The O/C ratios of EtOH (C
2H
5OH), 1-PrOH, and 2-PrOH (C
3H
7OH) molecules were 0.5, 0.33, and 0.33, respectively, but the O/C ratios of the product gas were all close to 1. The excess O atoms in the product gas, as compared with the number of O atoms in the feedstock, should have originated from the O atoms of water molecules. The O/C ratio of the product gas being close to 1 indicates that most of the C atoms of the alcohols were combined with O atoms, suggesting a strong influence of OH radicals from water. In addition, for EtOH, 1-PrOH, and 2-PrOH, the O/C ratio decreased monotonically from 1 with increasing alcohol concentration. This decrease might have been because of the decrease in OH radicals from water, and thus, the decrease in the decomposition path with OH radicals. As shown in
Figure 7, the intensities of C–C emissions increased with increasing alcohol concentration, corresponding to the increase in hydrocarbon gases in
Figure 5; this might have been because of the increase in the frequency of the sole decomposition of alcohol.
Instead of the O/C ratio of alcohol molecules, the O/C ratio of aqueous alcohol can be discussed. The O/C ratio of aqueous alcohol is large, especially in dilute solutions. For example, the O/C ratio is 58.5 (mol/mol) in a 3 wt% methanol solution and 2.8 in a 50 wt% methanol solution; these values are very different from the ratio of the product gas. Therefore, gas production is not related to the O/C ratio of an aqueous alcohol solution.
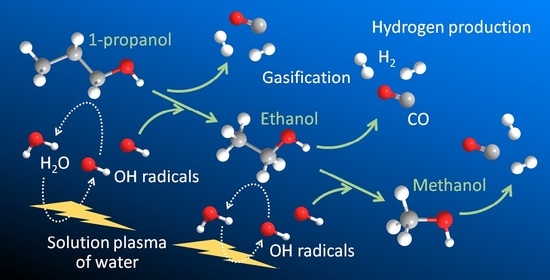
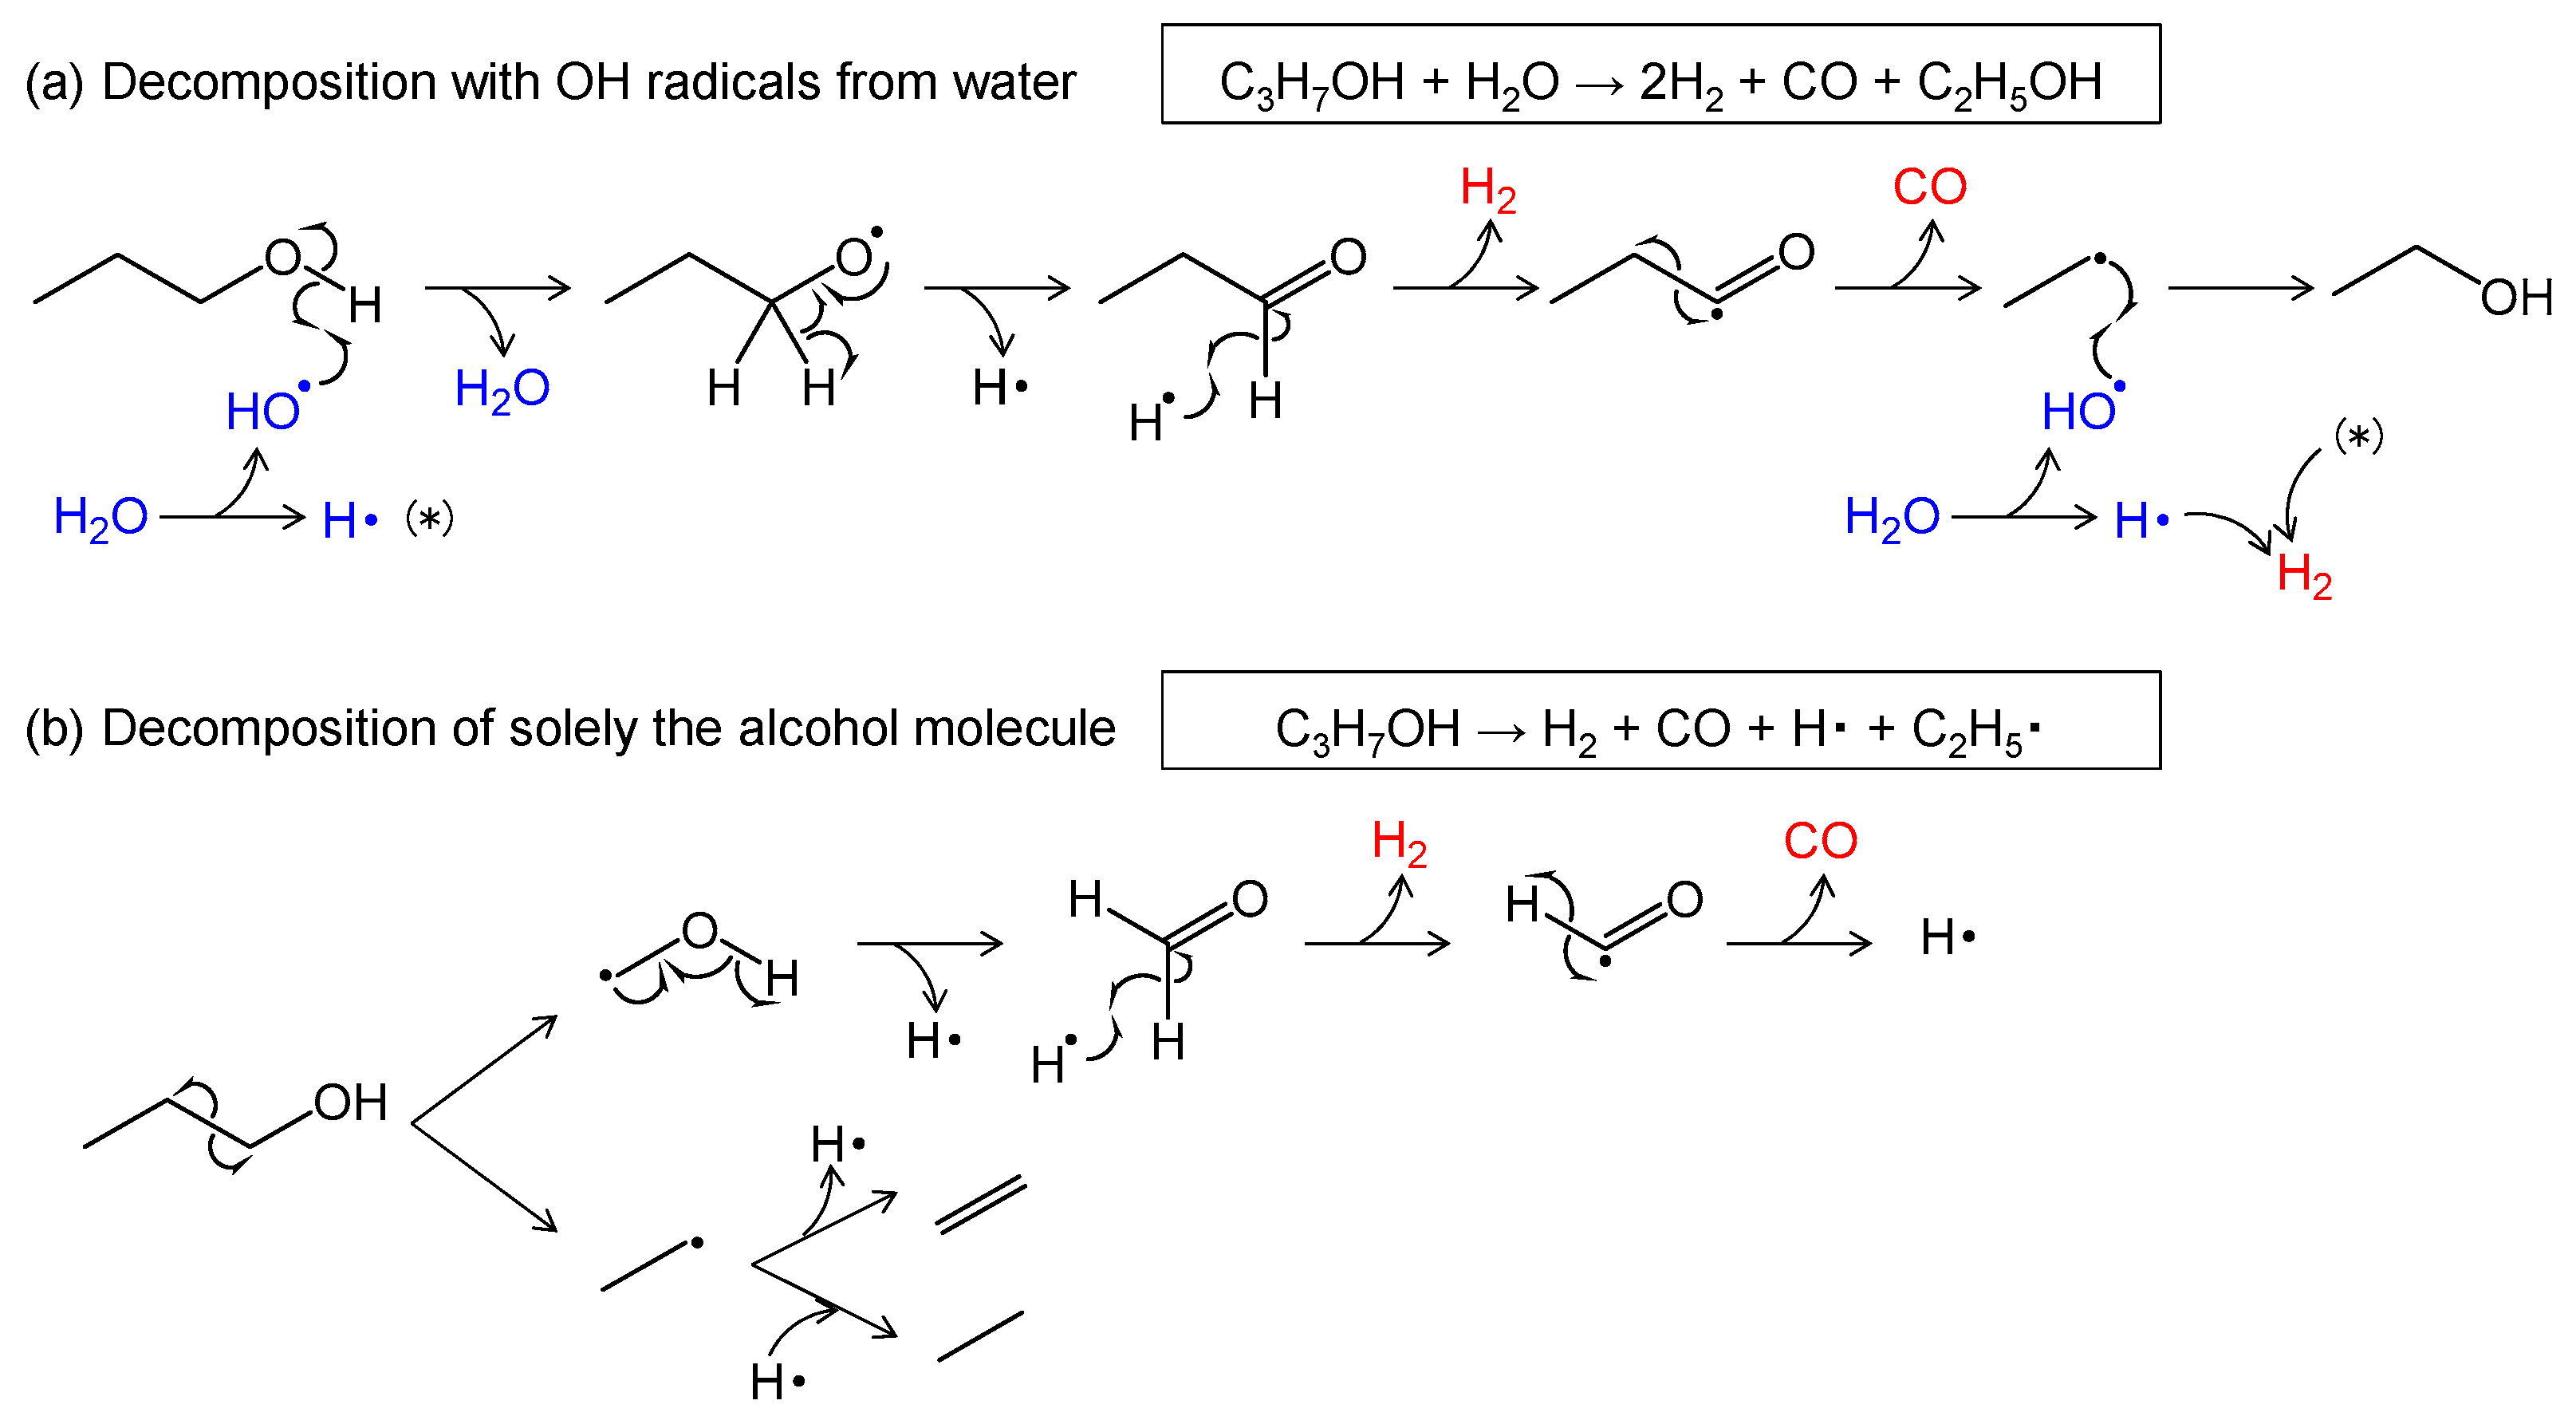
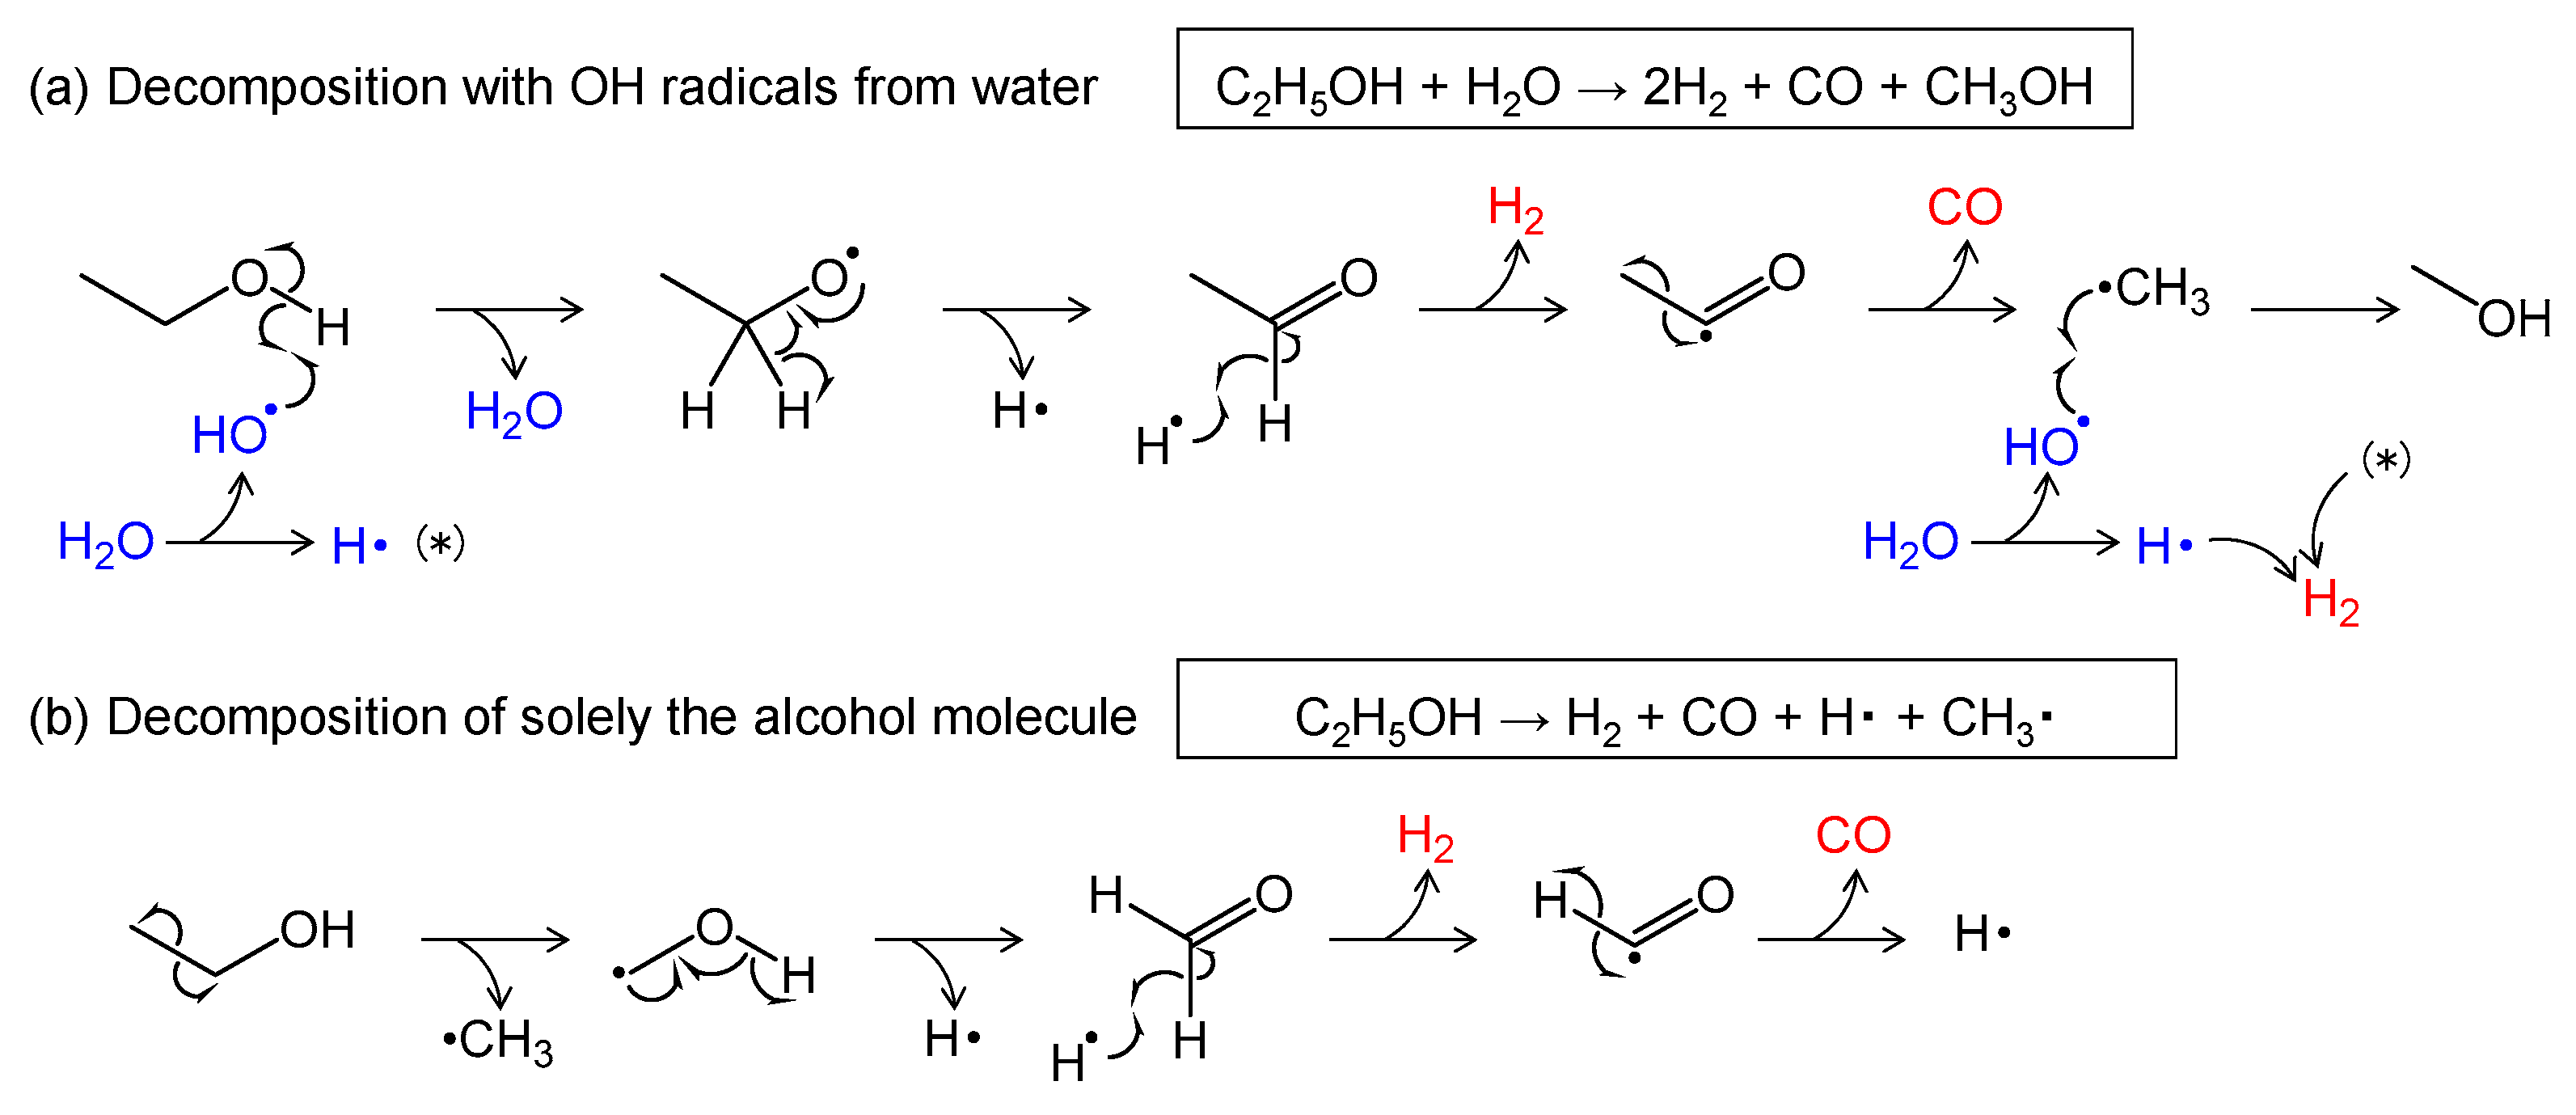
3.4. Proposed Decomposition Pathway of Alcohols in Solution Plasma
Considering these lines of evidence and discussion, the solution plasma treatment of alcohols might have involved two degradation pathways: (a) the oxidative decomposition with OH radicals from water and (b) the decomposition of solely the alcohol molecule. The former is a second-order reaction and the latter is a first-order reaction, and their combination can explain the changes in gasification rate shown in
Figure 4. For example,
Figure 8 suggests possible decomposition pathways for 1-PrOH. In pathway (a), 1-PrOH undergoes the abstraction of an H atom by an OH radical and decomposes in a manner that forms propionaldehyde (which was found in the micro-GC analysis (
Figure 3)), followed by decarbonylation in a manner that forms an ethyl radical. If the OH radicals are abundant in the reaction system, the ethyl radical can couple with an OH radical in a manner that forms EtOH. This pathway produces two H
2 molecules and one CO molecule, whereas the alcohol reduces one carbon chain as follows.
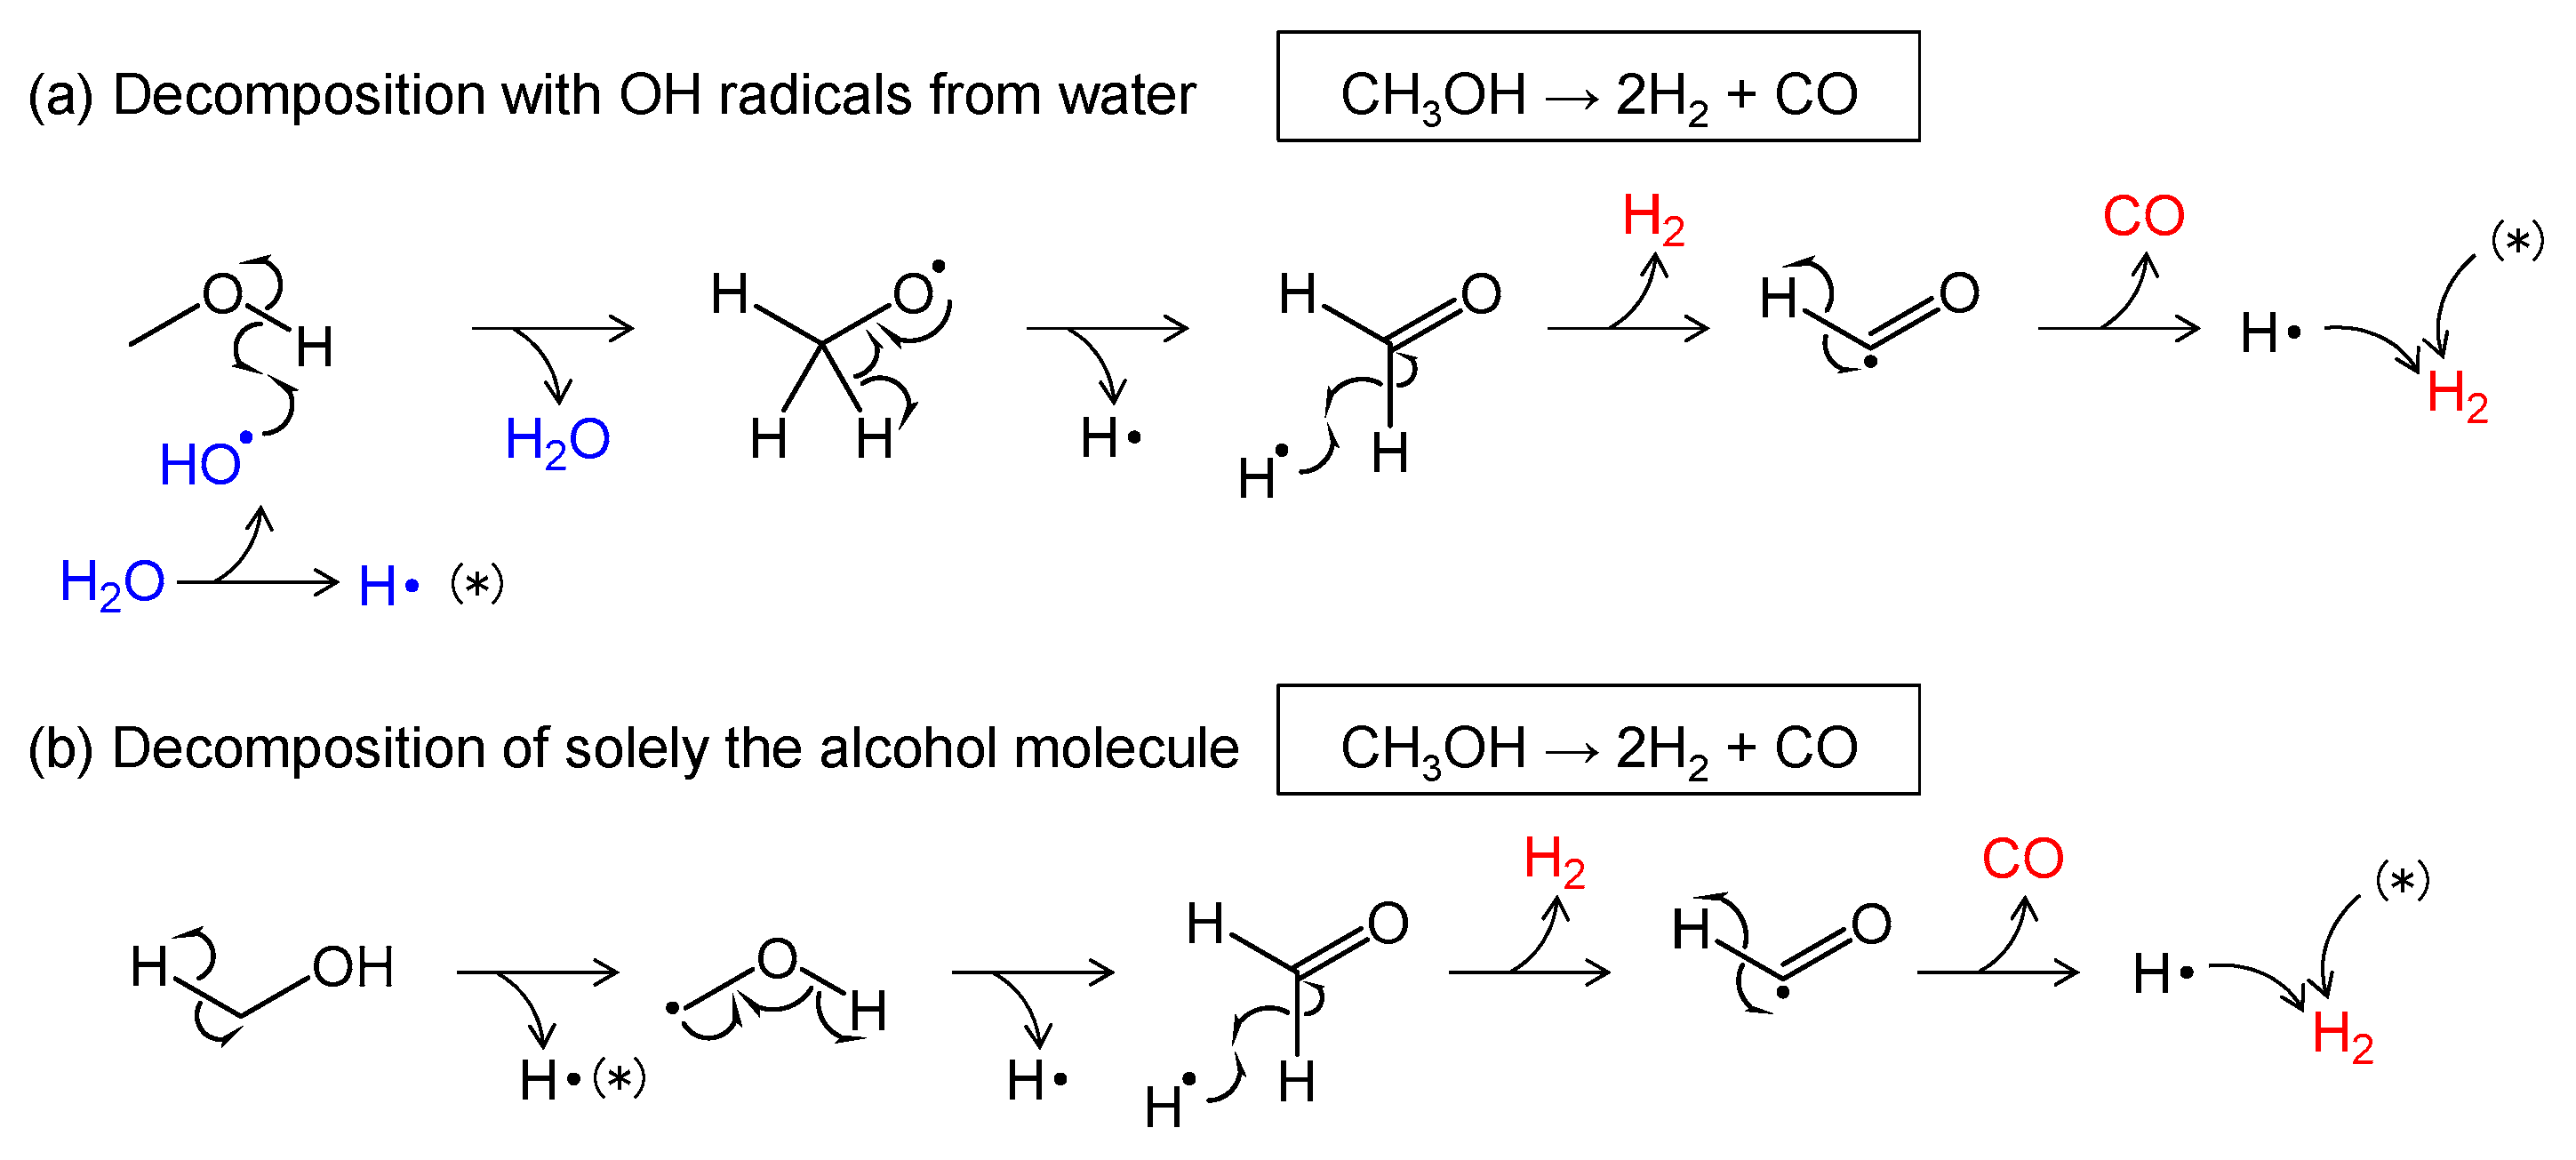
A similar pathway can be provided for EtOH and MeOH (
Appendix C,
Figure A3a and
Figure A4a), respectively. Thus, with a strong contribution of OH radicals from water, 1-PrOH can be completely gasified stepwise via EtOH and MeOH, eventually producing H
2 and CO in a 2:1 ratio. The net reaction for the complete gasification of 1-PrOH by this pathway (a) is as follows.
Table 1 indicates that the H
2/CO ratios of the product gases from MeOH, EtOH, and 1-PrOH were ca. 2. Although there is currently no direct evidence to support this pathway, it can explain the composition of the product gas and the intermediates. However, for the ethyl radical to couple with the OH radical in this pathway, the OH radicals would have to be abundant relative to the water. More research and direct evidence are needed to clarify this point.
In pathway (b), a homolytic C–C bond cleavage, probably caused by collision with a high-energy electron, decomposes 1-PrOH into a hydroxymethyl radical and an ethyl radical. The former gasifies via formaldehyde in a manner that forms H
2 and CO, whereas the latter produces either ethylene or ethane. The reaction equation for this pathway (b) is as follows.
CH
4 and C
3 hydrocarbons were also produced in
Figure 5c, and they could have been formed if either the terminal C–C bond or the C–O bond were cleaved first. A similar pathway can be given for EtOH (
Figure A3b). Thus, pathway (b) for 1-PrOH and EtOH (
Figure 8b and
Figure A3b, respectively) eventually produces H
2 and CO in a 1:1 ratio with some hydrocarbon gases. Since MeOH produces two H
2 molecules and one CO molecule in pathway (b) (
Figure A4b), the result is the same as in pathway (a) (
Figure A4a). These pathways, in which solely alcohol decomposes without OH radicals, can explain the fact that the concentration of hydrocarbon gases increased when the alcohol concentration was high.
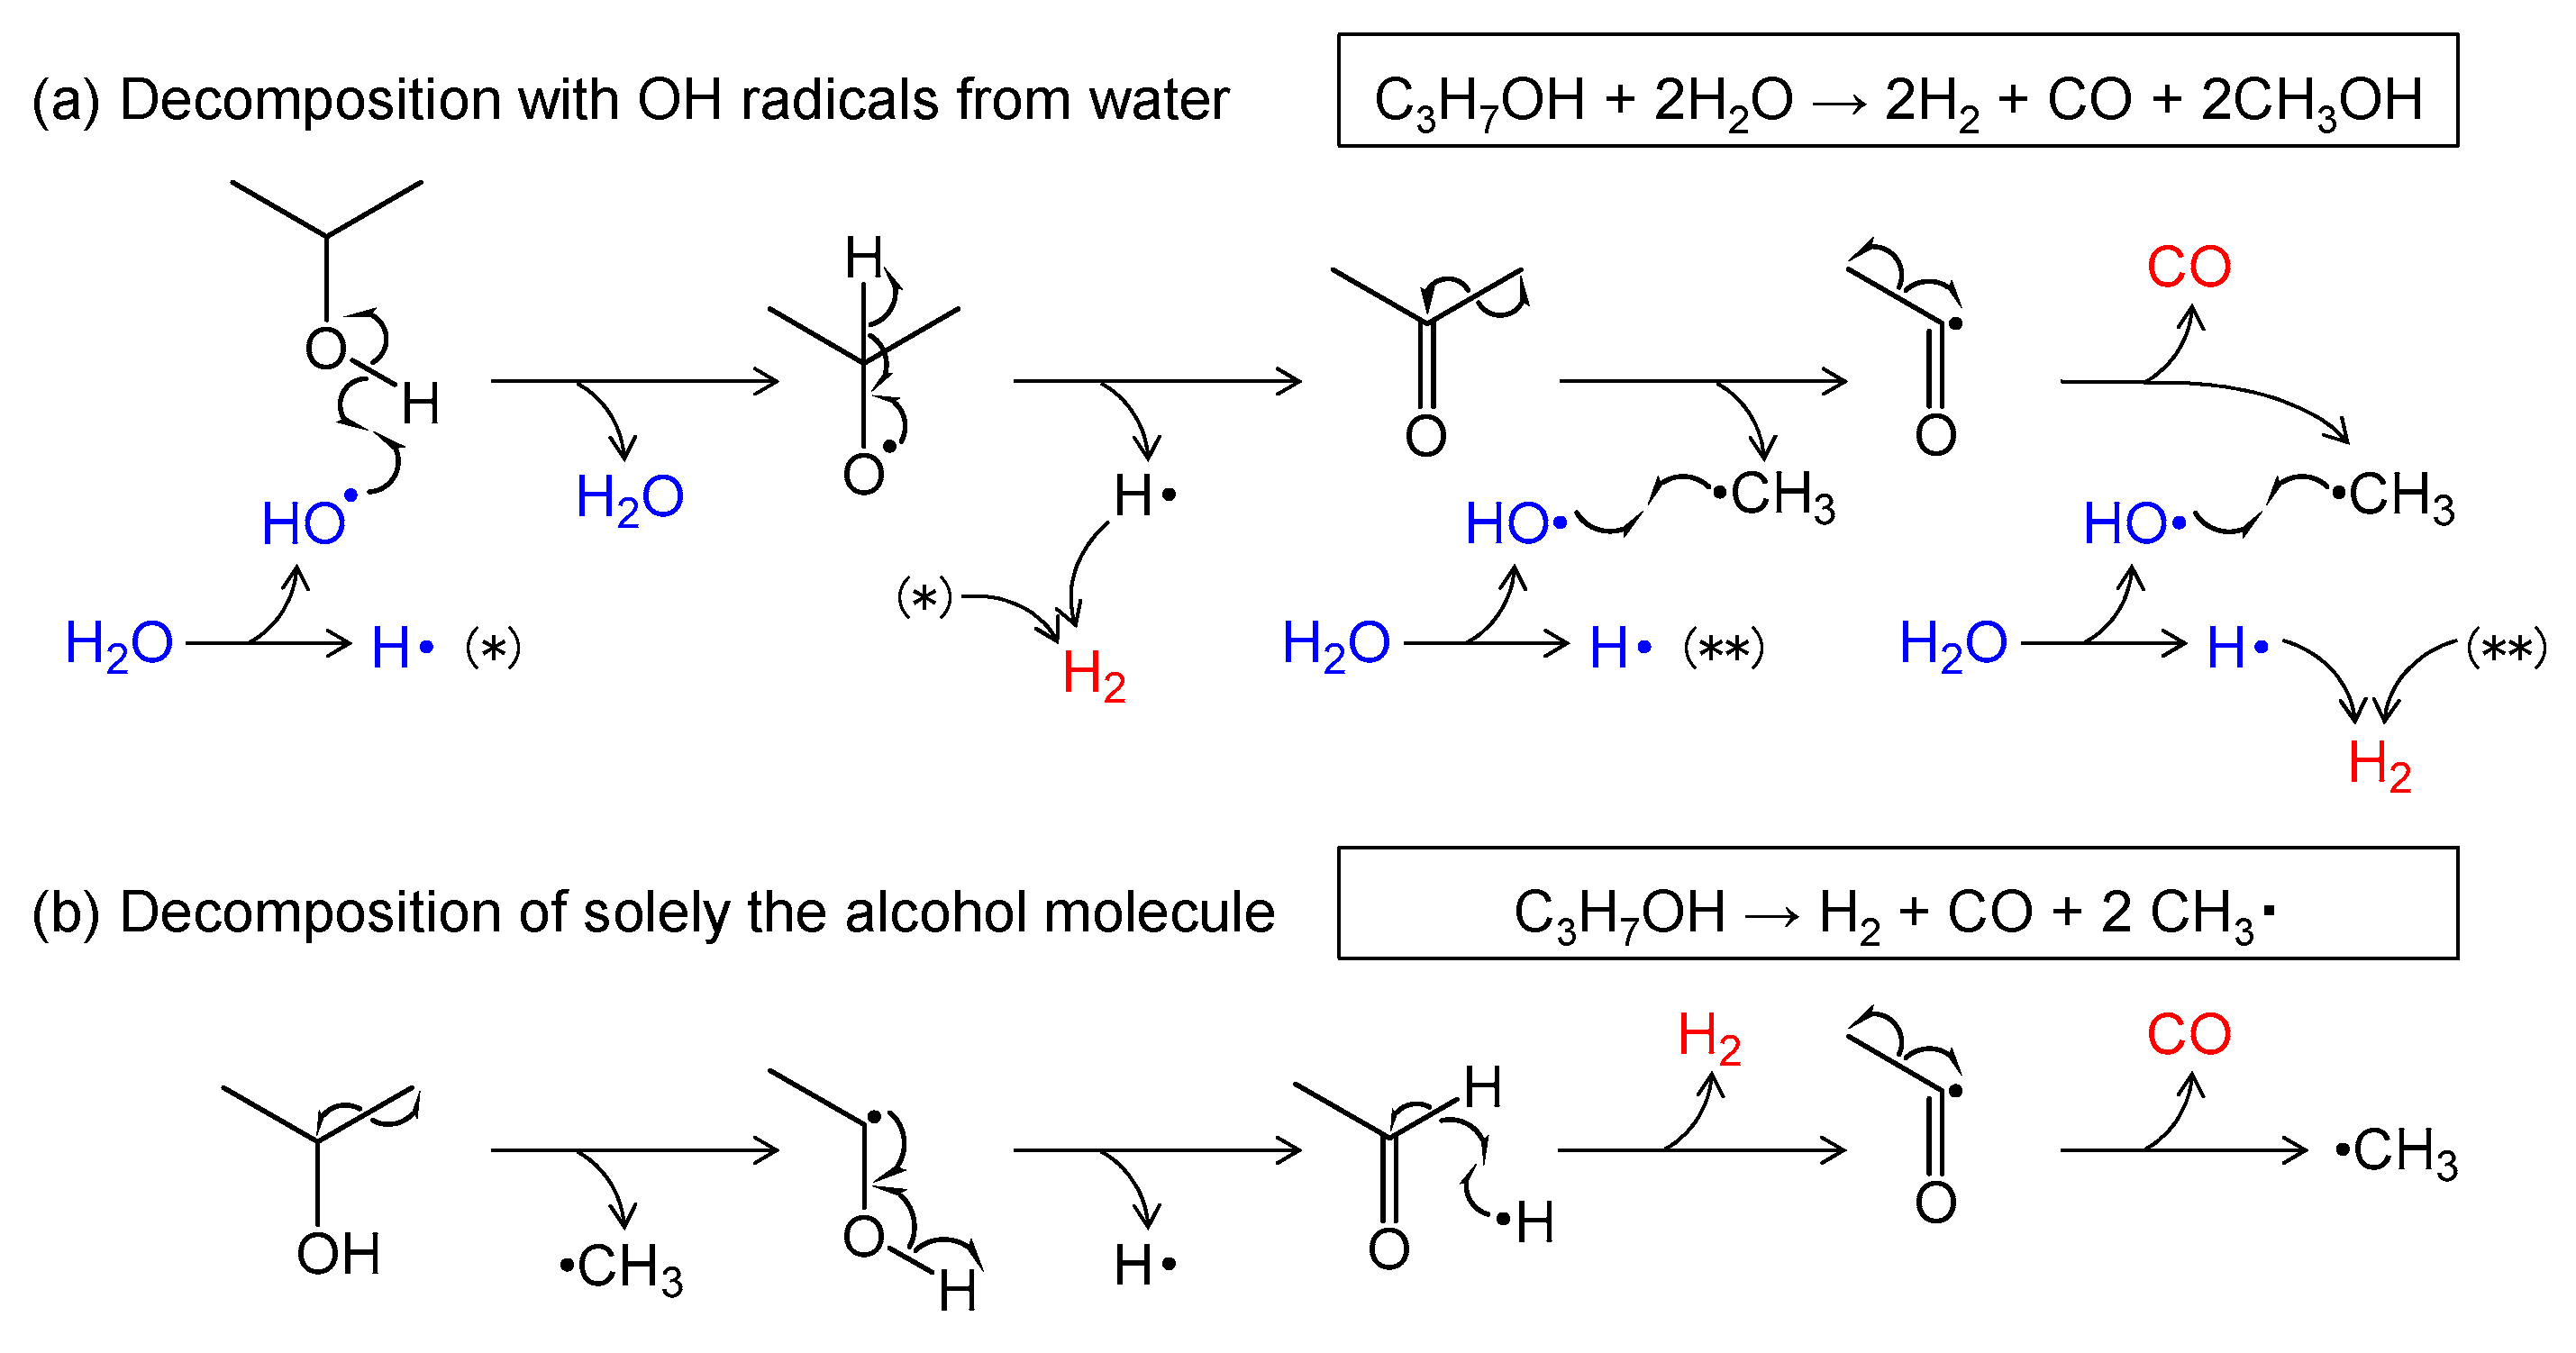
The degradation pathway for 2-PrOH is likely slightly different (
Figure 9). In pathway (a), an OH radical abstracts an H atom from 2-PrOH in a manner that forms acetone, which is further gasified by decarbonylation via an acetaldehyde radical. This pathway yields H
2 and CO in a 2:1 ratio with two methyl radicals. If all two methyl radicals couple with OH radicals in a manner that forms two MeOH molecules, the net reaction is represented by the equation below.
The produced MeOH will also further decompose into H
2 and CO in a 2:1 ratio (
Figure A4), but many OH radicals are required in this pathway (
Figure 9a) compared with the case of 1-PrOH (
Figure 8a). Therefore, the frequency of methyl radicals coupling with other radicals such as H could increase, leading to an increase in CH
4 (
Figure 5d) and a decrease in H
2 (
Table 1). In pathway (b), however, 2-PrOH produces H
2 and CO in a 1:1 ratio via an acetaldehyde radical, and two methyl radicals are also produced as follows.
In this pathway, where no OH radicals are involved, these methyl radicals are converted into hydrocarbons. Thus, pathways (a) and (b) in
Figure 9 can explain the composition of the product gas and intermediates (acetone and acetaldehyde) from 2-PrOH.
Again, the pathways proposed in
Figure 8 and
Figure 9 are examples that can explain the products and intermediates without contradiction, although there has not yet been any direct evidence for them. In any case, H
2 and CO are the main product gases, and a strong contribution of OH radicals would lead the H
2/CO ratio to approach 2 and the O/C ratio to approach 1 in the product gas from any of the alcohols studied.


