Article

Formation and Detection of Hydrogen by Oxygen Discharge Using Oxygen Pump-Sensor

Graduate School of Engineering, Akita University, Akita 010-8502, Japan
*
Author to whom correspondence should be addressed.
Hydrogen 2022, 3(4), 463-473; https://doi.org/10.3390/hydrogen3040029
Submission received: 14 October 2022 / Revised: 10 November 2022 / Accepted: 14 November 2022 / Published: 18 November 2022
(This article belongs to the Topic Hydrogen Production Processes)

Abstract

:
An oxygen pump sensor was constructed using yttria-stabilized zirconia, which is an oxide ion conductor, and oxygen was discharged from steam to generate hydrogen. The oxygen pump sensor consisted of a pump that discharges oxygen and a sensor that controls the oxygen partial pressure by having electrodes in two places. Oxygen was discharged by applying a current to the pump by controlling the potential of the sensor. Hydrogen was then generated from water vapor. Furthermore, an oxygen pump sensor was installed in the second stage, oxygen was supplied by the pump, and the amount of generated hydrogen was measured in situ. This measurement showed that the oxygen partial pressure of the atmosphere decreased as hydrogen was generated. Specifically, the partial pressure of the water vapor generated more hydrogen at 30.8 vol.% than at 12.2 vol.%. Moreover, the amounts of oxygen discharged and hydrogen generated inversely correlated with the potential.

1. Introduction

Global warming is a serious current issue. Greenhouse gases, which are the cause of global warming, are emitted in large quantities from fossil fuel-based power plants. Therefore, a power generation method that does not rely on fossil fuels needs to be established. To this end, hydrogen is now attracting attention as an alternative energy source to fossil fuels [1]. However, hydrogen does not exist in nature and must be produced. Power is currently generated with renewable energy sources, such as solar power generation and wind power generation, and hydrogen is generated by electrolyzing alkaline water using this renewable energy. The hydrogen generated in this manner is referred to as green hydrogen. Many methods for producing this green hydrogen have been reported, such as alkaline water electrolysis [2,3,4,5] and steam electrolysis using a solid electrolyte. For alkaline water electrolysis, Ni-Zn electrodes [6,7], Ni-Al electrodes [8,9,10], Ni-Mo electrodes [11], Raney-Ni electrodes [12,13], Ni-Cu electrodes [14], Ni-Mn electrodes [15], Ni-Co electrodes [16,17], Ni-Pt electrodes [18,19,20] and porous electrodes [21,22,23] have been reported. In particular, research on solid oxide electrolysis cells (SOECs) is being actively conducted [24,25,26,27,28,29]. SOECs use a solid electrolyte to produce water vapor, and oxygen in the water vapor is discharged to generate hydrogen by applying an electric current. For SOECs, investigations of polarization characteristics [30], planar SOFC technology [31], high-temperature water electrolysis [32], deterioration of SOECs due to impurities [33], improvement of SOEC electrode performance [34], hybrid-solid oxide electrolysis cells [35], and SOEC-SOFE systems [36] have been reported. Many attempts have been made to produce hydrogen with high efficiency. However, all studies have investigated the behavior of hydrogen production by applying an electric current to the solid electrolyte, whose shape is a flat plate. Therefore, the authors of this work proposed the construction of an oxygen pump sensor using tubular yttria-stabilized zirconia, which is a solid electrolyte, to efficiently generate hydrogen. Yttria-stabilized zirconia, which is an oxide ion conductor, was used to discharge oxygen. An oxygen pump sensor using a tubular yttria-stabilized zirconia tube consists of a pump that supplies oxygen and a sensor that controls the partial pressure of the oxygen in the atmosphere. The advantage of this method is that changing the current by controlling the potential using a potentiostat clarifies the behavior of hydrogen generation. This oxygen pump sensor can also be used for hydrogen detection devices.
The authors of this work used oxygen pump sensors to control the oxygen partial pressure of the atmosphere. Specifically, oxygen was discharged from water vapor to generate hydrogen using this oxygen pump sensor. Furthermore, the authors then planned to measure the hydrogen with a gas sensor (oxygen pump sensor) in the second stage. Specifically, hydrogen was measured in situ using an oxygen pump sensor containing yttria-stabilized zirconia, which is a solid electrolyte. These measurements showed that even a small amount of hydrogen can be accurately measured [37,38,39,40,41].
Therefore, oxygen was discharged from the water vapor by controlling the potential using an oxygen pump sensor to generate hydrogen in this study. Furthermore, the generated hydrogen was measured in situ using an oxygen pump sensor installed in the second stage. The effects of the water vapor concentration and potential during electrolysis were investigated.

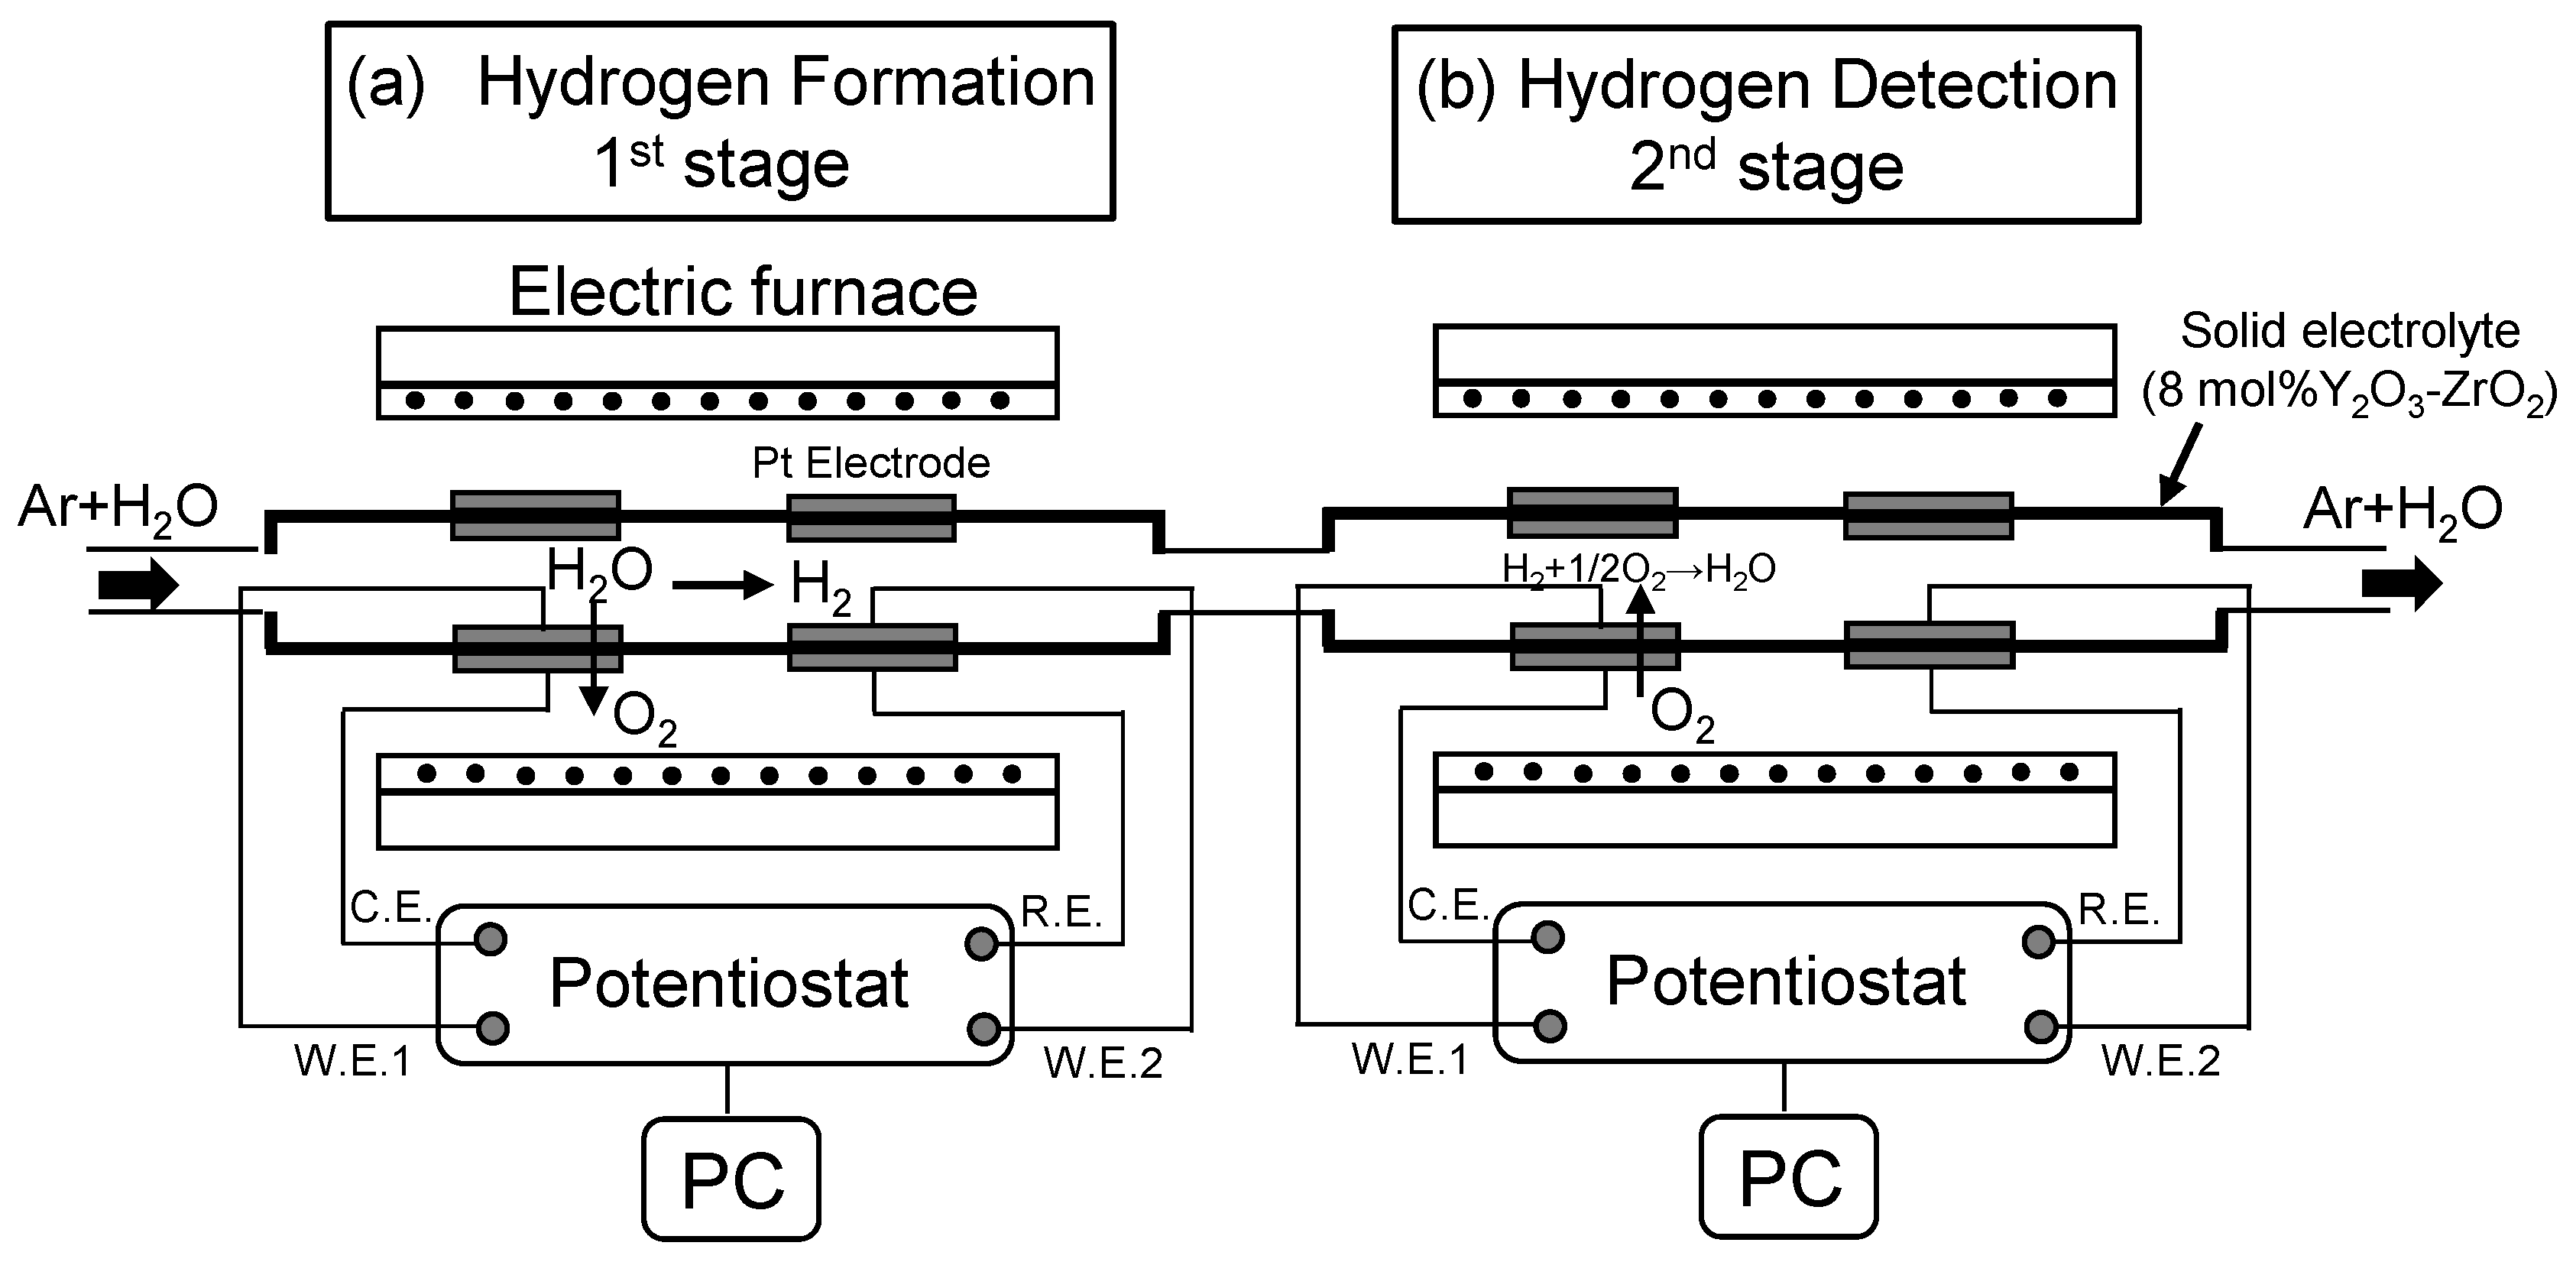
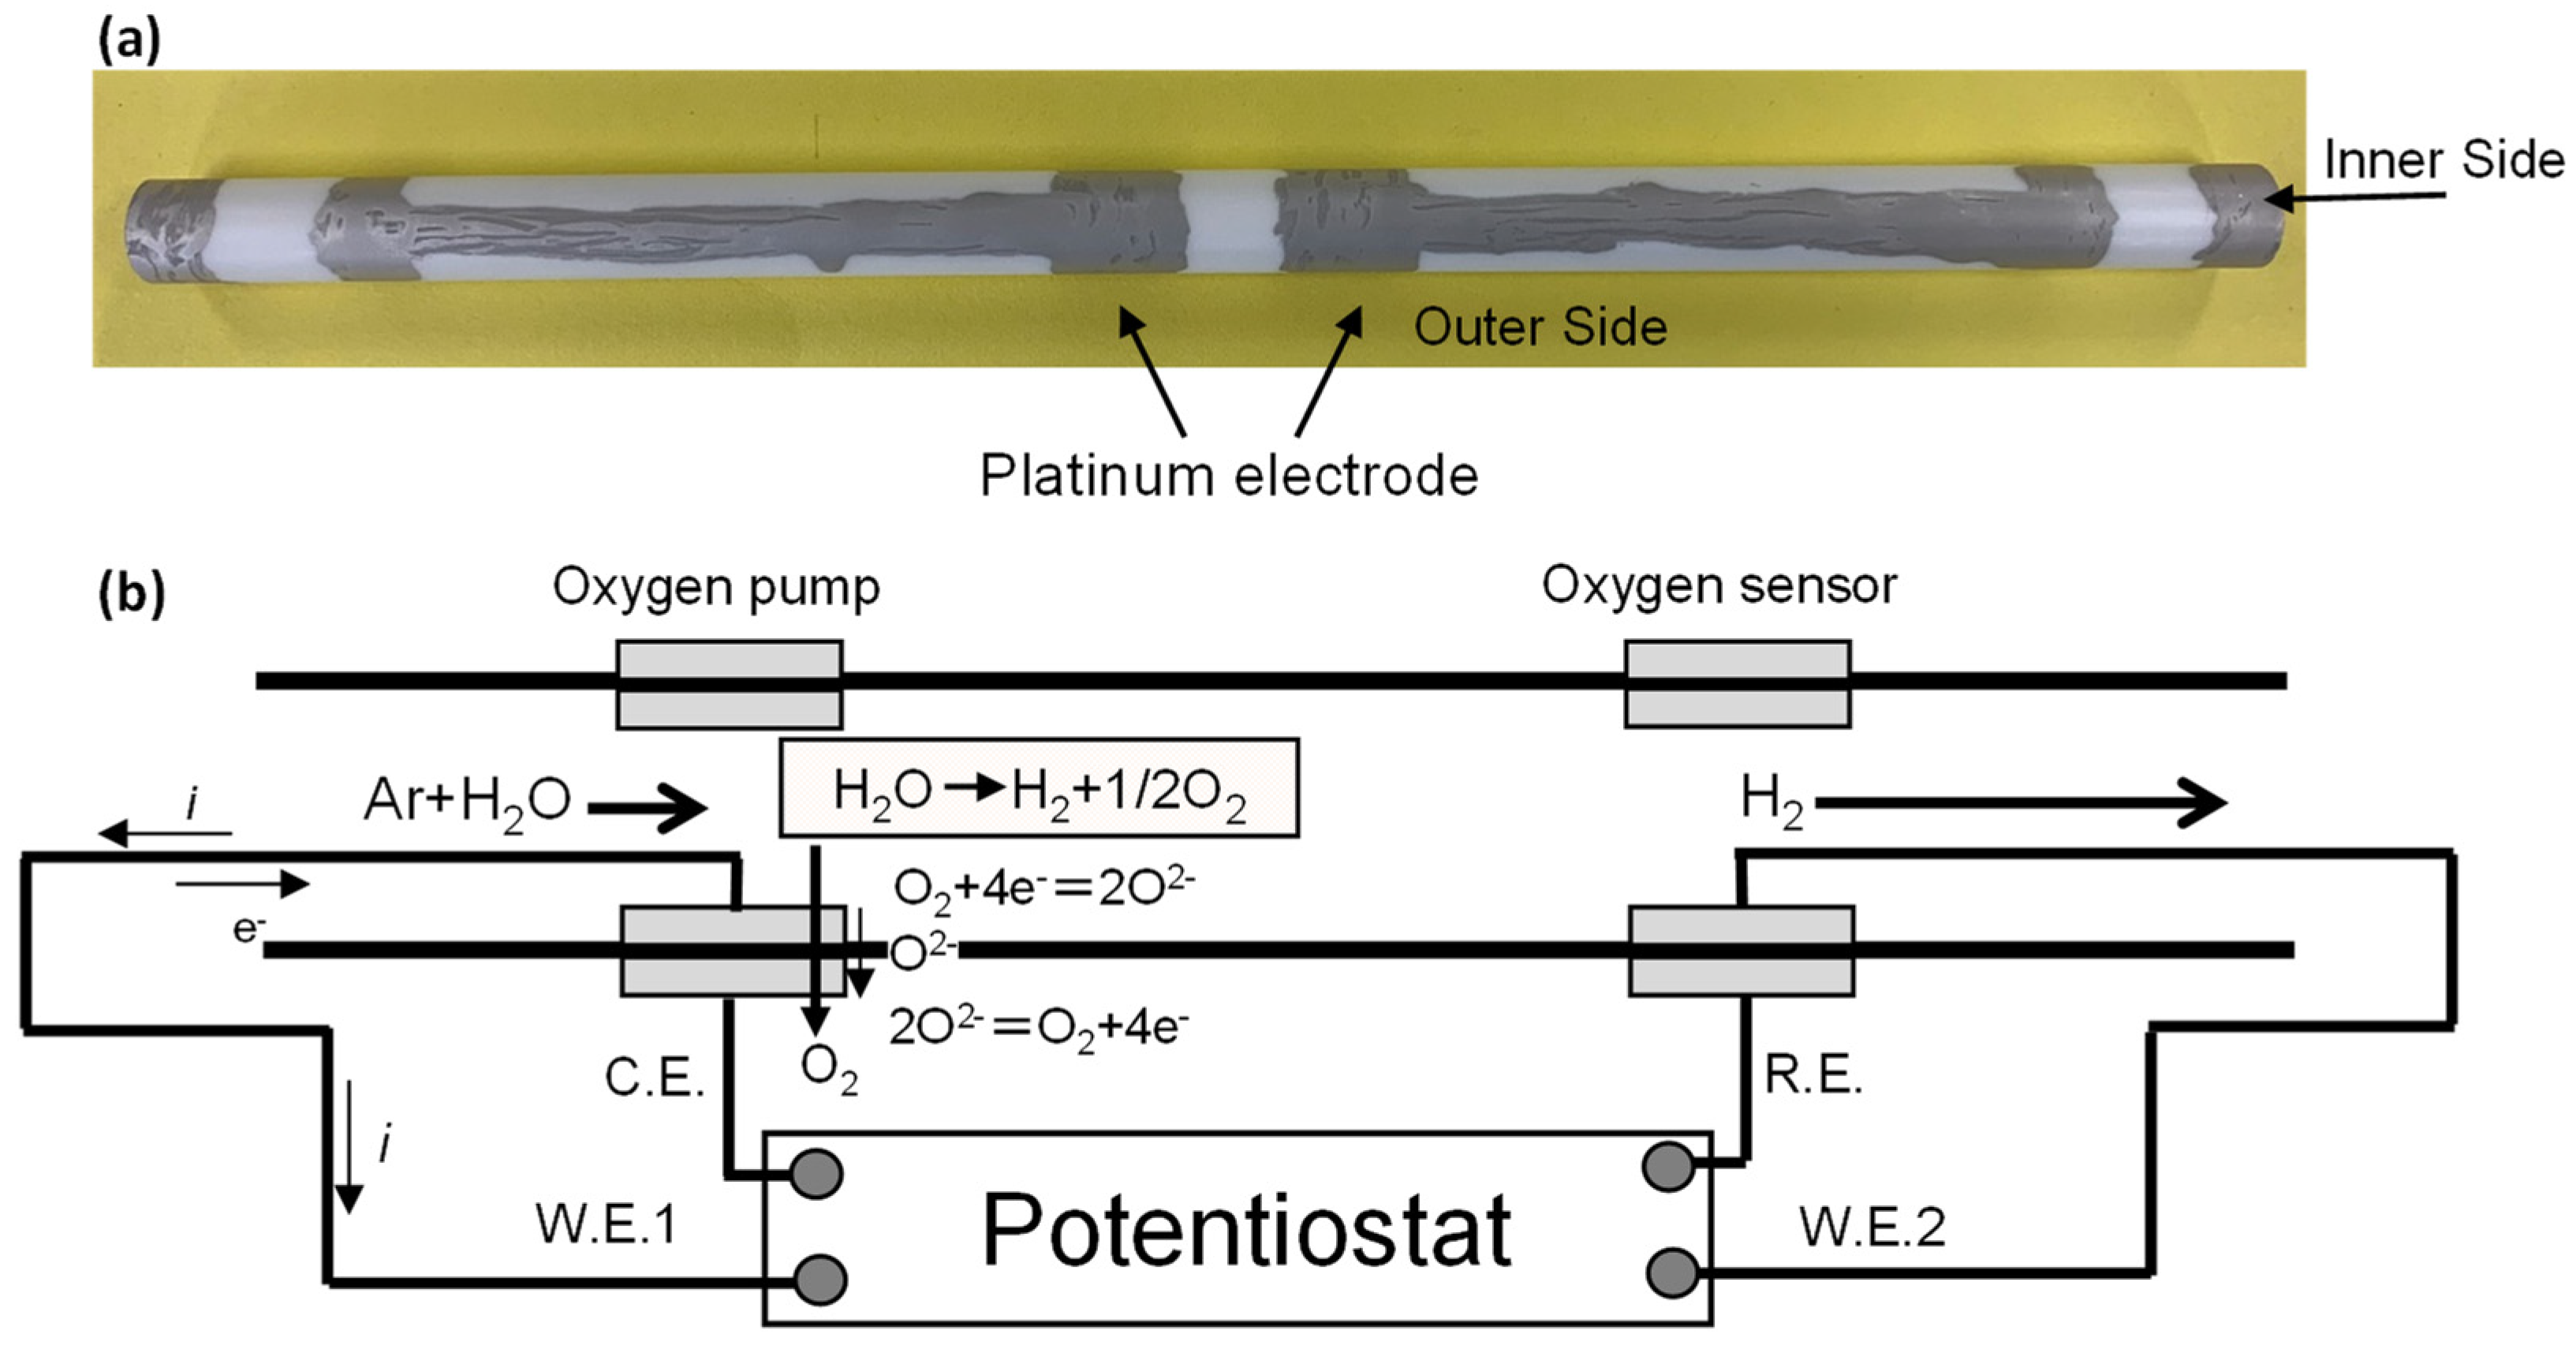
2. Experimental Procedure

Figure 1 shows a schematic diagram of the equipment used for hydrogen production and the measurement of hydrogen generation. Water vapor was added to Ar, and the gas was allowed to flow. The amounts of water vapor added in this experiment were 12.2 vol.% and 30.8 vol.%. The operating temperature of the oxygen pump sensor was 850 °C. Experiments were carried out at 850 °C, which is a high temperature for the diffusion of oxide ions. For the oxygen pump sensor in (a), hydrogen was generated from water vapor by controlling the potential using a potentiostat. For the oxygen pump sensor in (b), the potential was controlled by a potentiostat to measure the generated hydrogen in situ, and the amount of generated hydrogen was calculated from the amount of supplied oxygen.
Figure 2a shows a photograph of the oxygen pump sensor, and Figure 2b shows the principle diagram of the oxygen pump sensor. A tubular yttria-stabilized zirconia (8 mol % Y2O3-ZrO2) was used for the oxygen pump sensor. The Ar gas flowed at 30 cc/min into deionized water at 50 °C and 70 °C to create the amount of water vapor 12.2% and 30.8%, respectively. Ar-H2O gas was then allowed to flow inside this tube. The oxygen pump sensor consisted of a sensor and a pump, and Pt was used as the electrode. Because the oxygen pump sensor is an oxide ion conductor, oxygen inside the pump section can be discharged by reaction (1) inside and outside the tube by applying an electric current to the pump section.
Inside the tube: O2 + 4e → 2O2− Outside the tube: 2O2− → O2 + 4e
As a result, the reaction shown by Equation (2) occurs and oxygen is discharged to generate hydrogen from the water vapor.
2H2O→O2 + 2H2
The measurement of the oxygen partial pressure at the sensor part of the second stage was calculated using Nernst’s equation. The electromotive force measured by the oxygen sensor was substituted into the Nernst equation, as shown in Equation (3), and the oxygen partial pressure was obtained.
E = R T 4 F ln P O 2 meas . P O 2 ref .
where R is the gas constant (J K−1 mol−1), T is the temperature (K), F is the Faraday constant (A s mol−1), E is the measured electromotive force (E), and P O 2 ref. is the reference gas (atmosphere: 0.21 atm). For the second-stage oxygen pump sensor, the initial oxygen partial pressure state was maintained in the sensor section. The potential was controlled by the second stage potentiostat. When hydrogen was generated, the oxygen partial pressure in the tube decreased. Oxygen was supplied to the inside of the tube by the pump to maintain the initial state. As a result, the amount of hydrogen generated can be determined from the amount of supplied oxygen [37,38,39]. The calibration curve in [37] shows that the amount of hydrogen can be accurately measured by this method. If a large amount of hydrogen is generated, a large amount of oxygen is supplied. The amount of hydrogen generated can be found by measuring the current value of the oxygen supply. The supplied oxygen was then calculated using Faraday’s law, as shown in Equation (4).
J = I 4 F
where F is the Faraday constant (A s mol−1), I is the applied current (A), and J is the amount of oxygen supplied to the measurement system by the oxygen pump (mol s−1). Therefore, the amount of generated hydrogen can be measured in situ based on the current value.

3. Results and Discussion

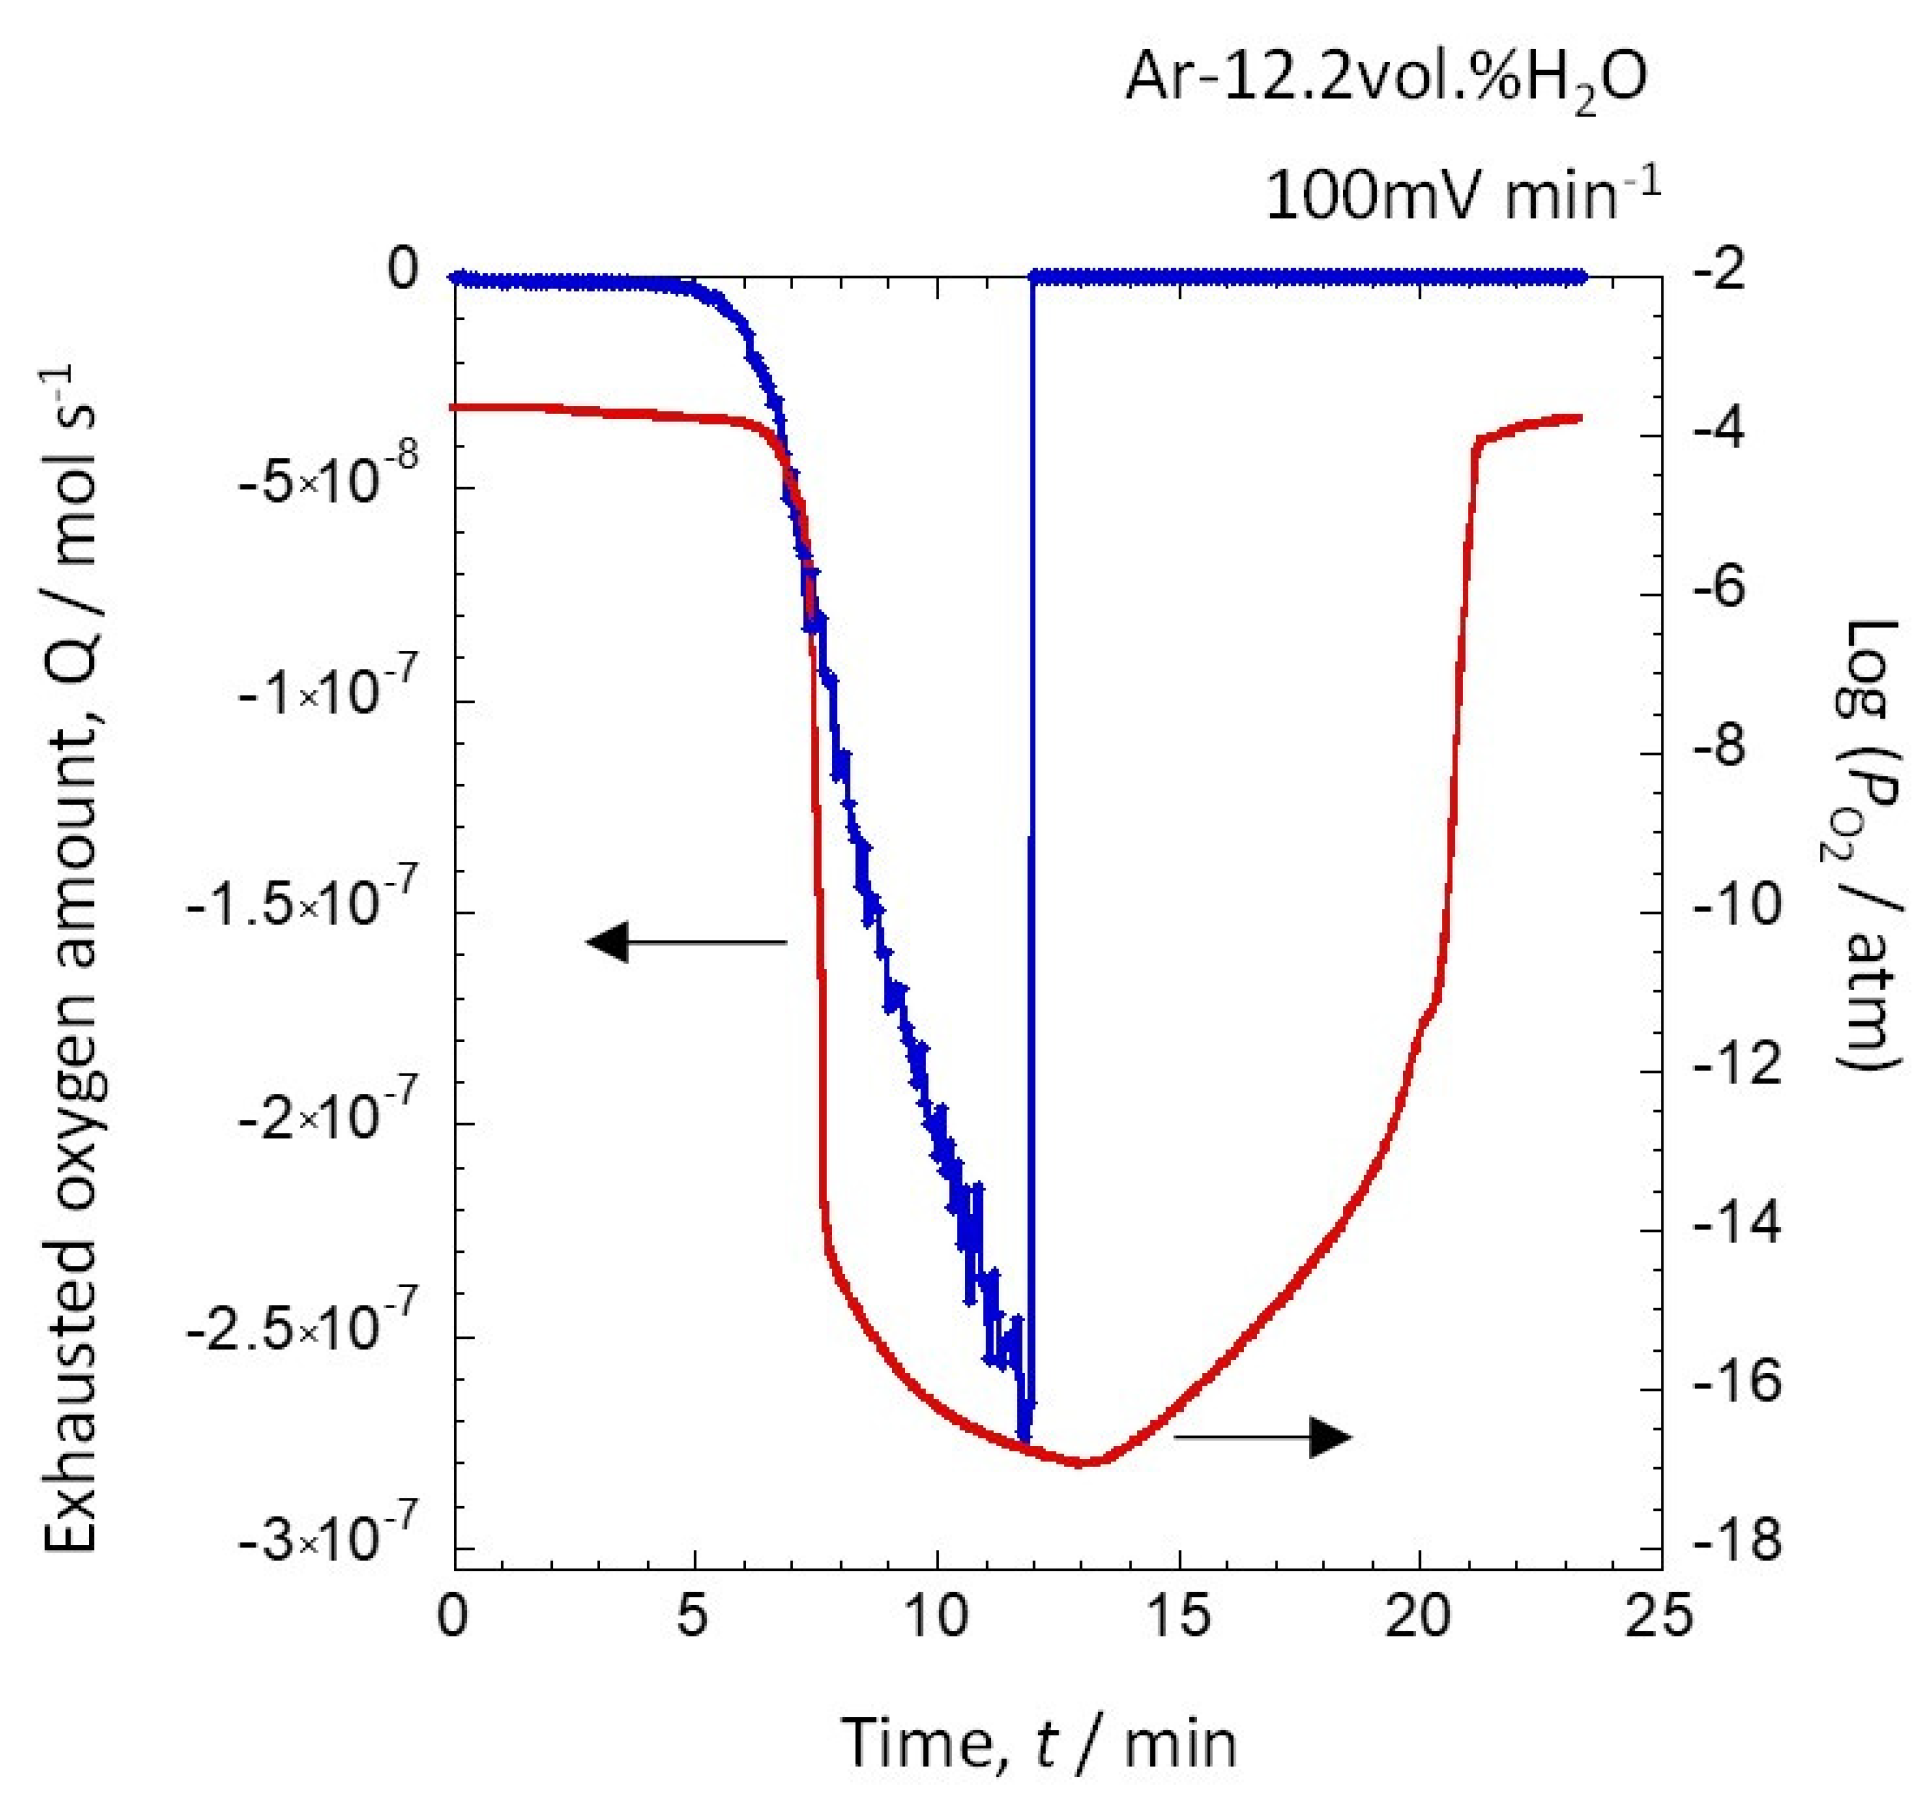
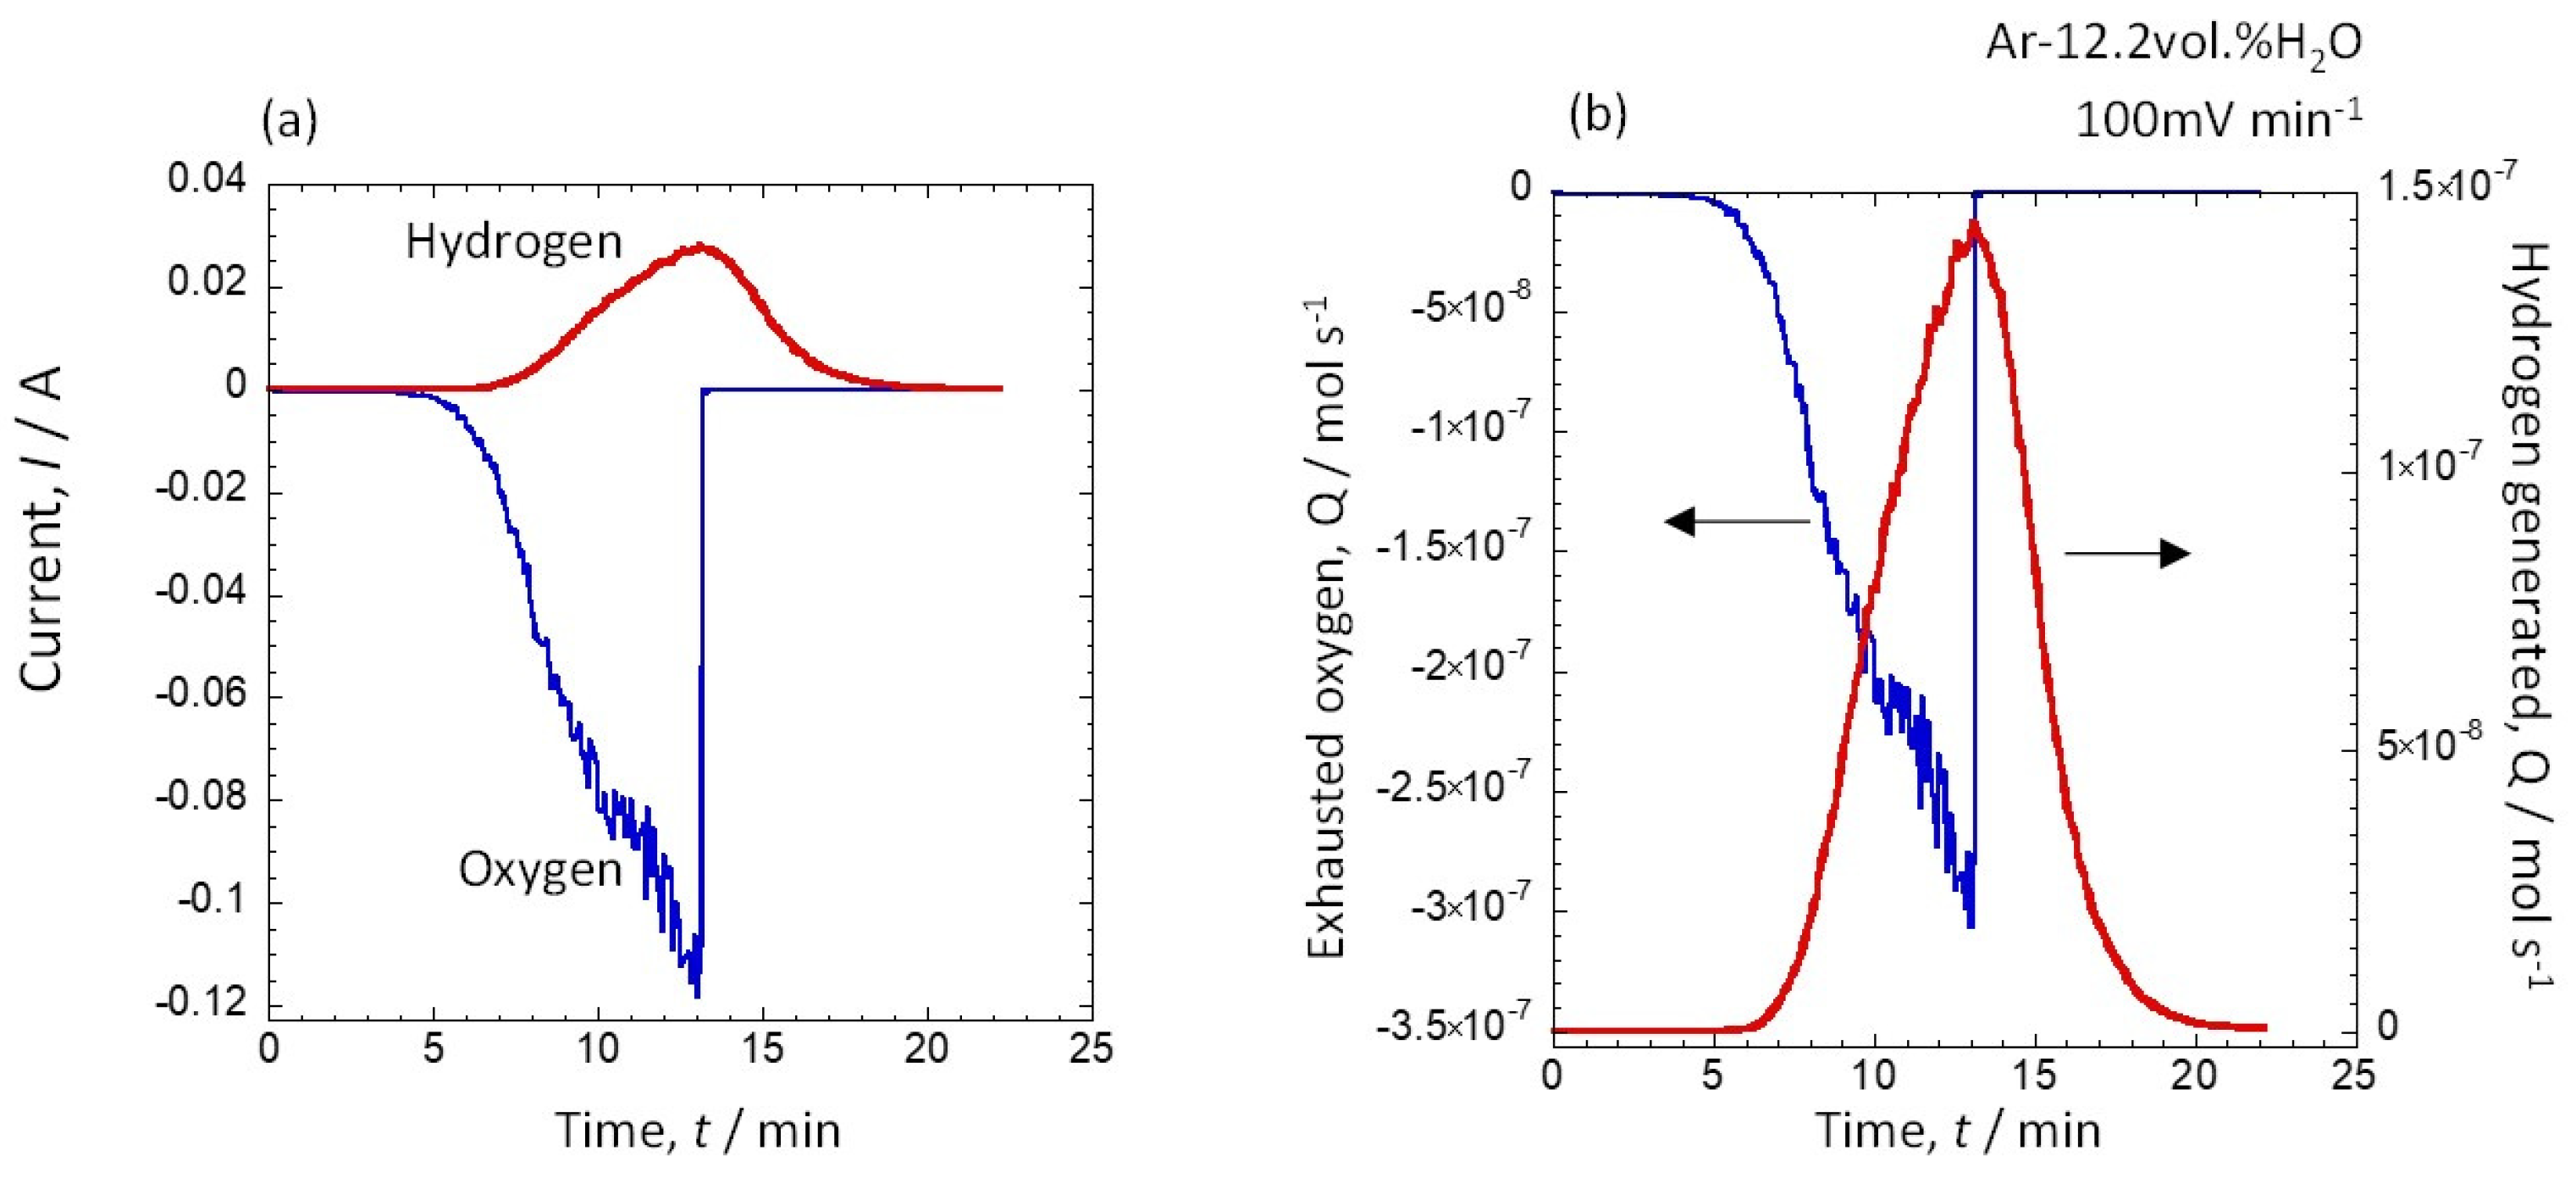
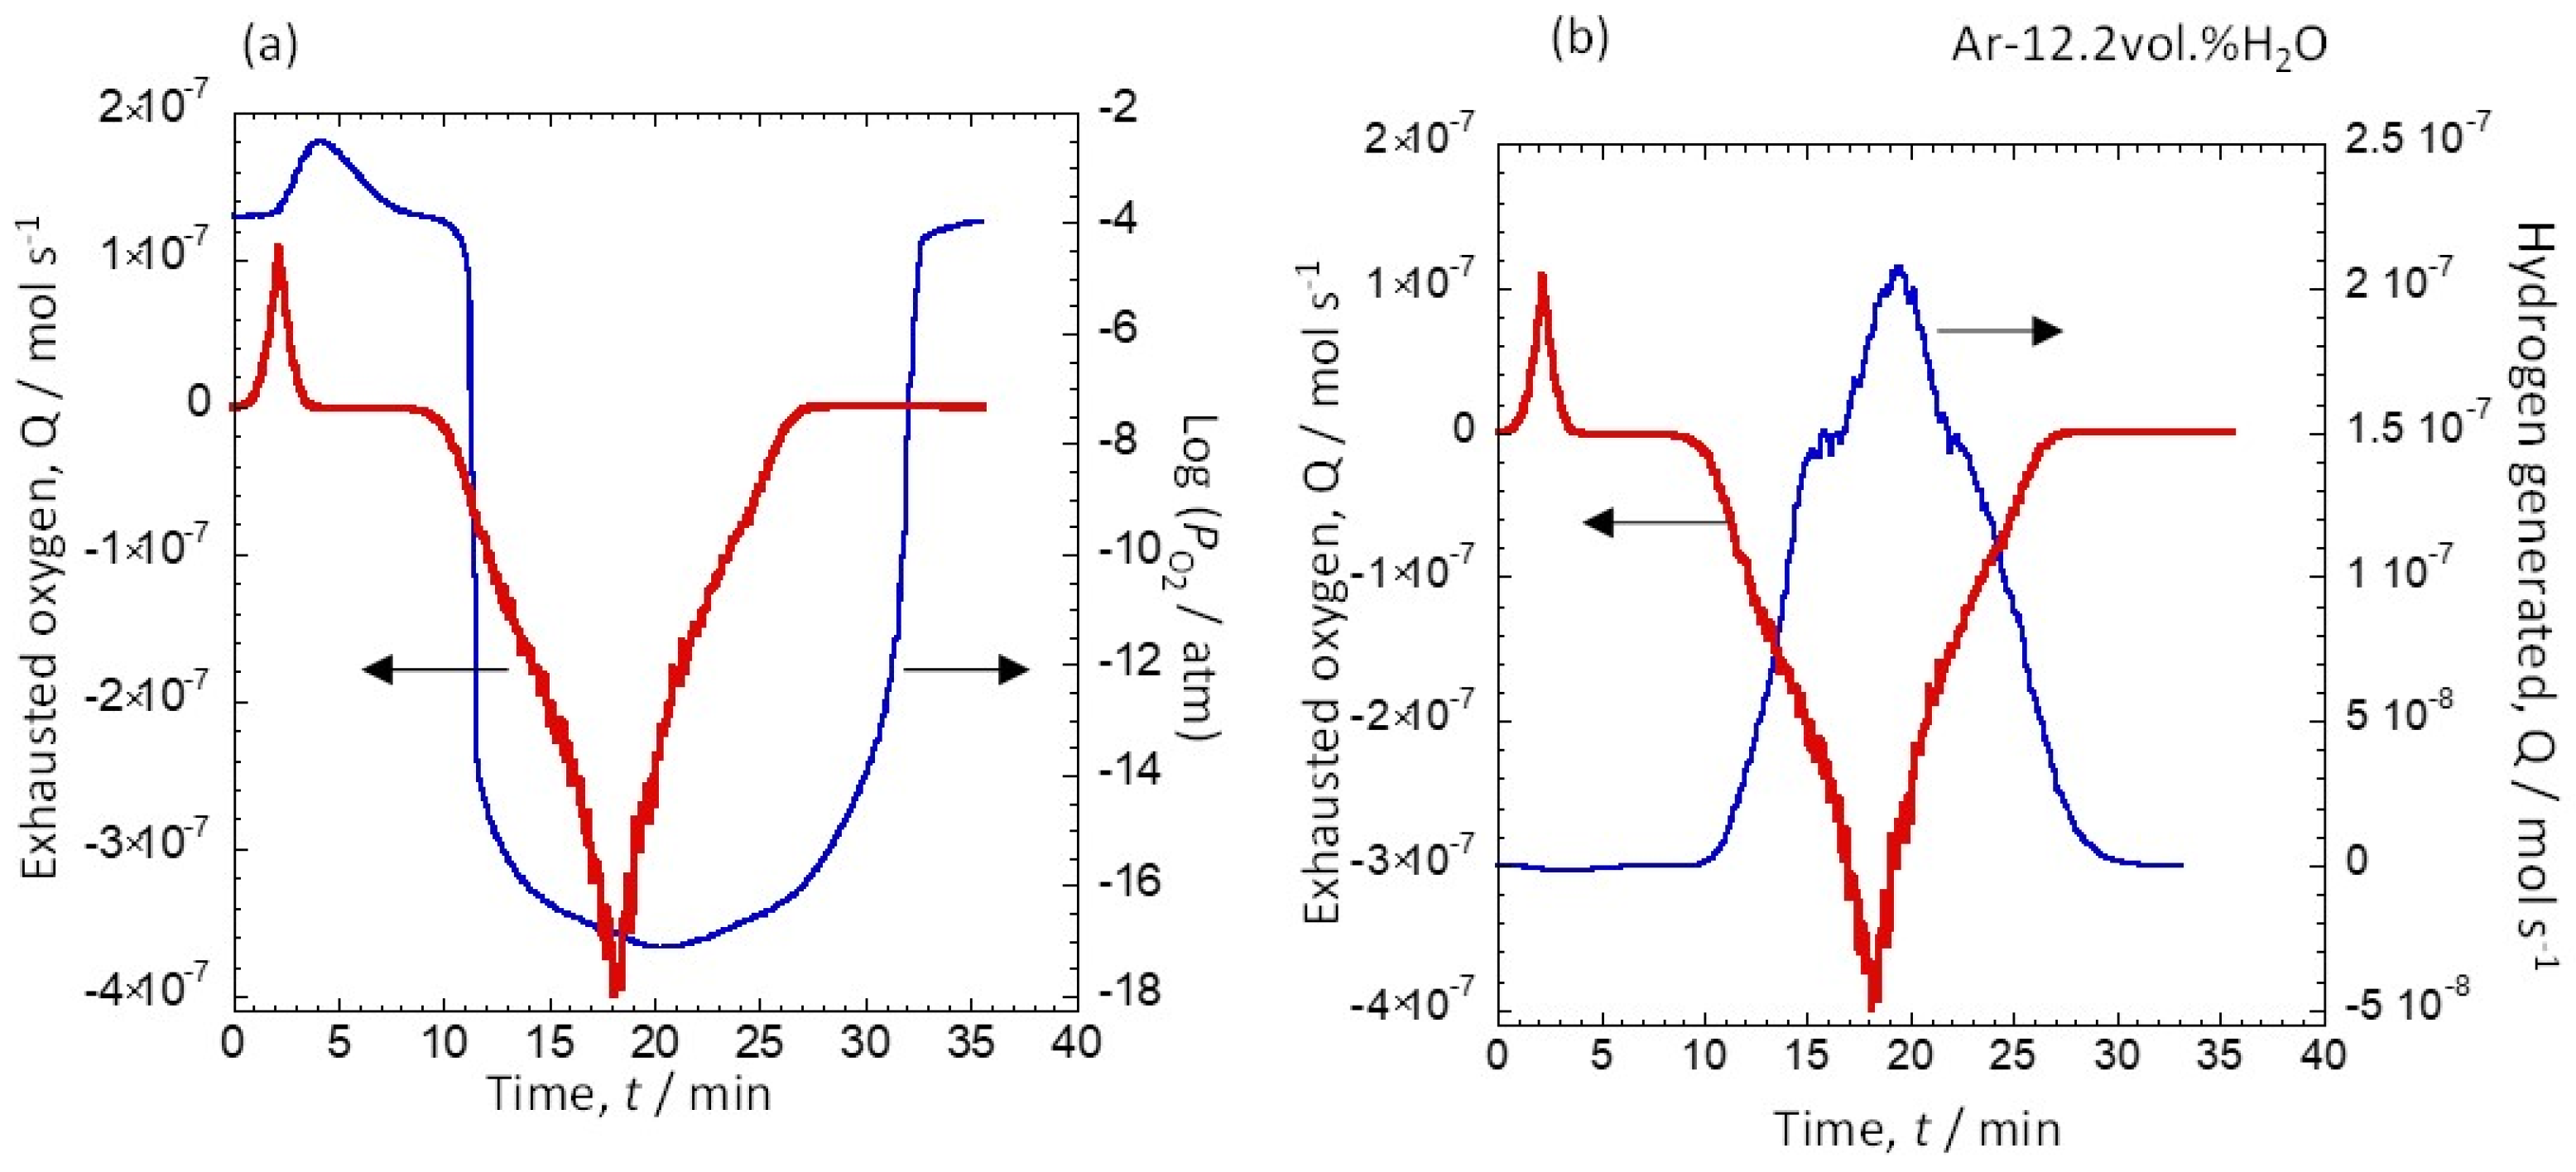
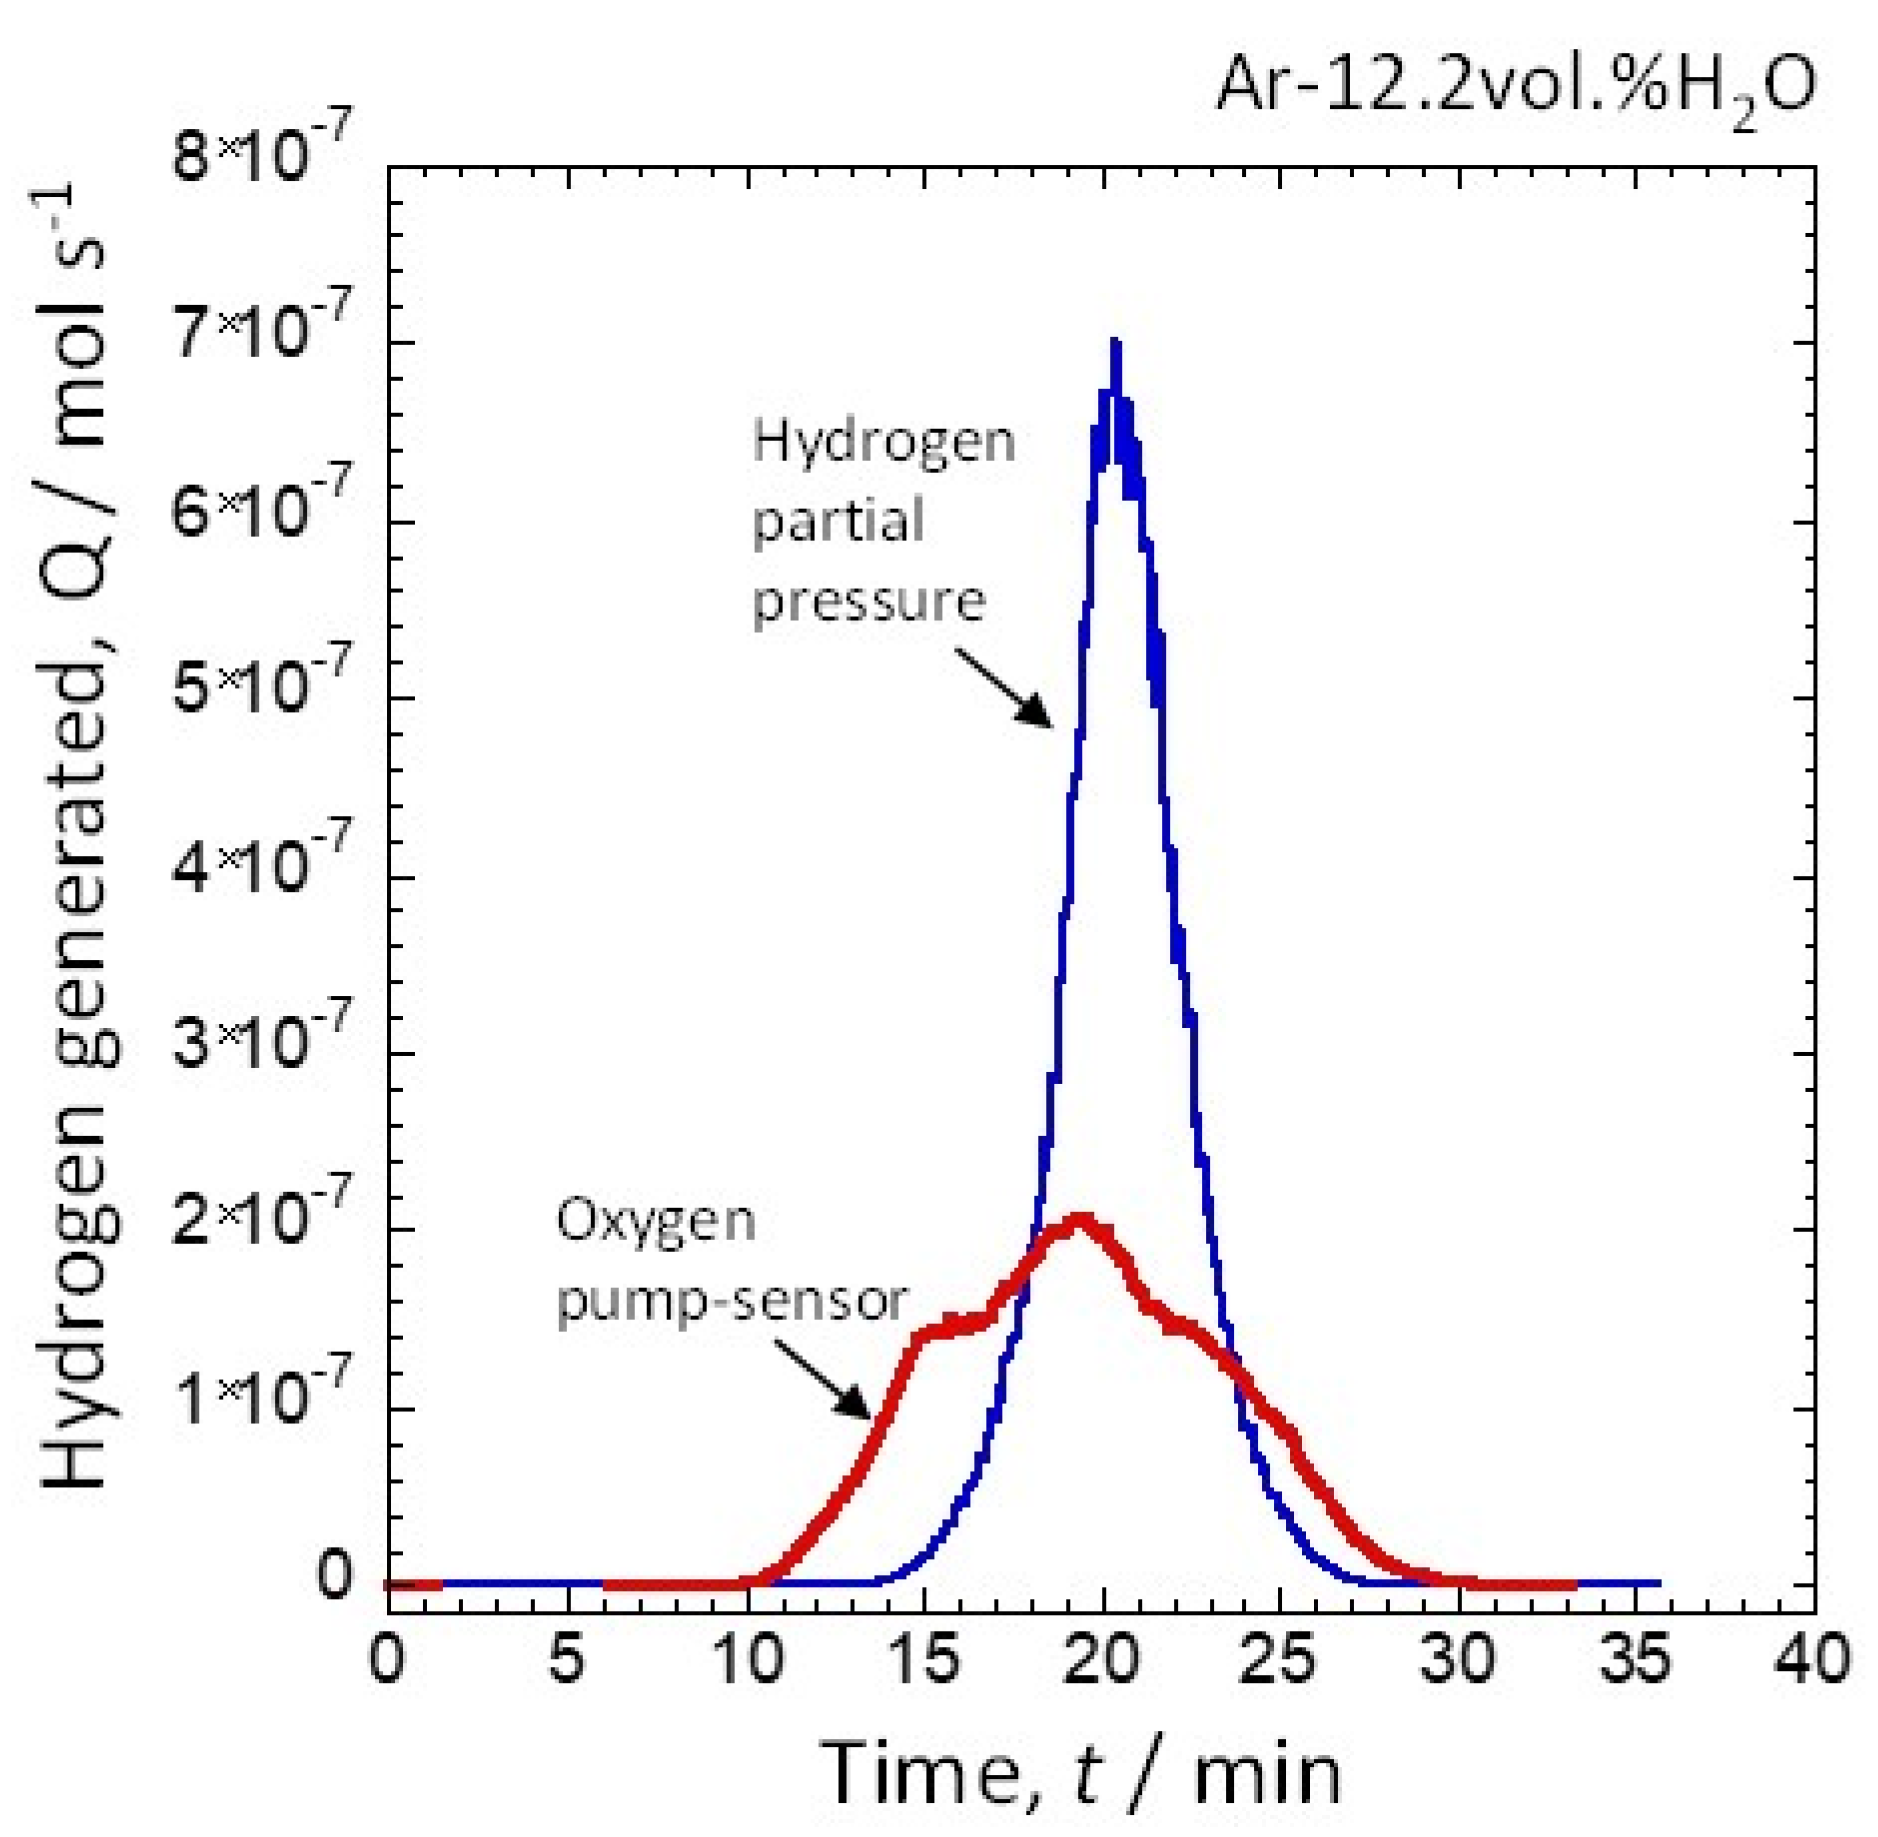
3.1. Relationship between Discharged Oxygen, Oxygen Partial Pressure, and the Amount of Generated Hydrogen due to a Potential Change

Figure 3 shows the change in oxygen discharge over time by applying a current to the pump part of the first-stage oxygen pump sensor. Furthermore, the change in the oxygen partial pressure measured by the sensor part of the oxygen pump sensor of the second stage is also shown. Oxygen was discharged by applying an electric current to the oxygen pump sensor of the first stage. These data show that oxygen could be linearly discharged by controlling the potential and applying an electric current, and that current did not flow even if the potential was swept for up to 7 min. In other words, oxygen was not discharged unless a certain potential was exceeded. In addition, oxygen emissions linearly increased. Based on this result, the relationship between the oxygen partial pressure of the atmosphere and the amount of discharged oxygen could be clarified.
When the amount of discharged oxygen was 5.0 × 10⁻⁸ mol s−1, the oxygen partial pressure sharply decreased. Therefore, this amount of oxygen emission was concluded to allow for hydrogen generation. Furthermore, when the amount of oxygen discharged exceeded 2.5 × 10⁻⁷ mol s−1, the decrease in the oxygen partial pressure slowed, which suggested that the amount of hydrogen generated also gradually decreased. When the current was stopped and the oxygen discharge was stopped, the oxygen partial pressure gradually increased, which shows that the generation of hydrogen was suppressed. Finally, the oxygen partial pressure returned to the initial levels.
Equation (5) shows the reaction between the water vapor, hydrogen and oxygen.
H2O→H2 + 1/2O2
The equilibrium constant of this reaction equation is given by Equation (6).
K=PH2 × PO21/2 × PH2O−1
where K is the equilibrium constant. The results in Figure 3 clearly show that PO2 is reduced due to oxygen discharge. Therefore, since PH2O is constant, PH2 is generated.
Figure 4a shows the applied current value of the pump section of the first-stage and second-stage oxygen pump sensors as a function of time. In addition, Figure 4b shows the amount of discharged oxygen and the amount of generated hydrogen calculated from the current value as a function of time. Figure 4a shows that a negative current was generated in the oxygen pump of the first stage because oxygen was discharged. Equation (2) shows the reaction that occurs both inside and outside the tube.
Conversely, a positive current was applied to supply oxygen in the second-stage oxygen pump. Equation (7) shows the reaction that occurs inside and outside the tube.
Inside: 2O2− → O2 + 4e Outside: O2 + 4e → 2O2−
When the amount of water vapor was 12.2 vol.%, the current for discharging oxygen was −0.11 A, and the oxygen supply current was 0.03 A. A positive current did not flow with a small discharge current, and a positive current was generated near −0.04 A. This result suggests that hydrogen was generated near −0.04 A. Subsequently, Figure 4b clearly shows that hydrogen emissions of 1.5 × 10⁻⁷ mol s−1 were generated when the oxygen emission amount was 3 × 10⁻⁷ mol s−1. In addition, as shown in Figure 3, hydrogen was not generated unless oxygen was discharged. The generated hydrogen was linearly generated in conjunction with the oxygen discharge. When the oxygen discharge was stopped, the amount of hydrogen generated was sharply suppressed, which showed that the amount of oxygen discharged directly correlated with the amount of hydrogen generated.
Figure 5a shows the oxygen partial pressure measured by the second stage oxygen pump sensor when oxygen was supplied and discharged by the first stage oxygen pump sensor. In addition, Figure 5b shows the amount of generated hydrogen measured by the oxygen pump sensor of the second stage as a function of time. Figure 5a shows that the oxygen partial pressure increased when oxygen was supplied until it reached 10−2 atm. When oxygen was subsequently discharged, the oxygen partial pressure sharply dropped. Specifically, the amount of oxygen discharged was 1.0 × 10⁻⁷ mol s−1, resulting in a sharp decrease in the oxygen partial pressure until it reached 10−17 atm. When the oxygen discharge was gradually reduced, the oxygen partial pressure also increased until it ultimately returned to the initial oxygen partial pressure. Conversely, the amount of hydrogen generated did not change, as shown in Figure 5b, even when oxygen was supplied by applying the anode current, which demonstrates that hydrogen was not generated even if oxygen was supplied. Notably, hydrogen was gradually generated when the amount of discharged oxygen increased.
Using Equation (6), the hydrogen partial pressure can be calculated from the oxygen partial pressure given in Figure 5a. The gas was assumed to be ideal, and Equation (8) consequently holds [42,43].
PV = nRT
where P is the hydrogen partial pressure (atm), V is the flow velocity (40 mL min−1), R is the gas constant (0.082 atm L K−1 mol−1), and T is the flow velocity measurement temperature (298 K). The number of moles, n, of the generated gas was then calculated, and the results are shown in Figure 6. The amount of hydrogen calculated using the partial pressure of hydrogen and the amount of hydrogen measured using the oxygen pump sensor were almost identical, and any difference was considered to be due to the gas flow velocity. The amount of hydrogen generated from the oxygen pump sensor can be accurately measured because it is not affected by the flow velocity. Moreover, even a small amount of hydrogen can be detected with an oxygen pump sensor. Therefore, high-sensitivity measurements are possible.

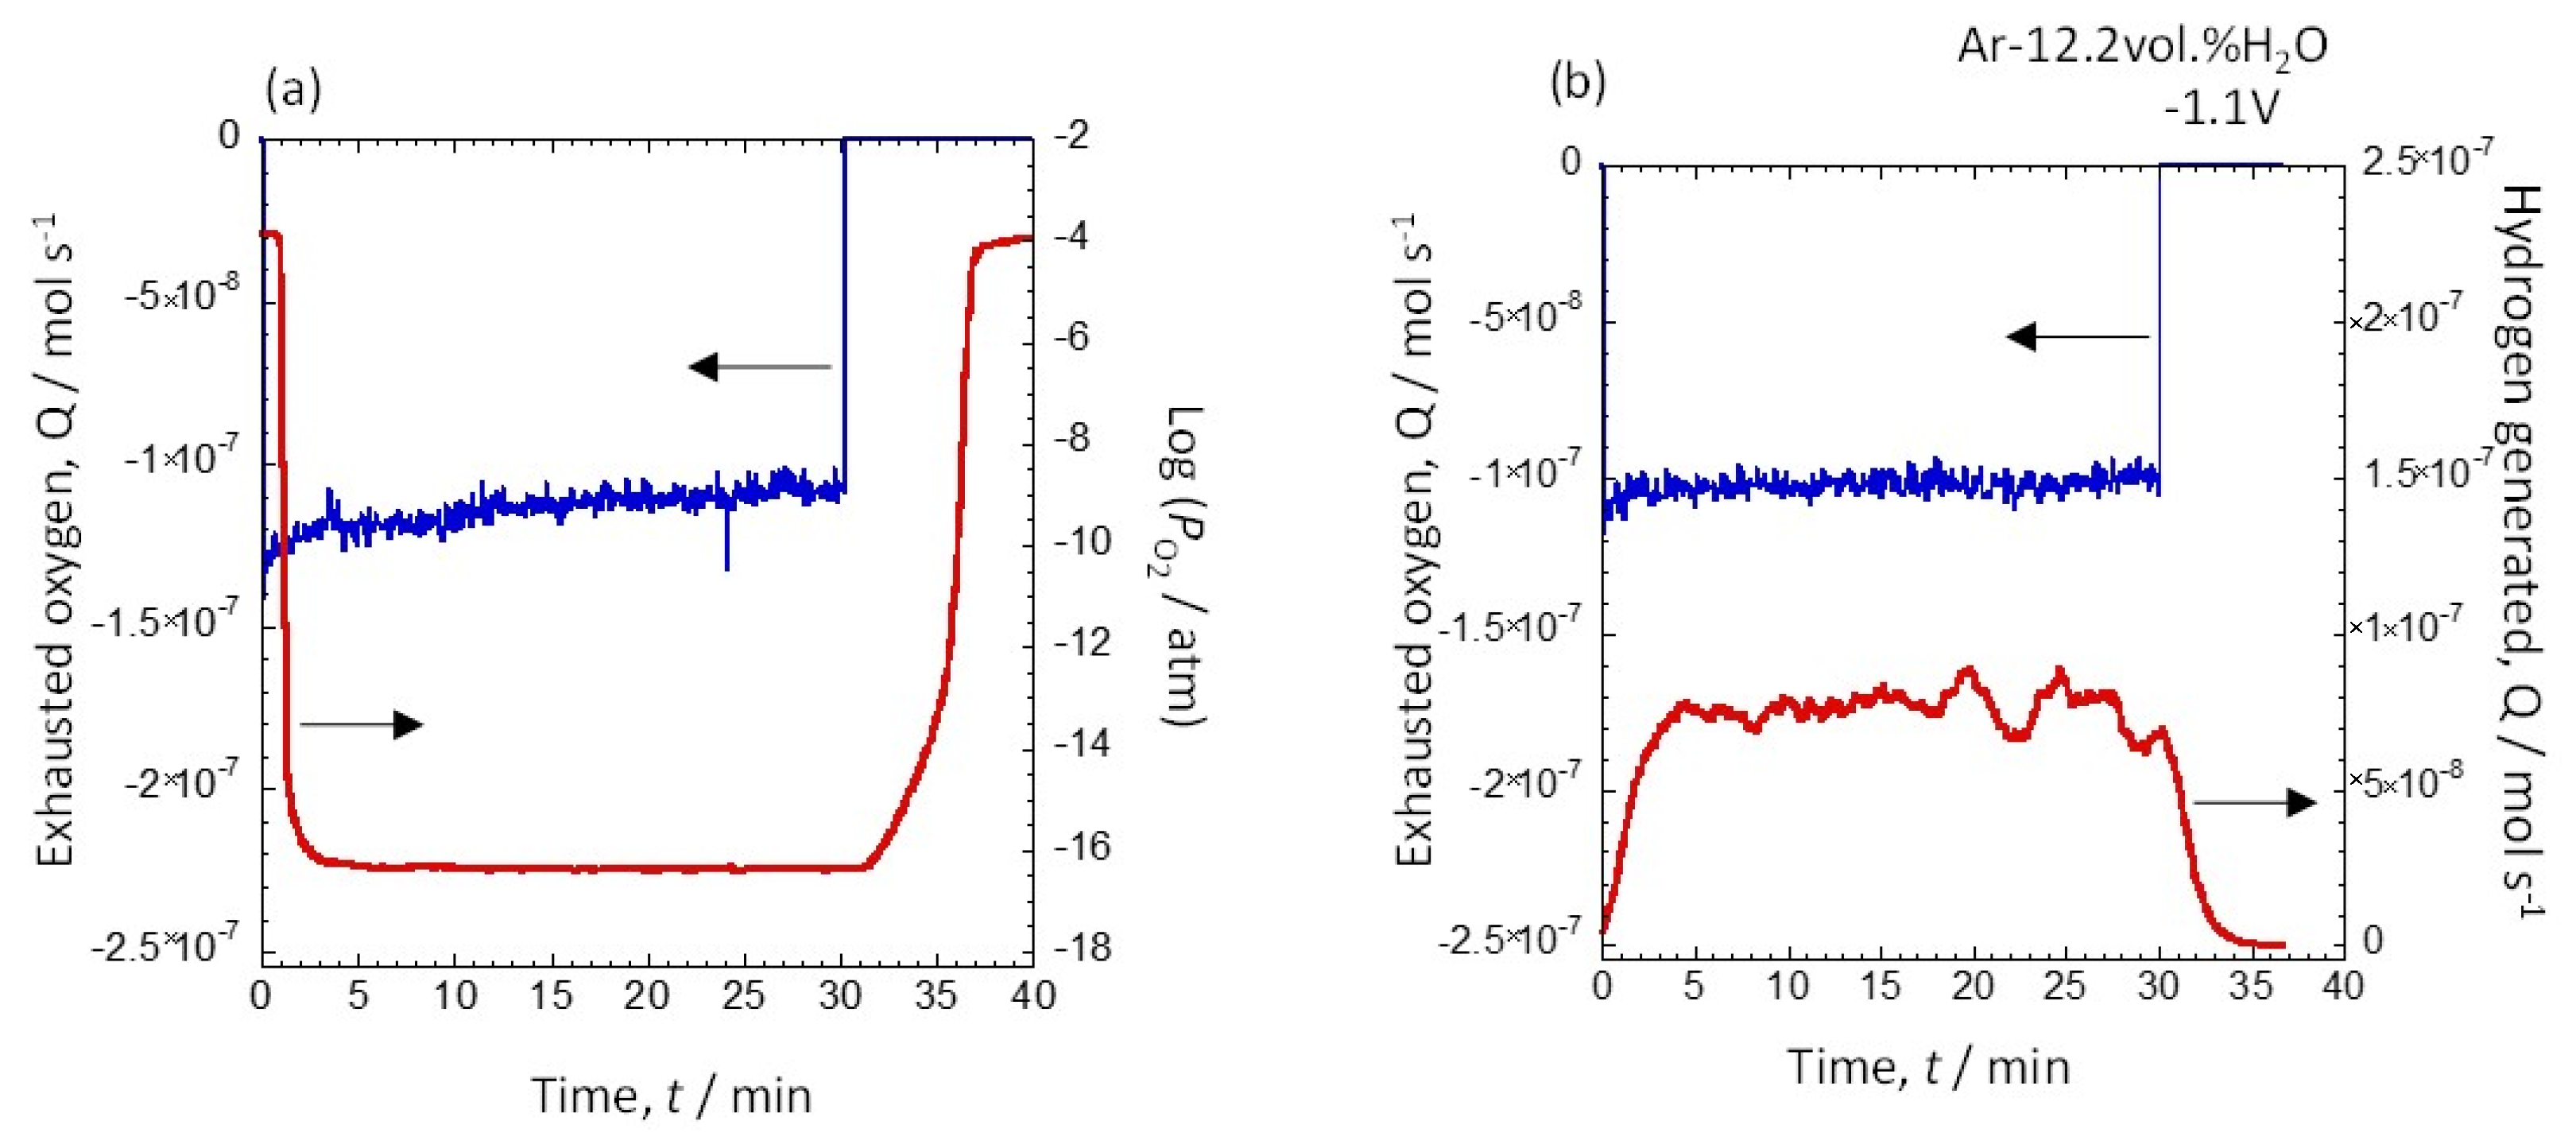
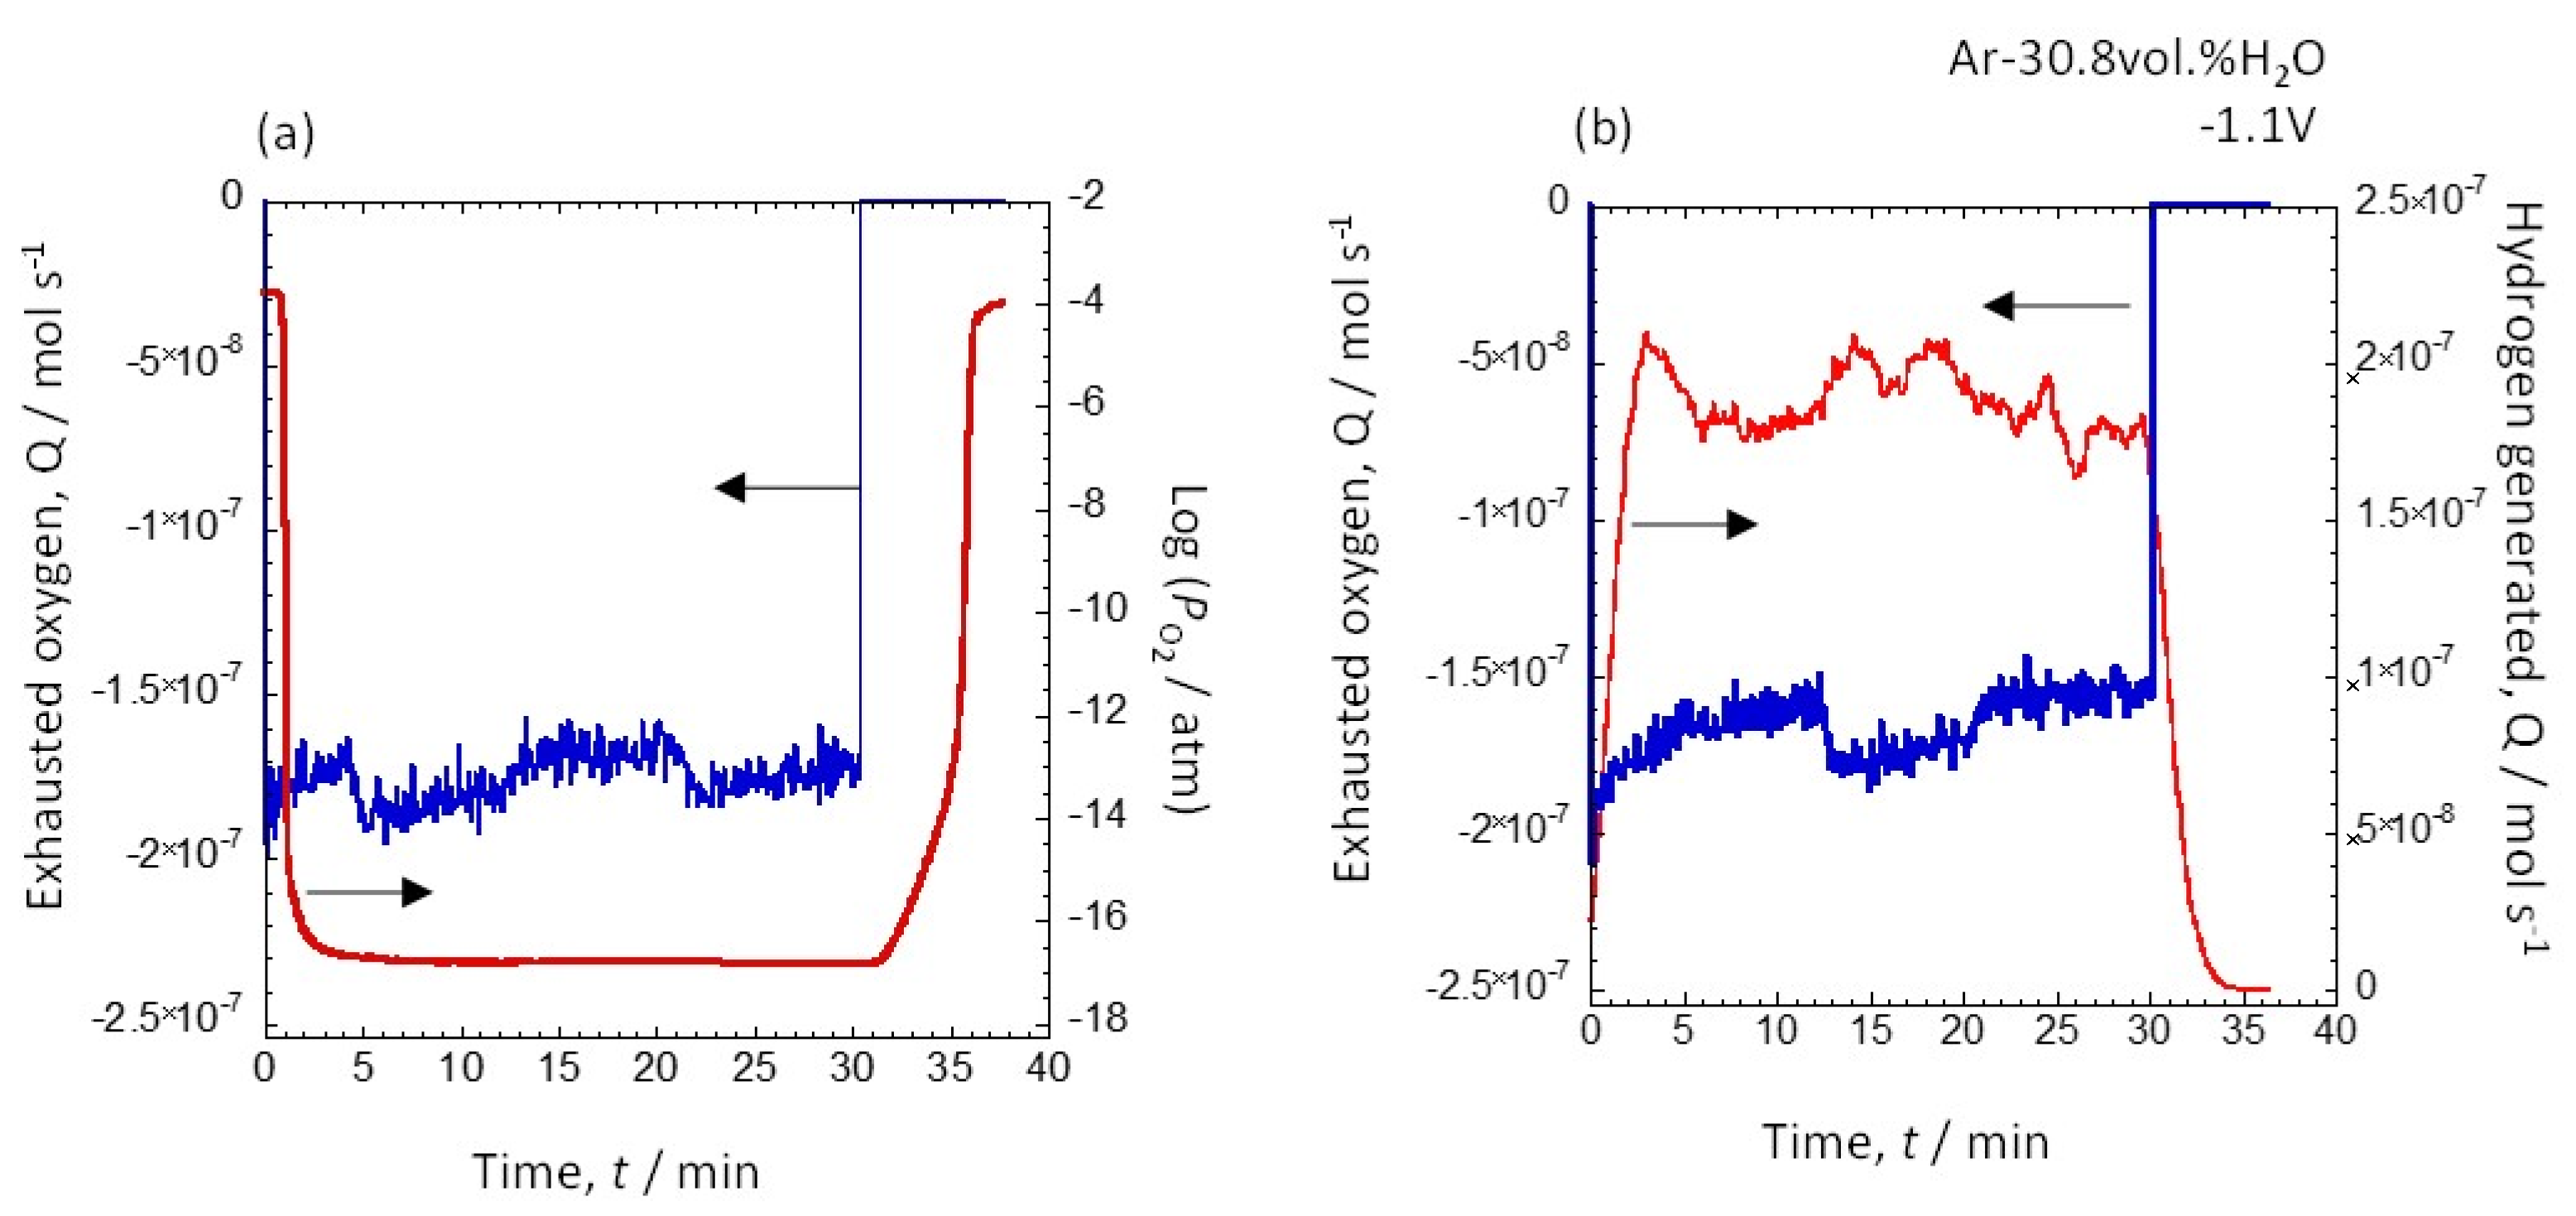
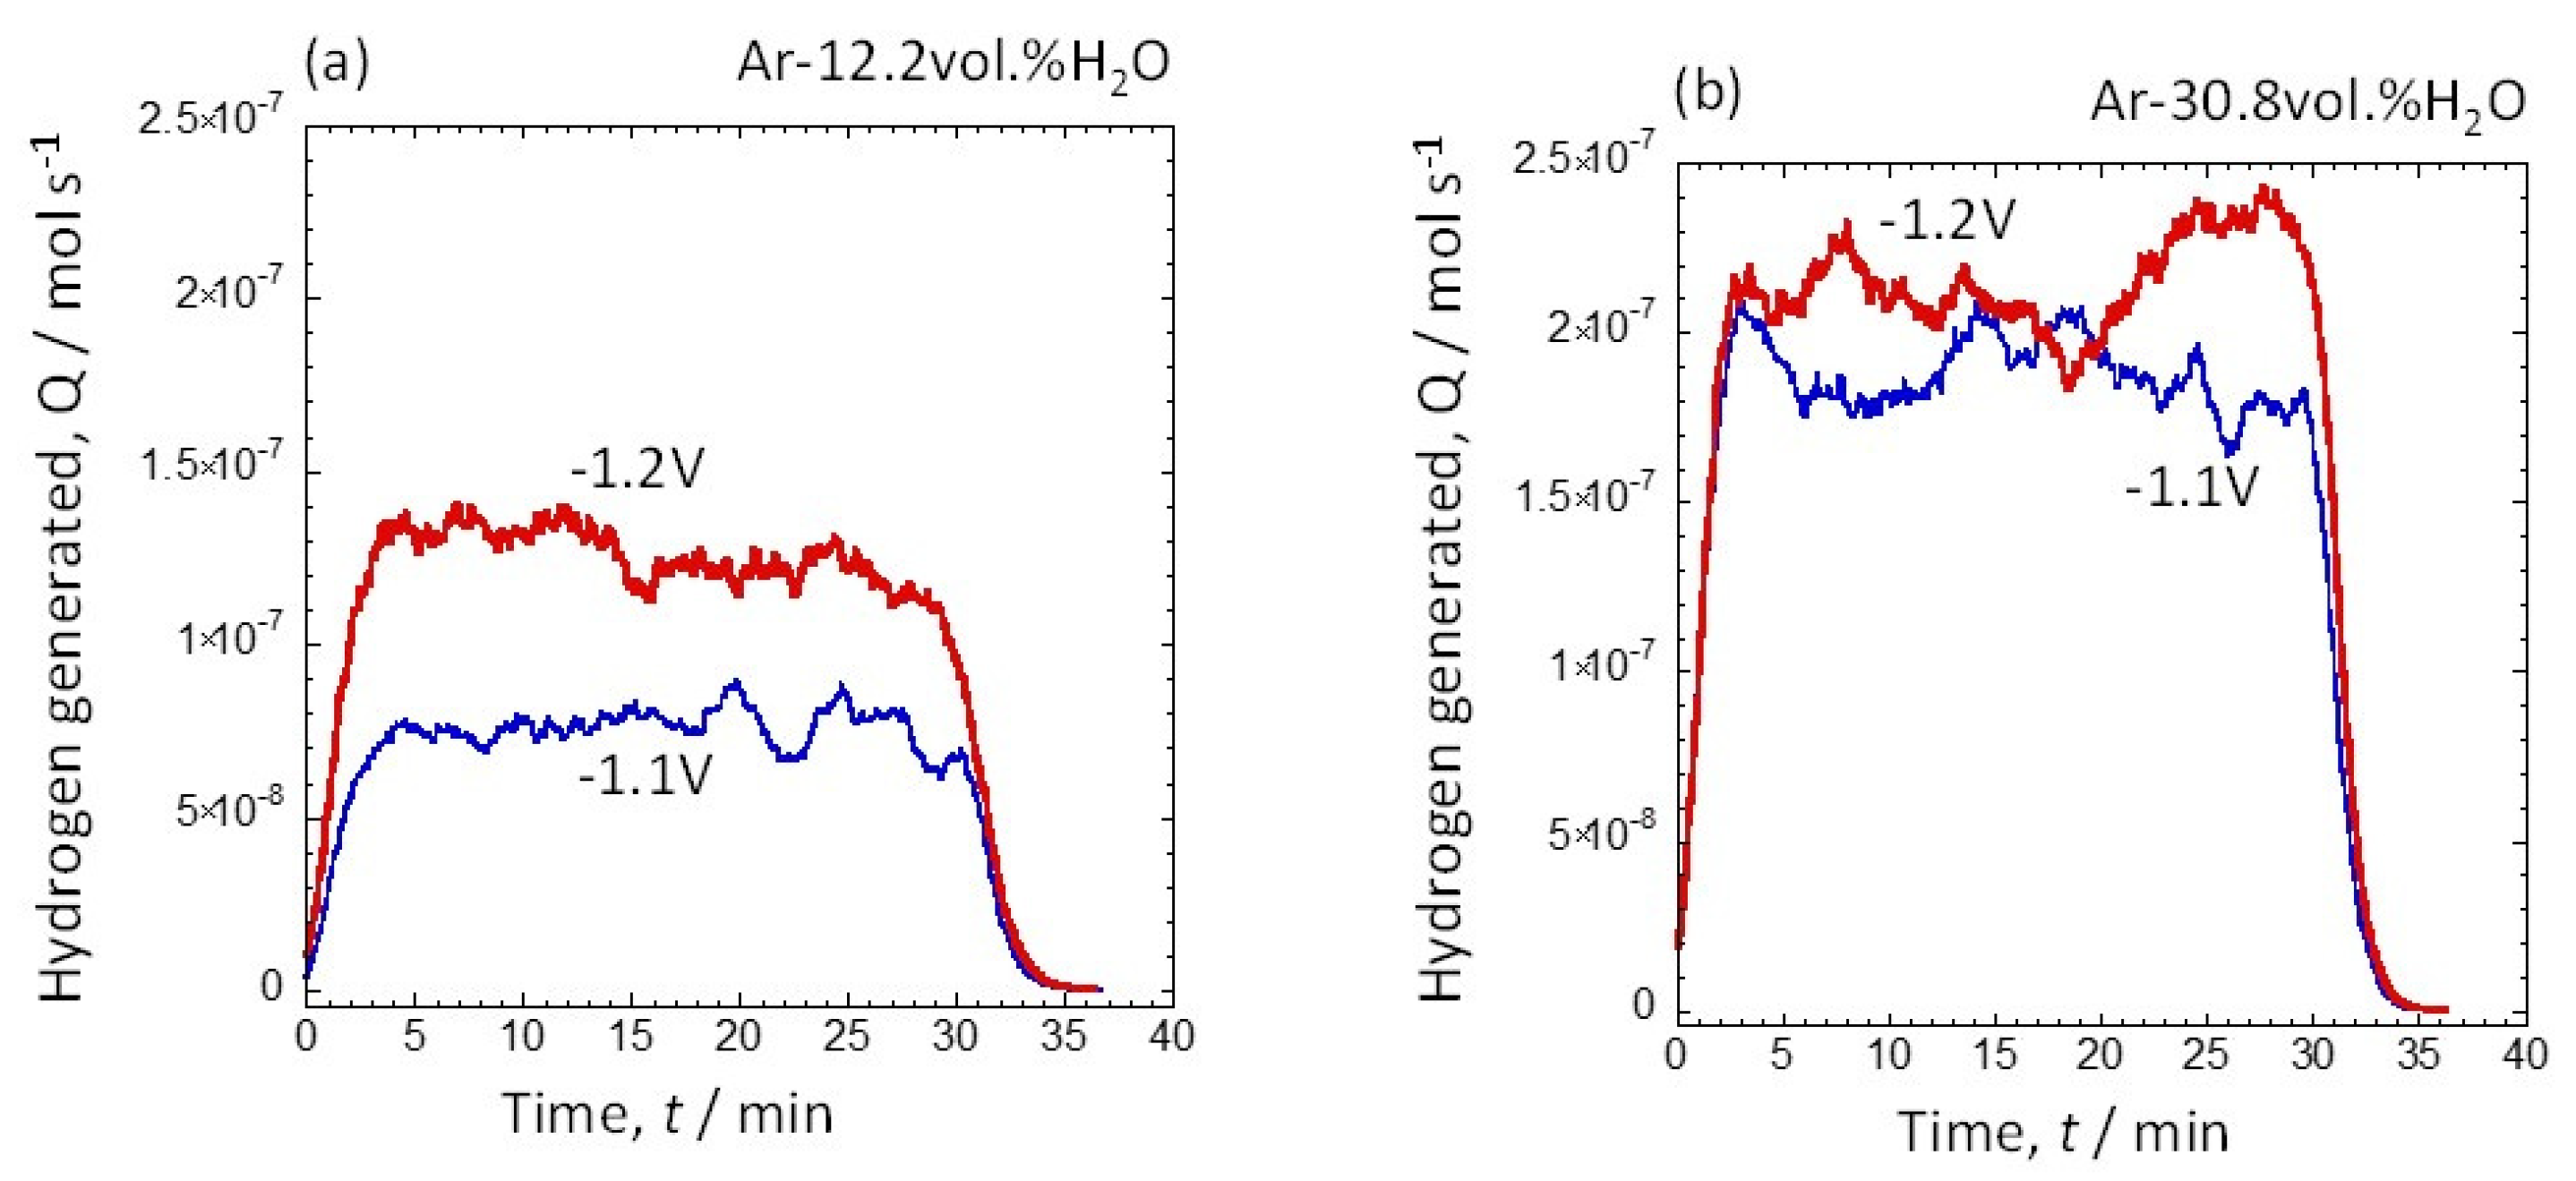
3.2. Amount of Hydrogen Generated at Water Vapor Amounts of 12.2 vol.% and 30.8 vol.%

Figure 7a shows the relationship between the oxygen emission and oxygen partial pressure when the first stage oxygen pump sensor was set to −1.1 V with a water vapor content of 12.2 vol.%. In addition, Figure 7b shows the relationship between the amount of discharged oxygen and the amount of generated hydrogen at this condition. Based on the relationship between the exhausted oxygen and the oxygen partial pressure shown in Figure 7a, the oxygen partial pressure was 10−16 atm when the exhausted oxygen amount was −1.3 × 10⁻⁷ mol s−1. Hydrogen was generated, and the oxygen partial pressure decreased because oxygen was discharged. The oxygen partial pressure reached 10−16 atm and remained constant due to the discharge of oxygen. In addition, when the current of the pump section of the first stage was set to zero and oxygen discharge was stopped, the oxygen partial pressure gradually increased. Five minutes after the current was turned off, the initial oxygen partial pressure was restored. Moreover, Figure 7b shows that approximately 0.85 × 10⁻⁷ mol s−1 hydrogen was generated when the amount of discharged oxygen was 1.0 × 10⁻⁷ mol s−1, which indicates that hydrogen was produced when oxygen was discharged. Furthermore, the generation of hydrogen gradually decreased when the current was stopped.
Figure 8a shows the relationship between the amount of discharged oxygen and the partial pressure of oxygen when the amount of water vapor was 30.8 vol.% and the potential was set to −1 V. Figure 8b shows the relationship between the amount of discharged oxygen and the amount of generated hydrogen. Specifically, the oxygen partial pressure decreased when oxygen was discharged by the oxygen pump sensor of the first stage. Notably, a large amount of hydrogen corresponding to the discharged oxygen was generated; this amount was nearly constant at 2 × 10⁻⁷ mol s−1. A comparison of Figure 8a and Figure 7a showed that the amount of oxygen discharged increased as the amount of added water vapor increased.

3.3. Potential Dependence of the Amount of Hydrogen Generated at 12.2 vol.% and 30.8 vol.% Water Vapor

Figure 9 shows the relationship between the amount of generated hydrogen and the potential. Specifically, Figure 9a shows the amount of hydrogen generated at a water vapor content of 12.2 vol.%, and Figure 9b shows the amount of hydrogen generated at a water vapor content of 30.8 vol.%. As shown in Figure 9a, more hydrogen was generated at −1.2 V, and the amount of hydrogen generated remained constant over time. When the potential was below −1.1 V and more oxygen was discharged, twice as much hydrogen was generated. Conversely, the amount of hydrogen generated did not depend on the voltage when the water vapor content exceeded 12.2 vol.%., as shown in Figure 9b. Therefore, the amount of generated hydrogen was also high when the amount of water vapor supplied was high.
Table 1 shows the amount of discharged oxygen, the amount of produced hydrogen, and the hydrogen generation efficiency at each condition. The amount of hydrogen generated at 12.2 vol.% water vapor was 1.38 × 10⁻⁴ mol at −1.1 V. Furthermore, it was 2.25 × 10⁻⁴ mol at −1.2 V. Hydrogen was generated by lowering the potential and discharging a large amount of oxygen, but the efficiency of water vapor generation was approximately 40% because the amount of water vapor was low. However, when the amount of water vapor was increased to 30.8 vol.%, a large amount of hydrogen was generated. At −1.2 V, the hydrogen production efficiency was approximately 66%. It showed a higher current efficiency than the lower current values in [29]. In the future, increasing the amount of added water vapor will be necessary to further increase the hydrogen efficiency. The oxygen could be discharged and hydrogen could be generated by controlling the potential using an oxygen pump sensor. The amount of discharged oxygen could then be obtained from the current value. In addition, the amount of hydrogen generated by the oxygen pump sensor of the second stage could be accurately measured.

4. Conclusions

Hydrogen was produced from water vapor by controlling the potential using an oxygen pump sensor. The experiment was conducted by changing the water vapor concentration and the sensor potential. Furthermore, the generated hydrogen was measured in situ by the oxygen pump sensor in the second stage. For the oxygen pump sensor, electrodes were placed at two locations using yttria-stabilized zirconia, which is an oxide ion conductor. This oxygen pump sensor consisted of a pump unit that discharged oxygen and a sensor unit that controlled the partial pressure of the oxygen. Oxygen was discharged by applying a current to the pump by controlling the potential of the sensor, which showed that more hydrogen was generated when the partial pressure of the water vapor was 30.8 vol.% than when it was 12.2 vol.%. As hydrogen was generated, the oxygen partial pressure in the atmosphere further decreased. Furthermore, the potential inversely correlated with the amount of oxygen discharged and the amount of generated hydrogen. When the water vapor concentration was 12.2 vol.%, the hydrogen change efficiency was 39.3% at −1.2 V. When the water vapor concentration was increased to 30.8 vol.%, the conversion efficiency was 65.7% at −1.2 V. Thus, the potential and water vapor concentration significantly contribute to the generation of hydrogen.

Author Contributions

Conceptualization, M.F. and K.N.; methodology, K.N.; validation, M.F. and K.N.; formal analysis, K.N.; investigation, K.N.; resources, M.F.; data curation, K.N.; writing—original draft preparation, M.F.; writing—review and editing, K.N.; visualization, K.N.; supervision, M.F.; project administration, M.F.; funding acquisition, M.F. All authors have read and agreed to the published version of the manuscript.

Funding

This research received no external funding.

Conflicts of Interest

The authors declare no conflict of interest.

References

  1. Momirlan, M.; Veziroglu, T.N. The properties of hydrogen as fuel tomorrow in sustainable energy system for a cleaner planet. Int. J. Hydrogen Energy 2005, 30, 765–802. [Google Scholar] [CrossRef]
  2. Safizadeh, F.; Ghali, E.; Houlachi, G. Electrocatalysis developments for hydrogen evolutuion reaction in alkaline solutions—A Review. Int. J. Hydrogen Energy 2015, 40, 256–274. [Google Scholar] [CrossRef]
  3. Mauer, A.; Kirk, D.W.; Thorpe, S.J. The role of iron in the prevention of nickel electrode deactivation in alkaline electrolysis. Electrochim. Acta 2007, 52, 3505–3509. [Google Scholar] [CrossRef]
  4. Brown, I.J.; Sotiropoulos, S. Preparation and characterization of microporous Ni coatings as hydrogen evolving cathodes. J. Appl. Electrochem. 2000, 30, 107–111. [Google Scholar] [CrossRef]
  5. Chade, D.; Berlouis, L.; Infield, D.; Cruden, A.; Nielsen, P.N.; Mathiesen, T. Evaluation of Raney nickel electrodes prepared by atmospheric plasma spraying for alkaline water electrolysers. Int. J. Hydrogen Energy 2013, 38, 14380–14390. [Google Scholar] [CrossRef]
  6. Chen, L.; Lasia, A. Study of the kinetics of hydrogen evolution reaction on nickel-zinc alloy electrodes. J. Electrochem. Soc. 1991, 138, 3321–3328. [Google Scholar] [CrossRef]
  7. Chen, L.; Lasia, A. Study of the kinetics of hydrogen evolution reaction on nickel-zinc powder electrodes. J. Electrochem. Soc. 1992, 139, 3214–3219. [Google Scholar] [CrossRef]
  8. Rami, A.; Lasia, A. Kinetics of hydrogen evolution on Ni-Al alloy electrodes. J. Appl. Electrochem. 1992, 22, 376–382. [Google Scholar] [CrossRef]
  9. Birry, L.; Lasia, A. Studies of the hydrogen evolution reaction on Raney nickel-molybdenum electrodes. J. Appl. Electrochem. 2004, 34, 735–749. [Google Scholar] [CrossRef]
  10. Dong, H.; Lei, T.; He, Y.; Xu, N.; Huang, B.; Liu, C.T. Electrochemical performance of porous Ni3Al electrodes for hydrogen evolution reaction. Int. J. Hydrogen Energy 2011, 36, 12112–12120. [Google Scholar] [CrossRef]
  11. Navarro-Flores, E.; Chong, Z.; Omanovic, S. Characterization of Ni, NiMo, NiW and NiFe electroactive coatings as electrocatalysts for hydrogen evolution in an acidic medium. J. Mol. Catal. A Chem. 2005, 226, 179–197. [Google Scholar] [CrossRef]
  12. Mullis, A.M.; Bigg, T.D.; Adkins, N.J. A microstructural investigation of gas atomized Raney type Al-27.5at.% Ni catalyst precursor alloys. J. Alloys Compd. 2015, 648, 139–148. [Google Scholar] [CrossRef] [Green Version]
  13. Tanaka, S.; Hirose, N.; Tanaki, T.; Ogata, Y.H. The effect of tin ingredients on electrocatalytic activity of Raney-Ni prepared by mechanical alloying. Int. J. Hydrogen Energy 2001, 26, 47–53. [Google Scholar] [CrossRef]
  14. Yu, L.; Lei, T.; Nao, B.; Jiang, Y.; He, Y.; Liu, C.T. Characteristics of a sintered porous Ni-Cu alloy cathode for hydrogen production in a potassium hydroxide solution. Energy 2016, 97, 498–505. [Google Scholar] [CrossRef]
  15. Yüce, A.O.; Döner, A.; Kardaş, G. NiMn composite electrodes as cathode material for hydrogen evolution reaction in alkaline solution. Int. J. Hydrogen Energy 2013, 38, 4466–4473. [Google Scholar] [CrossRef]
  16. Lupi, C.; Dell’Era, A.; Pasquali, M. Nickel-cobalt electrodeposited alloys for hydrogen evolution in alkaline media. Int. J. Hydrogen Energy 2009, 34, 2101–2106. [Google Scholar] [CrossRef]
  17. González-Buch, C.; Herraiz-Cardona, I.; Ortega, E.; García-Antón, J.; Pérez-Herranz, V. Synthesis and characterization of macroporous Ni, Co and Ni-Co electrocatalytic deposits for hydrogen evolution reaction in alkaline media. Int. J. Hydrogen Energy 2013, 38, 10157–10169. [Google Scholar] [CrossRef]
  18. Domínguez-Crespo, M.A.; Ramírez-Meneses, E.; Torres-Huerta, A.M.; Garibay-Febles, V.; Philippot, K. Kinetics of hydrogen evolution reaction on stabilized Ni, Pt and Ni-Pt nanoparticles obtained by an organometallic approach. Int. J. Hydrogen Energy 2012, 37, 4798–4811. [Google Scholar] [CrossRef]
  19. Fiameni, S.; Herraiz-Cardona, I.; Musiani, M.; Pérez-Herranz, V.; Vázquez-Gómez, L.; Verlato, E. The HER in alkaline media on Pt-modified three-dimensional Ni cathode. Int. J. Hydrogen Energy 2012, 37, 10507–10516. [Google Scholar] [CrossRef]
  20. Eiler, K.; Suriñach, S.; Sort, J.; Pellicer, E. Mesoporous Ni-rich Ni-Pt thin films: Electrodeposition, characterization and performance toward hydrogen evolution reaction in acidic media. Appl. Catal. B 2020, 265, 118597. [Google Scholar] [CrossRef]
  21. Fukumoto, M.; Sugiuchi, K.; Nakajima, K. Formation of porous Ni surface by electrodeposition and dissolution in molten salt. Int. J. Hydrogen Energy 2020, 45, 28252–28259. [Google Scholar] [CrossRef]
  22. Nakajima, K.; Yamada, T.; Fukumoto, M. Formation of porous stainless steel surface by Al electrodeposition and dissolution in the molten salt and sliding properties. ISIJ Int. 2021, 61, 945–952. [Google Scholar] [CrossRef]
  23. Nakajima, K.; Fukumoto, M. Porous Ni-Co surface formation and analysis of hydrogen generation by gas sensor. Int. J. Hydrogen Energy 2021, 46, 26263–26271. [Google Scholar] [CrossRef]
  24. Lessing, P.A. A review of sealing technologies applicable to solid oxide electrolysis cells. J. Mater. Sci. 2007, 42, 3465–3476. [Google Scholar] [CrossRef]
  25. Ni, M.; Leung, M.K.H.; Leung, Y.C. Technological development of hydrogen production by solid oxide electrolyzer cell (SOEC). Int. J. Hydrogen Energy 2008, 33, 2337–2354. [Google Scholar] [CrossRef]
  26. Jensen, S.H.; Sun, X.; Ebbesen, S.D.; Knibbe, R.; Mogensen, M. Hydrogen and synthetic fuel production using pressurized solid oxide electrolysis cells. Int. J. Hydrogen Energy 2010, 35, 9544–9549. [Google Scholar] [CrossRef]
  27. Tietz, F.; Sebold, D.; Brisse, A.; Schefold, J. Degradation phenomena in a solid oxide electrolysis cell after 9000 h of operation. J. Power Sources 2013, 223, 129–135. [Google Scholar] [CrossRef]
  28. Moçoteguy, P.; Brisse, A. A review and comprehensive analysis of degradation mechanisms of solid oxide electrolysis cells. Int. J. Hydrogen Energy 2013, 38, 15887–15902. [Google Scholar] [CrossRef]
  29. Im-orb, K.; Visitdumrongkul, N.; Saebea, D.; Patcharavorachot, Y.; Arpornwichanop, A. Flowsheet-based model and energy analysis of solid oxide electrolysis cells for clean hydrogen production. J. Clean. Prod. 2018, 170, 1–13. [Google Scholar] [CrossRef]
  30. Momma, A.; Kato TKaga, Y.; Nagata, S. Polarization Behavior of High Temperature Solid Oxide Electrolysis Cells (SOEC). J. Ceram. Soc. Jpn. 1997, 105, 369–373. [Google Scholar] [CrossRef]
  31. Stephen Herring, J.; O’Brien, J.E.; Stoots, C.M.; Hawkes, G.L.; Hartvigsen, J.J.; Shahnam, M. Progress in high-temperature electrolysis for hydrogen production using planar SOFC technology. Int. J. Hydrogen Energy 2007, 32, 440–450. [Google Scholar] [CrossRef] [Green Version]
  32. Brisse, A.; Schefold, J.; Zahid, M. High temperature water electrolysis in solid oxide cells. Int. J. Hydrogen Energy 2008, 33, 5375–5382. [Google Scholar] [CrossRef]
  33. Ebbesen, S.D.; Graves, C.; Hauch, A.; Jensen, S.H.; Mogensen, M. Poisoning of Solid Oxide Electrolysis Cells by Impurities. J. Electrochem. Soc. 2010, 157, B1419–B1429. [Google Scholar] [CrossRef] [Green Version]
  34. Wang, X.; Yu, B.; Zhang, W.; Chen, J.; Luo, X.; Stephan, K. Microstructure modification of the anode / electrolyte interface of SOEC for hydrogen production. Int. J. Hydrogen Energy 2012, 37, 12833–12838. [Google Scholar] [CrossRef]
  35. Kim, J.; Jun, A.; Gwon, O.; Yoo, S.; Liu, M.; Shin, J.; Lim, T.H.; Kim, G. Hybrid-solid oxide electrolysis cell: A new strategy for efficient hydrogen production. Nano Energy 2018, 44, 121–126. [Google Scholar] [CrossRef]
  36. Vialetto, G.; Noro, M.; Colbertaldo, P.; Rokni, M. Enhancement of energy generation efficiency in industrial facilities by SOFE-SOEC systems with additional hydrogen production. Int. J. Hydrogen Energy 2019, 44, 9608–9620. [Google Scholar] [CrossRef]
  37. Fukumoto, M.; Kawamori, Y.; Sonobe, H.; Hara, M.; Kaneko, H. Investigation of high-temperature oxidation in steam for Ni-Al alloys using the combination of a hydrogen sensor and an oxygen pump-sensor. Oxid. Met. 2018, 89, 357–373. [Google Scholar] [CrossRef]
  38. Fukumoto, M.; Kawamori, Y.; Hara, M. Investigation of cyclic oxidation in Ar-H2O for NiAl containing Hf or Zr by the combination of a hydrogen sensor and an oxygen pump-sensor. Corros. Sci. 2019, 149, 68–74. [Google Scholar] [CrossRef]
  39. Fukumoto, M.; Nakajima, K.; Kawamori, Y. Investigation of alumina formation and oxidation rate of Ni-5wt%Al-Xwt%Cr alloy using hydrogen sensor and oxygen pump sensor. Oxid. Met. 2020, 94, 191–204. [Google Scholar] [CrossRef]
  40. Ferlazzo, A.; Espro, C.; Iannazzo, D.; Moulaee, K.; Neri, G. A novel yttria-doped ZrO2 based conductometric sensor for hydrogen leak monitoring. Int. J. Hydrogen Energy 2022, 47, 9819–9828. [Google Scholar] [CrossRef]
  41. Shinoda, T.; Ozawa, S.; Kawashima, K.; Kuribayashi, K.; Yamayoshi, T.; Itoh, Y. Flux-Free Brazing of Aluminum Alloys under Ultra-Low Oxygen Partial Pressure through a Zirconia Oxygen Pump. Mater. Trans. 2022, 63, 1477–1483. [Google Scholar] [CrossRef]
  42. Fukumoto, M.; Sakuraba, T.; Hara, M.; Kaneko, H. Hydrogen generation monitoring and mass gain analysis during the steam oxidation for zircaloy using hydrogen and oxygen sensors. J. Jpn. Inst. Met. Mater. 2015, 79, 362–371. [Google Scholar] [CrossRef] [Green Version]
  43. Fukumoto, M.; Sonobe, H.; Hara, M.; Kaneko, H. Investigation of high temperature oxidation in steam containing O2 for zircaloy using the combination of a hydrogen sensor and an oxygen sensor. J. Jpn. Inst. Met. Mater. 2016, 80, 231–239. [Google Scholar] [CrossRef]
Figure 1. Schematic diagram of the oxygen pump-sensor. (a) Hydrogen formation and (b) hydrogen detection.
Hydrogen 03 00029 g001
Figure 2. Photograph (a) and schematic diagram of principle (b) of oxygen pump sensor.
Hydrogen 03 00029 g002
Figure 3. Time dependence of oxygen emission and oxygen partial pressure by the oxygen pump sensor in the first stage when the amount of water vapor is 12.2 vol.%.
Hydrogen 03 00029 g003
Figure 4. Time dependence of current value when water vapor amount is 12.2 vol.% (a) and time dependence of oxygen emission amount and generated hydrogen amount (b).
Hydrogen 03 00029 g004
Figure 5. Relationship between exhausted oxygen and oxygen partial pressure (a) and generated hydrogen amount (b) when the amount of water vapor is 12.2 vol.%.
Hydrogen 03 00029 g005
Figure 6. Relationship between the amount of generated hydrogen measured by the second stage oxygen pump sensor and the amount of generated hydrogen calculated from the oxygen partial pressure.
Hydrogen 03 00029 g006
Figure 7. Oxygen exhausted amount and oxygen partial pressure measured in the second stage (a) and relationship between exhausted oxygen and generated hydrogen (b).
Hydrogen 03 00029 g007
Figure 8. Oxygen exhausted amount and oxygen partial pressure measured in the second stage (a) and relationship between exhausted oxygen and generated hydrogen (b).
Hydrogen 03 00029 g008
Figure 9. Amount of discharged oxygen and partial pressure of oxygen measured in the second stage (a) and relationship between discharged oxygen and generated hydrogen (b).
Hydrogen 03 00029 g009
Table 1. Relationship between the amount of discharged oxygen and the amount of generated hydrogen under each condition.
Exhausted Oxygen (mol)Generated Hydrogen (mol)Hydrogen Production Efficiency (%)
12.2 vol.% H2O (−1.1V)1.84 × 10−41.38 × 10−437.5
12.2 vol.% H2O (−1.2V)2.86 × 10−42.25 × 10−439.3
30.8 vol.% H2O (−1.1V)3.00 × 10−43.42 × 10−457.2
30.8 vol.% H2O (−1.2V)2.99 × 10−43.93 × 10−465.7
Publisher’s Note: MDPI stays neutral with regard to jurisdictional claims in published maps and institutional affiliations.

