2.2. Fuelling Model
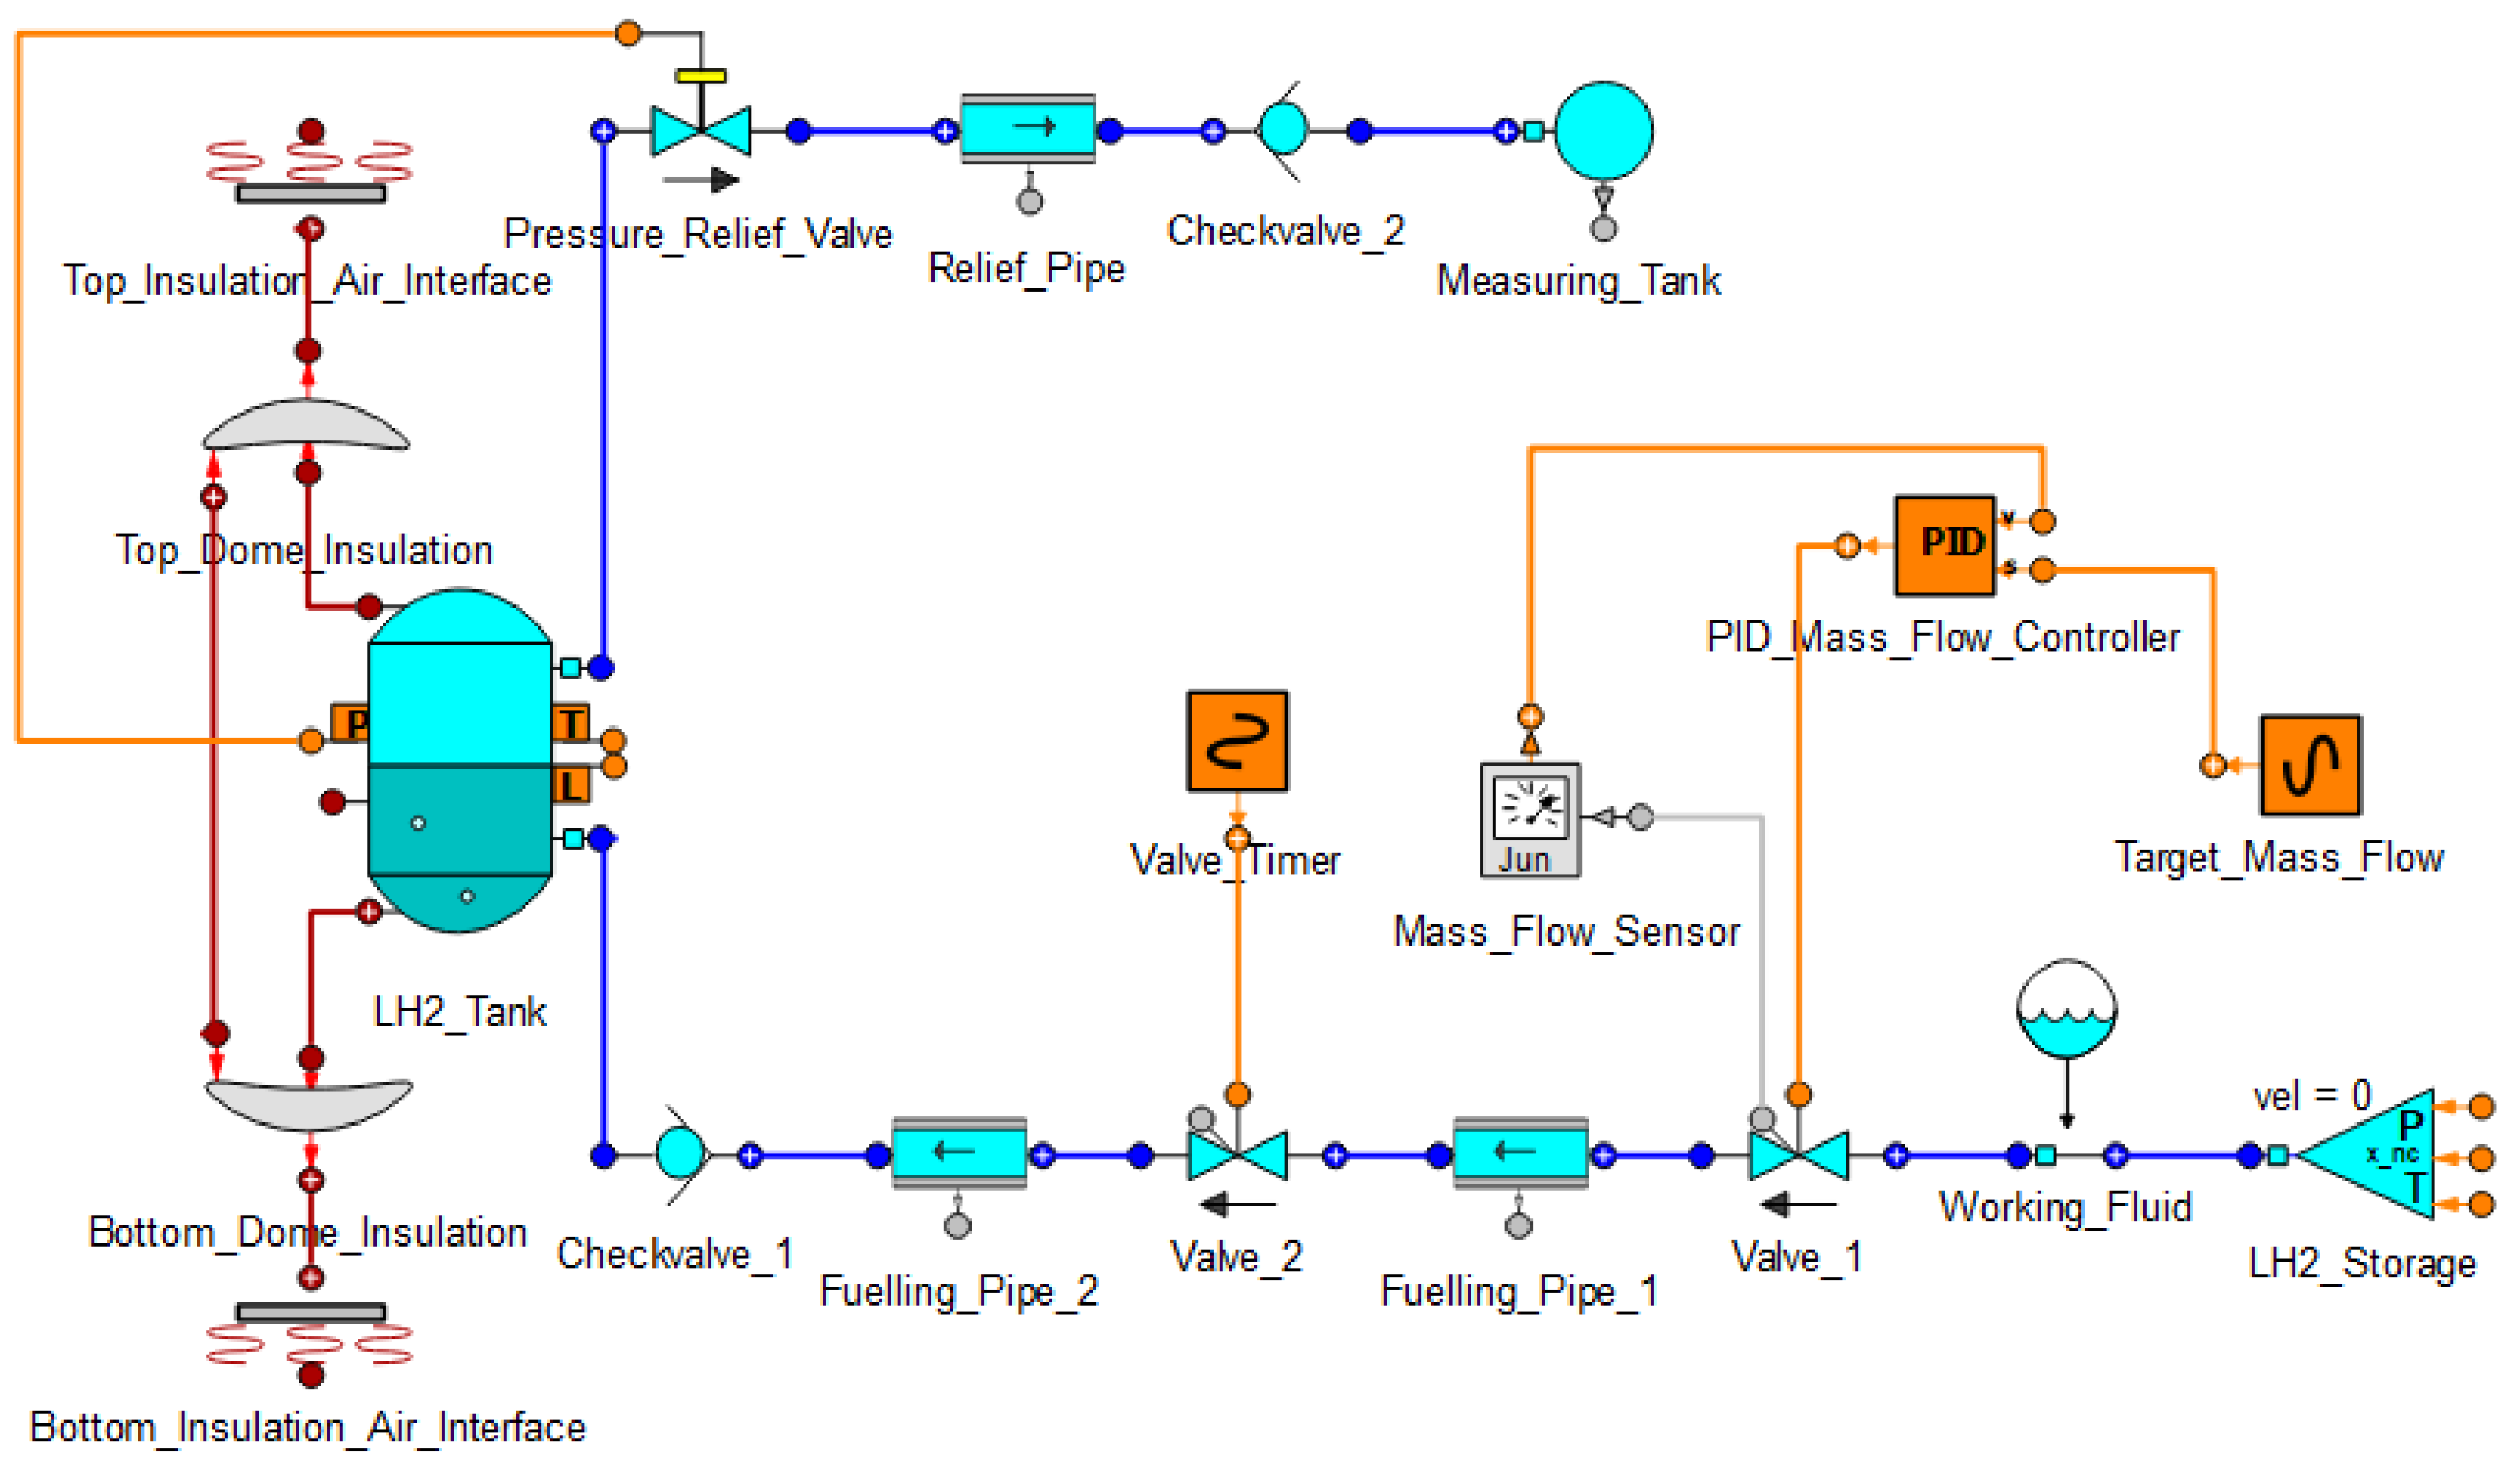
The Fuelling Model that can be seen in
Figure 1 consists of a liquid hydrogen tank (cryotank), its insulation and the insulation-air interface, a pressure relief fluid line, a fuelling fluid line and a mass flow controller.
The pressure relief line contains the pressure relief valve, which is set to open at the maximum cryotank pressure, a pipe, a check valve and a measuring tank. This tank measures how much gas goes through the pressure relief line, thus quantifying boil-off losses. The fuelling line consists of a check valve to make sure the fluid only flows into the cryotank, two pipes, two valves, a component to define the fluid inside the line and the storage boundary condition. Valve 1 is used as a mass flow control valve and is controlled by the PID mass flow controller. It measures the mass flow and compares this value to the target mass flow. Valve 2 is open during the fuelling process and closes when the cryotank is full. The insulation of the cryotank is made of vacuum insulated panels (VIP). This is a thin, high-performing insulation material consisting of a rigid, highly-porous core and a gas-tight outer envelope which is evacuated and sealed. This results in a thermal conductivity of 0.006 W/mK, which is about 5 times lower than polyurethane foam.
Since the pressure in the storage boundary condition is set higher than the target pressure of the cryotank, no pump is needed in the fuelling line.
2.2.1. Mesh Study
In numerical simulations, the discretization or meshing of a model is the process of dividing a geometry into a finite number of elements for numerical analysis. It determines the accuracy of the simulation, but also the computing effort. A compromise has to be found, taking these opposing requirements into account. For the Fuelling Model, the discretization of the cryotank wall has the largest impact on the simulation results.
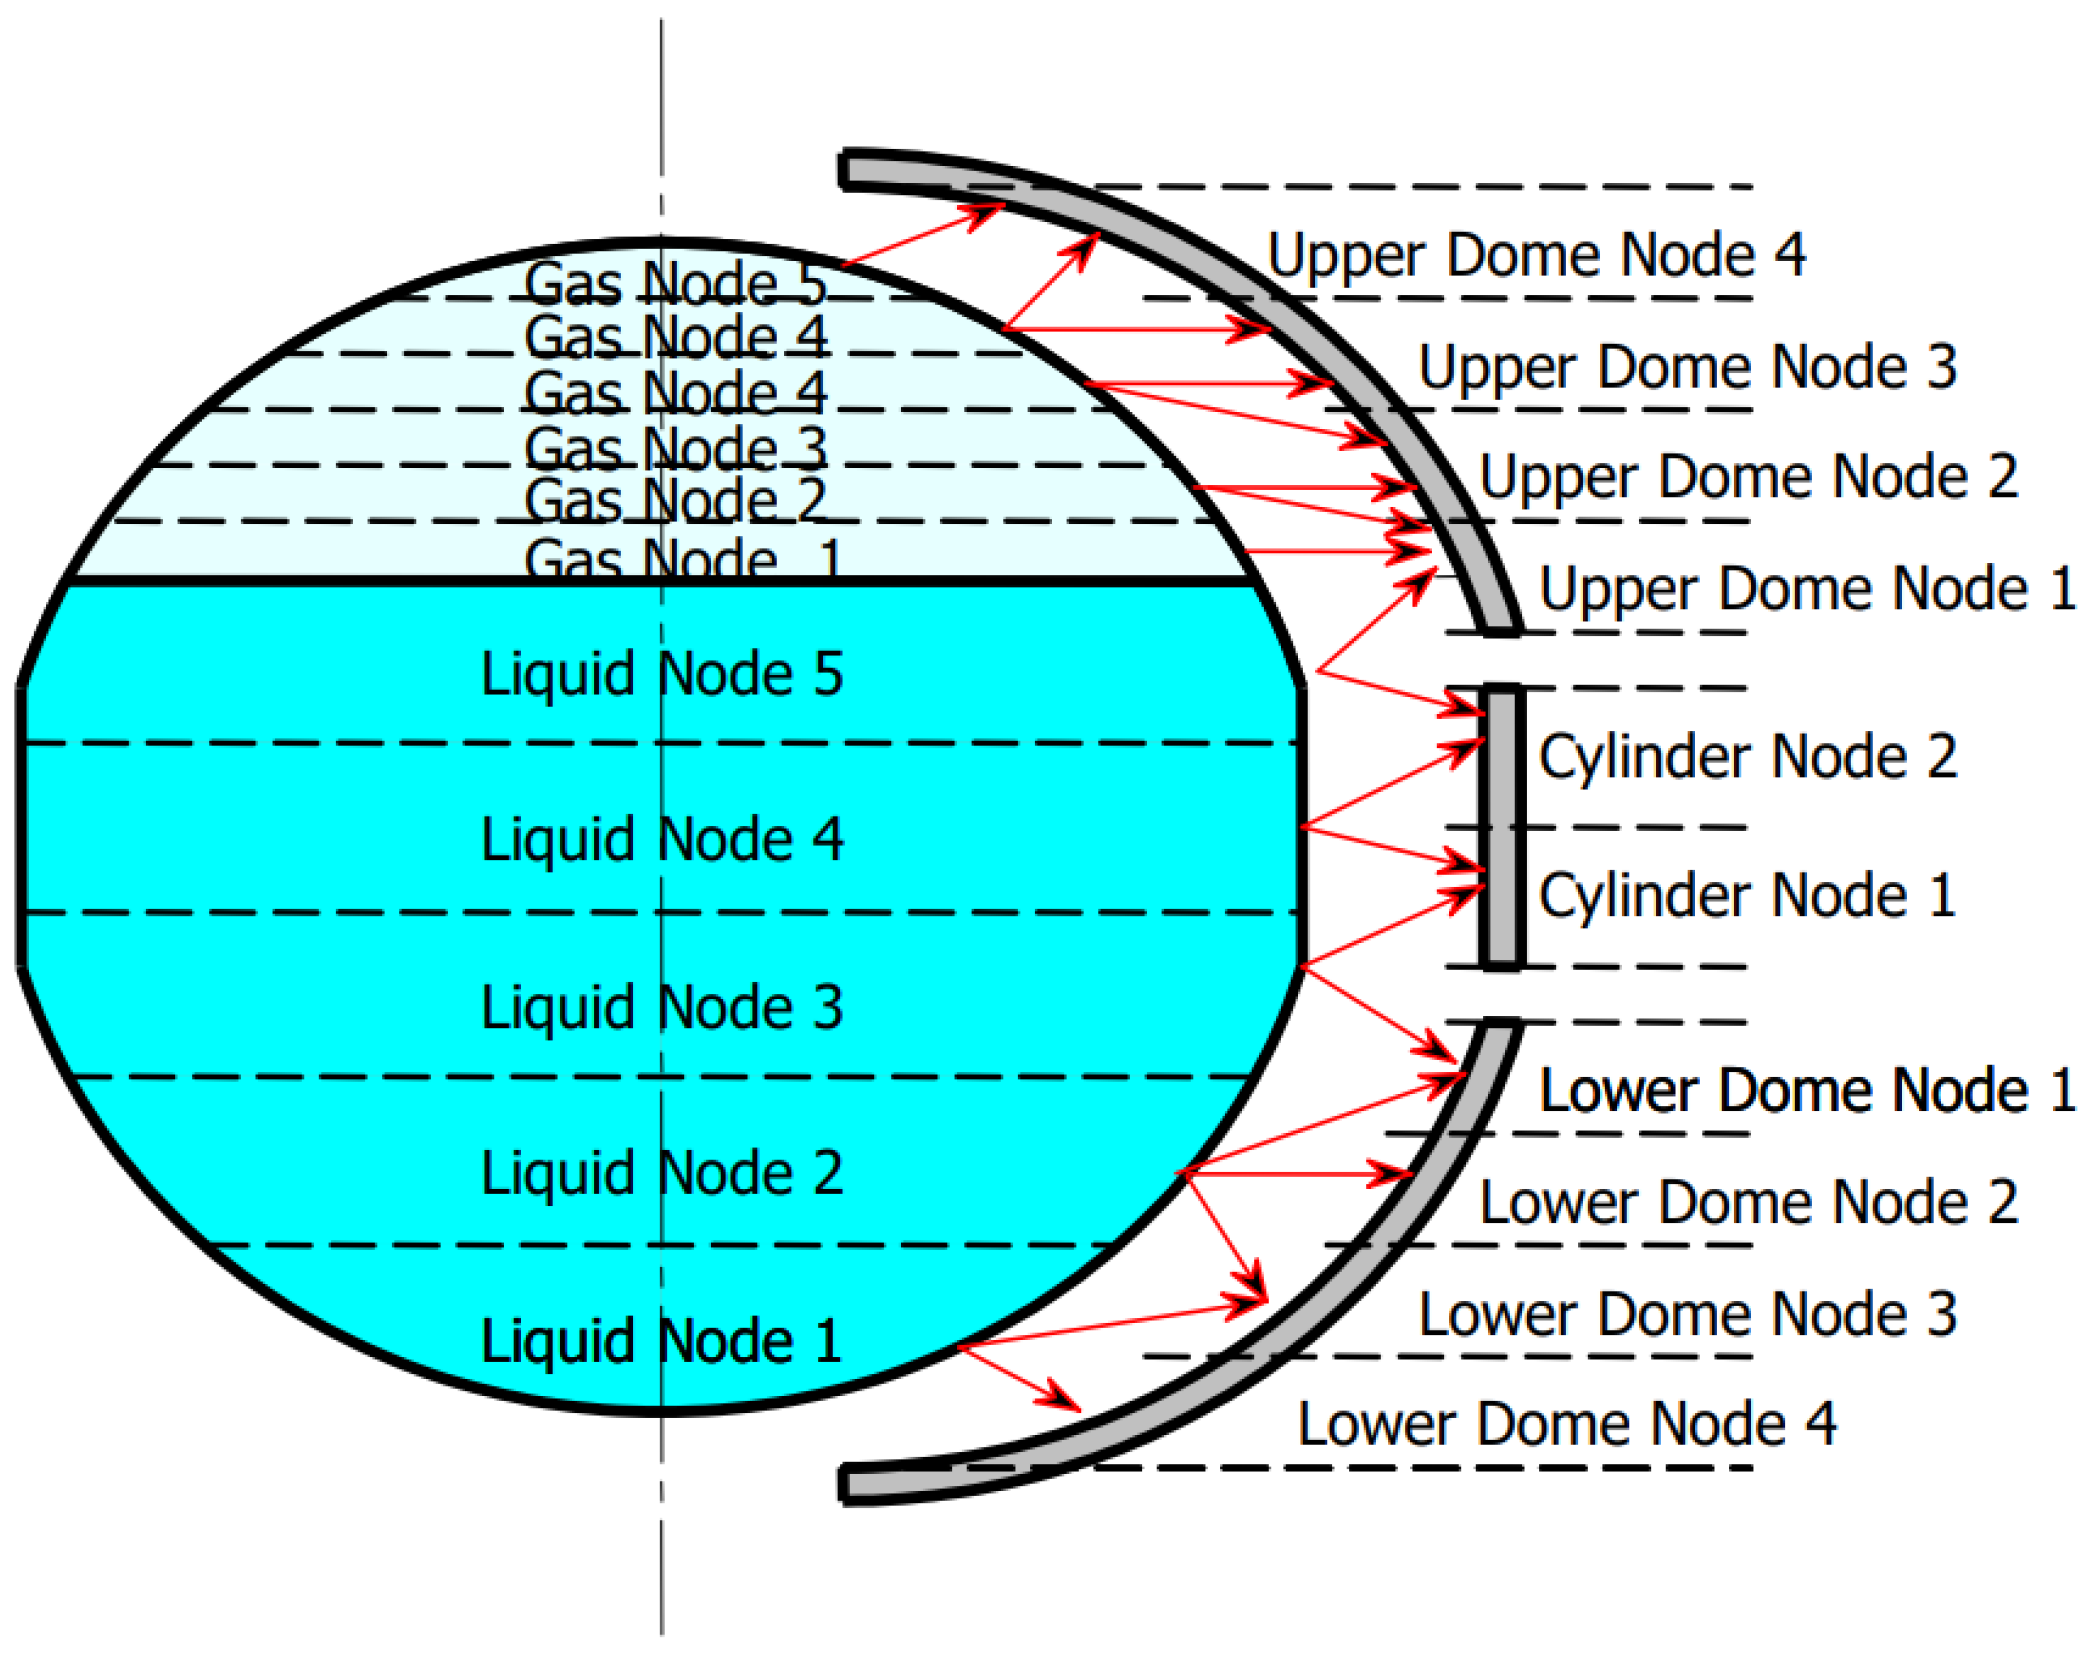
The cryotank wall is split into two hemispherical domes, separated by a thin cylindrical part. Contrary to the exemplary discretization shown in
Figure 2, there is only one node for the liquid and gas volume respectively. This is recommended if thermal stratification in the liquid or gas sides is not necessary to be calculated [
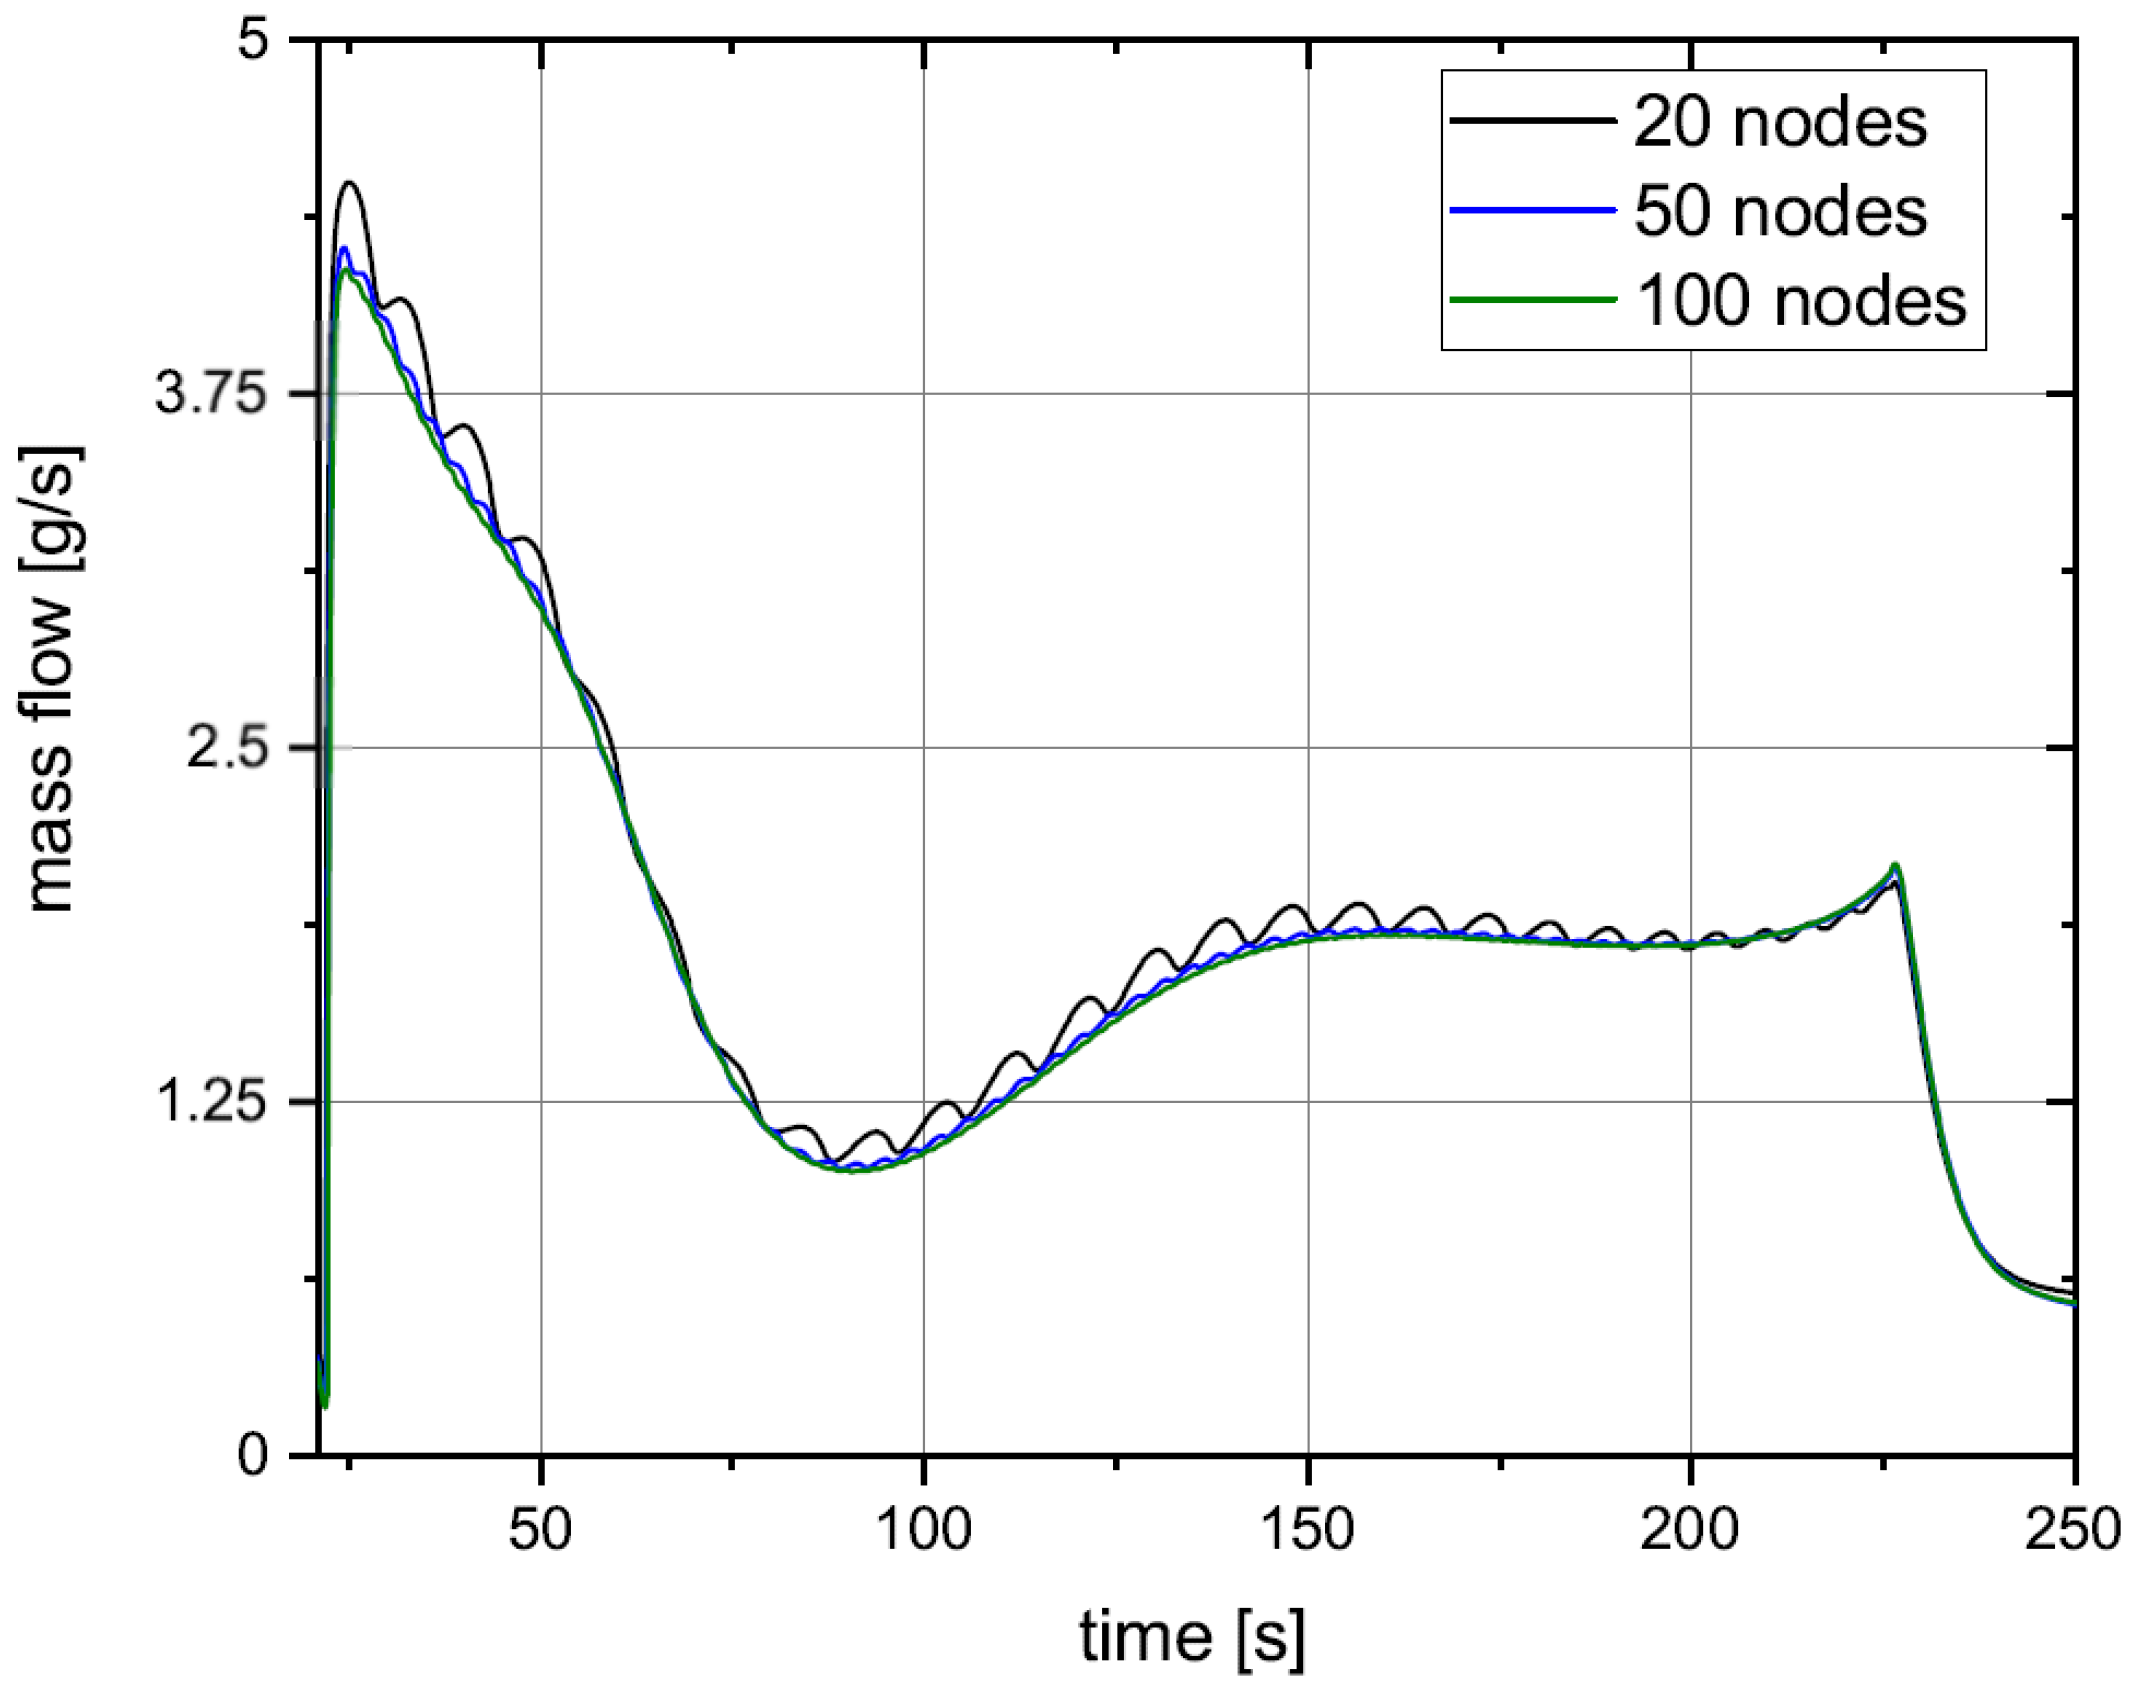
18]. Each dome consists of 50 nodes in the vertical direction and 3 radial nodes, totalling 150 nodes for each dome. The discretization in the vertical direction is closely reviewed, due to its effect on the boiling rate of the hydrogen. As the cryotank is filled, the liquid level rises, meaning the liquid comes into contact with the next vertical wall node. Since this node has not yet been cooled by the liquid hydrogen, it now transmits its heat to the hydrogen, increasing the hydrogen boiling rate. This effect can be reduced by increasing the number of vertical nodes. In
Figure 3 the boiling rate is compared for 20, 50 and 100 vertical nodes for each dome.
The boiling rate in the case of 50 vertical wall nodes is significantly smoother than for 20 nodes. The boiling rate for 100 vertical nodes is slightly smoother than for 50 nodes, but the computing effort increased significantly. For that reason, 50 vertical nodes is chosen for the final version of the Fuelling Model, as it represents a good compromise between accuracy and computational recources.
2.2.2. Boundary and Initial Conditions
Important boundary and initial conditions of the model are specified in
Table 1 and
Table 2.
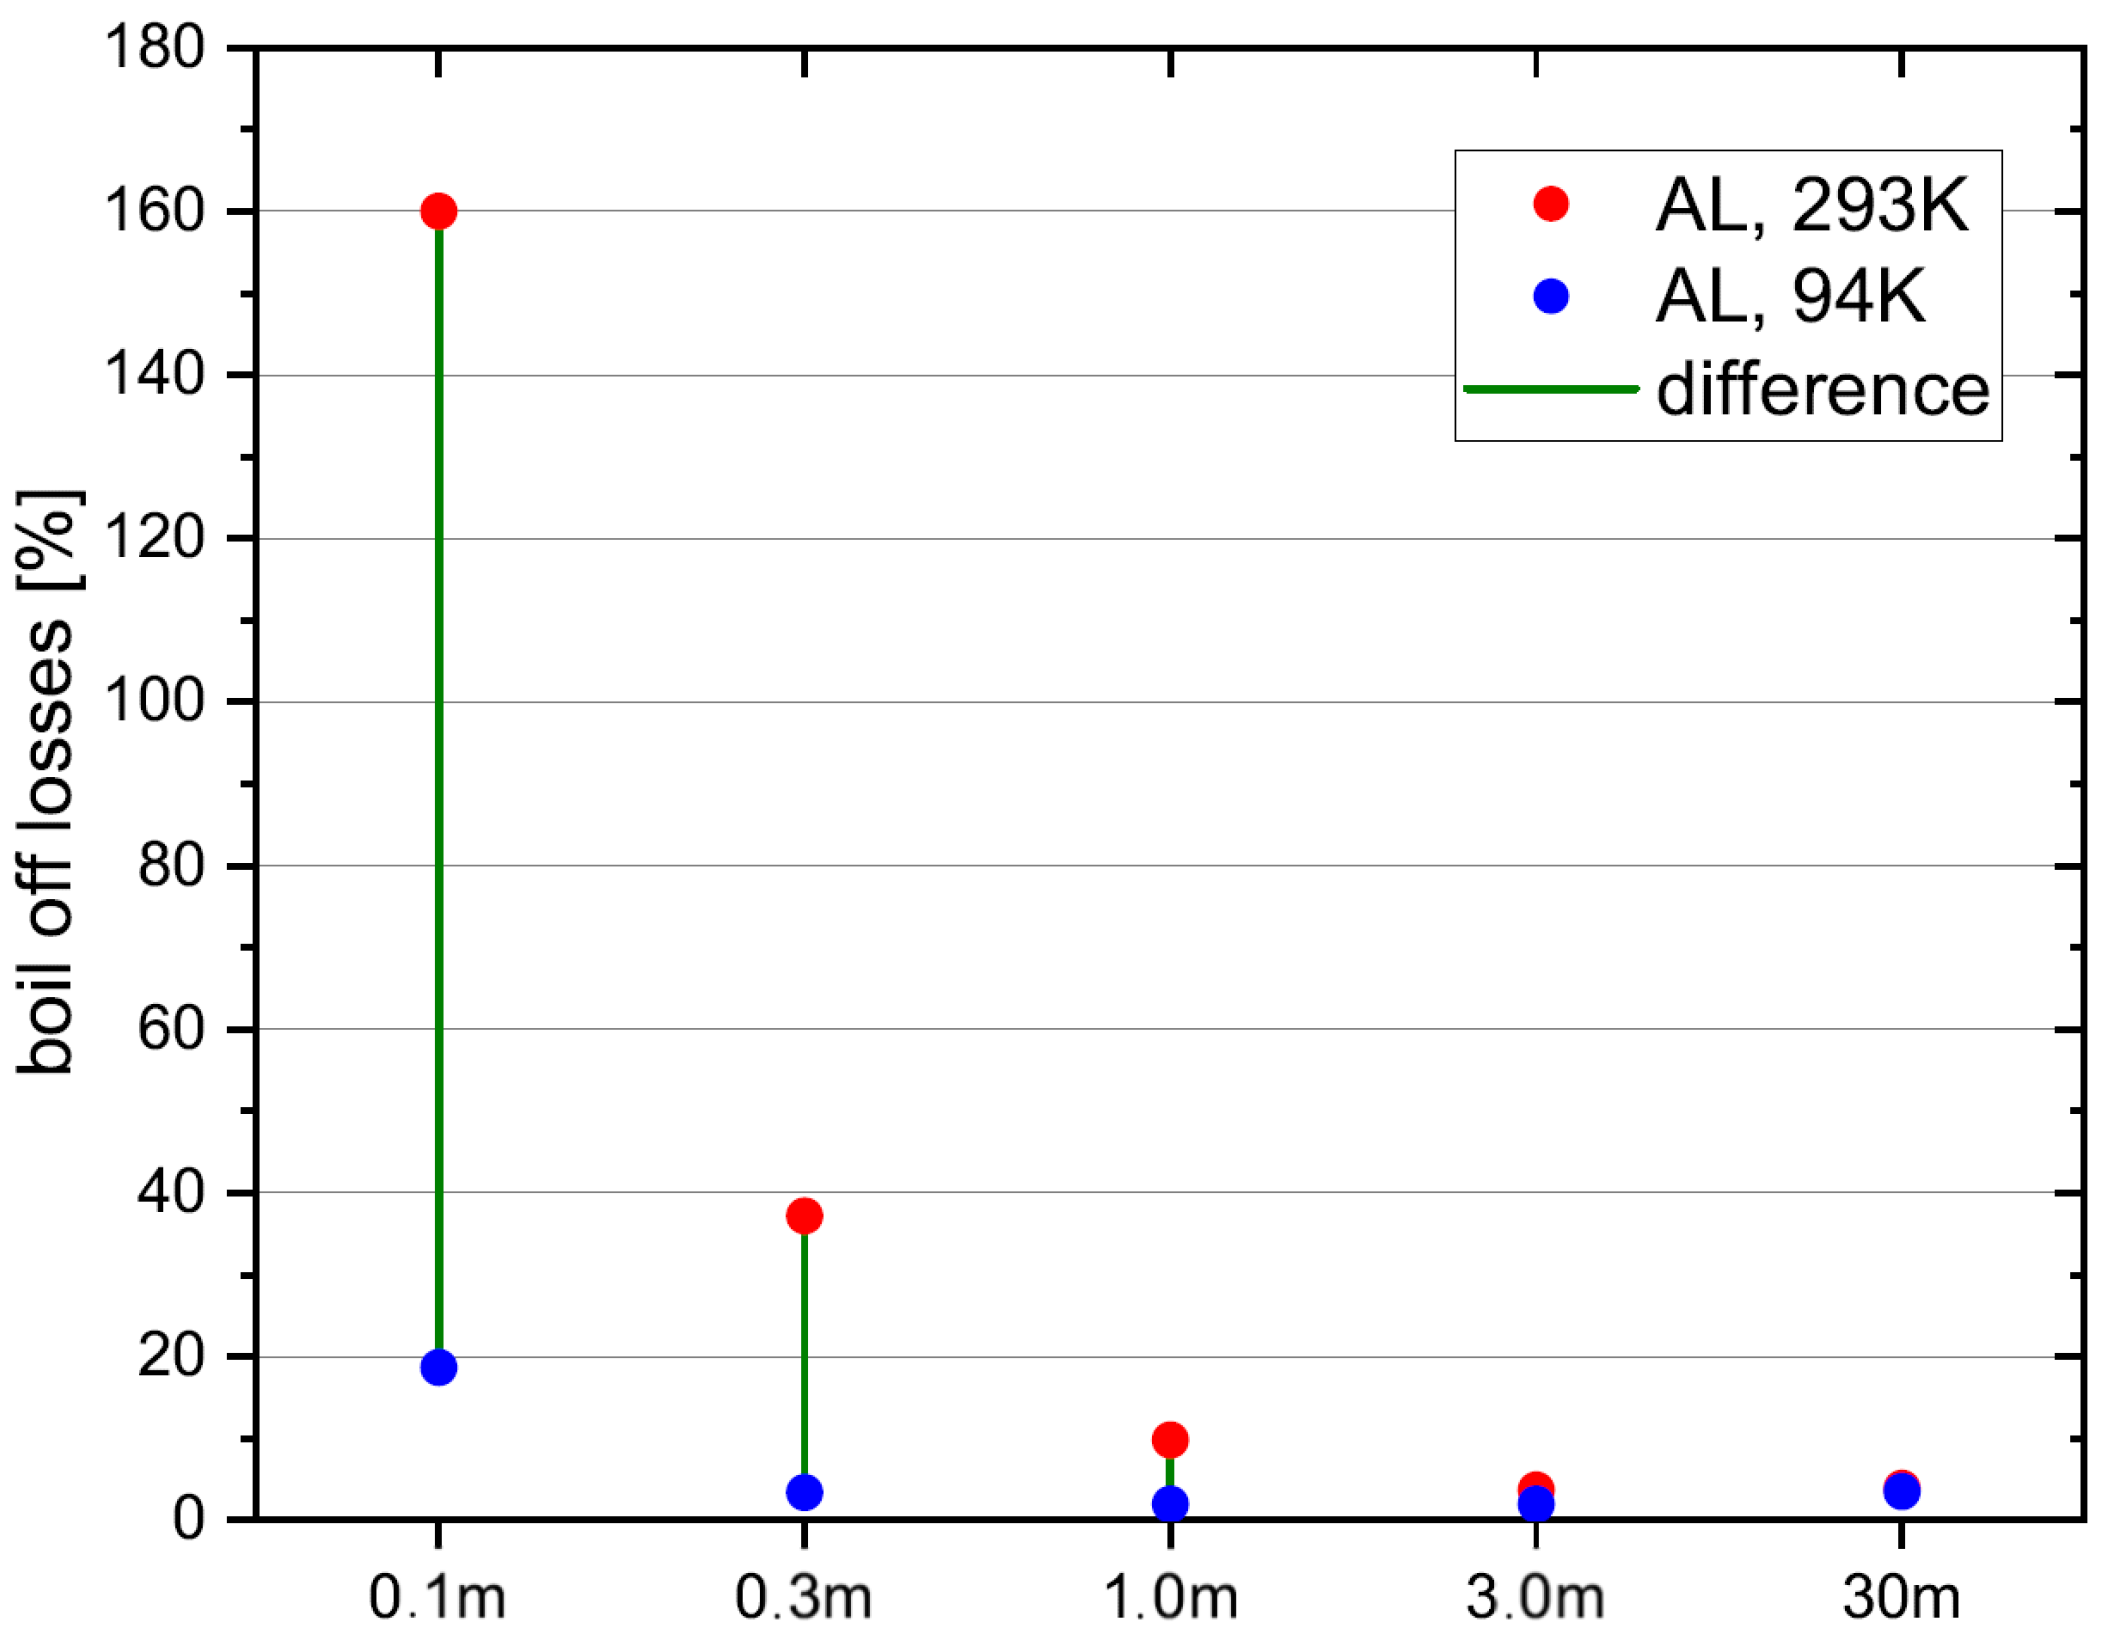
The cylindrical part of the cryotank is set to be 0.001 m high, meaning the cryotank is nearly spherical. In the following simulations, the initial cryotank fill level is set to 5% and the initial liquid temperature is set to 20 K, because otherwise all of the liquid evaporates before the liquid hydrogen from the fuelling line reaches the cryotank, thus leading to a termination of the simulation.
2.3. Analytical Validation
To validate the simulation results, boil-off losses are calculated analytically. Minimum and maximum expected boil-off losses as well as a more realistic mean value are calculated, using simplified thermodynamic formulas. The maximum boil-off losses (Equation (
1)) are calculated by dividing the heat that needs to be removed from the cryotank
by the vaporization enthalpy of hydrogen.
The underlying assumption in that case is that the evaporated hydrogen leaves the cryotank without absorbing any additional heat. That means it does not increase its temperature after evaporation. Since this approach overestimates the boil-off losses, these are the maximum expected boil-off losses.
consists of multiple components (Equation (
2)).
These represent the heat that needs to be removed from the cryotank walls (Equation (
3)), the insulation (Equation (
4)) and the gas inside the cryotank (Equation (
5)). Each of those components is calculated by multiplying
with its heat capacity
and mass
m.
The mass of the gas inside the cryotank before fuelling
is provided by the Fuelling Model. The mass of the cryotank wall and insulation is calculated in Equation (
6) using the radius
r of the cryotank, the density
of the material and the thickness
t.
The minimum boil-off losses (Equation (
7)) are calculated by extending Equation (
1). Instead of assuming that no additional heat is absorbed by the gaseous hydrogen leaving the cryotank, it is assumed that it leaves the cryotank at the starting temperature
of the cryotank. Since the temperature of the cryotank decreases quickly after liquid hydrogen enters, this assumption will underestimate boil-off losses.
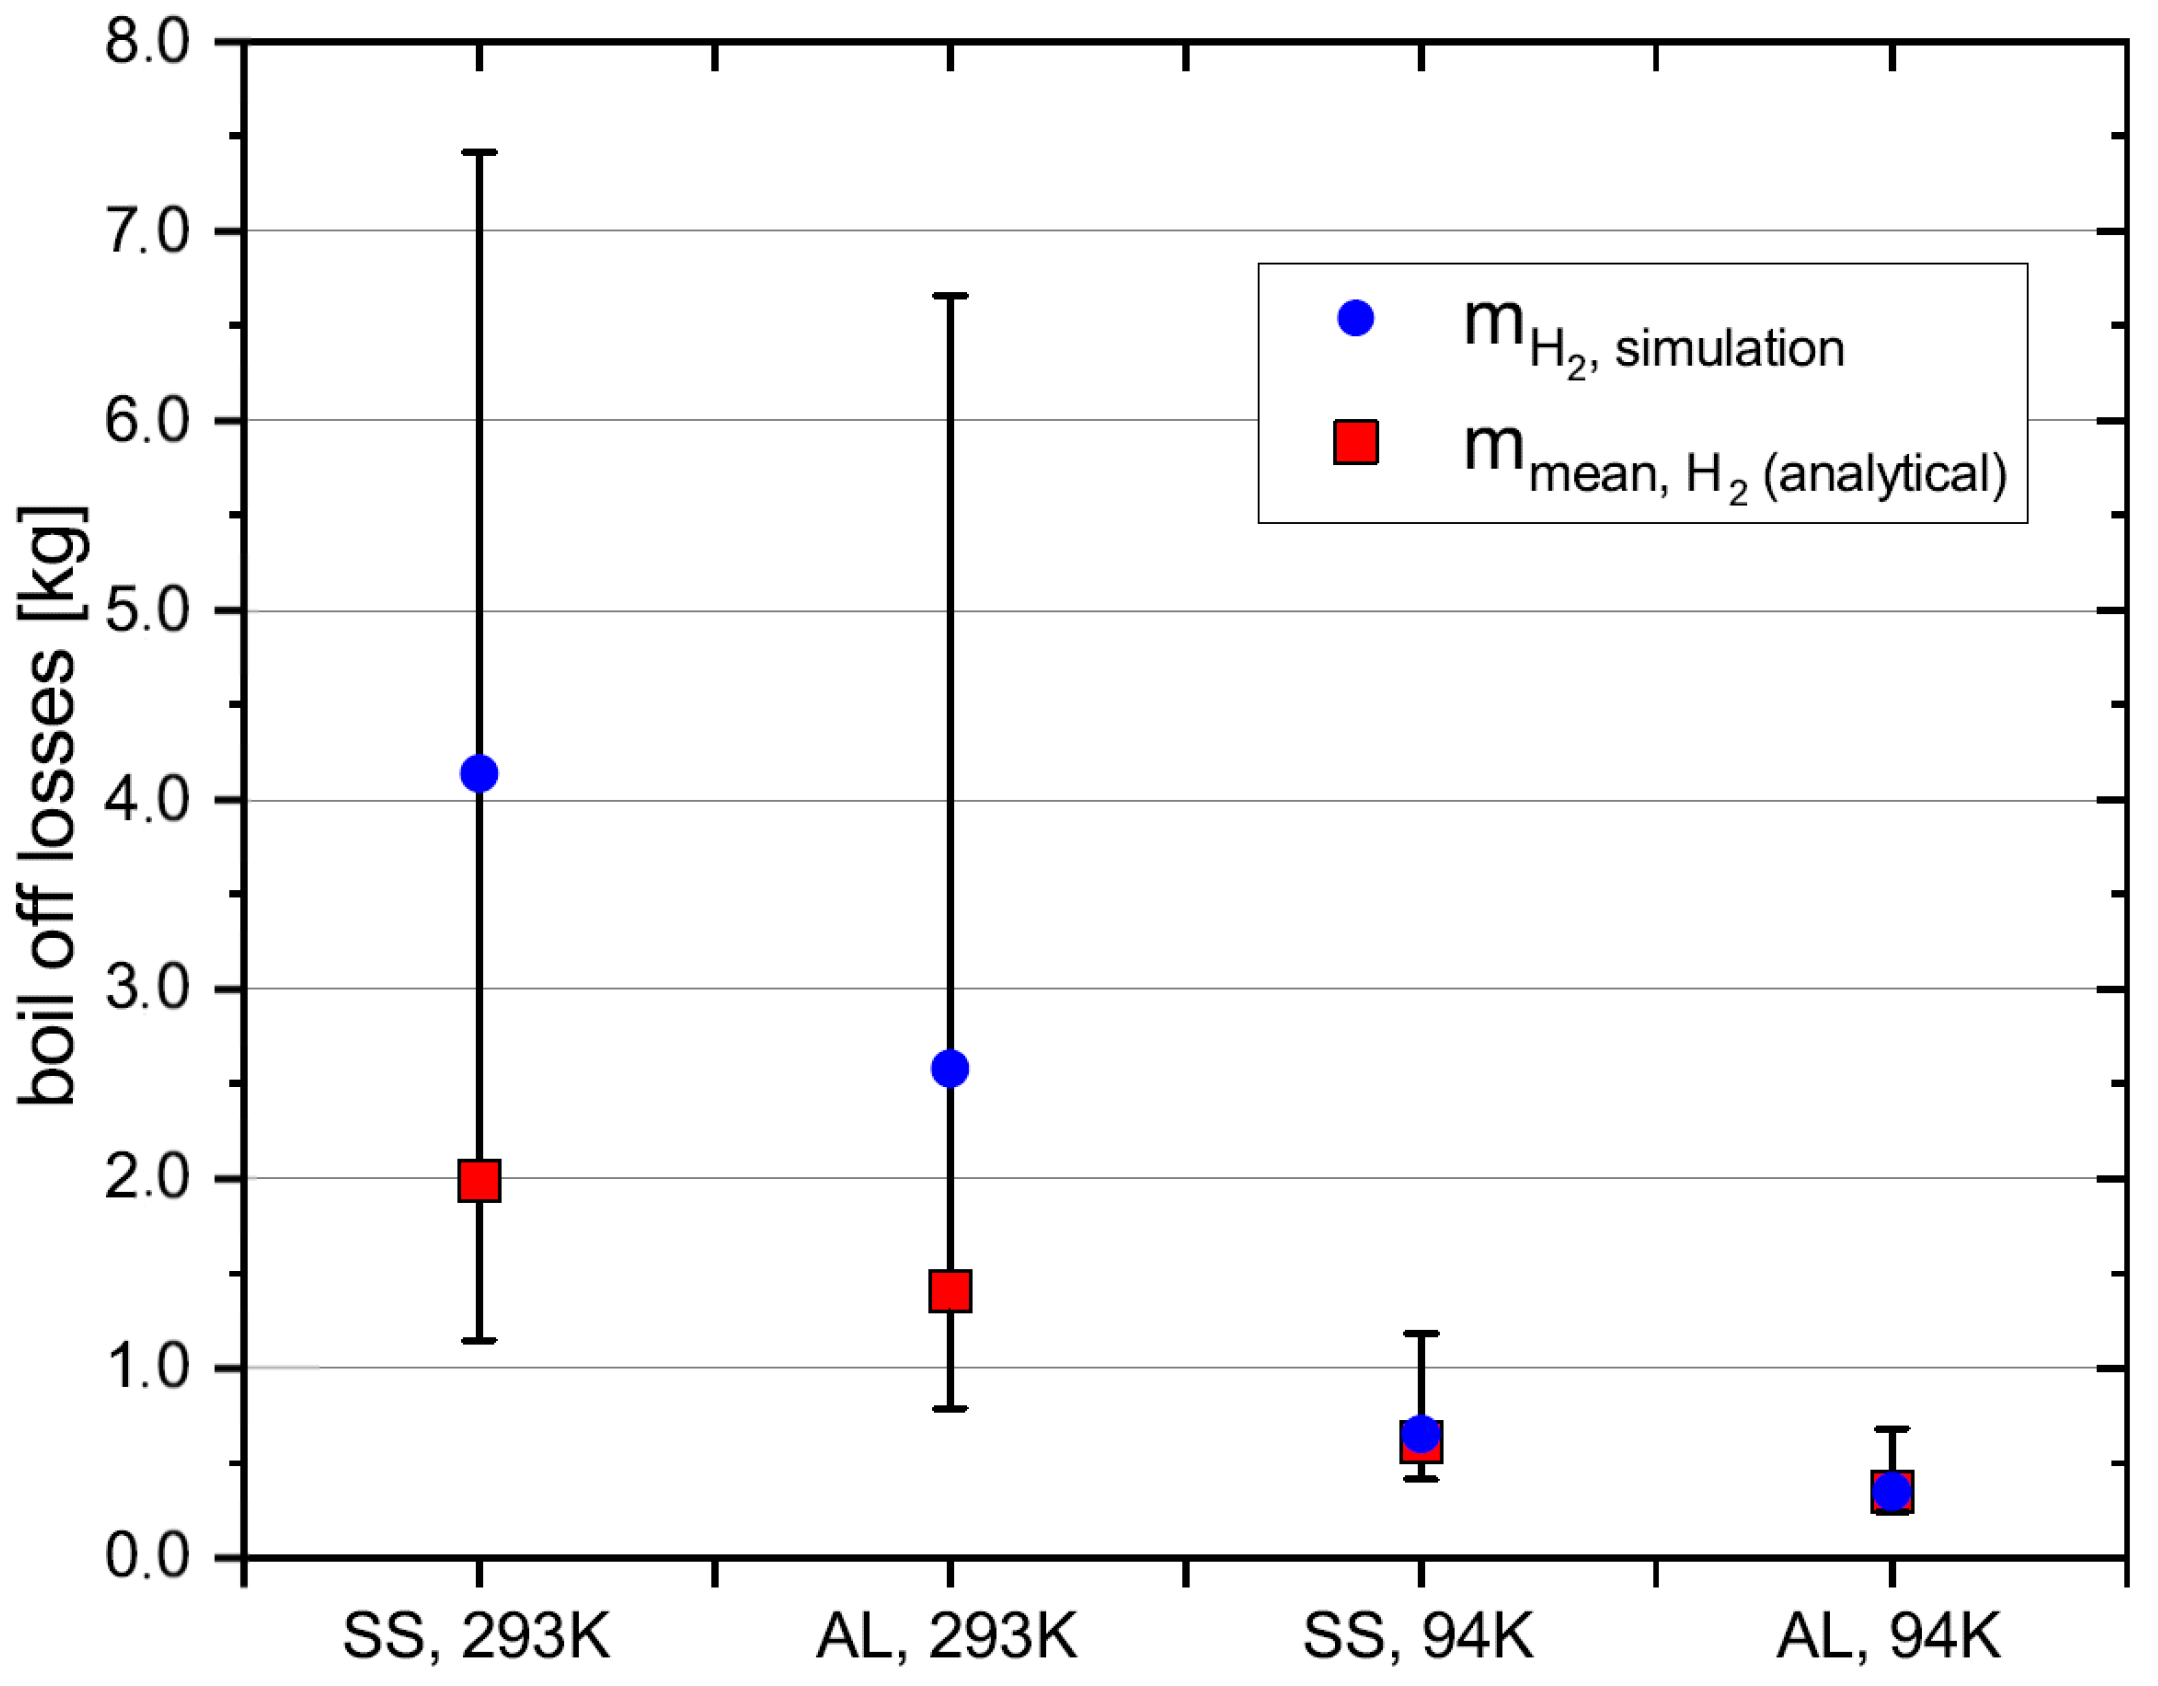
That means we now have an upper and lower boundary for boil-off losses, meaning if the simulation results are correct, they should be within those boundaries. As a third value, a mean value for boil-off losses is calculated (Equation (
8)). In this case, the gaseous hydrogen absorbs heat before leaving the cryotank, but only half as much, as for the minimum boil-off losses.
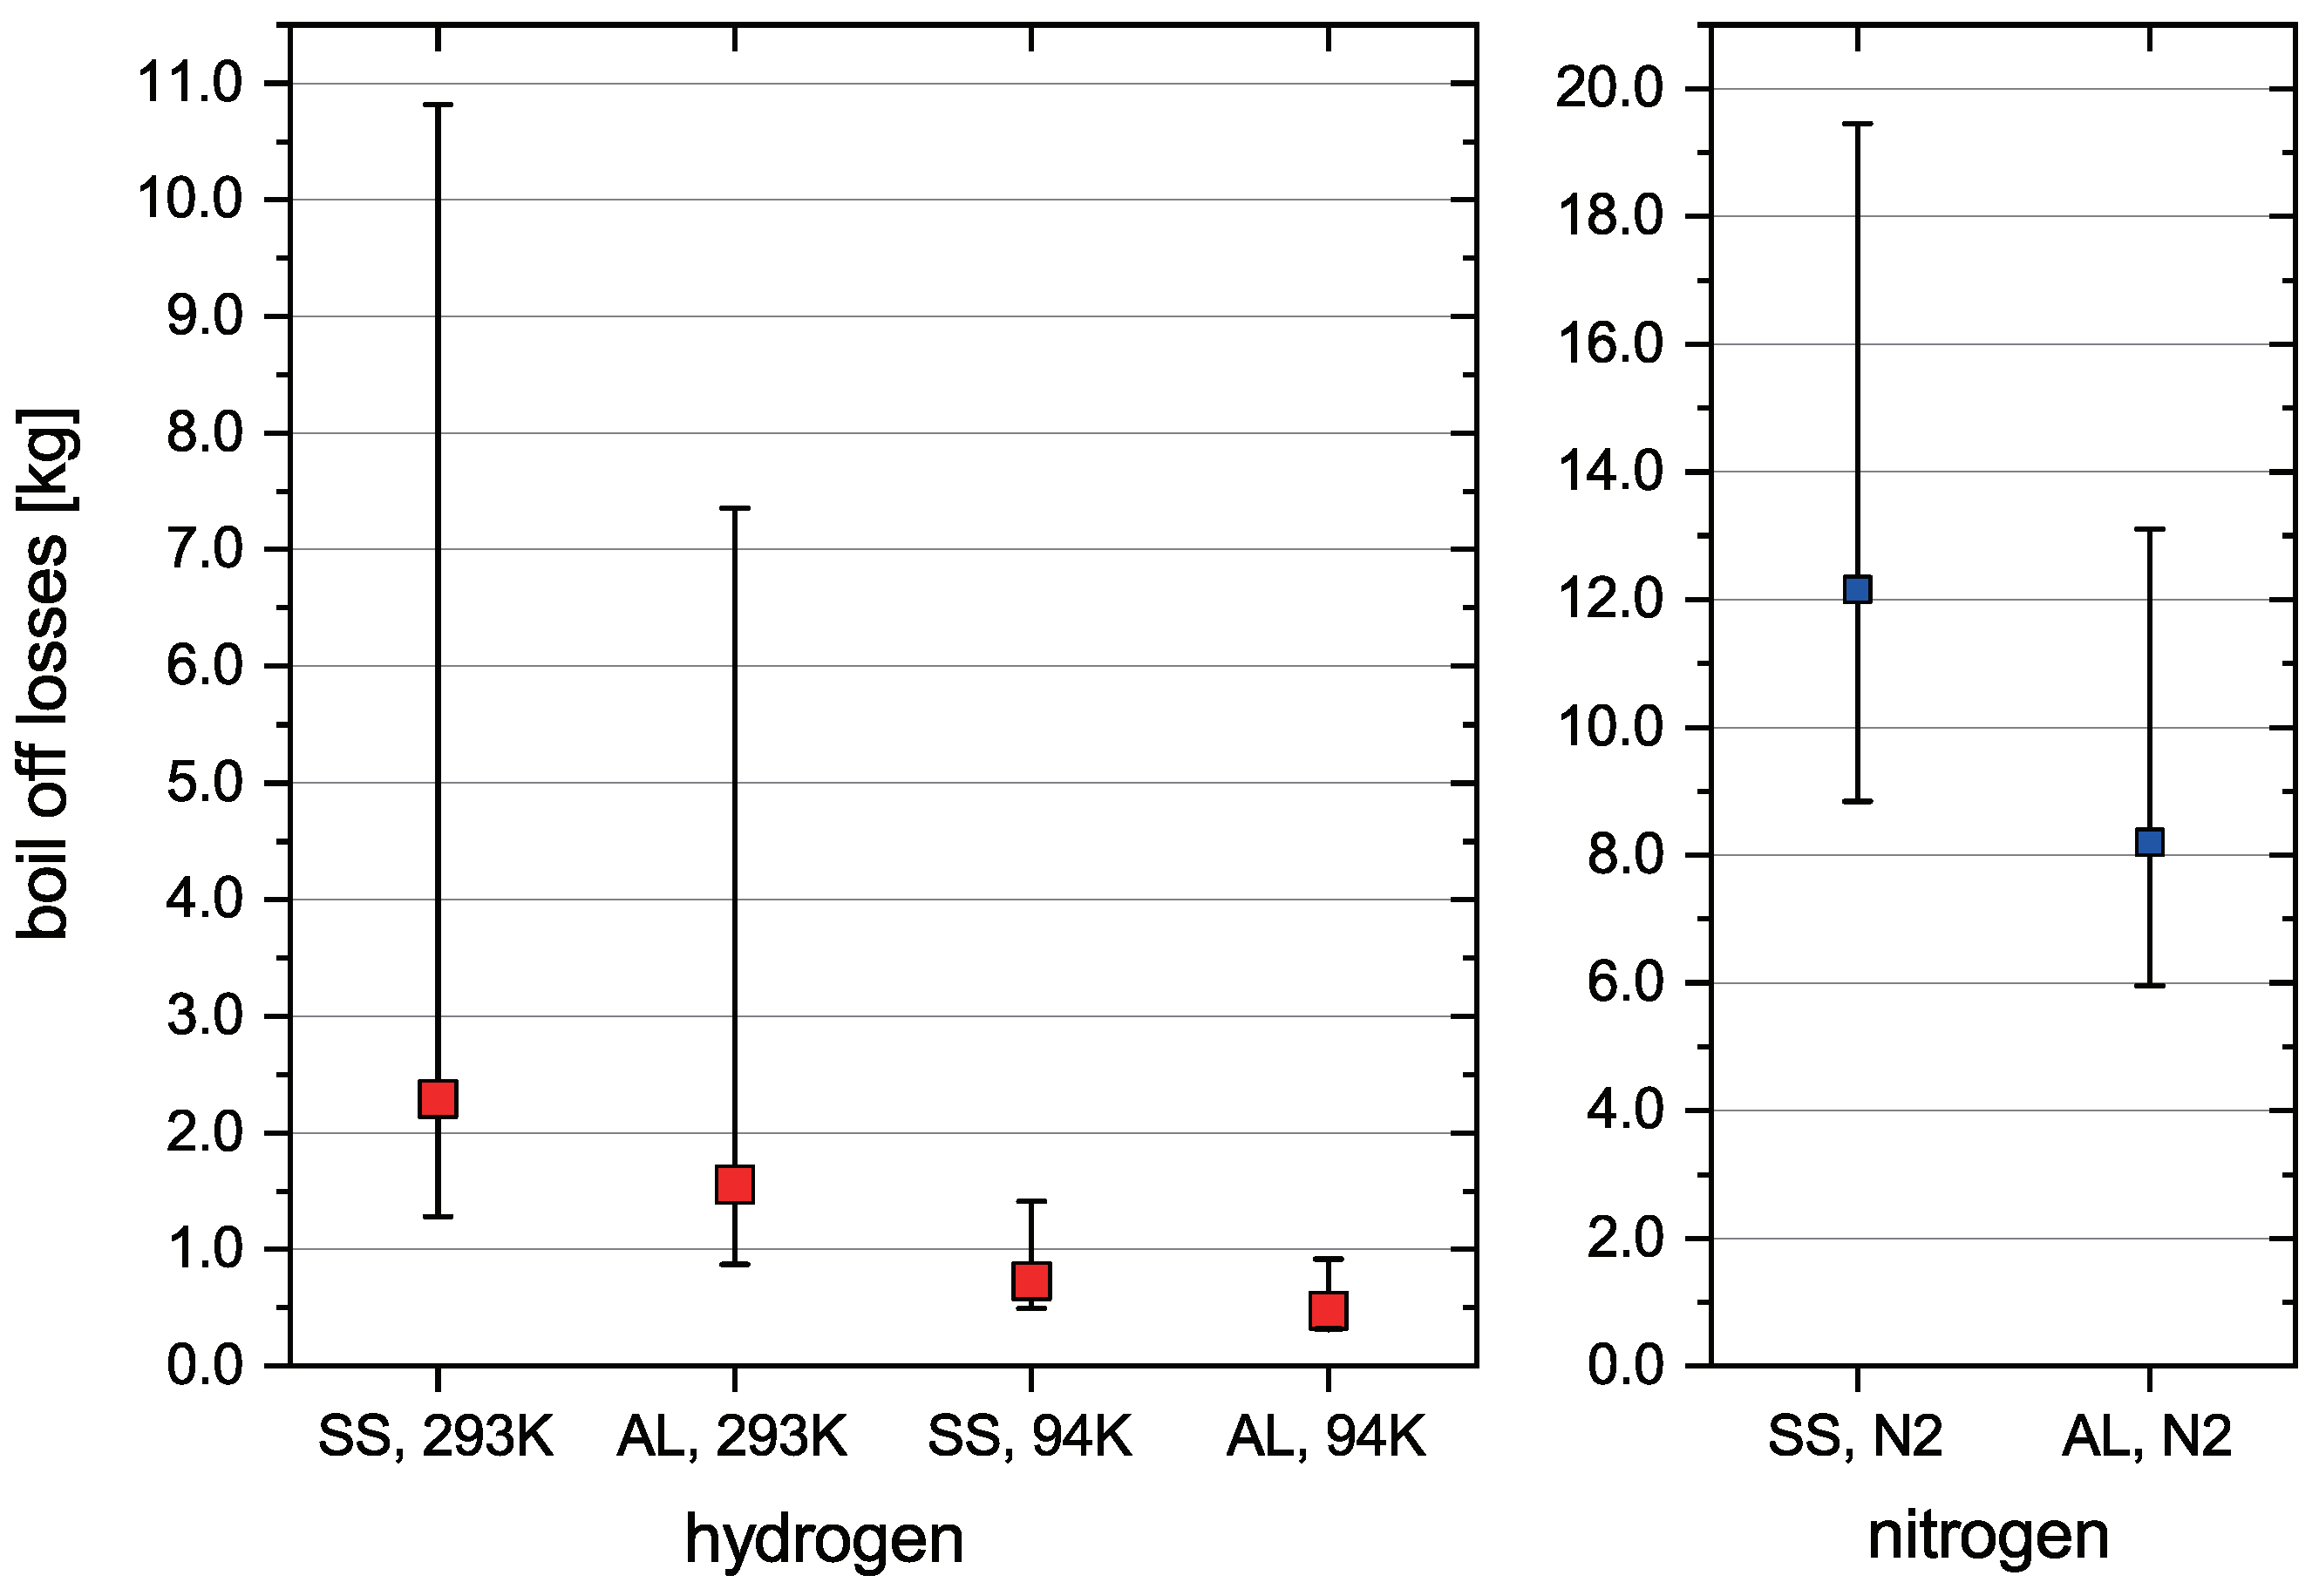
Two different cryotank wall materials are considered. These are the stainless steel alloy 304L (SS) and the aluminium alloy 5083-O (AL). Both are chosen for their satisfactory properties at cryogenic temperatures. Materials data from the National Institute of Standards and Technology (NIST) is used. To compare how much cooling the cryotank with liquid nitrogen reduces boil-off losses, these are calculated for two cases. Either the cryotank is not pre-cooled and thus has an initial temperature of 293 K or it is pre-cooled with
, which results in an initial temperature of 94 K. This is the boiling point of
at 5 bar. Additionally, the required
mass to pre-cool the cryotank is calculated the same way as the hydrogen boil-off losses and presented in
Figure 4. The insulation thickness of 50 mm is chosen to reduce boil-off due to heat flux from the environment after the tank is full. The temperature difference of the insulation before fuelling and after fuelling
is approximated by calculating the mean temperature of the insulation before fuelling and after the fuelling process for the standard fuelling process and the pre-cooling method. The results are listed in
Table 3.
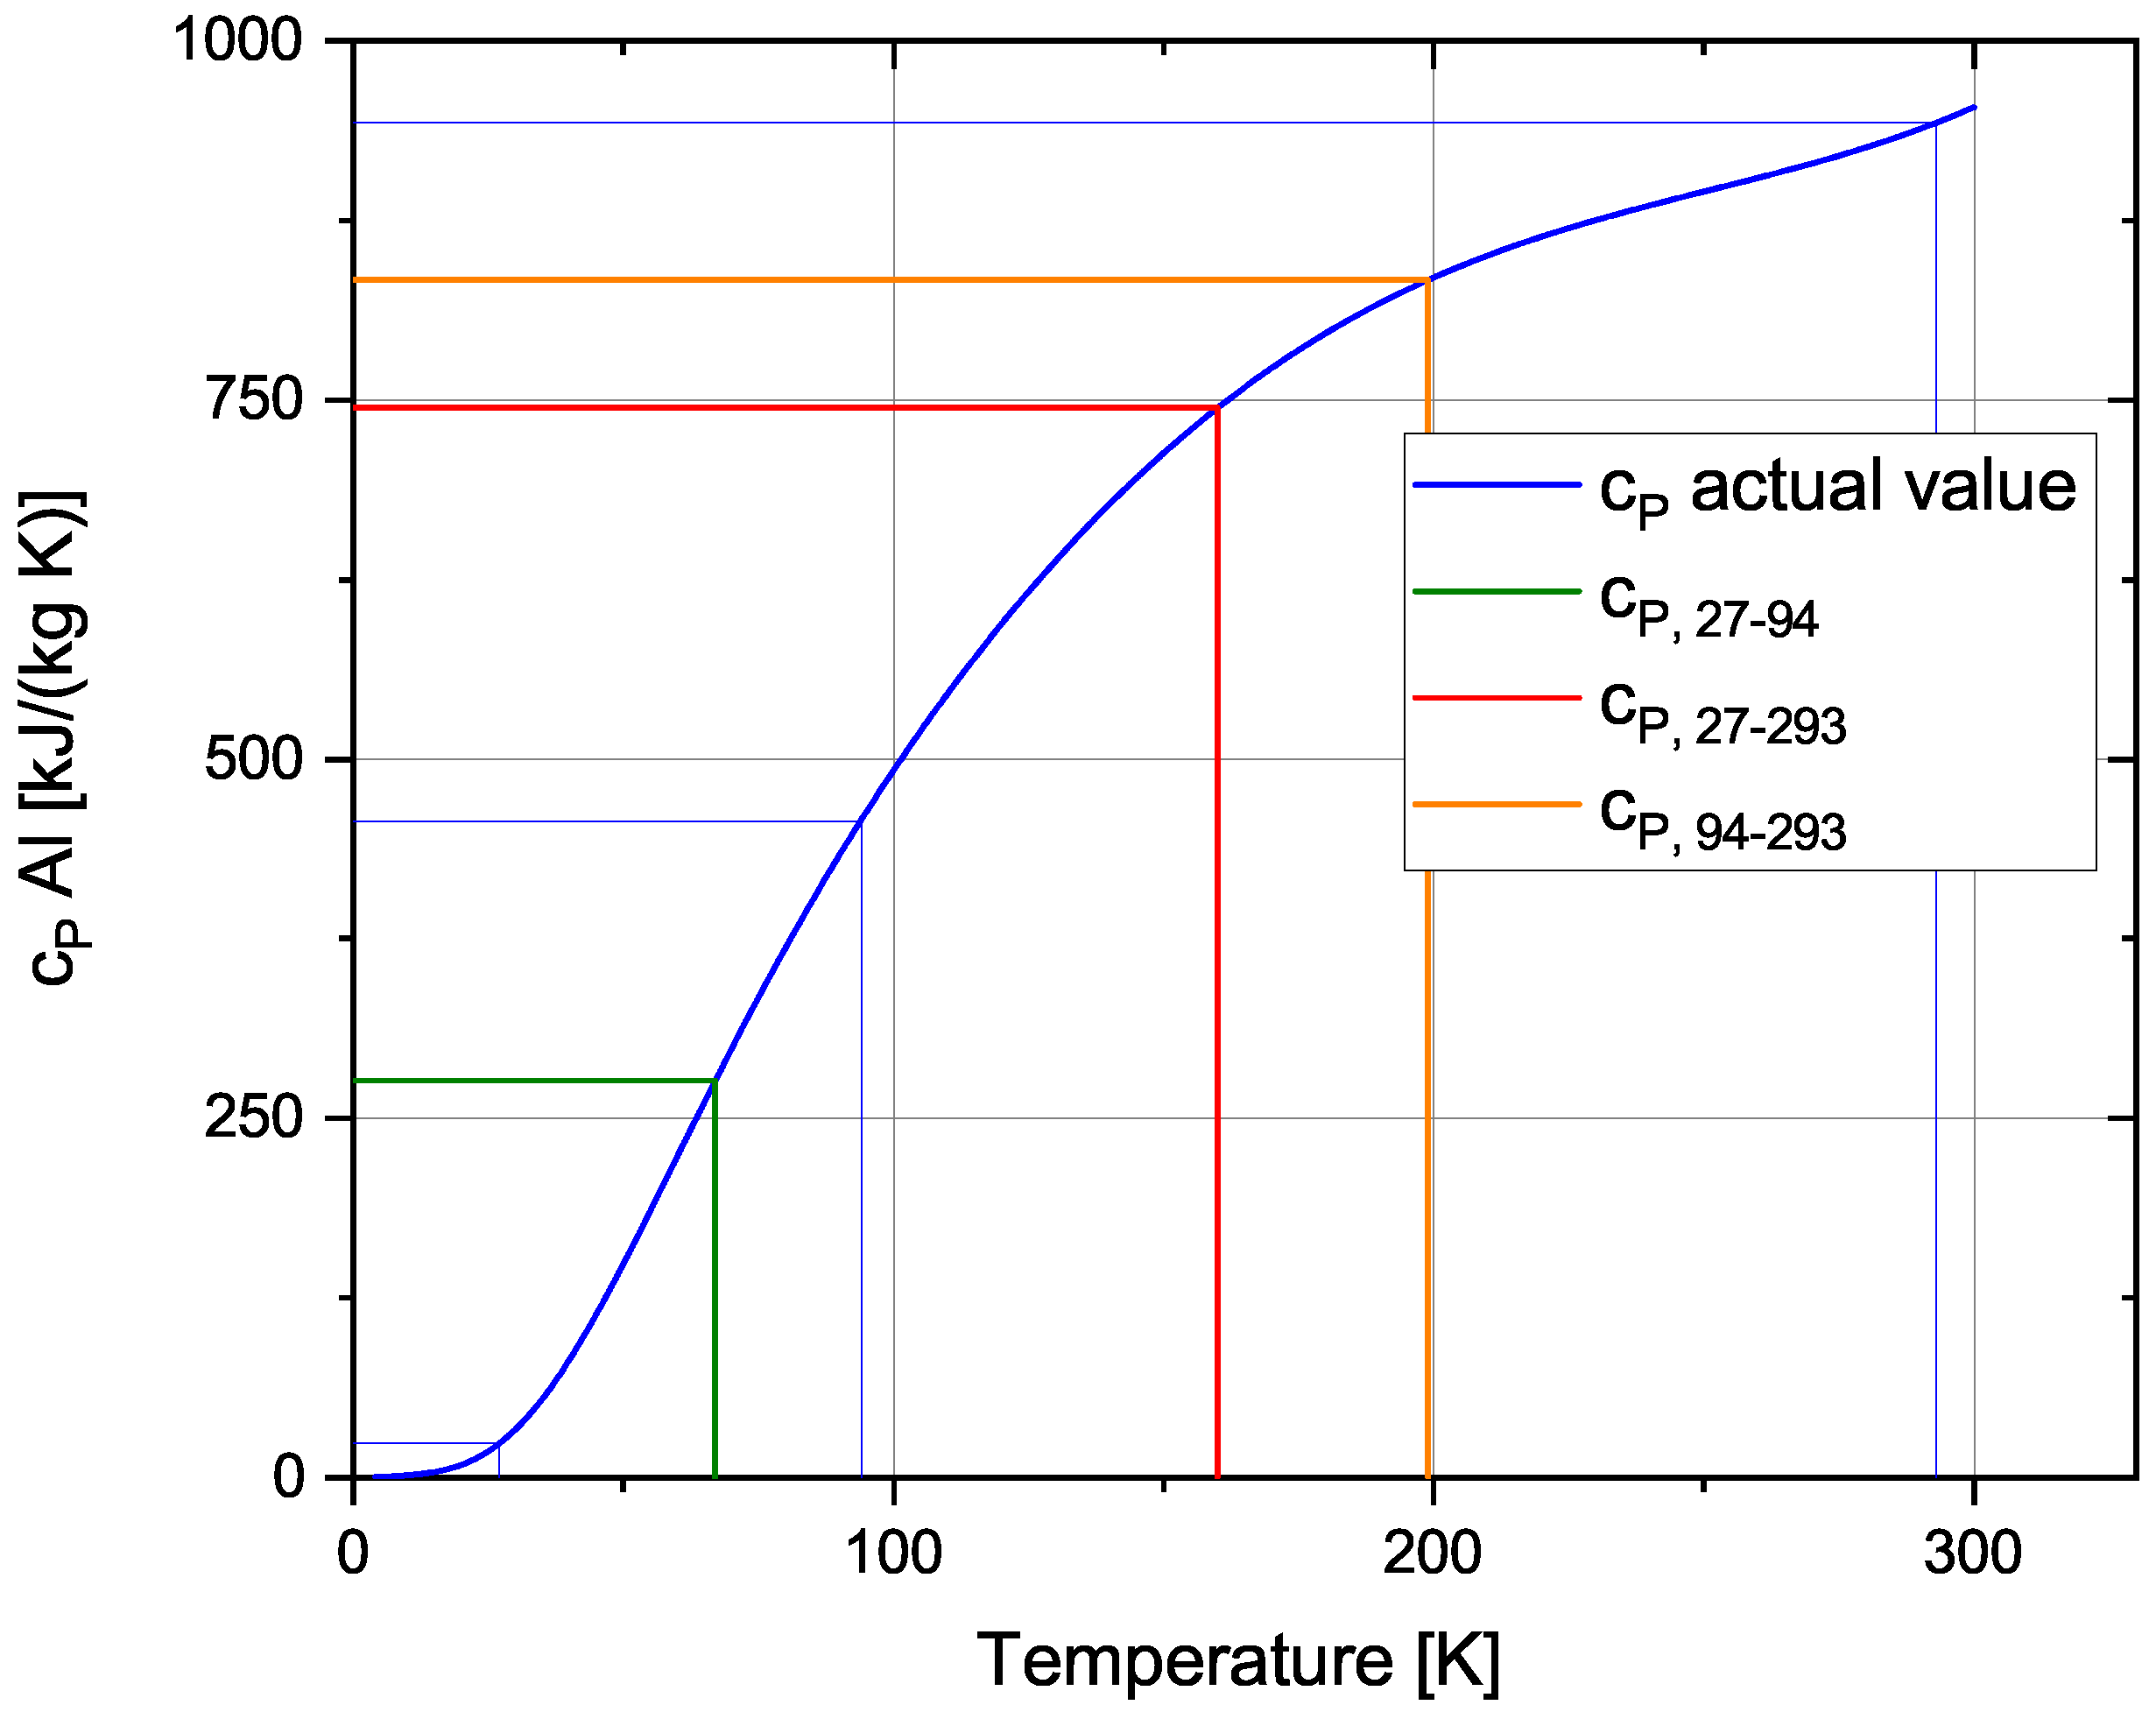
The heat capacities
of steel, aluminium, hydrogen and nitrogen are dependant on their temperature, however for the simplified analytical validation average heat capacities
are used in the calculations. These values are chosen depending on the starting and final temperature of the material. For aluminium, this process is shown in
Figure 5. For the temperature interval 27–94 K (green line in
Figure 5), the heat capacity is much lower than for the other intervals.
The values chosen for each temperature interval are displayed in
Table 4.


