Article

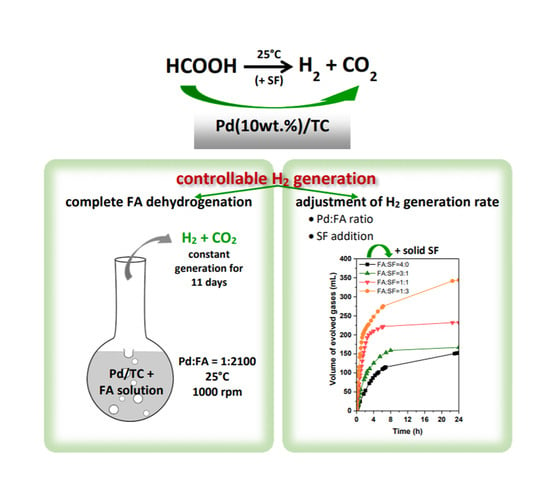
Controllable H2 Generation by Formic Acid Decomposition on a Novel Pd/Templated Carbon Catalyst

National Institute for Research & Development of Isotopic and Molecular Technologies—INCDTIM, 67-103 Donat Str., 400293 Cluj-Napoca, Romania
*
Authors to whom correspondence should be addressed.
Hydrogen 2020, 1(1), 22-37; https://doi.org/10.3390/hydrogen1010003
Submission received: 30 September 2020 / Revised: 5 November 2020 / Accepted: 10 November 2020 / Published: 12 November 2020

Abstract

:
A novel Pd/templated carbon catalyst (Pd/TC) was developed, characterized, and tested in the dehydrogenation of formic acid (FA) under mild conditions, with the possibility to control the H2 generation rate, in the absence or presence of HCOONa (SF), by adjusting the Pd:FA and/or FA:SF ratios. The characterization results of the templated carbon obtained by the chemical vapor deposition of acetylene on NaY zeolite revealed different structural and morphological properties compared to other C-based supports. Therefore, it was expected to induce a different catalytic behavior for the Pd/TC catalyst. Indeed, the TC-supported Pd catalyst exhibited superior activity in the decomposition of FA, even at room temperature, with turnover frequencies (TOFs) of up to 143.7 and 218.8 h−1 at 60 °C. The H2 generation rate increased with an increasing temperature, while the H2 yield increased with a decreasing FA concentration. Constant generation of gaseous flow (H2 + CO2) was achieved for 11 days, by the complete dehydrogenation of FA at room temperature using a 2 M FA solution and Pd:FA = 1:2100. The presence of SF in the reaction medium significantly enhanced the H2 generation rate (535 h−1 for FA:SF = 3:1 and 60 °C).

Graphical Abstract

1. Introduction

In the quest for environmentally friendly energy sources, hydrogen is regarded as the most promising energy carrier, considering that its combustion leads to the formation of the benign water molecule [1,2]. However, issues such as efficient hydrogen production or effective hydrogen storage and safe transportation have to be addressed, in order to reach the goal of a hydrogen-based economy [2,3,4,5]. In this context, there is a tremendous research interest towards the development of appropriate storage solutions which can allow the controllable and efficient generation of hydrogen under mild conditions (near ambient temperatures and atmospheric pressure) [6,7]. Hydrogen storage may be achieved by either physical or chemical methods [2,8]. Physical storage deals with the compression of molecular hydrogen at low temperatures and high pressures [1,2], or with its adsorption on high surface area materials, such as carbon-based materials [2,8], zeolites, or metal–organic frameworks [9,10,11]. On the other hand, chemical storage methods rely on the storage of hydrogen in its chemically bonded form in compounds with a high hydrogen content, such as complex hydrides (boronates and alanates); covalent hydrides (AlH3, BH3NH3, or SiH3); ionic hydrides (alkali and alkali earth metal hydrides); and liquid organic hydrogen carriers (LOHCs), such as formic acid (HCOOH), hydrazine, heterocyclic aromatic hydrocarbons, and alcohols [2,8,12,13]. Among these hydrogen carriers, formic acid (FA), which is a major product of biomass processing [14,15], is regarded as a promising H2 storage compound due to its high hydrogen content (4.4 wt.% and 53 g/L), high energy density (seven times superior to that of commercial lithium ion batteries) [2], low toxicity, and high stability at room temperature [14], compared to other LOHCs [2]. Ideally, FA could release the chemically stored H2 by catalytic dehydrogenation, for use in fuel cells, while the catalytic hydrogenation of waste CO2 could regenerate FA as an H2 carrier [4,14]. Therefore, the CO2–HCOOH hydrogen storage cycle becomes attractive as a sustainable and reversible energy storage cycle [14,16].
Despite the theoretically attractive concept, the most problematic issue of the CO2–HCOOH hydrogen storage cycle is the design of efficient catalysts which favor the release of H2 under mild conditions (near ambient conditions), without the formation of poisonous CO for fuel cell technology. The decomposition of FA occurs via the dehydrogenation pathway (Equation (1)), or the undesired dehydration pathway (Equation (2)) [3,17]:
HCOOH   ( l )     H 2   ( g )   +   CO 2   ( g ) ,             Δ G 298   K   =   35 . 0   kJ / mol ,
HCOOH   ( l )     H 2 O ( l )   +   CO   ( g ) ,             Δ G 298   K   =   14 . 9   kJ / mol .
The decomposition route followed by FA strongly depends on the employed catalyst, as well as the reaction conditions (formic acid concentration, temperature, and pH) [3]. Catalytic approaches for the dehydrogenation of formic acid regard both homogeneous and heterogeneous systems. Although numerous homogeneous catalysts have been developed, with good to excellent activities in the CO-free decomposition of FA, the most important disadvantage of these systems is the difficulty of separating and recovering the employed catalyst [5,18]. In contrast, heterogeneous catalytic systems allow facile catalyst recovery and reusability [19], but are characterized by a lower H2 selectivity due to the undesired dehydration pathway, elevated temperatures, and the utilization of added formate salts (e.g., HCOONa, HCOONH3, etc.) [5,19]. Therefore, the development of active heterogeneous catalysts for the dehydrogenation of FA under mild conditions has become an important scientific and technological target. Heterogeneous catalysts are generally supported metal ones, for both vapor and liquid phase FA dehydrogenation systems [2]. Noble metals such as Pt, Au, and Pd are the most active ones, and are employed either in monometallic systems (Pd/C [3,5,6,13,20,21], Pd/mpg-C3N4 [4], Pd/CeO2 [15], Pd/rGO [22], Au/C, Au/TiO2 [20], Au/ZrO2 [23,24], Au/Al2O3, Au/La2O3, Au/MgO [23], Au/CeO2 [23,25], Au/ZSM-5 [25], Au/rGO [26], etc.), or multimetallic ones (Ag-Pd core shell [7], AgPd/graphene [17], Pd-Au/C, Pd-Ag/C [27], PdAu/rGO [22], Au-Pd/ED-MIL-101 [28], AgPd/MIL-101 [29], PdAu-MnOx/N-SiO2 [19], NiAuPd/C [18], CoAuPd/C [14], PtRuBiOx/C [30], etc.). The importance of alloying Pd with different metals has also been emphasized for multimetallic systems [31]. Generally, these heterogeneous catalysts are used for low concentrations of formic acid solutions, which indicates a low hydrogen storage density [13], or use a very low FA to Pd ratio, which make these systems inadequate for final applications.
The aim of this paper is to report the synthesis of a novel Pd/templated carbon catalyst (Pd/TC) and its activity in CO-free FA decomposition under mild conditions, with the possibility to control the hydrogen generation rate in the absence or presence of added formate salts (HCOONa). To the best of our knowledge, there is no report on the use of templated carbon as a nanostructured catalytic support for the dehydrogenation of formic acid. Templated carbon obtained by the chemical vapor deposition (CVD) of acetylene on NaY zeolite shows different structural and morphological properties when compared to other C-based supports, which are expected to induce different catalytic behavior of the TC-supported Pd catalyst. Catalytic tests aimed at unfolding the influence of several reaction parameters on the activity of the Pd/TC catalyst, such as the formic acid concentration, reaction temperature, and HCOONa addition to the system, were conducted. The catalyst lifetime and possibility to obtain complete formic acid dehydrogenation in a controllable way were also investigated.

2. Experimental Section

2.1. Materials

All starting materials and solvents were obtained from commercial suppliers and used without further purification. Zeolite Y (Na-form, SiO2:Al2O3 = 5.1:1) was purchased from Alfa Aersar (Karlsruhe, Germany), HF (p.a., 50%) from Fluka (Seelze, Germany), and PdCl2 (59% Pd) from Merck (Darmstadt, Germany). Gasses (C2H2 in N2, H2, and Ar) were purchased from Linde Gaz Romania (Timisoara, Romania).

2.2. Catalyst Preparation

Two preparation sequences were followed, in order to obtain the templated carbon-supported Pd catalyst, with a target metal concentration of 10 wt.%. In the first step, the nanostructured carbon was synthesized by dry chemical vapor deposition (CVD), using zeolite as a template [32]. Briefly, two successive acetylene (5 vol.% in N2) CVDs were performed over zeolite Y (Na-form, SiO2:Al2O3 = 5.1:1) in a horizontal quartz reactor (i.d. 20 mm): One at 600 °C for 4 h and the other at 700 °C for 1 h. The acetylene gas mixture was passed through the reactor at a total flow rate of 190 mL (STP)/min. Finally, heat-treatment at 900 °C for 1 h was performed. Removal of the zeolite template was conducted by successive HF washing. In the second step, Pd was deposited on the nanostructured templated carbon by the wet impregnation method using an aqueous solution of an appropriate amount of PdCl2, in order to obtain a 10 wt.% target concentration of metal on the support. After impregnation, the catalyst was dried at room temperature overnight, while reduction was performed by increasing the temperature in Ar flow up to 250 °C, followed by actual reduction in H2 flow for 2 h, at this temperature.

2.3. Catalyst Characterization

The effective palladium content of the catalyst was determined by inductively coupled plasma mass spectrometry (ICP-MS) using a Perkin Elmer ELAN DRC spectrometer (Waltham, MA, USA). Before analysis, the sample was treated with 1 mL of aqua regia (3:1 HCl:HNO3, v:v) and diluted to 50 mL with ultra-pure de-ionized water.
Specific surface areas of both the nanostructured C support and Pd catalyst were determined by N2 adsorption–desorption at −196 °C, following the standard BET procedure (Sorptomatic 1990, Thermo Electron, Milan, Italy). Prior to N2 adsorption, each sample was degassed under vacuum at 200 °C, for 5 h.
X–ray powder diffraction (XRD) measurements were performed on a Bruker D8 Advanced Diffractometer (Billerica, MA, USA) with CuKα1 radiation and a Ge monochromator, working at 40 kV and 40 mA, with a step–scanning mode of Δ2θ = 0.01°/s in the angle range 2θ = 3–85°.
Thermogravimetric analysis (TGA) was performed in air flow (100 mL/min) using a temperature rate of 10 °C/min in the range of 25–1000 °C (SDT Q600, TA Instruments, New Castle, DE, USA).
Morphological characterization of the catalyst was performed by transmission electron microscopy (TEM) and scanning electron microscopy (SEM) using a HITACHI HD–2700 STEM microscope (Hitachi, Tokyo, Japan) operating at 200 kV. The sizes of Pd particles were measured to determine the particle size distribution and average particle size (>500 particles). Prior to TEM analysis, the catalyst sample was homogeneously dispersed by sonication (3 min) in ethanol.

2.4. Catalytic Activity Tests

Catalytic activity tests were carried out under ambient atmosphere of air using a simple experimental set-up formed by a round bottom flask, thermostated by a silicon oil bath, and connected to a gas burette, in order to quantify the volume of evolved gases. Typically, 20 mg of the Pd/TC catalyst was placed inside the flask, together with a Teflon coated magnetic bar, while the reaction was considered started after the addition of the selected volume of formic acid solution (FA, different molar concentrations) and stirring at 1000 rpm. A reflux condenser was used in order to avoid evaporation of the reaction mixture (especially when performing the reaction at higher temperatures). The influence of several parameters on the catalytic activity of the Pd/TC catalyst in the dehydrogenation of formic acid was investigated: The concentration of formic acid solution (the Pd:FA ratio); temperature; and formic acid to sodium formate ratio (FA:SF). Reusability and stability tests of the Pd/TC catalyst were also performed at room temperature. For each catalytic test, the volume of evolved gases was measured at ambient temperature, while calculations of reaction parameters (FA conversion, H2 yield, and turnover frequencies (TOFs)) were carried out by using corrected gas volumes at 25 °C. Turnover frequencies (TOFs) were calculated at low conversion values (<15%), on the basis of total metal atoms in the catalyst sample, using the following equation:
T O F = p V H 2 R T n P d t ,   ( h 1 ) ,
where p is the atmospheric pressure, VH2 is the released hydrogen volume, R is the gas constant, T is the temperature (298 K), nPd is the number of Pd moles in the catalyst sample, and t is the reaction time.
A qualitative analysis of the evolved gases was carried out by a quadrupole mass spectrometer (QMS, Pfeiffer Vacuum, Germany) connected to the experimental set-up. In this particular case, Ar was used as the carrier gas (20 mL/min), in order to collect the evolved gases during formic acid decomposition. The experimental procedure consisted of the following steps: The catalyst sample was placed in a three-neck round bottom flask, together with a Teflon coated magnetic bar; Ar was passed over the catalyst until no air was detectable by MS; and then, the selected amount of formic acid solution was injected through a septum over the catalyst. The reaction was considered started after turning on the magnetic stirring.

3. Results and Discussion

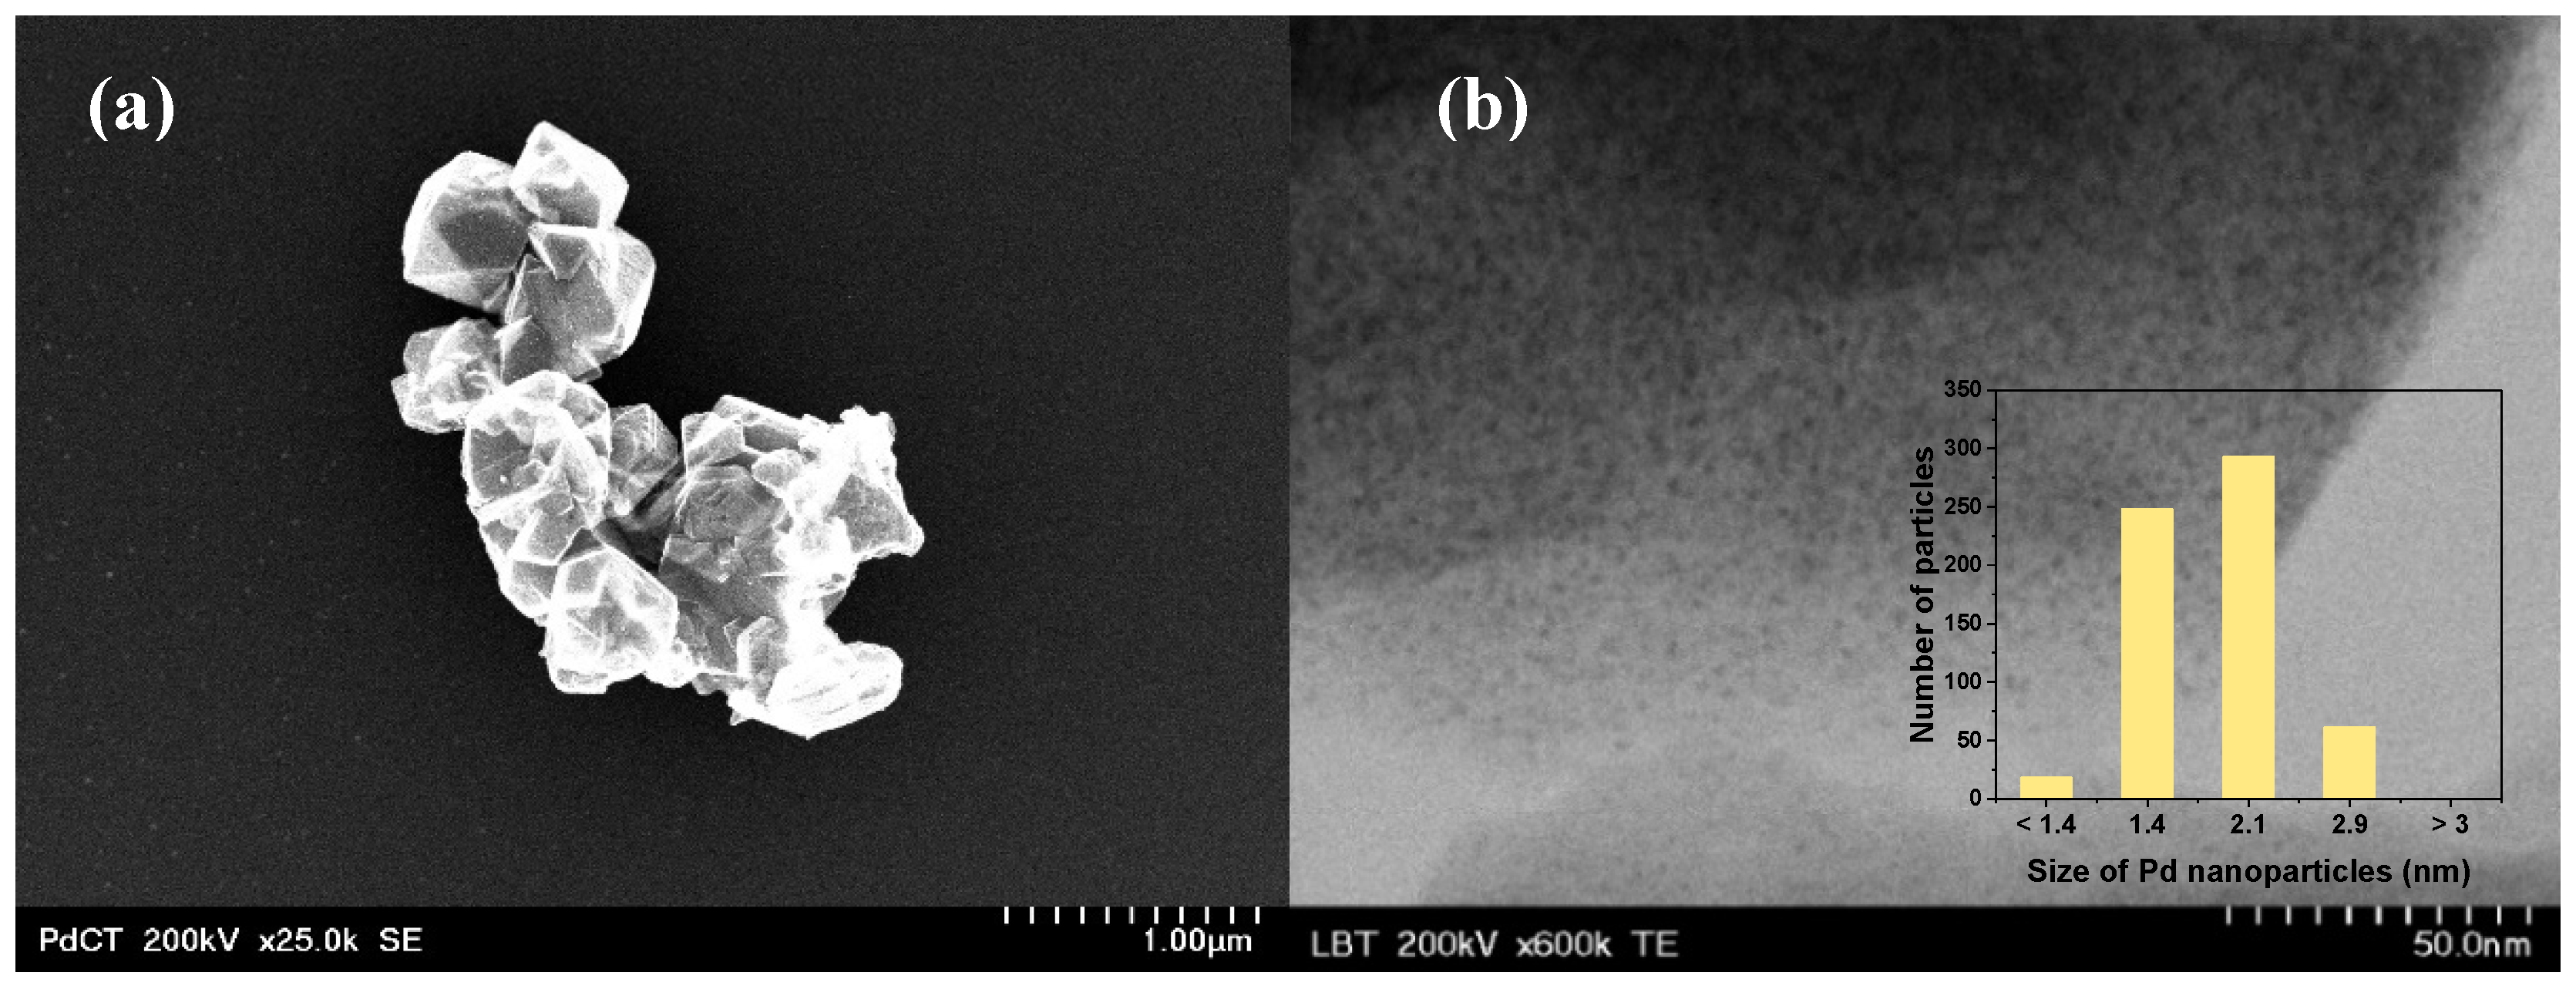
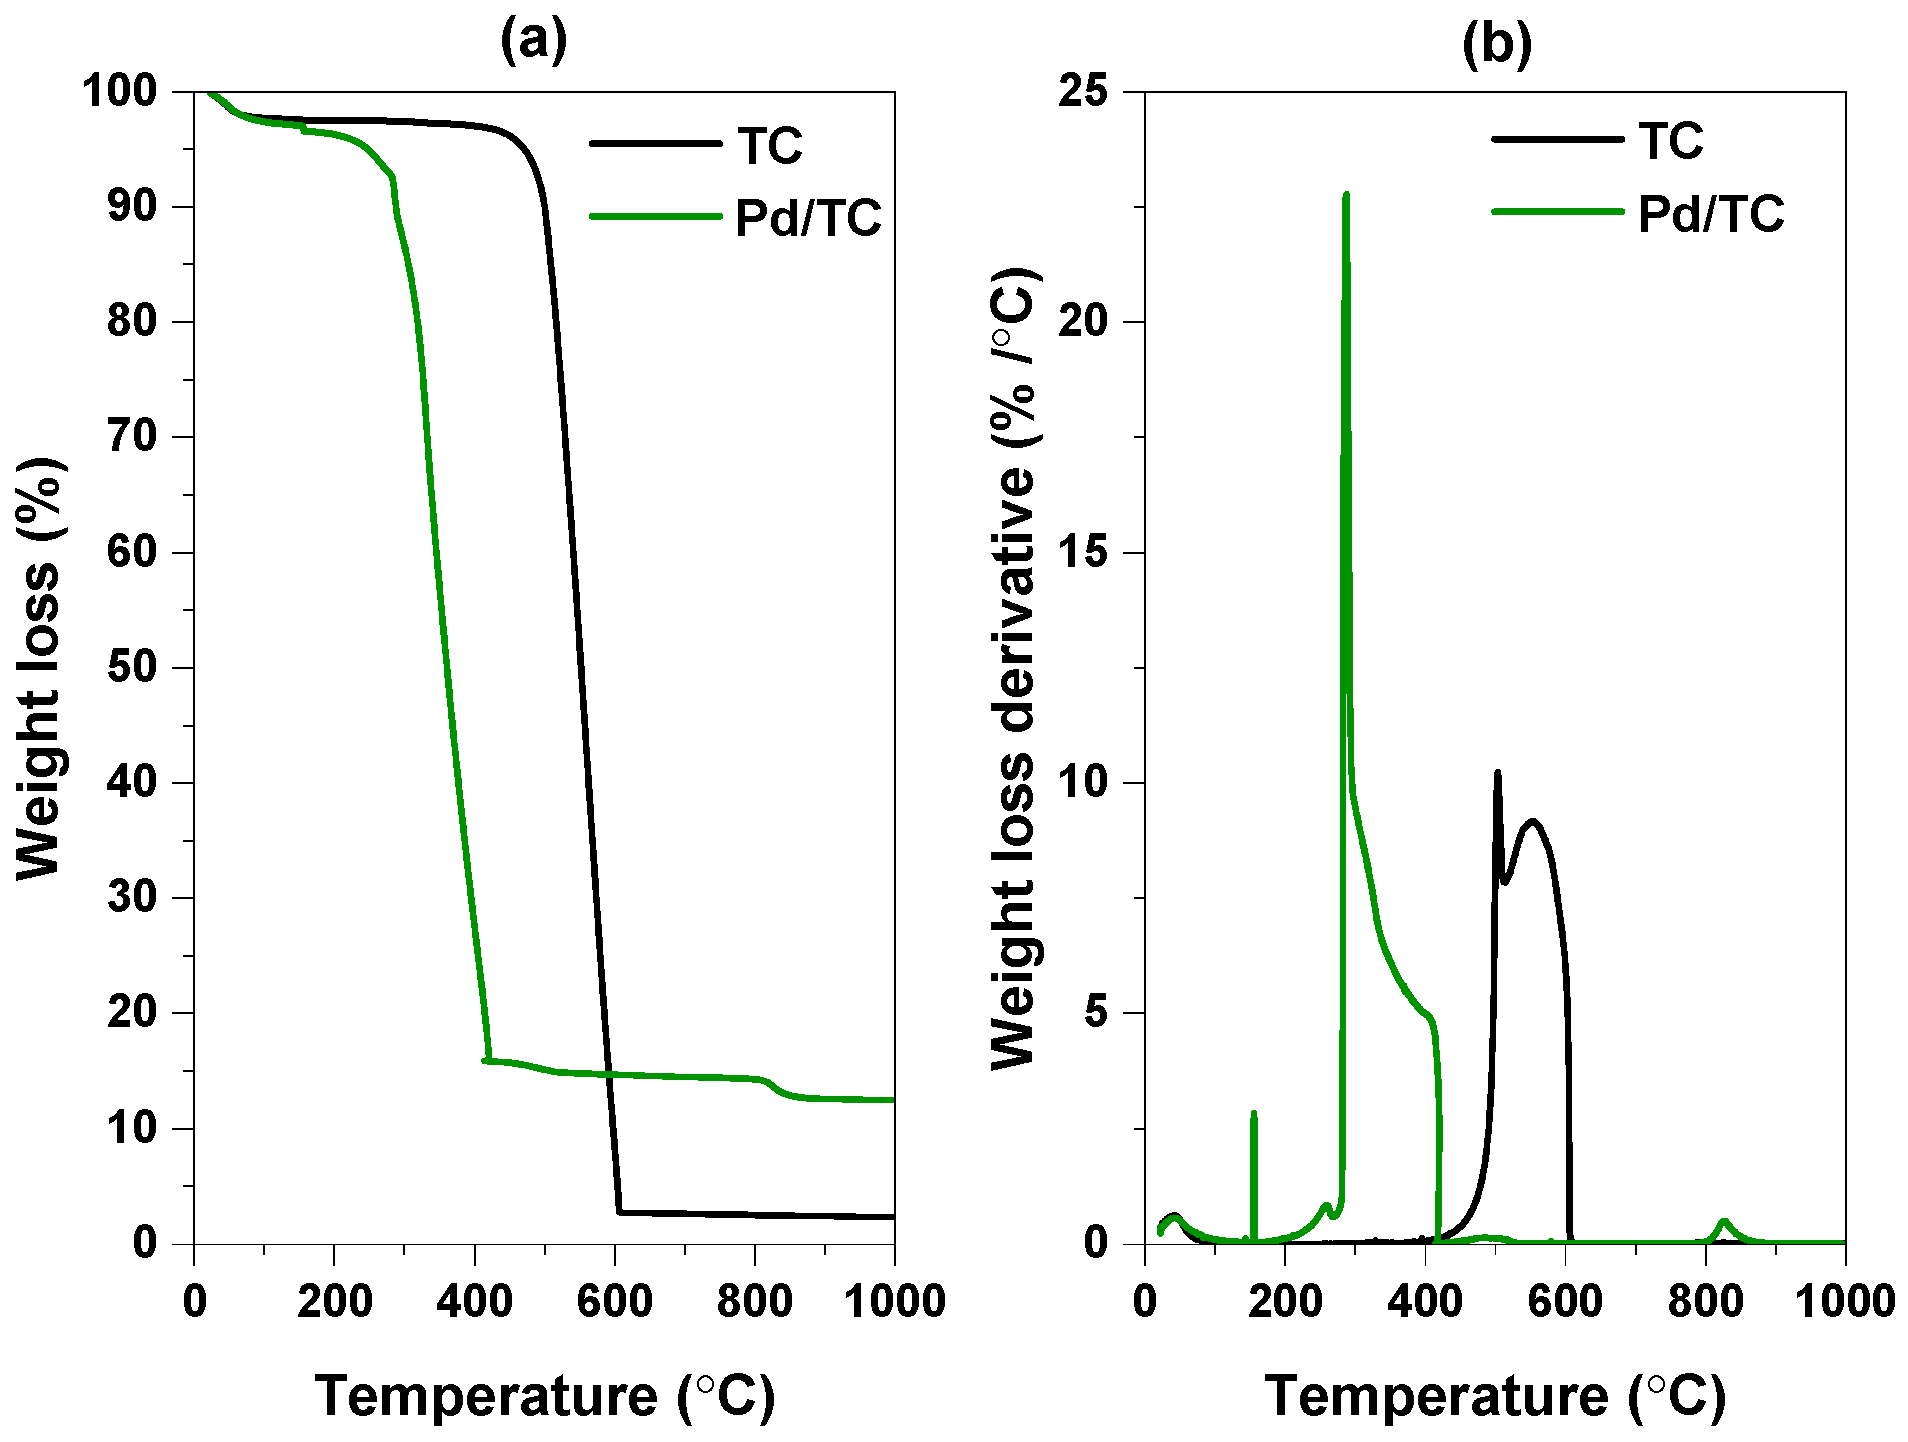
3.1. Characterization Results

The actual Pd concentration on the templated carbon catalyst determined by ICP-MS was 9.75 wt.%, very close to the target concentration.
The N2 adsorption–desorption isotherms obtained for both the nanostructured templated carbon and Pd/TC catalyst are of the Langmuir type, which is characteristic of microporous materials (see Figure S1 in Supplementary Materials). Indeed, the average pore dimensions for both samples were below 2 nm, being slightly smaller for the supported Pd catalyst, most probably due to metal deposition. With respect to the specific surface area, the impregnation of TC by Pd led to a decrease from 1386 to 965 m2/g, for the TC support and Pd/TC catalyst, respectively. Consequently, the specific pore volume decreased to less than half, from 1.67 for TC to 0.73 cm3/g for the Pd catalyst.
The X–ray powder diffraction pattern revealed the existence of two types of carbon in the TC support obtained by filling the zeolite channels, as well as by C deposition on the external surface of the zeolite particles (Figure S2 in Supplementary Materials). The presence of a shoulder around 6°, originating from the (111) planes of the zeolite Y crystal proves the existence of a carbon structural regularity with a periodicity of about 1.4 nm [33]. There was another broad peak at around 25°, which can be ascribed to the carbon layers with a stacking structure, such as graphite deposits on the external surface of the zeolite [33]. The presence of Pd in the Pd/TC catalyst was evidenced by a broad and low amplitude peak situated at 39.9° (ICDD card 89-4897), suggesting the deposition of small Pd particles (Figure S2 in Supplementary Materials). Indeed, the TEM image presented in Figure 1b, as well as the EDS mapping in Figure S3 in Supplementary Materials, confirm the uniform distribution of small Pd nanoparticles (around 2 nm and below) over the TC support. On the other hand, the well-shaped particles revealed by the SEM image in Figure 1a prove the existence of the templated carbon structure obtained by filling the zeolite channels [33], consistent with the XRD data (Figure S2 in Supplementary Materials).
Thermogravimetric analysis (TGA) demonstrated the strong influence of Pd on the burning behavior of the nanostructured C support (Figure 2a). The TC support was completely burned at temperatures between 500 and 600 °C, while in the case of Pd/TC, this combustion temperature decreased significantly up to 290 °C, due to the catalytic contribution of the Pd nanoparticles. On the other hand, the approximate 10% weight difference between the TC support and Pd catalyst confirms the target concentration of the metal on the support, which is also consistent with the average concentration of 9.4 wt.% Pd estimated from the EDX spectra (Figure S4 in Supplementary Materials) and the concentration determined by ICP-MS. Moreover, the derivative curves (DTG) presented in Figure 2b reveal the existence of different forms of C, with different crystallinity degrees, consistent with the XRD data.

3.2. Catalytic Activity Results

The catalytic performance of Pd/TC was investigated quantitatively by monitoring the total volume of evolved gases under the influence of several parameters, such as the concentration of formic acid solution, Pd:FA ratio, temperature, and formic acid to sodium formate ratio (FA:SF), as well as qualitatively by mass spectrometry.

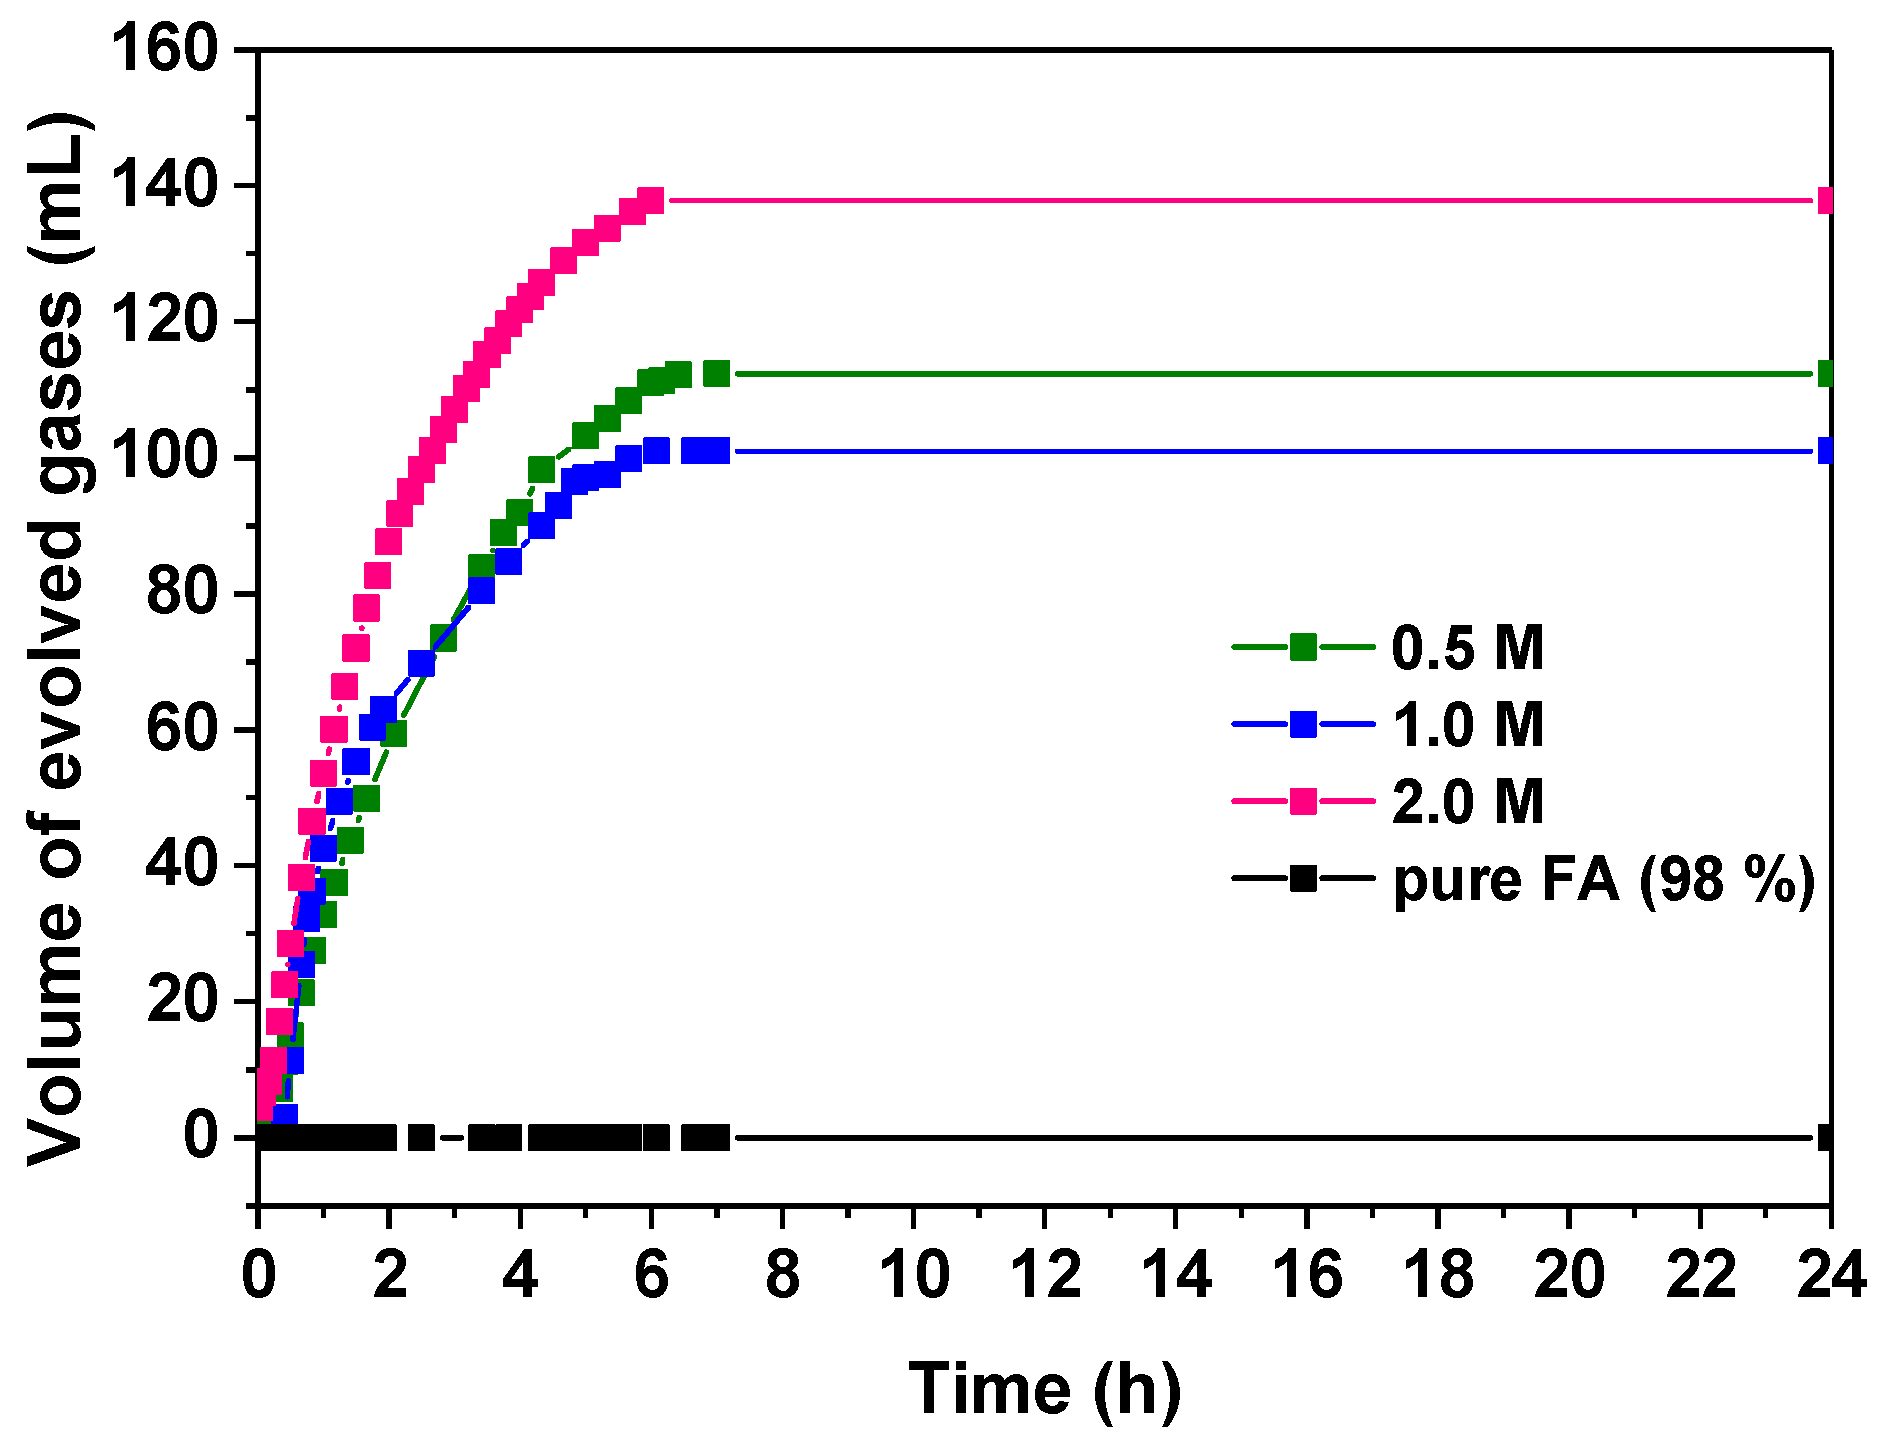
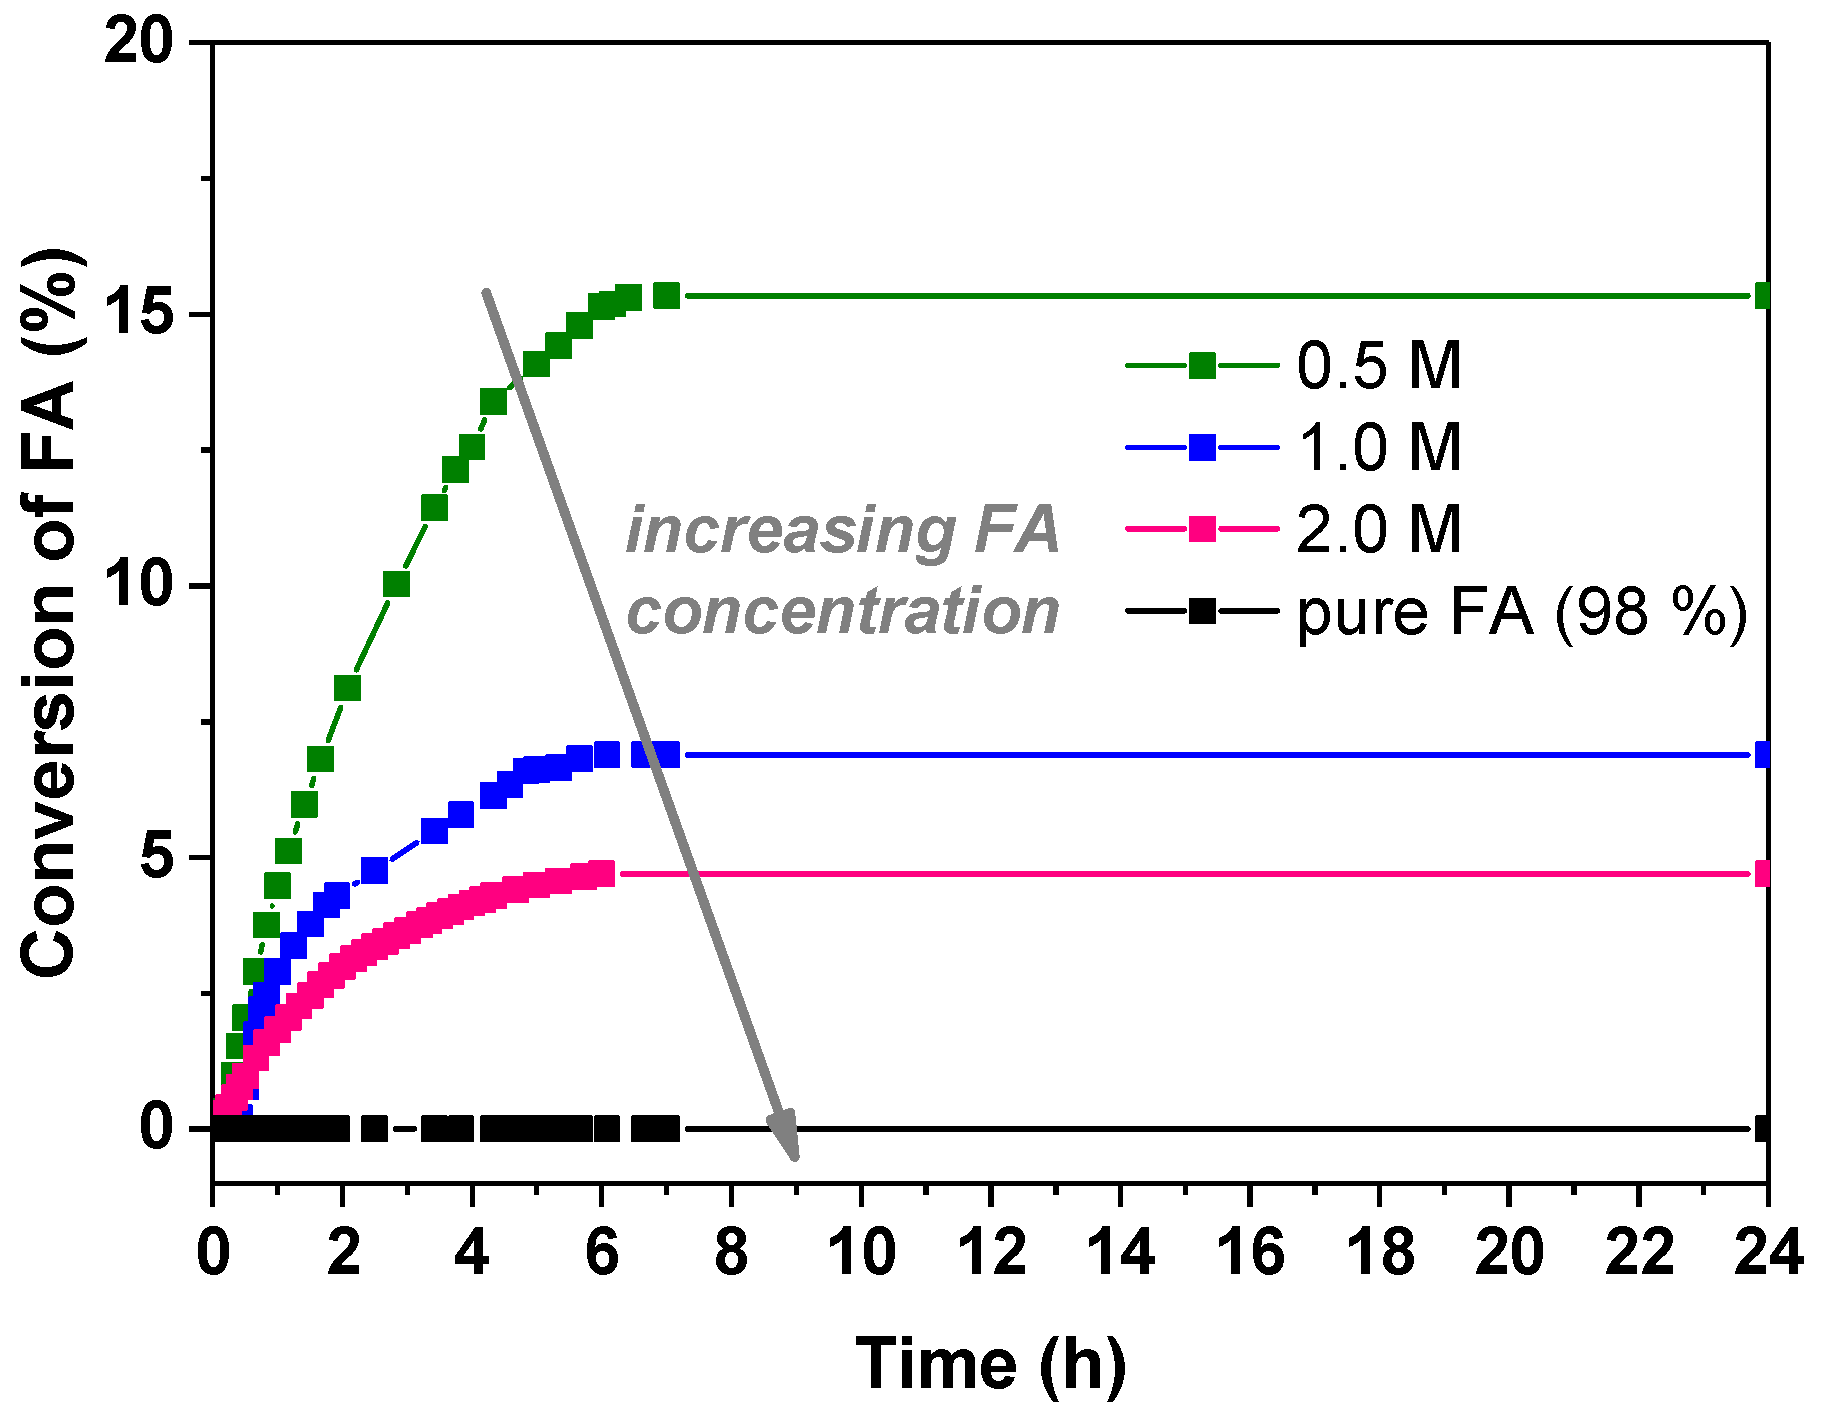
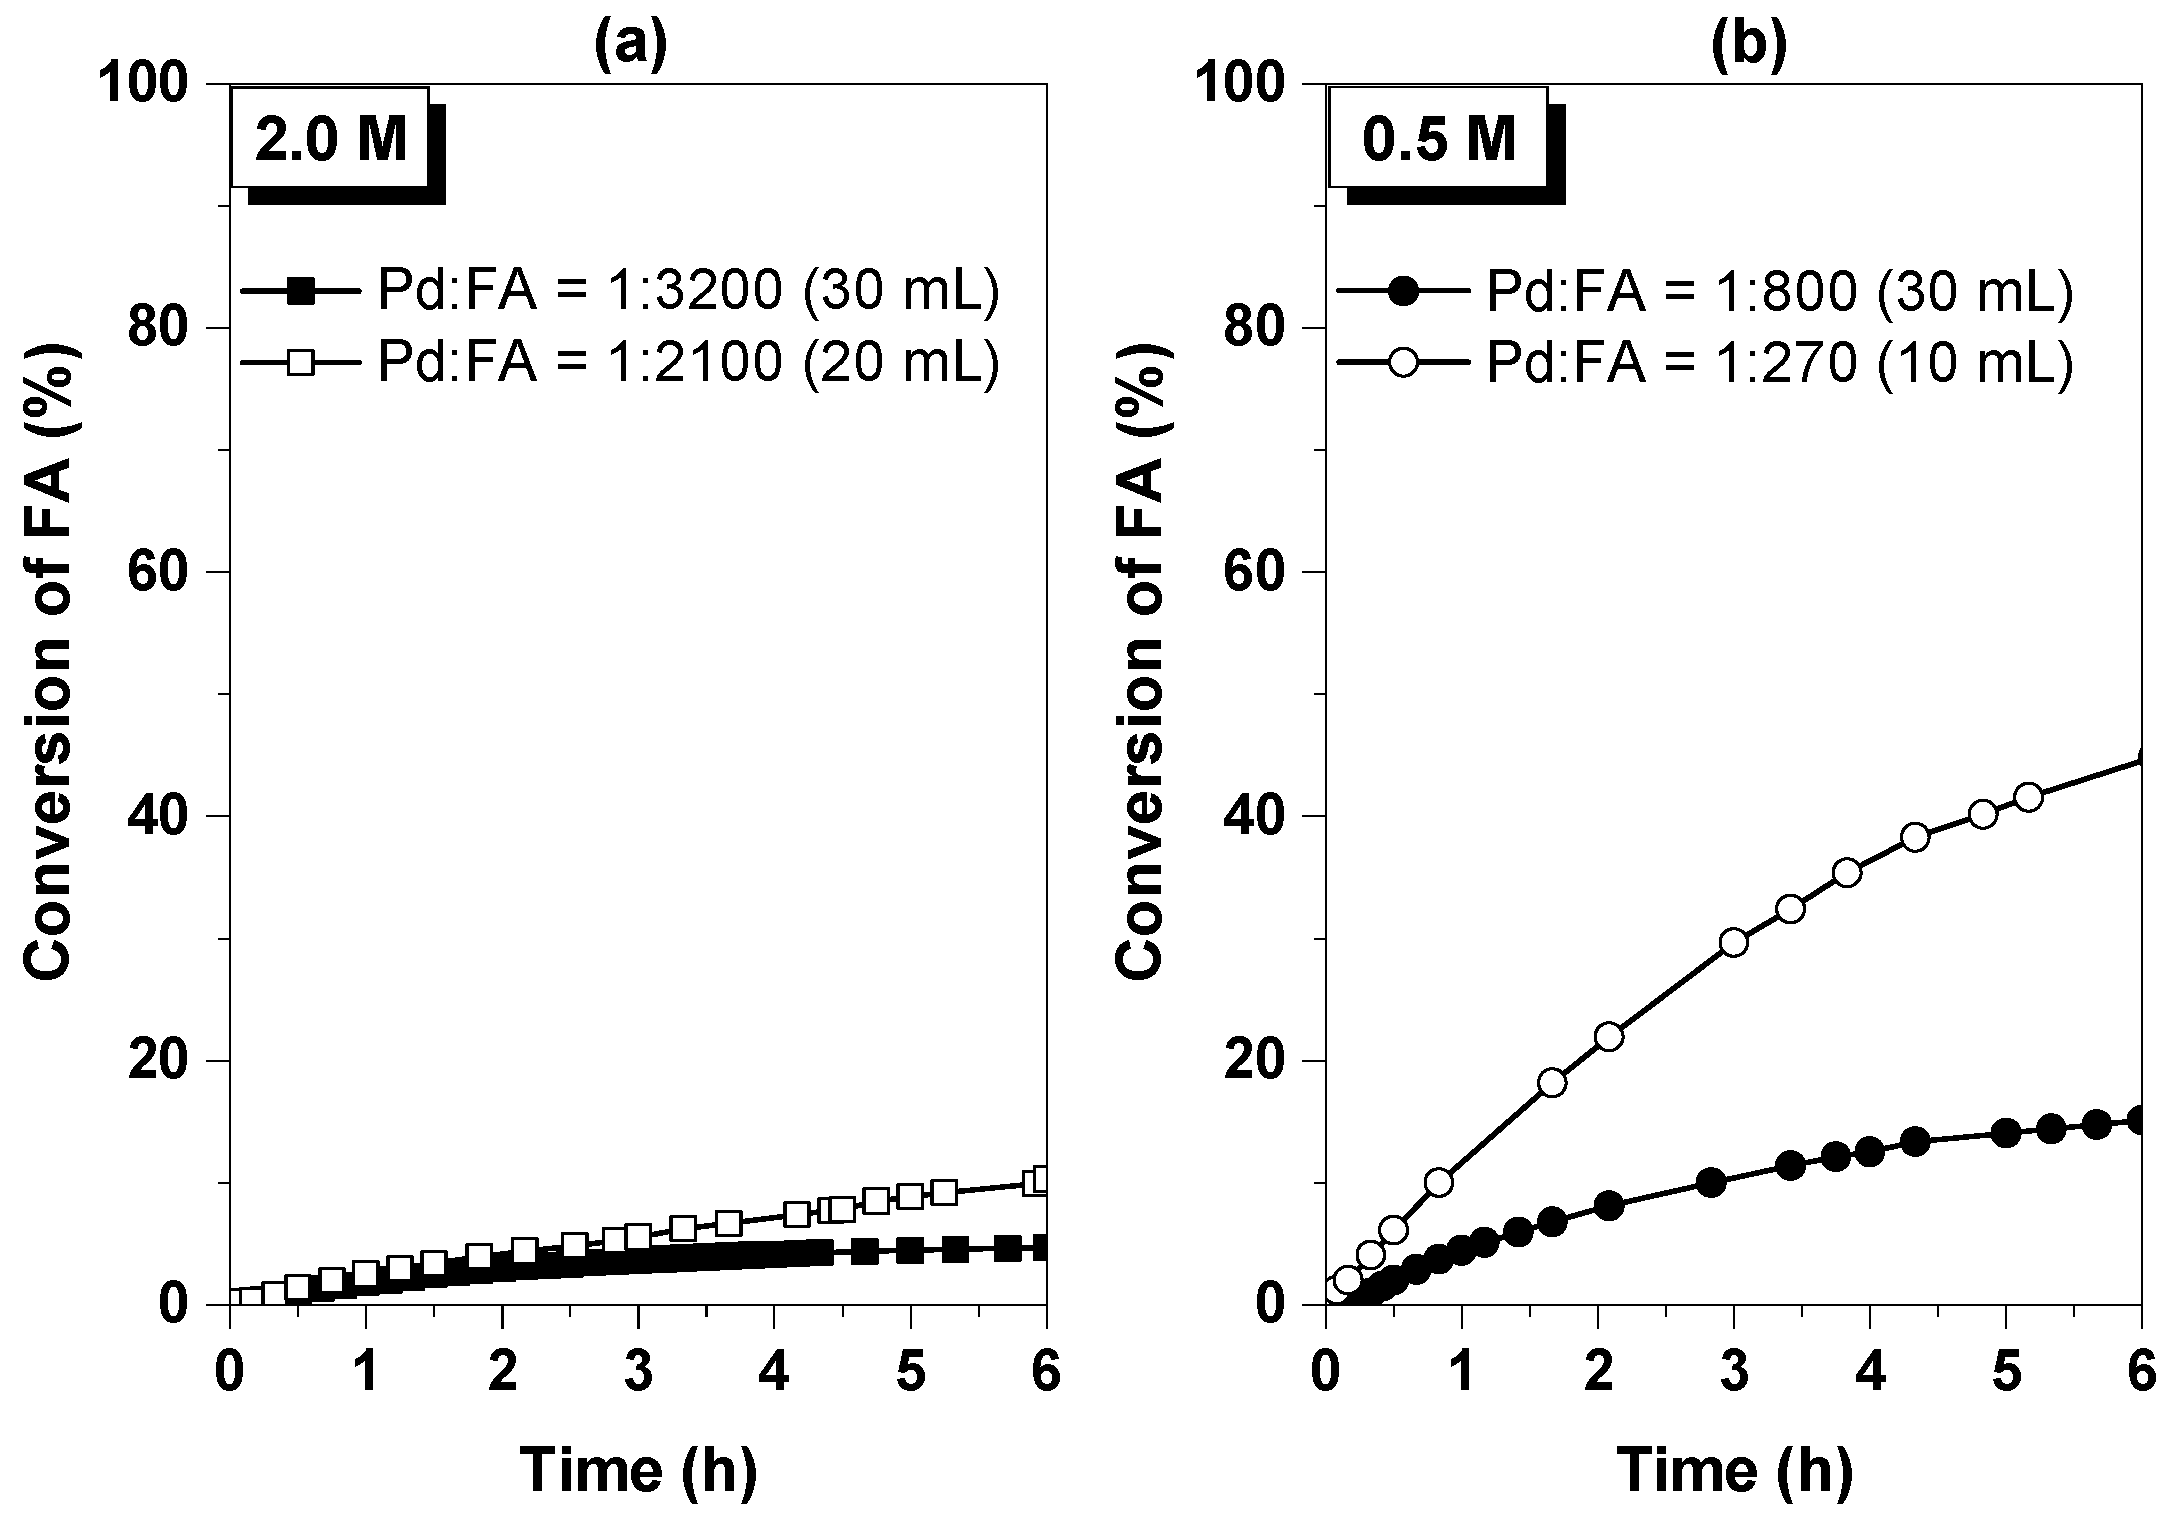
3.2.1. Influence of the Formic Acid Concentration

In order to examine the influence of the formic acid concentration on the catalytic performance of Pd/TC, FA solutions of 0.5, 1.0, or 2.0 M were used and compared to pure FA (98%). Figure 3 illustrates the volumes of gases evolved during 24 h, using 20 mg of catalyst and 30 mL FA solution, at 25 °C. It can be observed that the use of pure FA (98%) leads to no gas generation, in contrast to the use of aqueous FA solutions, when the volume of evolved gases increases with an increasing FA concentration in the first couple of hours. In this case, it may be observed that the generation of gases follows an almost linear trend in the first 6 h, while the final volumes of gases are practically attained after 8 h of reaction. Although, in the first hours, the generated gas volume is proportional to the concentration value, the final gas volumes are lower in the case of the 1.0 M FA solution, compared to the 0.5 M solution. A qualitative analysis of evolved gases performed by MS revealed that H2 and CO2 are the constituent components of the gas mixture, with no detectable traces of CO (Figure 4). The amplitude of the peak at m/z = 28, which is observable in the insert picture of Figure 4, is given by nitrogen present in the residual air, and not CO, proven by the characteristic fingerprint for air in the MS spectrum (mass numbers 28 and 32). Therefore, it may be concluded that the decomposition of formic acid proceeds via dehydrogenation in the presence of Pd/TC catalyst, which is confirmed by the evolution of the gas composition over time.
If the catalytic performance of the Pd catalyst is expressed as the conversion of FA, and not the evolved volume of gas over time, the influence of the FA concentration on the catalytic activity becomes more evident. Therefore, considering that H2 and CO2 are the only detected components in the evolved gas mixture, the conversion of formic acid expressed as moles of transformed FA to moles of FA introduced in the system, can be evaluated using the following relationship:
X F A = 0.5 p V e v o l v e d R T n F A i n i t i a l × 100 ,   ( % )
where Vevolved is the volume of evolved gases and n F A i n i t i a l (mole) is the initial amount of FA introduced in the reaction vessel. Taking into account that 1 mole of FA is decomposed to 1 mole of H2 and 1 mole of CO2 (that is a total of 2 moles of gas), the coefficient 0.5 in Equation (4) becomes implicit. Table 1 summarizes the catalytic performance of the Pd catalyst as a function of the FA concentration, with respect to formic acid conversion, as well as TOF values, while Figure 5 illustrates the conversion profiles over time. It may be clearly observed that the conversion of formic acid increases with a decreasing concentration of FA solution, with the largest conversion value being attained in the case of 0.5 M FA, under the examined reaction conditions. This behavior is explained by the better Pd:FA ratio obtained in the case of more diluted FA solutions, meaning that the number of formic acid molecules to be assigned to a single Pd atom is lower. On the other hand, the initial TOF values calculated after 2 min of reaction at conversion values of around 0.15% are higher for the more concentrated solutions, except for the pure FA (Table 1), due to the higher density of FA molecules in the proximity of the catalytic centers. These apparently contradicting catalytic performance parameters (FA conversion vs. TOF) indicate the importance of the concentration of FA solutions and the used metal to formic acid ratio. Therefore, several tests performed by the use of FA solutions of the same concentration, but with different Pd:FA ratios (that is different volumes of FA solution to the same amount of Pd/TC catalyst), demonstrate that the conversion of FA increases with a decreasing number of FA molecules to each Pd atom (Figure 6). For example, decreasing the 0.5 M FA solution volume by a factor of 3, so that the Pd:FA ratio changes from 1:800 to 1:270, leads to an enhancement of FA conversion after a 6 h reaction time by a factor of 3 (Figure 6b). Therefore, at room temperature (25 °C), FA of a 0.5 M concentration is dehydrogenated in 6 h up to 49.9% using the Pd/TC catalyst, with a Pd:FA ratio of 1:270. The initial TOF is 65.3 h−1 (after 2 min of reaction), which is four times higher compared to the reaction system with 30 mL 0.5 M FA solution (see Table 1). It is noteworthy, however, that except for the initial values, TOFs are practically similar at a given FA conversion value (see Table 1).

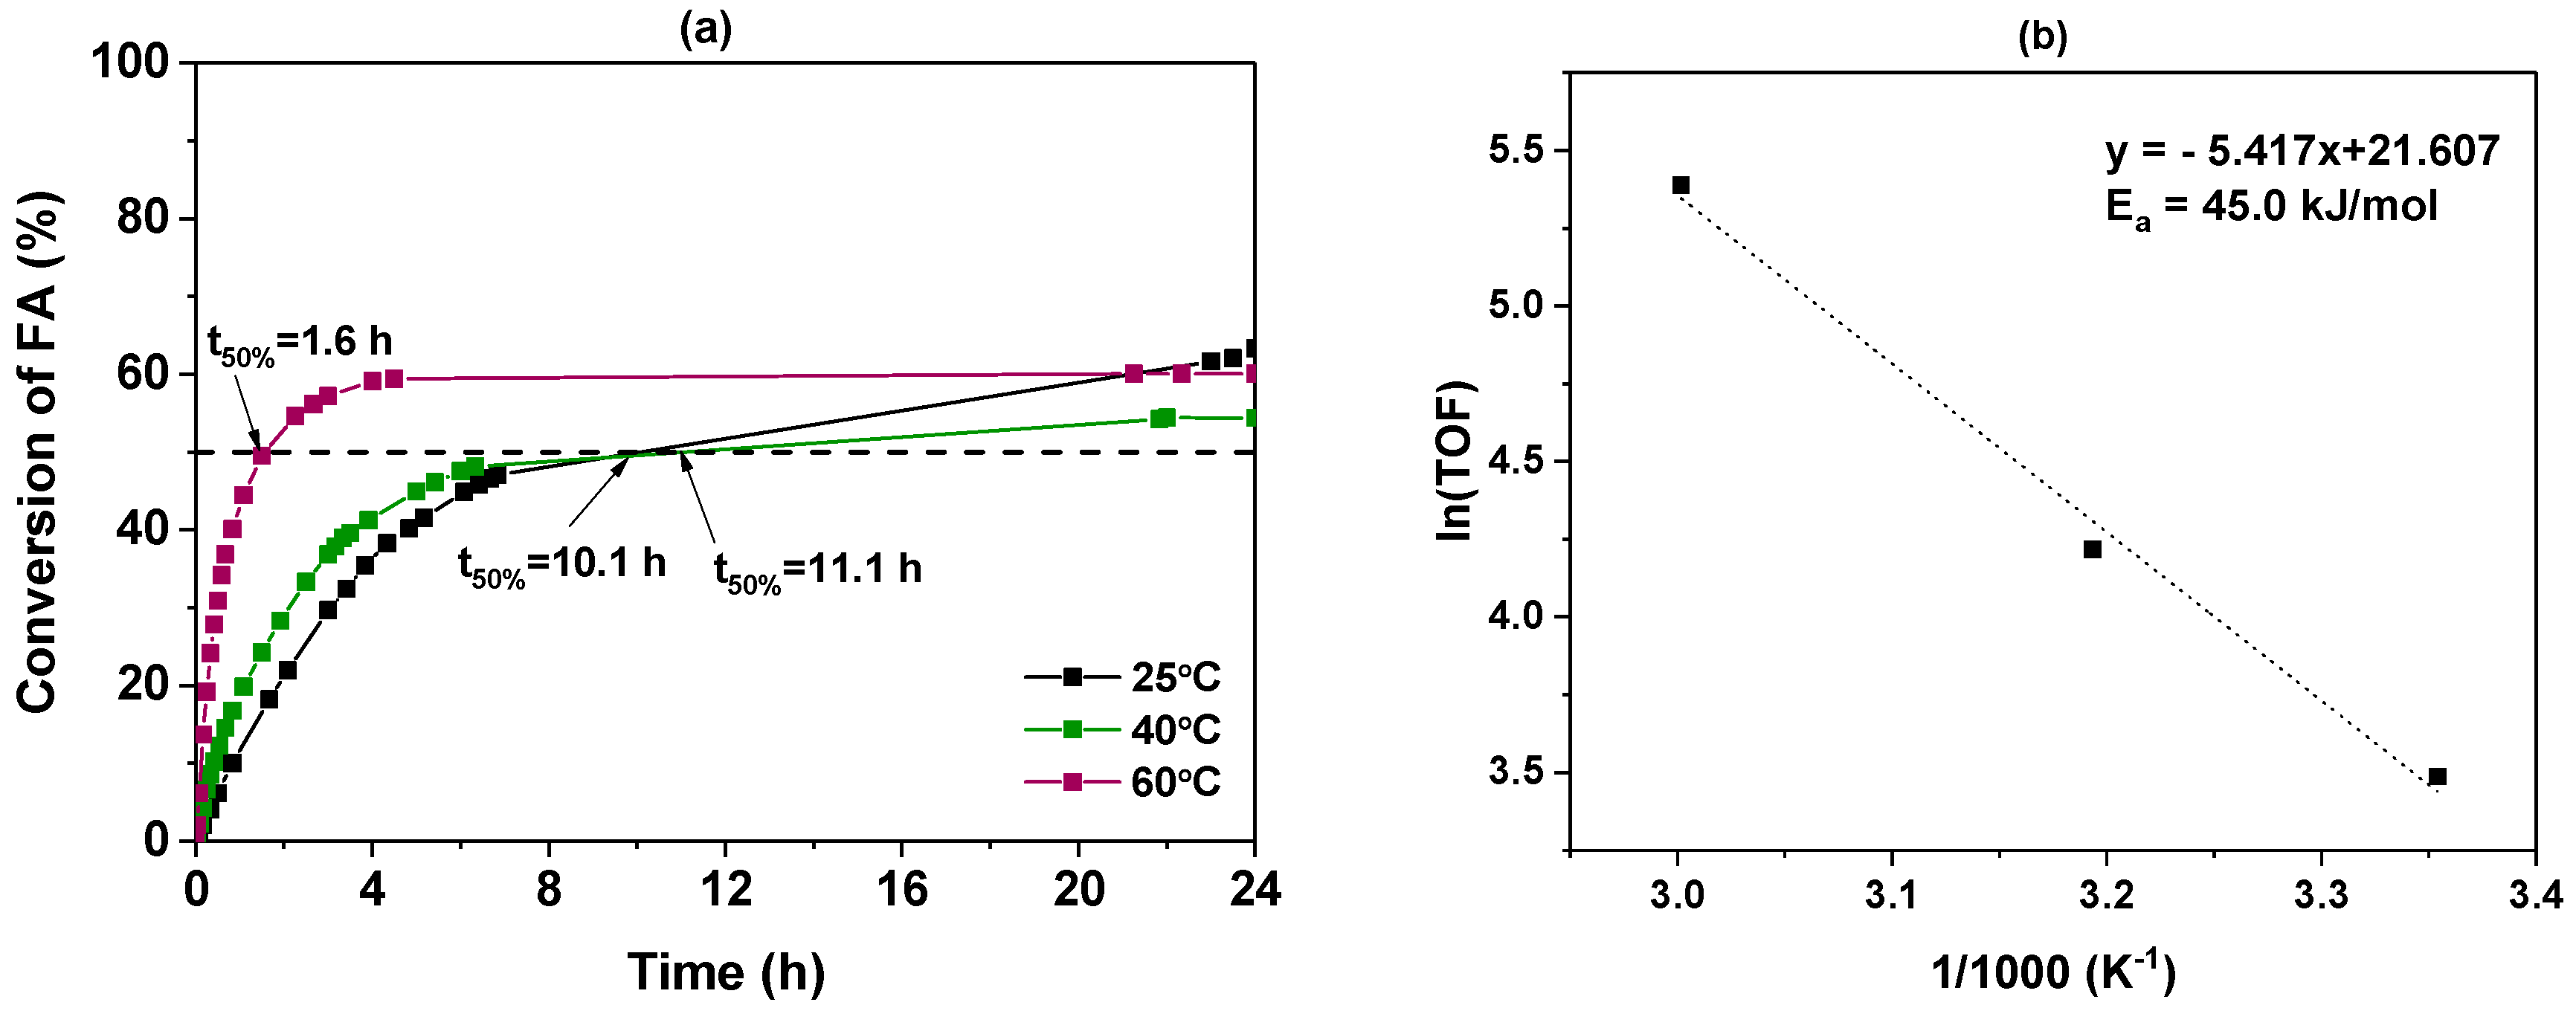
3.2.2. Influence of Temperature

It was previously reported that elevated reaction temperatures favor the formation of poisonous CO [3,6,27], while low operating temperatures are desirable from a technological point of view. Therefore, experimental runs were carried out at temperature values in the range of 25–60 °C.
The dehydrogenation of formic acid on the Pd/TC catalyst at increasing temperatures revealed, as expected, a positive effect on the catalytic performance. Conversion profiles over time are illustrated in Figure 7a for several selected reaction temperatures. It may be observed that FA is dehydrogenated more rapidly with an increasing temperature, with half of the introduced FA already being converted within 1.6 h at 60 °C. Dehydrogenation at 40 °C occurs only slightly more rapidly in the first 6 h than at 25 °C, while the final FA conversion is surprisingly lower. If higher temperatures accelerate the dehydrogenation reaction in the first hours, as demonstrated by the increasing TOF values presented in Table 2, there is no tremendous effect of the reaction temperature on the final FA conversion values. A similar influence of the reaction temperature on the FA dehydrogenation efficiency in the absence of additives was reported for Ag74Pd26/graphene [17], Pd/C synthesized in situ with citric acid [3], and Pd@MO-urea [34]. In these cases, an increase of the reaction temperature did not lead to higher final gas volumes, but significantly enhanced the gas generation rate. It should be noted, however, that most literature reports present catalytic activity results in terms of generated gas volumes, or, more rarely, in terms of TOF numbers, so a straightforward comparison is difficult. The Arrhenius plot of ln(TOF) versus 1000/T for the Pd/TC catalyst is presented in Figure 7b, from which the apparent activation energy (Ea) was calculated to be 45.0 kJ/mol, which is comparable to or lower than most of the reported values.

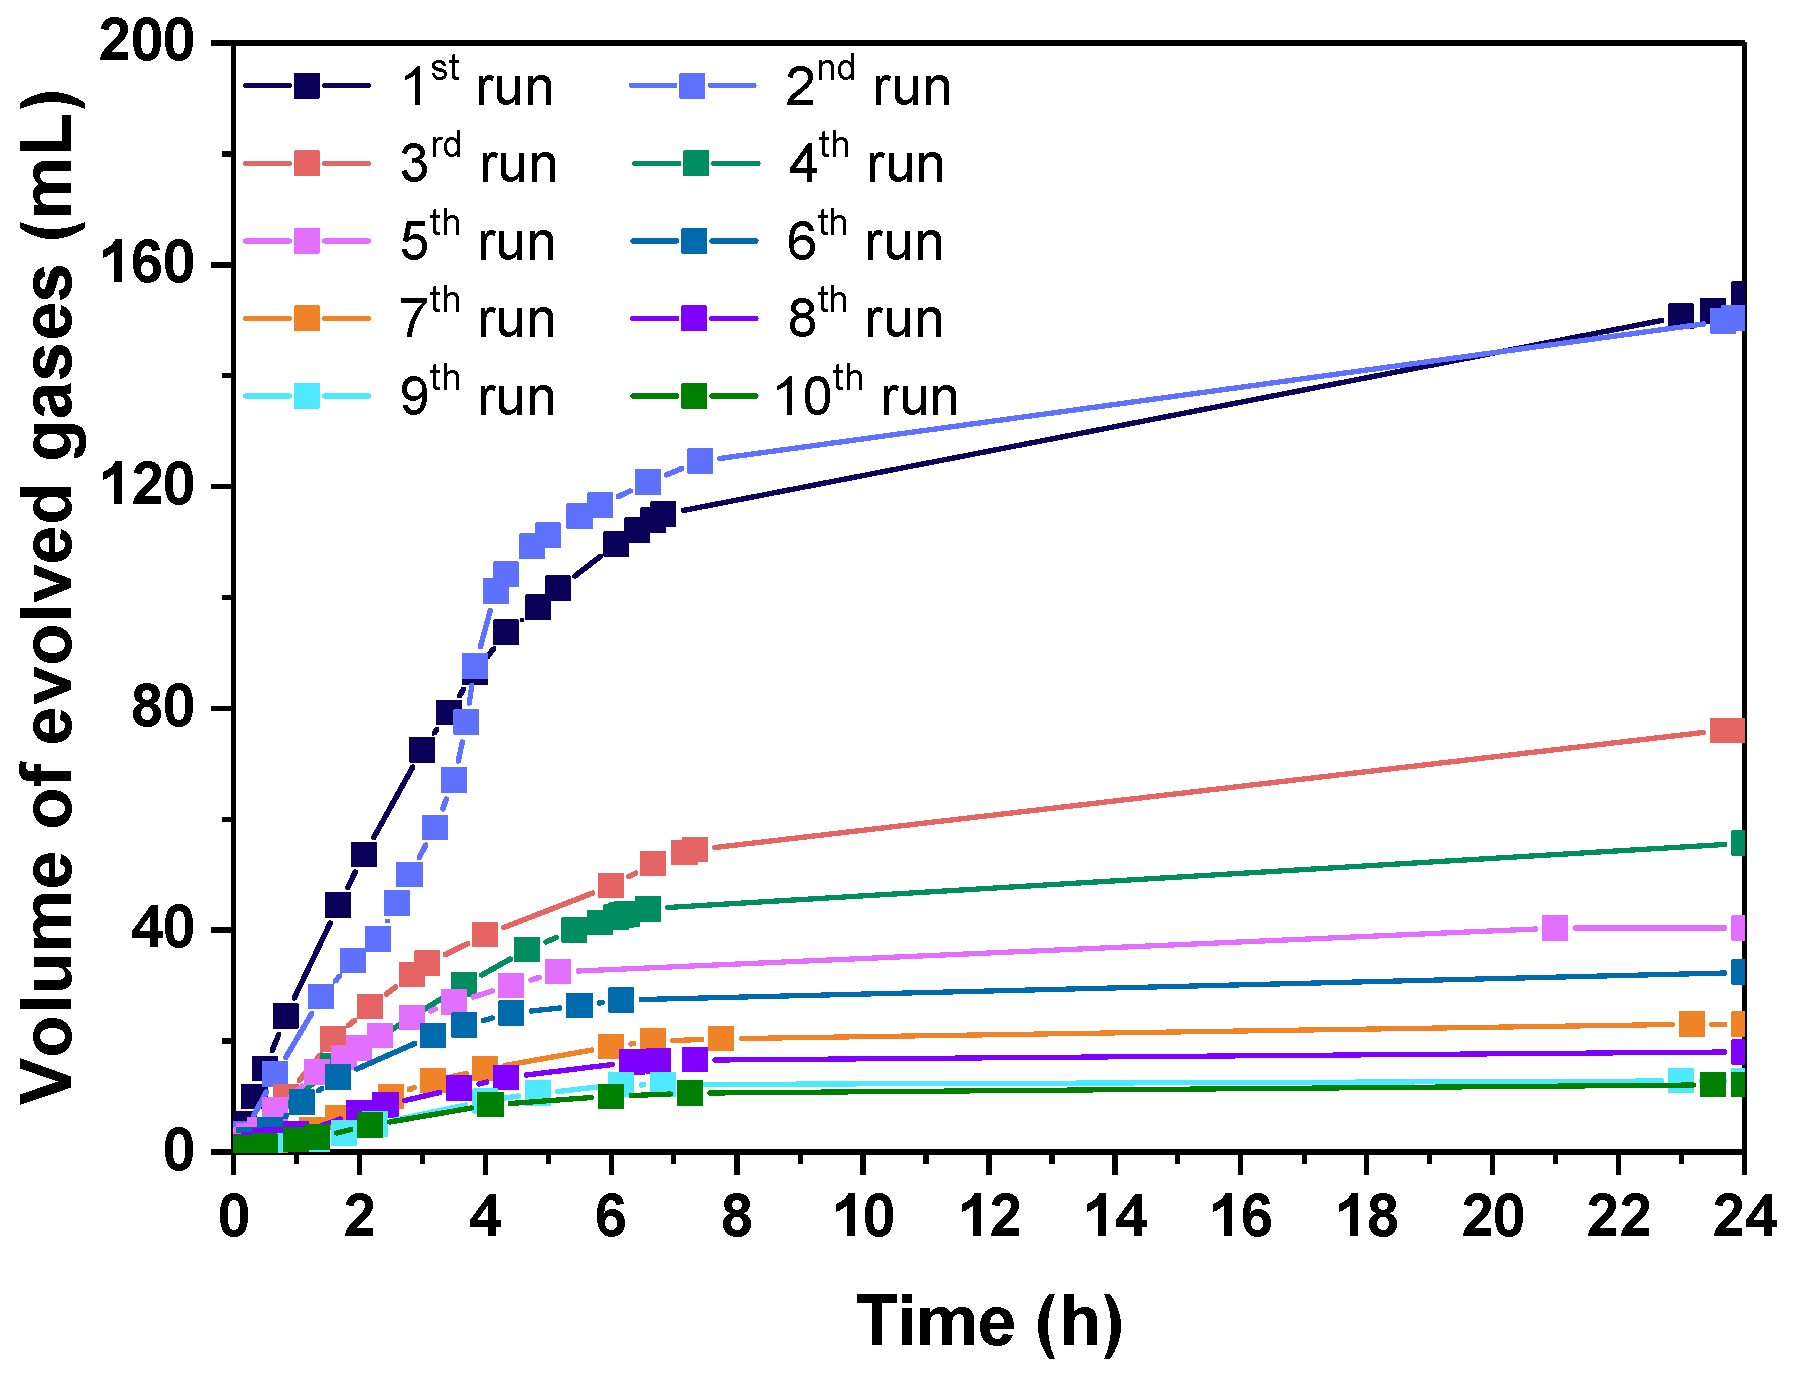
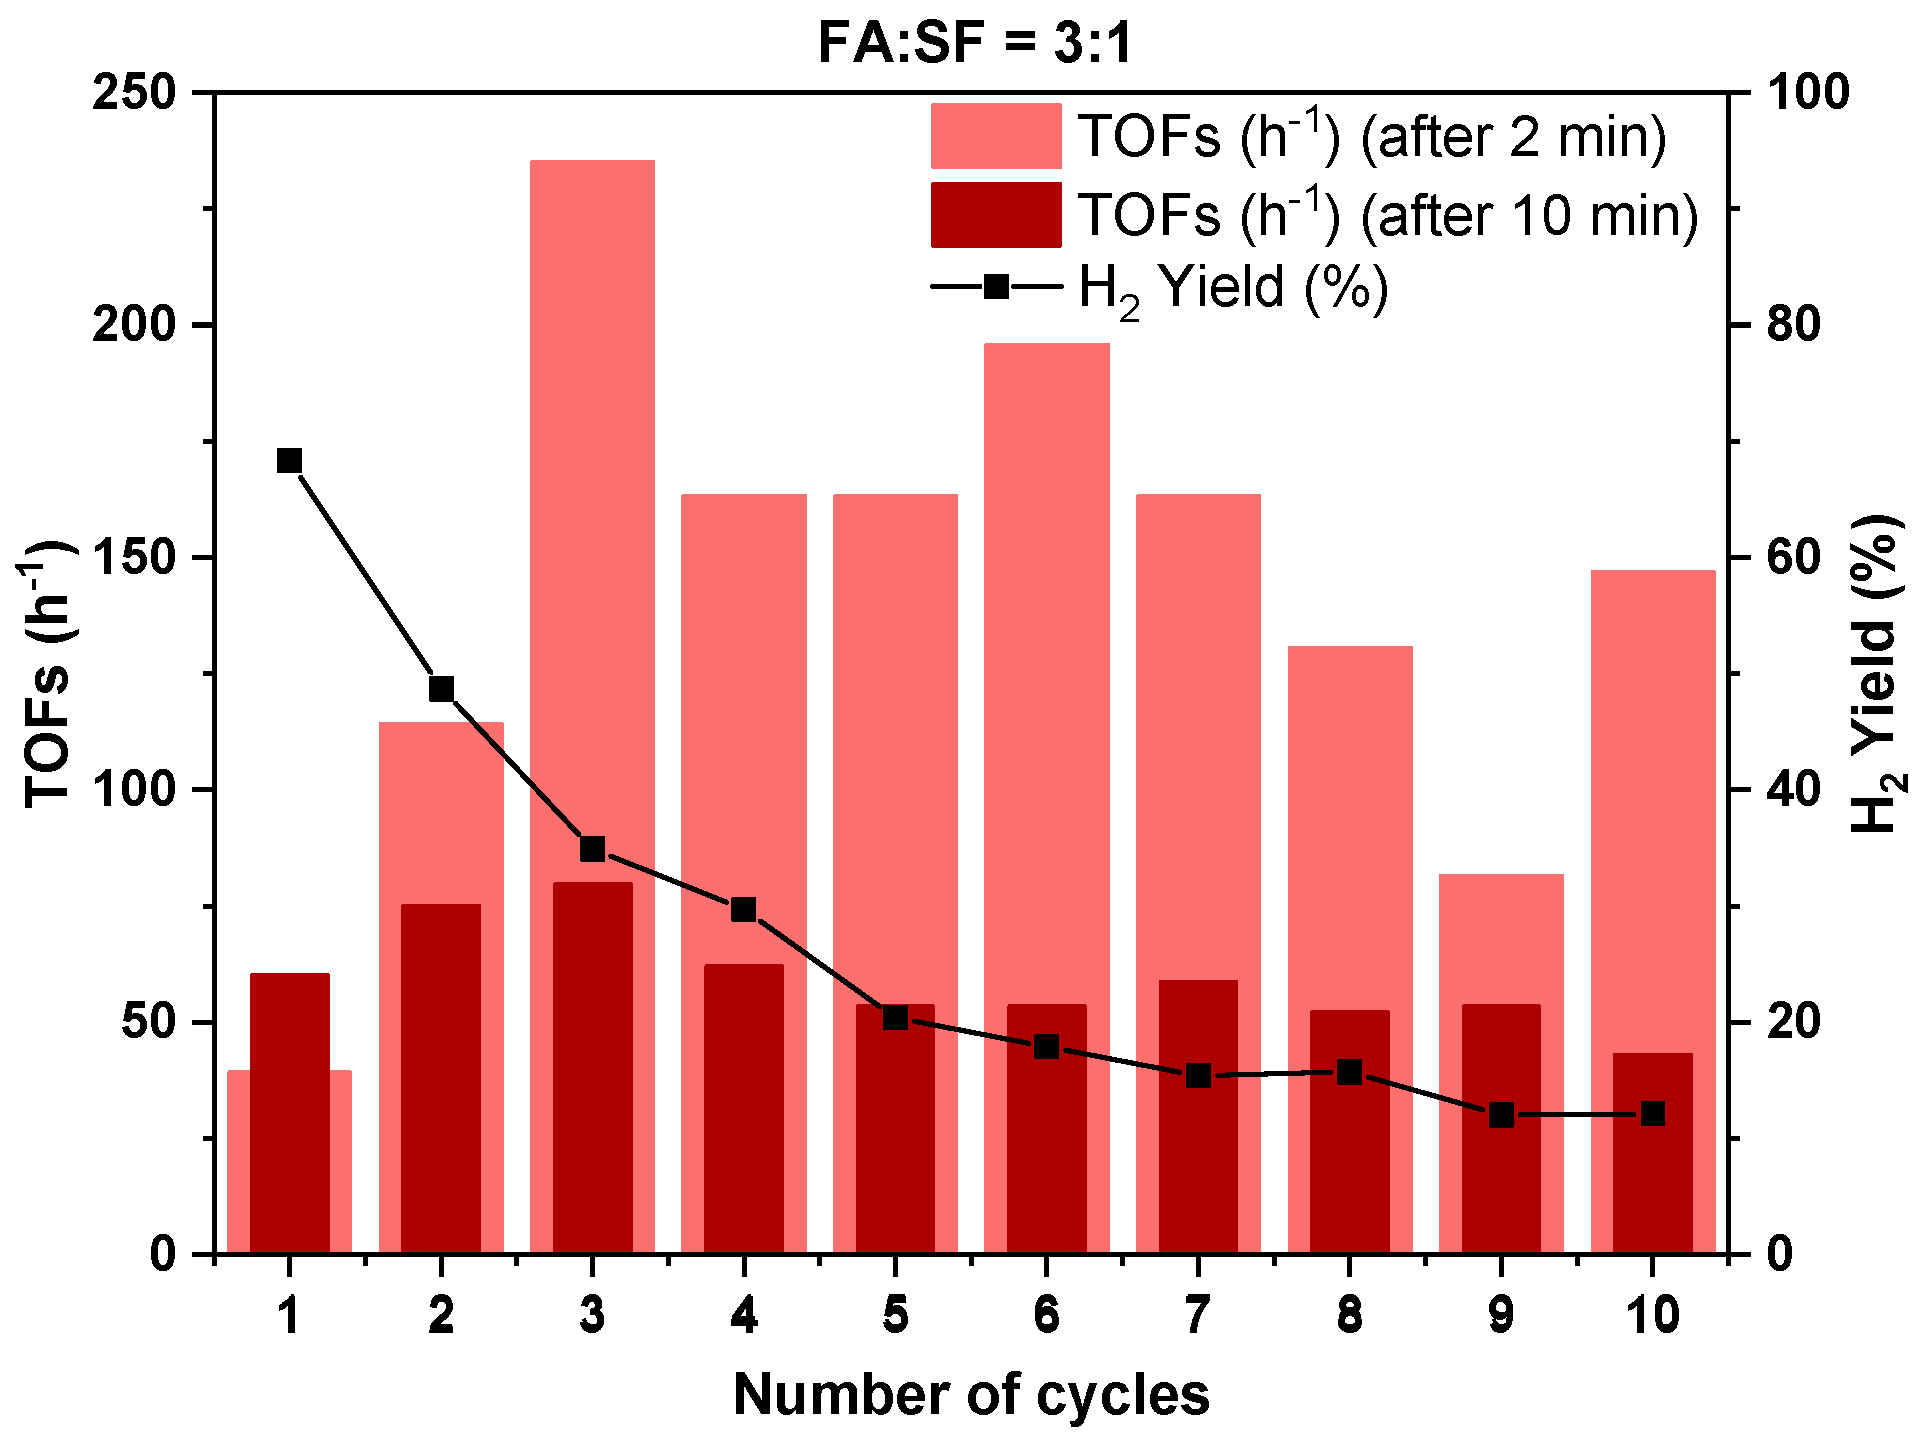
3.2.3. Catalyst Life Time and Complete FA Dehydrogenation

In order to establish the catalyst life time, the catalyst sample used at 25 °C, with 0.5 M FA and a metal to formic acid ratio of 1:270, was reused 10 times under the same reaction conditions. Between two successive runs, the unreacted formic acid solution was evaporated and the catalyst was dried at 150 °C for 3 h. Except for the first two runs, which are practically identical, the total volume of evolved gases decreases with each run (Figure 8). It must be emphasized that the gap between the second and third run is significantly large, considering a total volume of 155 mL evolved after 24 h of reaction in the second run, compared to 76 mL evolved in the third run. After the third run, the decrease between two successive runs of the total gas volume evolved in 24 h is 20–30%, on average, while the last two runs are practically identical (12.8 and 12.2 mL, respectively).
In the case of several catalytic tests, it was observed that a steady state (final gas volume) was not attained after 24 h of reaction. Therefore, for the experimental test involving 20 mg Pd/TC and 20 mL FA 2.0 M (Pd:FA = 1:2100) at 25 °C, we attempted to determine the timespan required to reach a steady state, or even to achieve complete formic acid conversion. In this particular case, the reaction continued for 11 days (264 h) which resulted in the liberation of 1952 mL gas mixture, corresponding to a 99% formic acid conversion. This demonstrates that the complete conversion of formic acid is possible at room temperature, with no additives, even at higher FA concentrations. More importantly, it indicates the possibility of generating hydrogen from FA for a longer period of time, at a desired rate, using the Pd/TC catalyst, by tuning the reaction conditions accordingly (Pd:FA ratio, FA concentration, etc.).

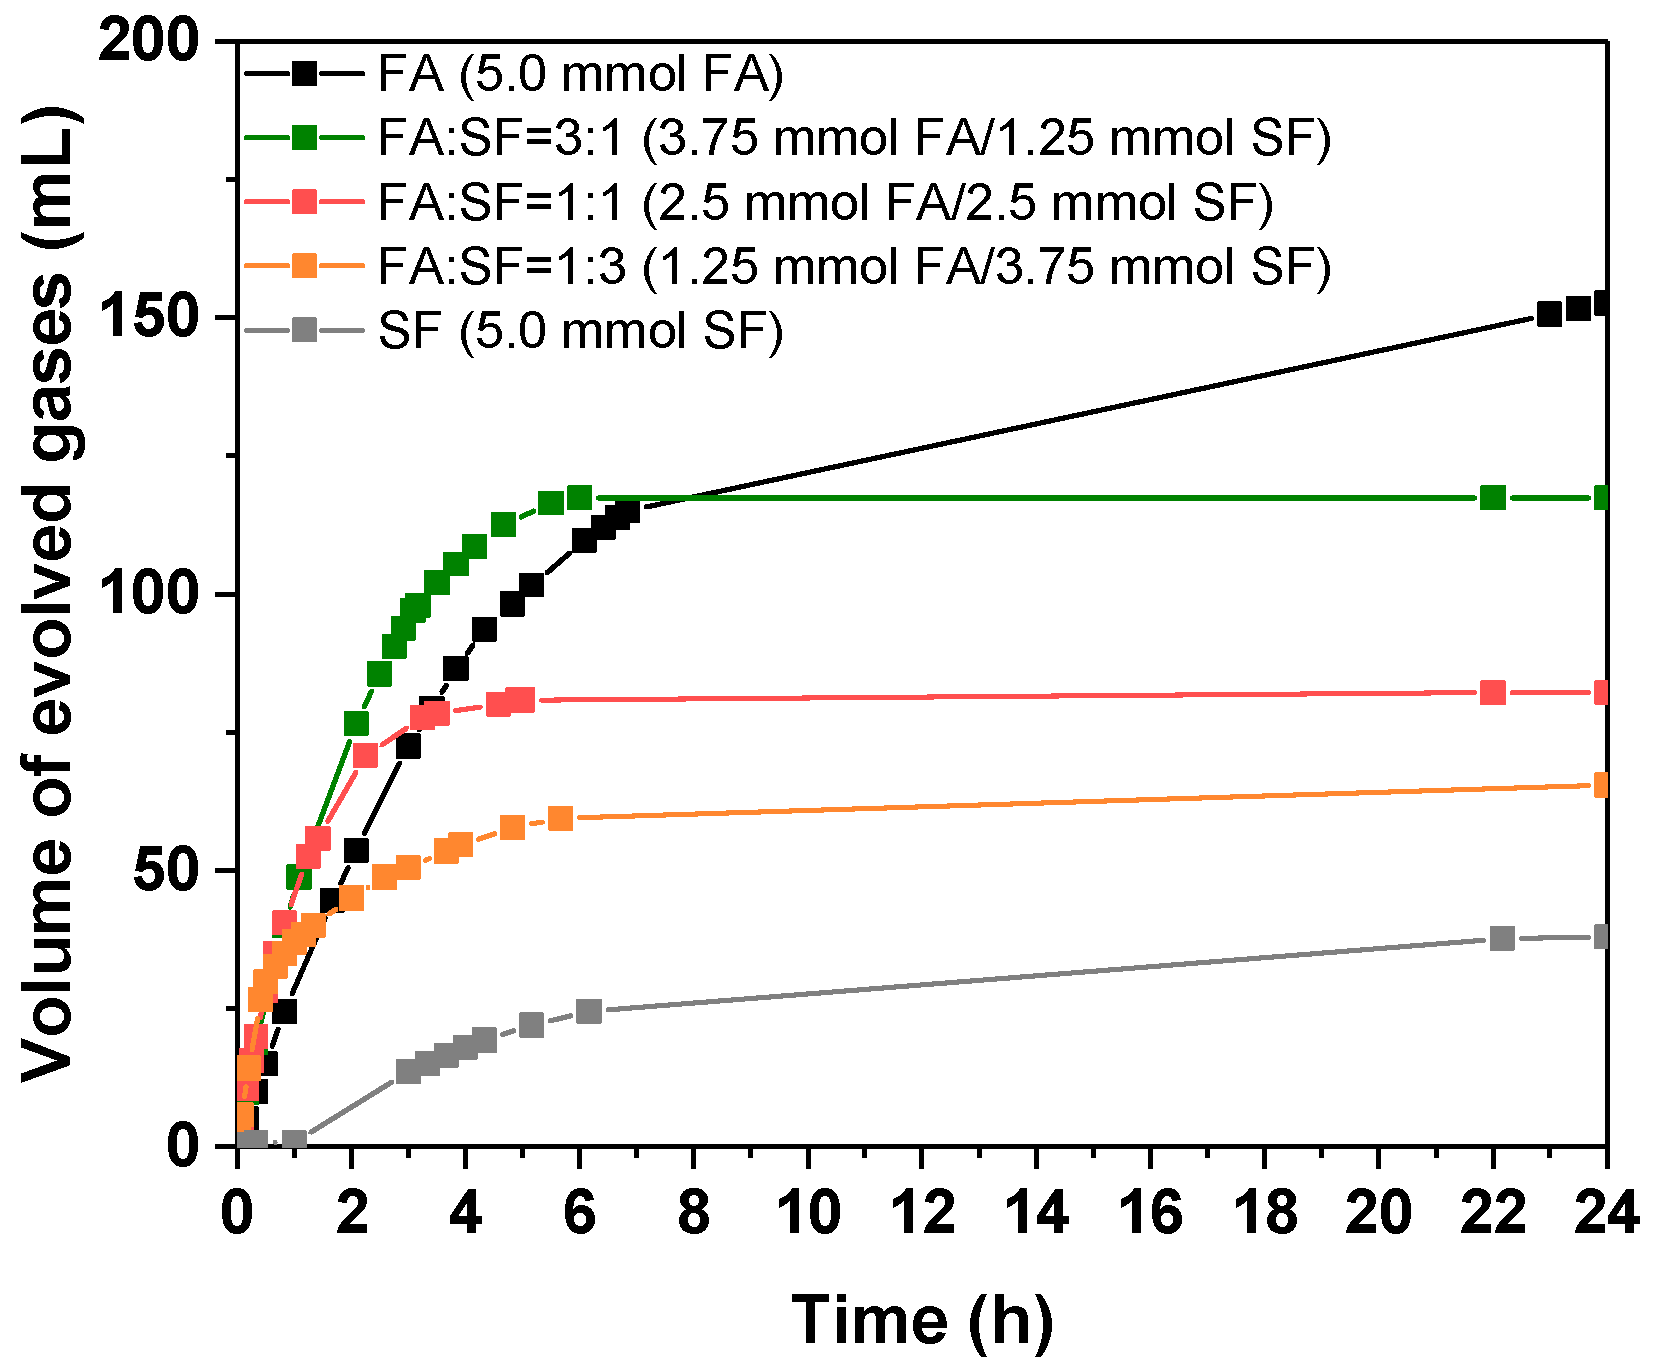
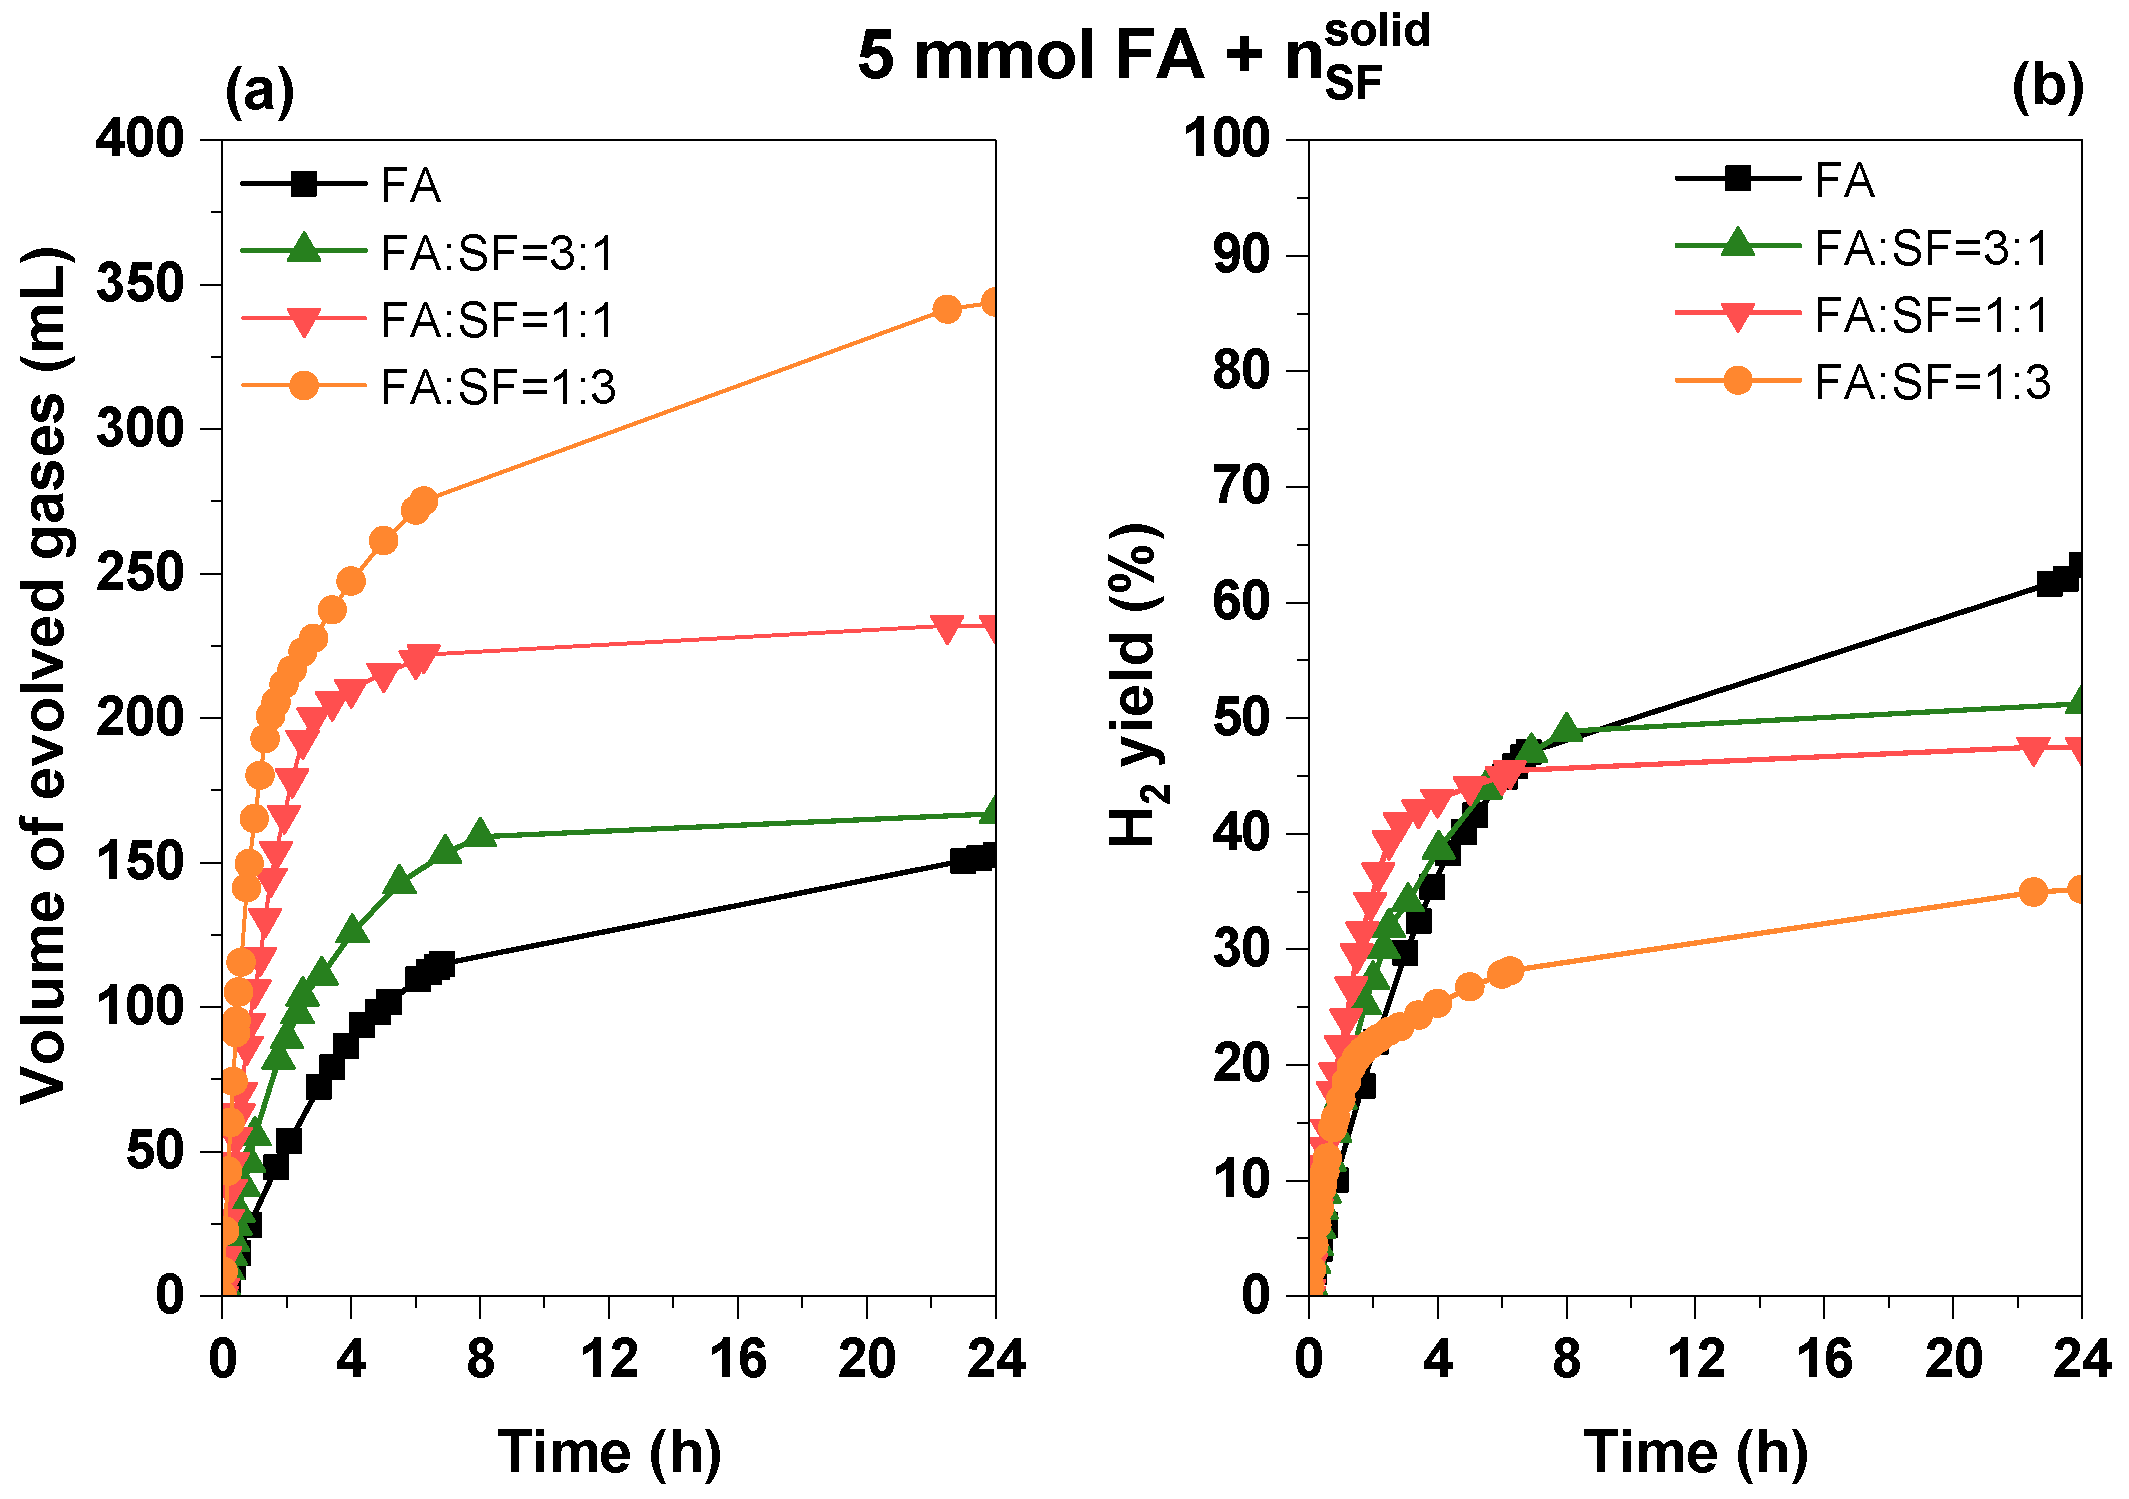
3.2.4. Influence of Sodium Formate Addition

Is well-known that formates act as active species in HCOOH decomposition [15,22,35,36]. Their introduction into the reaction medium certainly has effects on the activation and evolution of the decomposition of formic acid.
The influence of sodium formate addition on the FA–Pd/TC dehydrogenation system was investigated by following two pathways: (i) The use of FA–SF mixtures with a constant total concentration of 0.5 M and constant solution volume of 10 mL, and (ii) the use of increasing added amounts of sodium formate (solid state) to the same volume of 0.5 M solution of FA (10 mL). All catalytic tests involving SF were performed at room temperature.
In the first case, three different ratios between FA and SF were comparatively tested, with the systems containing only FA or SF solutions of 0.5 M, respectively. The profiles of the evolved gas volumes are presented in Figure 9. It may be observed that in the first 60 min of the reaction, all three systems with SF present higher gas generation rates compared to the FA or SF systems alone. Indeed, TOF values calculated at 10 min of reaction are at least double to that of the corresponding value of the FA system, and they increase with an increasing SF concentration in the system. On the other hand, the steady state gas volumes are inferior for each FA:SF system in comparison to the FA system alone. In terms of the hydrogen yield, evaluated as the ratio of formed H2 (mole) to the total mole number of FA and SF, according to Equation (5),
Φ H 2 = n H 2 f o r m e d n F A + n S F · 100 ,   ( % )
all FA:SF systems show surprisingly inferior values in comparison to the FA system alone, while the SF solution alone yields the lowest values after both a 4 and 24 h reaction time (see Table 3).
Compared to other reported experimental results for active carbon-supported Pd catalysts, our results suggest a different interaction of sodium formate with the catalytic surface, especially with the support. The results reported by Wang et al. for the Pd (5 wt.%)/C catalyst at 30 °C [6], with different FA:SF ratios, but with a total concentration of 2 M, revealed the beneficial effect of sodium formate addition on the evolved gas volumes, TOF values, and H2 yield, which all increased with an increasing concentration of SF in the system. In our case, on the contrary, except for the TOF values, the total gas volumes and H2 yield decreased with an increasing SF concentration in the system. On the other hand, it is important to notice that there is a huge difference in the decomposition efficiency of FA solution and SF solution on our Pd/TC catalyst, while previous reports on C-based Pd-supported catalysts have shown a very small difference between the two, with FA being the least decomposed [6]. If ammonium formate is used instead of sodium formate on a Pd/C catalyst, the decomposition of FA is less efficient than the decomposition of ammonium formate solution [13], in contrast to our results, which show Pd/TC to be highly efficient in the decomposition of FA solutions. It follows that, alongside the deposited Pd nanoparticles known as being efficient in FA decomposition, the type of carbonaceous support also plays an important role in the catalytic performance.
Figure 10 presents the results obtained in the case of using increasing amounts of added SF to the same volume of 0.5 M FA (10 mL). It may be observed that the evolved gas volumes increase with an increasing concentration of SF in the system (Figure 10a), with the most rapid increase of gas volumes over time being observed for the FA:SF = 1:3 system. Indeed, the TOF evaluated after 10 min of reaction for this system is 8.6 times larger than for FA alone (282.1 compared to 32.7 h−1) (Table 4). For all FA–SF systems, TOF values are significantly increased compared to FA alone. In terms of the H2 yield, the 3:1 and 1:1 FA:SF systems reveal higher values after 4 h of reaction compared to the FA solution alone, while the 1:3 system exhibits an inferior value. If final H2 yields are considered (after 24 h of reaction), it may be observed that these decrease with an increasing added SF amount (see Figure 10b and Table 4).
At a first glance, it seems that the only role of SF addition to FA solutions in the case of a Pd/TC catalyst would be to enhance the rate of FA decomposition, without any net contribution of formate ions to the overall H2 yield. However, if we consider the FA:SF = 1:3 system obtained by adding 15 mmol of solid SF to 10 mL of 0.5 M FA solution, it may be observed that the total volume of evolved gases (369.2 mL in 24 h) is larger than the total gas volume which may be theoretically obtained from the dehydrogenation of the corresponding 5 mmol FA (244 mL). This is only possible by a net contribution of SF to the FA dehydrogenation mechanism, which means that SF is not an additive to the system, but acts as an intermediate.
The influence of temperature on the dehydrogenation efficiency in an FA:SF system was also investigated for 10 mL 0.5 M FA with added solid SF to correspond to a ratio of 3:1. As for the FA solution alone, an increase of the reaction temperature leads to an enhancement in the gas generation rate, as well as in the total evolved gas volumes (Figure S5 in Supplementary Materials). Consequently, the H2 yield shows increasing values with an increasing reaction temperature. The highest initial TOF (after 5 min of reaction) was estimated to be 535 h−1, at 60 °C. This value is almost three times larger than the corresponding value for the FA system alone, at the same temperature (196 h−1). The apparent activation energy (Ea) was calculated and a value of 50.8 kJ/mol was obtained.
An investigation of the catalyst life time in the FA:SF = 3:1 system (10 mL 0.5 M FA with added solid SF) revealed a decrease of the H2 generation efficiency with an increasing number of cycles, with a significant difference already being observed between the first and second run (Figure S6 in Supplementary Materials). The following cycles revealed H2 yields comparable to the case when recyclability tests were performed in the presence of FA solution alone. The main advantage in using added SF to the FA solution is the fact that the gas generation rates may be significantly increased. Except for the first two runs, initial TOFs (after 2 min of reaction) are at least 5–6 times larger if SF is present in the reaction system. However, after 10 min of reaction, TOF values are stabilized at around 50–60 h−1 (Figure 11), but are still at least three times higher than with no added SF.
A comparison in terms of TOF values with previous literature reports on the performance of carbon-supported Pd catalysts in the dehydrogenation of formic acid (in the absence or presence of sodium formate) is quite difficult, considering the large variety of reaction conditions employed (especially the different metal to formic acid ratios). The range of reported TOFs is very wide, although it is not always clear at what conversion values or at what moment in time these numbers where estimated. However, in comparison to other carbon-supported Pd catalysts, our TOF values at room temperature and with no added formate salts are generally superior, being 143.7 h−1 compared to 6.9 h−1 Pd (5 wt.%)/C [6], 70.9 h−1 reported for the Pd (5 wt.%)/C catalyst [13], and 144 h−1 for a modified C-supported catalyst such as Pd (10 wt.%)/mesoporous graphitic carbon nitride [4]. At reaction temperatures up to 60 °C, we obtained 218.8 h−1, compared to values of between 38 and 87 h−1 at 55 °C for Pd (5 wt.%)/C prepared by different methods [5]. On the other hand, the 535 h−1 TOF evaluated for the FA:SF = 3:1 reaction mixture at 60 °C is significantly superior to other reported values for different FA:SF mixtures, such as 64 h−1 for in-situ synthesized Pd/C with citric acid [3] and 228.3 h−1 for Pd (5 wt.%)/C and FA:SF = 1:9 at room temperature [6]. A recent paper on Pd (3.3 wt.%)/C reported a higher TOF value of 2832 h−1 at 30 °C, but for very different reaction conditions (2 M FA/SF (0.2/1.8), 30 mg catalyst to 9 mL solution) [21].
The most important feature of the novel Pd/TC catalyst is its performance in terms of both TOF numbers and the H2 yield, in the dehydrogenation of FA at room temperature, with no added amounts of SF: 0.5 M FA solution leads to an H2 yield of 63.3% after 24 h of reaction, while complete FA dehydrogenation is achievable by tuning the reaction conditions.

4. Conclusions

A novel Pd/templated carbon catalyst (Pd/TC) with a target metal concentration of 10 wt.% was prepared and tested in CO-free FA decomposition under mild conditions, in the absence and presence of HCOONa. The high surface area catalyst, with different C forms and uniformly dispersed Pd nanoparticles on the templated C support, proved to be highly efficient in the dehydrogenation of FA, even at room temperature. Therefore, an H2 yield of 63.3% could be obtained from the 0.5 M FA solution after 24 h of reaction. On the other hand, depending on the FA concentration and Pd:FA ratio, adjustment of the H2 generation rate may be achieved, alongside complete FA dehydrogenation at room temperature. The H2 yield increases with a decreasing FA concentration, while the reaction temperature significantly enhances the H2 generation rate, but with no important effect upon the final H2 yield. A TOF number as high as 143.7 h−1 was reached at room temperature and with no added formate salts. In the presence of sodium formate, the H2 generation rate increased with the amount of SF present in the reaction system, both when the total FA + SF concentration was kept constant and when increasing amounts of SF were added to the same 0.5 M FA solution volume. For the FA:SF = 3:1 reaction mixture and at 60 °C, the TOF number reached 535 h−1. On the other hand, our results confirm the findings of other reports that sodium formate acts as an intermediate, and not as an additive. Pd/TC can be reused in both the dehydrogenation of FA solutions alone and FA + SF systems, several times.

Supplementary Materials

The following are available online at https://www.mdpi.com/2673-4141/1/1/3/s1: Figure S1. (a) N2 adsorption–desorption isotherms, and (b) pore size distribution for the TC support (pink) and Pd/TC catalyst (black); Figure S2. Powder X-ray diffraction patterns of the TC and Pd/TC catalyst; Figure S3. EDS mapping of the Pd/TC catalyst; Figure S4. EDX spectra for the Pd/TC catalyst; Figure S5. Influence of temperature on the volume of evolved gases in the FA:SF = 3:1 system using 20 mg Pd/TC, 10 mL FA 0.5 M + 1.66 mmol SF; Figure S6. Reusability potential of Pd/TC in the dehydrogenation of FA:SF = 3:1 system using 20 mg catalyst, 10 mL FA 0.5 M + 1.66 mmol SF, at 25 °C.

Author Contributions

Conceptualization, M.M., M.D.L., and G.B.; methodology, M.M., M.D.L., and G.B.; validation, M.M., M.D.L., and G.B.; formal analysis, M.M.; investigation, M.M., M.D., and L.B.-T.; resources, M.M. and G.B.; data curation, M.M. and M.D.L.; writing—original draft preparation, M.M.; writing—review and editing, M.M., M.D.L., and G.B.; visualization, M.M.; supervision, M.D.L., and G.B.; project administration, G.B.; funding acquisition, G.B. All authors have read and agreed to the published version of the manuscript.

Funding

This work was supported by a grant of the Romanian CNCS–UEFISCDI, project number PN-II-RU-TE-2014-4-1326.

Conflicts of Interest

The authors declare no conflict of interest. The funders had no role in the design of the study; in the collection, analyses, or interpretation of data; in the writing of the manuscript; or in the decision to publish the results.

References

  1. Grasemann, M.; Laurenczy, G. Formic acid as a hydrogen source – recent developments and future trends. Energy Environ. Sci. 2012, 5, 8171–8181. [Google Scholar] [CrossRef]
  2. Singh, A.K.; Singh, S.; Kumar, A. Hydrogen energy future with formic acid: A renewable chemical hydrogen storage system. Catal. Sci. Technol. 2016, 6, 12–40. [Google Scholar] [CrossRef]
  3. Wang, Z.-L.; Yan, J.-M.; Wang, H.; Ping, Y.; Jiang, Q. Pd/C Synthesized with Citric Acid: An Efficient Catalyst for Hydrogen Generation from Formic Acid/Sodium Formate. Sci. Rep. 2012, 2, 1–6. [Google Scholar] [CrossRef] [Green Version]
  4. Lee, J.H.; Ryu, J.; Kim, J.Y.; Nam, S.-W.; Han, J.H.; Lim, T.-H.; Gautam, S.; Chae, K.H.; Yoon, C.W. Carbon dioxide mediated, reversible chemical hydrogen storage using a Pd nanocatalyst supported on mesoporous graphitic carbon nitride. J. Mater. Chem. A 2014, 2, 9490–9495. [Google Scholar] [CrossRef]
  5. Jeon, H.-J.; Chung, Y.-M. Hydrogen production from formic acid dehydrogenation over Pd/C catalysts: Effect of metal and support properties on the catalytic performance. Appl. Catal. B Environ. 2017, 210, 212–222. [Google Scholar] [CrossRef]
  6. Wang, X.; Qi, G.-W.; Tan, C.-H.; Li, Y.-P.; Guo, J.; Pang, X.-J.; Zhang, S.-Y. Pd/C nanocatalyst with high turnover frequency for hydrogen generation from the formic acid-formate mixtures. Int. J. Hydrogen Energy 2014, 39, 837–843. [Google Scholar] [CrossRef]
  7. Tedsree, K.; Li, T.; Jones, S.; Chan, C.W.A.; Yu, K.M.K.; Bagot, P.A.J.; Marquis, E.A.; Smith, G.D.W.; Tsang, S.C.E. Hydrogen production from formic acid decomposition at room temperature using a Ag-Pd core-shell nanocatalyst. Nat. Nanotechnol. 2011, 6, 302–307. [Google Scholar] [CrossRef]
  8. Jena, P.J. Materials for Hydrogen Storage: Past, Present, and Future. Phys. Chem. Lett. 2011, 2, 206–211. [Google Scholar] [CrossRef]
  9. Rowsell, J.L.C.; Yaghi, O.M. Strategies for Hydrogen Storage in Metal–Organic Frameworks. Angew. Chem. Int. Ed. 2005, 44, 4670–4679. [Google Scholar] [CrossRef]
  10. Blanita, G.; Coldea, I.; Misan, I.; Lupu, D. Hydrogen cryo-adsorption by hexagonal prism monoliths of MIL-101. Int. J. Hydrogen Energy 2014, 39, 17040–17046. [Google Scholar] [CrossRef]
  11. Ardelean, O.; Blanita, G.; Borodi, G.; Lazar, M.D.; Misan, I.; Coldea, I.; Lupu, D. Volumetric hydrogen adsorption capacity of densified MIL-101 monoliths. Int. J. Hydrogen Energy 2013, 38, 7046–7055. [Google Scholar] [CrossRef]
  12. Jiang, H.-L.; Singh, S.K.; Yan, J.-M.; Zhang, X.-B.; Xu, Q. Liquid-Phase Chemical Hydrogen Storage: Catalytic Hydrogen Generation under Ambient Conditions. ChemSusChem 2010, 3, 541–549. [Google Scholar] [CrossRef]
  13. Zhou, J.-P.; Zhang, J.; Dai, X.-H.; Wang, X.; Zhang, S.-Y. Formic acid-ammonium formate mixture: A new system with extremely high dehydrogenation activity and capacity. Int. J. Hydrogen Energy 2016, 41, 22059–22066. [Google Scholar] [CrossRef]
  14. Wang, Z.-L.; Yan, J.-M.; Ping, Y.; Wang, H.-L.; Zheng, W.-T.; Jiang, Q. An Efficient CoAuPd/C Catalyst for Hydrogen Generation from Formic Acid at Room Temperature. Angew. Chem. Int. Ed. 2013, 52, 4406–4409. [Google Scholar] [CrossRef]
  15. Akbayrak, S.; Tonbul, Y.; Ozkar, S. Nanoceria supported palladium(0) nanoparticles: Superb catalyst in dehydrogenation of formic acid at room temperature. Appl. Catal. B Environ. 2017, 206, 384–392. [Google Scholar] [CrossRef]
  16. Enthaler, S.; von Langermann, J.; Schmidt, T. Carbon dioxide and formic acid—the couple for environmental-friendly hydrogen storage? Energy Environ. Sci. 2010, 3, 1207–1217. [Google Scholar] [CrossRef]
  17. Yang, L.; Hua, X.; Su, J.; Luo, W.; Chen, S.; Cheng, G. Highly efficient hydrogen generation from formic acid-sodium formate over monodisperse AgPd nanoparticles at room temperature. Appl. Catal. B Environ. 2015, 168–169, 423–428. [Google Scholar] [CrossRef]
  18. Wang, Z.-L.; Ping, Y.; Yan, J.-M.; Wang, H.; Jiang, Q. Hydrogen generation from formic acid decomposition at room temperature using a NiAuPd alloy nanocatalyst. Int. J. Hydrogen Energy 2014, 39, 4850–4856. [Google Scholar] [CrossRef]
  19. Karatas, Y.; Bulut, A.; Yurderi, M.; Ertas, I.E.; Alal, O.; Gulcan, M.; Celebi, M.; Kivrak, H.; Kaya, M.; Zahmakiran, M. PdAu-MnOx nanoparticles supported on amine-functionalized SiO2 for the room temperature dehydrogenation of formic acid in the absence of additives. Appl. Catal. B Environ. 2016, 180, 586–595. [Google Scholar] [CrossRef]
  20. Bulushev, D.A.; Beloshapkin, S.; Ross, J.R.H. Hydrogen from formic acid decomposition over Pd and Au catalysts. Catal. Today 2010, 154, 7–12. [Google Scholar] [CrossRef]
  21. Kim, Y.; Kim, S.; Chul, H.; Heui, D.J. Mechanistic insights on aqueous formic acid dehydrogenation over Pd/C catalyst for efficient hydrogen production. J. Catal. 2020, 389, 506–516. [Google Scholar] [CrossRef]
  22. Grad, O.; Mihet, M.; Coros, M.; Dan, M.; Lazar, M.D.; Blanita, G. Reduced graphene oxide modified with noble metal nanoparticles for formic acid dehydrogenation. Catal. Today 2020, in press. [Google Scholar] [CrossRef]
  23. Zacharska, M.; Chuvilin, A.L.; Kriventsov, V.V.; Beloshapkin, S.; Estrada, M.; Simakov, A.; Bulushev, D.A. Support effect for nanosized Au catalysts in hydrogen production from formic acid decomposition. Catal. Sci. Technol. 2016, 6, 6853–6860. [Google Scholar] [CrossRef] [Green Version]
  24. Bi, Q.-Y.; Du, X.-L.; Liu, Y.-M.; Cao, Y.; He, H.-Y.; Fan, K.-N. Efficient Subnanometric Gold-Catalyzed Hydrogen Generation via Formic Acid Decomposition under Ambient Conditions. J. Am. Chem. Soc. 2012, 134, 8926–8933. [Google Scholar] [CrossRef] [PubMed]
  25. Gazsi, A.; Bansagi, T.; Solymosi, F.J. Decomposition and Reforming of Formic Acid on Supported Au Catalysts: Production of CO-Free H2. Phys. Chem. C 2011, 115, 15459–15466. [Google Scholar] [CrossRef] [Green Version]
  26. Grad, O.; Mihet, M.; Dan, M.; Blanita, G.; Berghian-Grosan, C.; Lazar, M.D. Au/reduced graphene oxide composites: Eco-friendly preparation method and catalytic applications for formic acid dehydrogenation. J. Mater. Sci. 2019, 54, 6991–7004. [Google Scholar] [CrossRef]
  27. Zhou, X.; Huang, Y.; Xing, W.; Liu, C.; Liao, J.; Lu, T. High-quality hydrogen from the catalyzed decomposition of formic acid by Pd–Au/C and Pd–Ag/C. Chem. Commun. 2008, 30, 3540–3542. [Google Scholar] [CrossRef]
  28. Gu, X.; Lu, Z.-H.; Jiang, H.; Akita, T.; Xu, Q.J. Synergistic catalysis of metal-organic framework-immobilized Au-Pd nanoparticles in dehydrogenation of formic acid for chemical hydrogen storage. Am. Chem. Soc. 2011, 133, 11822–11825. [Google Scholar] [CrossRef]
  29. Dai, H.; Cao, N.; Yang, L.; Su, J.; Luo, W.; Cheng, G.J. AgPd nanoparticles supported on MIL-101 as high performance catalysts for catalytic dehydrogenation of formic acid. Mater. Chem. A 2014, 2, 11060–11064. [Google Scholar] [CrossRef]
  30. Hu, C.; Ting, S.-W.; Tsui, J.; Chan, K.-Y. Formic acid dehydrogenation over PtRuBiOx/C catalyst for generation of CO-free hydrogen in a continuous-flow reactor. Int. J. Hydrogen Energy 2012, 37, 6372–6380. [Google Scholar] [CrossRef]
  31. Doustkhah, E.; Hasani, M.; Ide, Y.; Assadi, M.H.N. Pd Nanoalloys for H2 Generation from Formic Acid. ACS Appl. Nano Mater. 2020, 3, 22–43. [Google Scholar] [CrossRef] [Green Version]
  32. Hou, P.X.; Yamazaki, T.; Orikasa, H.; Kyotani, T. An easy method for the synthesis of ordered microporous carbons by the template technique. Carbon 2005, 43, 2624–2627. [Google Scholar] [CrossRef]
  33. Ma, Z.; Kyotani, T.; Tomita, A. Synthesis methods for preparing microporous carbons with a structural regularity of zeolite Y. Carbon 2002, 40, 2367–2374. [Google Scholar] [CrossRef]
  34. Doustkhah, E.; Mohtasham, H.; Farjzadeh, M.; Rostamnia, S.; Wang, Y.; Arandiyan, H.; Assadi, M.H.N. Organosiloxane tunability in mesoporous organosilica and punctuated Pd nanoparticles growth; theory and experiment. Microporous Mesoporous Mater. 2020, 293, 109832. [Google Scholar] [CrossRef]
  35. Ojeda, M.; Iglesia, E. Formic Acid Dehydrogenation on Au-Based Catalysts at Near- Ambient Temperatures. Angew. Chem. Int. Ed. 2009, 48, 4800–4803. [Google Scholar] [CrossRef] [Green Version]
  36. Rootsaert, W.M.H.; Sachtler, W.J.M. Interaction of Formic Acid Vapour with Tungsten. Z. Phys. Chem. 1960, 26, 16–26. [Google Scholar] [CrossRef]
Figure 1. (a) Scanning electron microscopy (SEM) and (b) transmission electron microscopy (TEM) images of the Pd/TC catalyst, with the Pd nanoparticle size distribution shown in the inset.
Hydrogen 01 00003 g001
Figure 2. (a) Thermogravimetric analysis (TGA) curve and (b) derivative curve (DTG) of both the TC support and Pd/TC catalyst.
Hydrogen 01 00003 g002
Figure 3. The volume of evolved gases versus time for the decomposition of formic acid (FA) catalyzed by Pd/TC at different concentrations of FA (20 mg of catalyst, 30 mL of FA solution, 25 °C).
Hydrogen 01 00003 g003
Figure 4. MS spectrum of the evolved gases during FA decomposition over Pd/TC at 25 °C.
Hydrogen 01 00003 g004
Figure 5. Conversion profiles for the dehydrogenation of FA catalyzed by Pd/TC at different concentrations of FA (20 mg of catalyst, 30 mL of FA solution, 25 °C).
Hydrogen 01 00003 g005
Figure 6. Conversion profiles for the dehydrogenation of FA catalyzed by Pd/TC using different Pd:FA ratios with (a) 2.0 M FA and (b) 0.5 M FA (20 mg of catalyst, 25 °C).
Hydrogen 01 00003 g006
Figure 7. (a) Influence of temperature on the conversion profiles in the dehydrogenation of FA catalyzed by Pd/TC (20 mg of catalyst, 10 mL FA 0.5 M, Pd:FA = 1:270). (b) Arrhenius plot obtained from the data presented in Table 2.
Hydrogen 01 00003 g007
Figure 8. Reusability potential of Pd/TC in the dehydrogenation reaction of FA at 25 °C (20 mg of catalyst, 10 mL FA 0.5 M, Pd:FA = 1:270).
Hydrogen 01 00003 g008
Figure 9. Influence of the FA:SF ratio on the evolved gas volumes in the dehydrogenation reaction of FA on Pd/TC at room temperature (20 mg of catalyst, total 5 mmol (FA + SF) in 10 mL solution, 25 °C).
Hydrogen 01 00003 g009
Figure 10. Influence of the FA:SF ratio on (a) the evolved gas volumes and (b) H2 yield, in the dehydrogenation reaction of FA on Pd/TC using 10 mL FA 0.5 M solution with added amounts of solid SF (20 mg of catalyst, 25 °C).
Hydrogen 01 00003 g010
Figure 11. Initial TOFs and final H2 yields during the recyclability tests for the FA:SF = 3:1 system using 20 mg Pd/TC, 10 mL FA 0.5 M + 1.66 mmol SF, at 25 °C.
Hydrogen 01 00003 g011
Table 1. Catalytic performance of Pd/TC in the dehydrogenation of FA at different concentrations (20 mg of catalyst, 30 mL of FA solution, 25 °C).
FA ConcentrationPd:FA Ratio X FA 24 h (%)TOF (h−1)
Initial
(t = 2 min)
at X F A = 4 %
0.5 M1:80015.3315.735.6
1.0 M1:16006.8939.238.5
2.0 M1:32004.7143.734
FA 98%1:42,200000
Table 2. Catalytic performance of Pd/TC in the dehydrogenation of FA at different reaction temperatures (20 mg of catalyst, 10 mL FA 0.5 M, Pd:FA = 1:270).
Temperature (°C) t X F A = 50 % [a] (h)TOF10 min [b] (h−1) X FA 24 h (%)
2510.132.763.3
4011.167.954.4
601.6218.860.1
[a] Time to reach 50% FA conversion. [b] Corresponding to FA conversion values below 10%.
Table 3. Generated gas volumes, turnover frequency (TOF) values, and H2 yield (Φ) in the case of different FA–sodium formate (SF) solutions with a total concentration of 0.5 mol/L, at 25 °C.
System
[FA] + [SF] = 0.5 mol/L
Vgases (mL)TOF10 min (h−1)Φ4h (%)Φ24h (%)
FA154.632.735.463.3
FA:SF = 3:1117.464.029.448.1
FA:SF = 1:182.168.621.533.6
FA:SF = 1:360.077.315.224.6
SF38.03.24.915.6
Table 4. Generated gas volumes, TOF values, and H2 yield (Φ) in the case of increasing added amounts of SF to 10 mL 0.5 M FA solution, at 25 °C.
System
(5 mmol FA + nSF)/10 mL Solution
Vgases (mL)TOF10min (h−1)Φ4h (%)Φ24h (%)
FA154.632.735.463.3
FA:SF = 3:1166.860.138.751.3
FA:SF = 1:1232.0173.143.047.5
FA:SF = 1:3369.2282.125.337.8
Publisher’s Note: MDPI stays neutral with regard to jurisdictional claims in published maps and institutional affiliations.

