Article

Home Range, Movement and Activity Patterns of Six vulture Species Using Satellite Telemetry in Saurashtra landscape, Gujarat, India

1
Wildlife Division, Sasan-Gir, Junagadh 362135, GJ, India
2
Wildlife Circle, Junagadh 362001, GJ, India
3
Principal Chief Conservator of Forests (Wildlife) & Chief Wildlife Warden, Gandhinagar 382010, GJ, India
4
The Corbett Foundation, P.O. Tera, Taluka Abdasa, Kutch 370660, GJ, India
*
Author to whom correspondence should be addressed.
Ecologies 2022, 3(4), 492-507; https://doi.org/10.3390/ecologies3040035
Submission received: 30 July 2022 / Revised: 8 October 2022 / Accepted: 10 October 2022 / Published: 18 October 2022

Abstract

:
The information on the ranging behaviour and migration pattern of vultures is of critical conservation importance. Vultures’ range over vast areas in human-dominated landscapes where anthropogenic activities may influence their long-term survival. This paper uses the satellite telemetry of 11 individuals of six vulture species to assess their home ranges and seasonal movement patterns. The study aimed to find daily and monthly distances covered by vultures, their home range size, and the influence of breeding season on resource utilisation and activity rates. A total of 114,820 locations were collected between October 2020 and November 2021. The results indicate that the size of the core area is smaller during the breeding season of the resident species, such as the Indian vulture (Gyps indicus), white-rumped vulture (Gyps bengalensis), and red-headed vulture (Sarcogyps calvus) than the non-breeding season. vulture’s daily and monthly movement (mean) also decreased in the breeding season. The annual home range and core areas, calculated as 95% and 50%Utilisation Distribution differed between breeding and non-breeding seasons. The migratory vultures moved significantly longer distances across days and months than the resident species. Their annual migration patterns also differed with respect to time and migration routes.

1. Introduction

Vultures are the only extant vertebrate obligate scavengers, having evolved highly characteristic physiologies and behaviours to exploit spatially rare and temporally short-lived food resources [1,2,3]. The vulture population in South Asia has faced the most rapid decline ever recorded for any species [4,5,6,7,8,9,10,11]. In 1999, a decline of more than 95% for Gyps vultures was reported in Keoladeo National Park, Rajasthan, India [4]. Rapid declines were similarly noted in Pakistan [5,6,7] and Nepal [8,9]. Similar declines in Egyptian vulture (Neophron percnopterus) and red-headed vulture (Sarcogyps calvus) were documented throughout India [10]. Veterinary use of diclofenac, a Non-Steroidal Anti-Inflammatory Drug (NSAID), was identified as the main factor responsible for the decline of vultures in South Asia [5,6,7,11].
Being obligate scavengers, vulture species have evolved behavioural adaptations to locate scarce and unpredictable food resources [12,13]. Daily and seasonal movement patterns can provide insights into vultures’ strategies to locate and utilise scarce food resources. The movement patterns and spatial ecology of vultures have been studied both in the New and the Old World. The study by Alarcón and Lambertucci [14] reported a total of 97 telemetry studies covering a 30-year period (1987–2017), with an overwhelming increase in the number of studies occurring in the last decade.
Of the nine critically endangered vulture species occurring worldwide, only four of them have been studied using telemetry [14]. India has nine vulture species in the wild [15], and four are listed as globally critically endangered [16]. However, the spatial ecology of vultures in India is surprisingly lacking. In a first attempt, the experimental release of eight white-rumped vultures and two Himalayan griffons deployed with Global System for Mobile communication (GSM) transmitters was undertaken in 2018 to assess the survival of the released birds for the future release of captive vultures in India [17]. Similarly, six captive-reared white-rumped vultures deployed with Global Positioning System (GPS) transmitters were released in Nepal to assess their assimilation in the wild [17,18]. Over the following years, 11 more individuals of white-rumped vultures were deployed with GPS transmitters in Nepal [18]. To date, no quantitative assessment of vulture home ranges, movement and activity patterns of resident and migratory vultures have been examined in India.
In this study, we present preliminary results from the satellite tracking of 11 vultures belonging to six species across India. Of six tagged species, the Indian vulture, white-rumped vulture, and red-headed vulture are listed as critically endangered, the Egyptian vulture (Neophron percnopterus) as endangered, Himalayan griffon (Gyps himalayensis)as near threatened and Eurasian griffon (Gyps fulvus) as least concern [16]. The Indian vulture, white-rumped vulture and red-headed vulture are resident vultures within the study area, while the Himalayan griffon and Eurasian griffon are winter migrants, and Egyptian vultures are also winter visitors and breeds in India [15]. This study aims to provide information on the ranging behaviour of resident and migratory individuals, focusing on daily and monthly movements, home range size, variation in space use across breeding and non-breeding seasons, and seasonal activity rates. Only a handful of studies have examined variation in the space use of vultures at a fine temporal scale (e.g., daily and monthly) [19]. In this study, we predict that resident and breeding vultures would exhibit greater variation in space use and activity rates by spending more time at nests and ranges across smaller areas during the breeding season than in the non-breeding season. We also predict seasonal variations in space use of migratory vultures across their breeding and non-breeding ranges over an annual cycle, where they would restrict movement patterns central to their breeding and roosting sites in the breeding season.

2. Materials and Methods
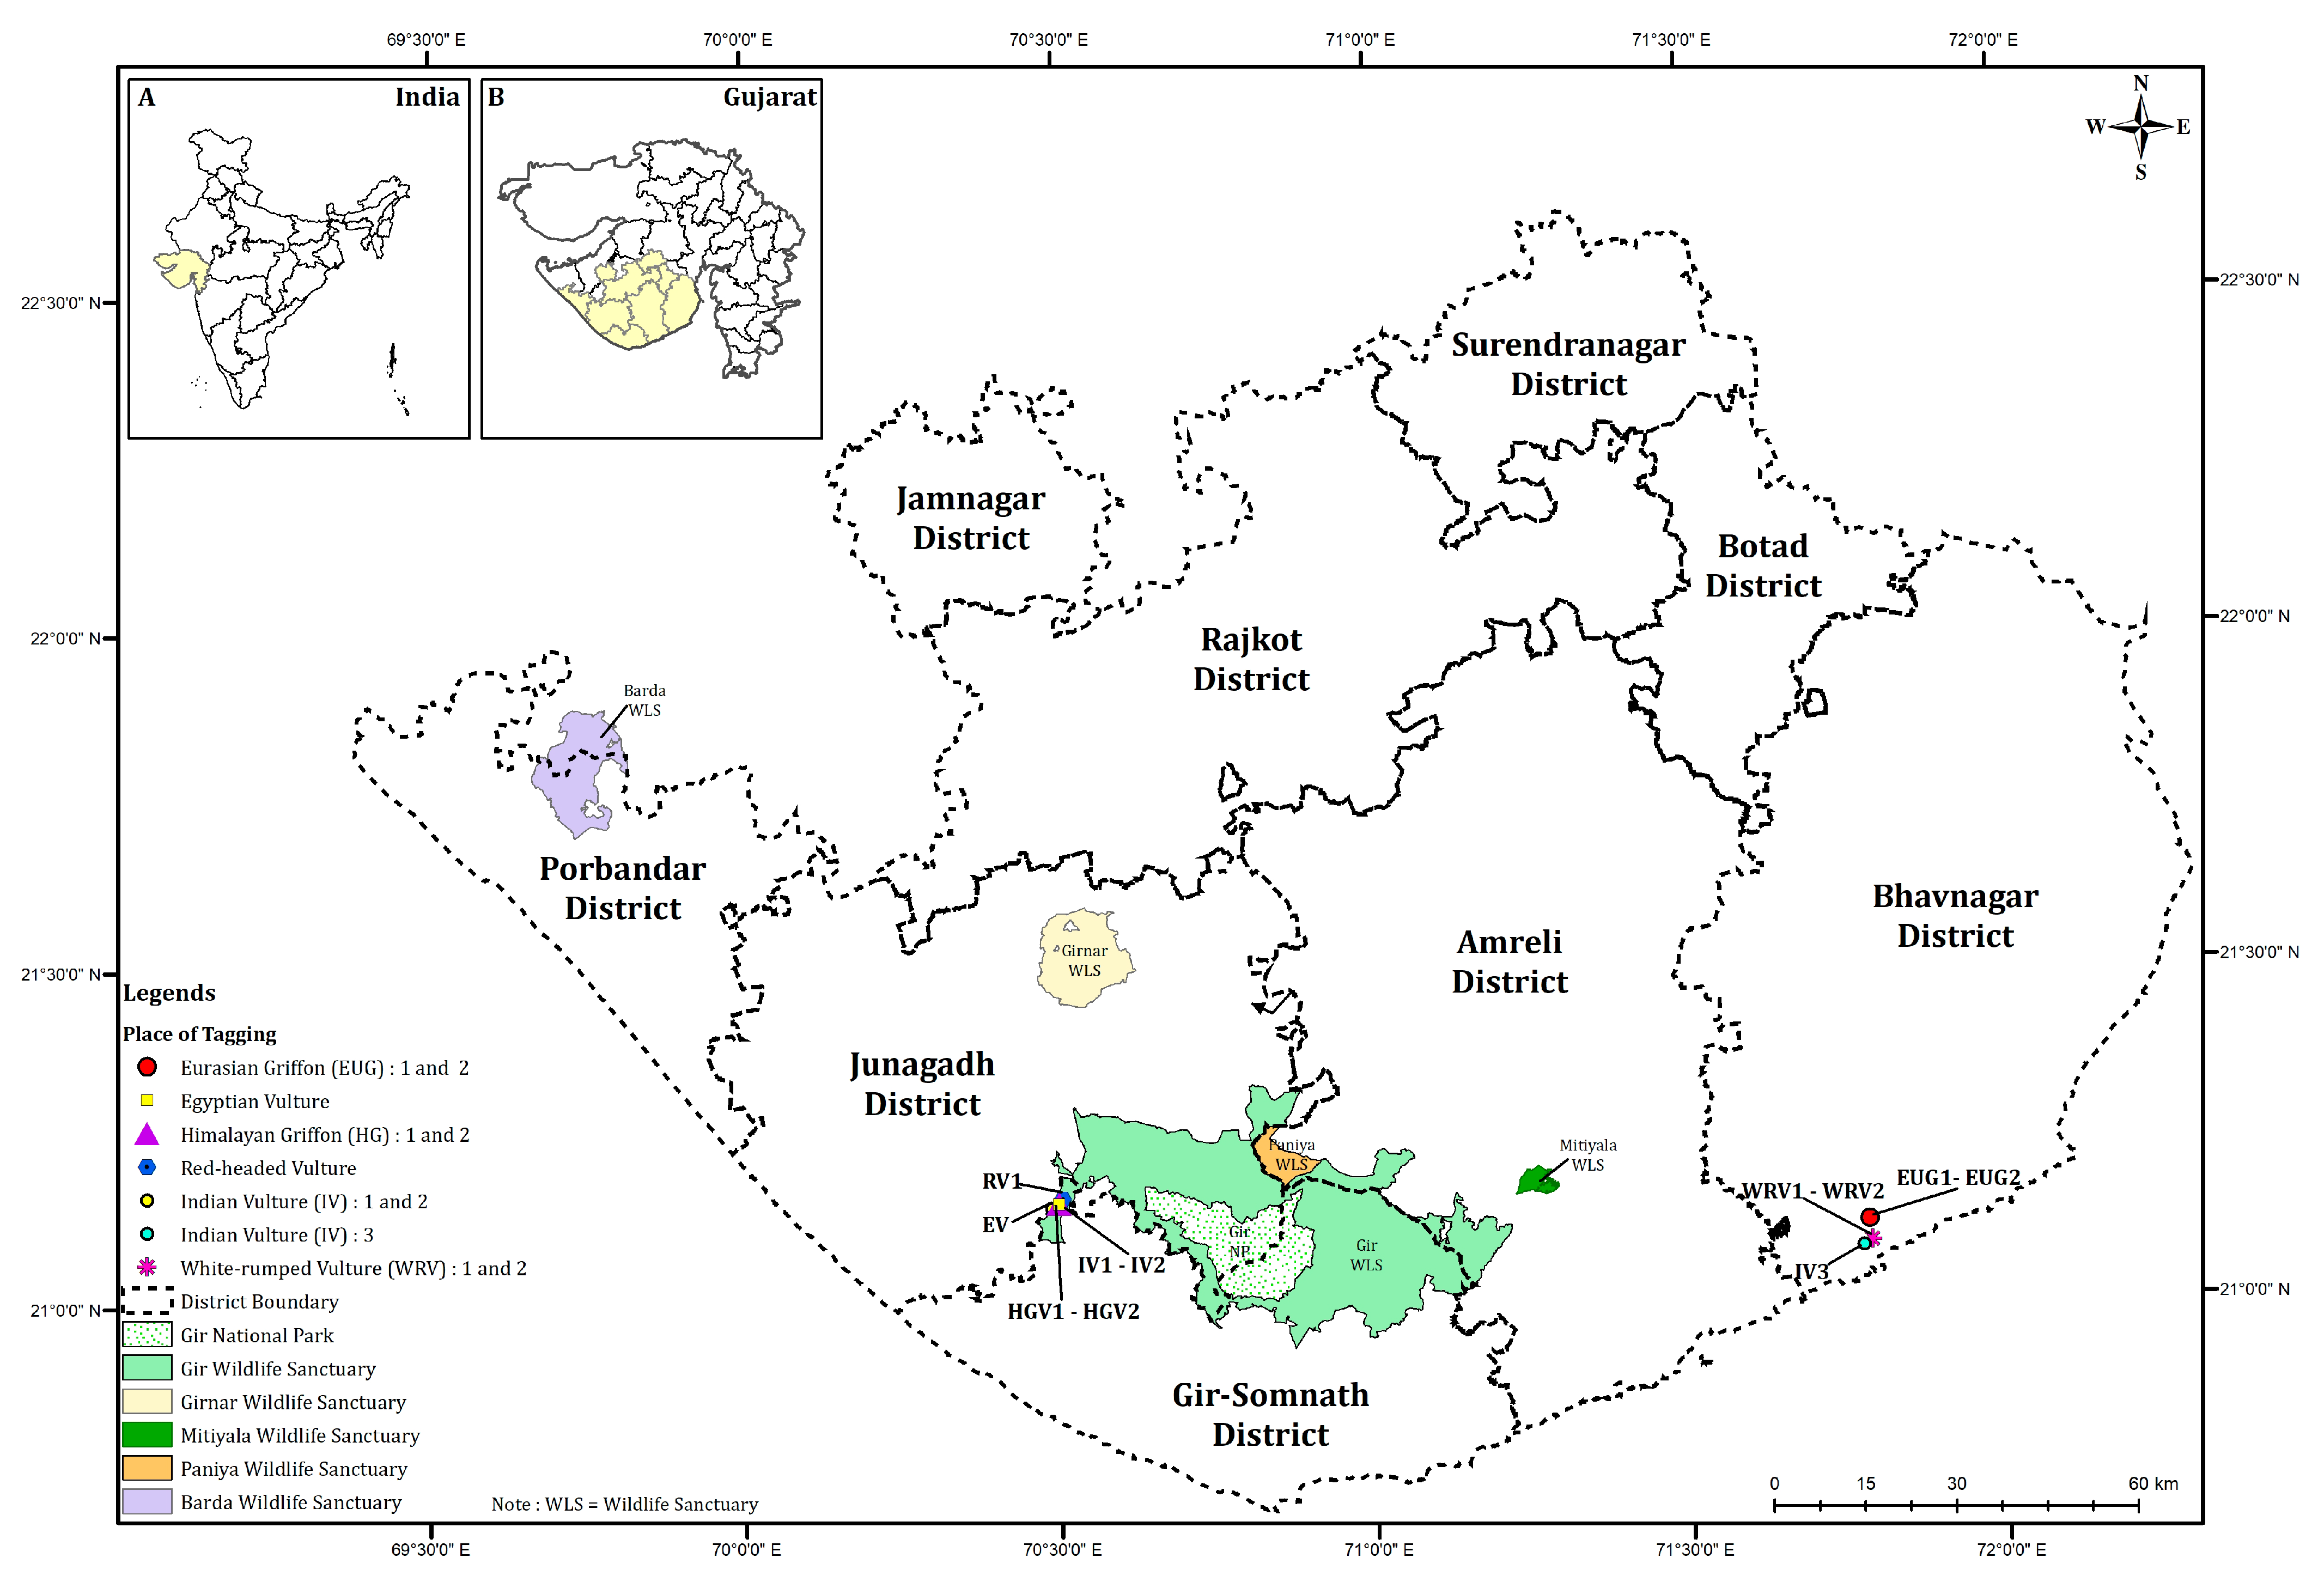
2.1. Study Area

The Asiatic Lion Landscape (ALL) is a multiple land-use area within the southwestern part of the Saurashtra region of Gujarat, India [20] (Figure 1). This landscape includes five protected areas (Gir National Park, Gir Wildlife Sanctuary, Paniya Wildlife Sanctuary, Mitiyala Wildlife Sanctuary, Girnar Wildlife Sanctuary) and other forest classes, making it a total of 2058 km2 (1879.13 km2 Gir PAs + 178.87 km2 Girnar Wildlife Sanctuary) [21]. In addition to the above, many small protected, reserved, and unclassed forests occur in and around the sanctuaries. The landscape includes nine districts of the Saurashtra region, covering a total expanse of ~30,000 km2 (Figure 1).
The landscape represents a typical semiarid biogeographical zone [22]. The area is characterised by three seasons: dry and hot summer (March–June), monsoon (July–October), and primarily dry winter (November–February). Livestock rearing, agriculture, and horticulture are the main economies of the region [20]. The landscape outside the Protected Areas is traversed by national and state highways, district and village-level roads, and railway lines [20].

2.2. Vulture Trapping and Tagging

All scientific research activities involved in this study were carried out following the approval from the Ministry of Environment, Forests and Climate Change (MoEF&CC), Government of India (Letter No: F.No. 1-27/2020 WL, dated 14 July 2020). All experimental methods and works were carried out in accordance with relevant guidelines and regulations suggested by the Principal Chief Conservator of Forests (Wildlife) & Chief Wildlife Warden, Gujarat Forest Department, Government of Gujarat.
The different species of vultures were captured by professional bird trappers having more than 45 years of bird trapping experience for scientific studies. They used different traditional techniques to capture vultures based on the species and site-specific situations. The traps were generally set before dawn, and trappers sat in the hide before sunrise. These traps were then monitored continuously from different vantage points of nearby areas as well as from the hide. A quick response team was also kept on standby, in proximity to the Kenwood wireless walky-talkies, to immediately release the targeted/non-target birds if captured in the traps. Different types of GPS/GSM transmitters were deployed on different vulture species (Supplementary Material S1). The transmitters were deployed with the 11 mm Teflon harness by following a thoracic X-strap method having a flat knot in the Teflon near the sternum, which was additionally stitched in the harness by dental floss. All precautions were taken to cause minimum disturbance to the birds, and COVID-19 guidelines issued by the State and Centre Government were also followed. During the tagging, a team of two persons helped in holding the bird from its head and legs so that the person busy with tagging was safe and could work well. Whenever required, the bird’s head was covered with specially designed headgear to calm it. The headgear allowed it to breathe easily and kept it safe from choking. During the tagging process, the bird was always kept in the shade to maintain the bird’s body temperature below the risk level of 44 °C, and one person continuously monitored the bird’s temperature with the help of an infrared thermometer. Solar-powered GSM/GPS satellite transmitters were deployed on eleven individuals as backpacks with 11 mm Teflon ribbon (Supplementary Material S1). The transmitters weighed less than 3% of the body mass of the vultures. Nine transmitters (Ornitela) used the GSM (cellular phone) network to transmit the data. Two transmitters deployed on two Eurasian griffon vultures from Microwave Telemetry used Argos Satellite Data Collection Relay System (CLS America, Lanham, MD, USA).

2.3. Data Collection and Preparation

The GPS/GSM transmitters deployed on 11 individuals recorded fixes at variable intervals with variable frequencies. The frequency of fixes is influenced by an array of environmental conditions and bird activity [23]; thus, the frequency of fixes increases during the daytime, reaching the peak by mid-day and decreasing towards evening with low vulture activity. However, despite the variable fix rates provided by transmitters, as long as the fix rates are influenced by the environmental conditions and the bird activity in a consistent fashion, the comparison between individuals and across seasons can still be achieved [19]. The transmitters reported location in degree decimal format (latitude/longitude), speed (km/hour), altitude (meters above sea level), UTC timestamp (d-m-y h:m:s), direction (degrees), and temperature (Celsius). Additionally, transmitters provided horizontal dilution of precision (HDOP), and a number of satellites (SATCOUNT) were used to obtain each GPS fix. The horizontal error rate was ±23 m as per the manufacturer’s statistic. Because the tagging of vultures varied across months (Supplementary Material S1), we standardised our data to include only the fixes obtained in equal timeframes for statistical comparison among species and across seasons, months and annual cycles. To compare monthly space use (core areas), we discarded the data for incomplete months. For the Indian vulture, we included the data from 1 November 2020 to 30 November 2021, 1 November 2020 to 30 April 2021 and 1 December 2020 to 30 November 2021 for the three tagged individuals, respectively. Similarly, one of the white-rumped vultures died on 10 May 2021, and thus comparisons between two tagged white-rumped vultures were made for only five months (1 December 2020 to 30 April 2021). The transmitter on one of the Himalayan griffons stopped working three months after its deployment on 14 January 2021, and data were available until 25 March 2021; thus, comparisons between them were only made until March 2021.

2.4. Home Range Estimation

We filtered the data to remove the outliers and other inconsistent fixes, such as locations with negative elevation values, records with missing coordinates, missing time stamps and elevation values of more than 6000 m. We estimated utilisation distribution (UD)) with R package adehabitatHR [24] in R [25] (Supplementary Material S2) and compared core areas (50% UD) across the temporal scale for resident individuals.

2.5. Activity and Movement Patterns

We projected location fixes in UTM projection (UTM Zone 43N) and calculated the daily and monthly distance travelled by each of the eleven individuals using the Tracking Analyst tool (ESRI, Redlands, CA, USA) in ArcGIS version 10.8.1, Redlands, ESRI, California, USA [26]. The distance travelled (minimum, maximum and mean) was determined by calculating straight line distance between consecutive GPS fixes and then divided by months and days [26]. The daily activity patterns were quantified by comparing the proportion of fixes as stationary or in flight. For comparing activity patterns, we included only daytime fixes between sunrise and sunset. We used the R package ‘RAtmosphere’ [27] to characterise each GPS fix as day or night based on location-specific estimation of sunrise and sunset [19]. We characterised GPS fixes with an instantaneous speed of >1 km as ‘in flight’ or otherwise as ‘stationary’ [19].

3. Results

We collected a total of 114,820 location fixes for eleven vulture individuals by the end of November 2021 and retained 110,956 fixes (96%) for further analysis after implementing refinements as described previously. Using these locations, we estimated monthly and annual home ranges, monthly and daily distance travelled and activity patterns. We calculated the seasonal home ranges of migratory vultures in their breeding and non-breeding ranges.

3.1. Annual Home Ranges

All three Indian vultures remained within the study area and showed substantial overlap in their annual home ranges (Supplementary Material S3). Among resident vultures, all three Indian vultures had the largest home range size compared to the white-rumped vulture and red-headed vulture (Table 1). The white-rumped vultures had almost the same sized home ranges and differed in core area size. The Egyptian vultures had a larger home range and core area in Rajasthan compared to Saurashtra (Table 1).
For Himalayan griffon-1, we calculated three home ranges—two in Saurashtra (Gujarat) and one in Pakistan (Supplementary Material S3). The first home range polygon was calculated in January 2021, when Himalayan griffon-1 was present within the study area (Saurashtra landscape), the second polygon in central Gujarat (February 2021), and the third in Pakistan (March 2021). The largest home range size was estimated in Pakistan, and the smallest home range size was observed in Gujarat (Table 1). In the case of Himalayan griffon-2, the largest home range size was estimated in Saurashtra (Gujarat), and then in Kyrgyzstan (Table 1).
We calculated two home range polygons for Eurasian griffon-1. The first in Saurashtra (Gujarat) during the winter season (February–March) and the second in Kazakhstan during the summer season (May-July) (Supplementary Material S3). Eurasian griffon-1 had a larger home range and core area in Kazakhstan compared to Saurashtra (Table 1). For the second individual, only one home range polygon was calculated in its breeding grounds located in Russia (Supplementary Material S3). The movement patterns for the second Himalayan griffon during the winter season in India were unstable, leading to an unreliable estimate of the home range.

3.2. Seasonal Variation in Core Areas

Resident vultures exhibited seasonal variations in the use of core areas (50% UD) between breeding and non-breeding season. The average (mean ± SE) core area size of Indian vulture-1 in the breeding season was smaller (187.61 ± 50.81) than in the non-breeding season (3888.92 ± 607.37). IV2 died in May 2021, and the carcass was recovered within a few days after cyclone ‘Taukte’ hit the area; hence we could not further compare the breeding and non-breeding core areas used. However, Indian vulture-2 did not show any variations in core area size across six months of its tagging. Indian vulture-3 utilised had a smaller core area of 849.08 ± 225.60 in the breeding season than in the non-breeding season (1824.86 ± 340.03). The average core area size (4.76 ± 1.79) in the breeding season of white-rumped vulture-1 was also smaller than in the non-breeding season (43.24 ± 9.63). White-rumped vulture-2 died in May 2021, and data was not available for the non-breeding season. In red-headed vultures, core area size varied between breeding (98.97 ± 11.85) and non-breeding seasons (998.08 ± 217). Similarly, space use also differed in Egyptian vultures across summer and winter seasons.

3.3. Monthly and Daily Movement

Monthly average distances did not vary for Indian vultures (Table 2). Indian vulture-1, Indian vulture-2, and Indian vulture-3 flew at an average elevation of 697 ± 3.38 (range: 138–3967), 570 ± 3.89 (range: 113–3679), and 562 ± 2.82 m above sea level (range: 123–4577). White-rumped vulture-1 covered a larger monthly distance (mean ± SE) than white-rumped-2 (Table 2). The two white-rumped vultures flew at an average elevation of 169 ± 2.42 (range: 33–2535) and 155 ± 3.15 (range: 36–1883) meters above the mean sea level. The red-headed vulture covered a monthly average distance of 1191 ± 155 km and flew at an average elevation of 255 ± 1.14 m above sea level (range: 93–1484), while the Egyptian vulture covered an average distance of 1084 ± 181 km per month (Table 2) and flew at an average elevation of 306 ± 2.34 m above sea level (range: 102–2484).
Among resident vultures, the Indian vulture covered more distance than the individuals of other species both across months and days. Similarly, non-resident vultures moved more than resident vultures. Eurasian griffon-2 covered more distance than Eurasian griffon-1 both across months and days. Himalayan griffon-1 covered an average distance of 1864 ± 880 km per month, and Himalayan griffon-2 covered an average distance of 3348 ± 570 km per month. Since the transmitter on Himalayan griffon-1 stopped working by the end of March 2021 (25 March 2021), the values are available only for three months (January, February, and March 2021).
We calculated the average daily distance (mean ± SE) covered each month for all individuals. The Indian vultures more distance per day in February, March, April, and May, respectively (Table 3). White-rumped vultures covered a shorter distance per day compared to Indian vultures. The highest daily distances were recorded in February, March, and May. The red-headed vulture and Egyptian vulture covered almost similar distances per day across all months (Table 3).
The average daily distance travelled by non-resident vultures was more than the resident species. Both the Himalayan griffons covered almost the same distance per day (Table 3). Expectedly, the highest daily distances were covered during migration. (Table 3). During migration from India, Himalayan griffon-2 covered more distance per day in April and on its return journey, the highest daily distance was covered in September 2021 (Table 3). Eurasian griffon-1 and Eurasian griffon-2 covered more daily distances than Eurasian griffon-1 (Table 3). Eurasian griffon-1 covered the highest daily distance during its migration from India in May and in September while migrating back to India. Likewise, Eurasian griffon-2 covered more distance per day during migration. The highest daily distance covered varied in April and October.

3.4. Activity Patterns

Resident vultures showed a significantly higher proportion of fixes in rest state than non-resident vultures (χ2 = 32.50, df = 8, p = 0.0001). Indian vultures spent more time in rest state during breeding season compared to non-breeding season (χ2 = 18.57, df = 4, p = 0.0001). Careful examination revealed that the frequency of inflight fixes increased in February, March, and April in Indian vultures (Supplementary Material S4). White-rumped vulture-1 showed a high frequency of inflight fixes in February and March. Overall, White-rumped vulture-1 showed a significantly high rate of inflight fixes in the non-breeding season (χ2 = 15.10, df = 4, p = 0.005). Since White-rumped vulture-2 died in May 2021, no comparisons were made. The red-headed vulture showed a significantly low frequency of inflight fixes compared to rest fixes (χ2 =24.78, df = 10, p = 0.005). The monthly frequency of inflight fixes was lower for the Egyptian vulture than its fixes in the rest state. Overall, among resident vultures, Indian vulture-2 spent a high proportion of daytime fixes in flight (45.25%), and White-rumped vulture-2 spent minimum time in flight (24.87%) (Supplementary Material S4). However, such a low frequency of inflight fixes in White-rumped vulture-2 may be due to the fewer data available for White-rumped vulture-2 due to its death in May 2021. Himalayan griffon-1 and Himalayan griffon-2 were the most active individuals spending 56% and 45% of the daytime in flight (Supplementary Material S4).

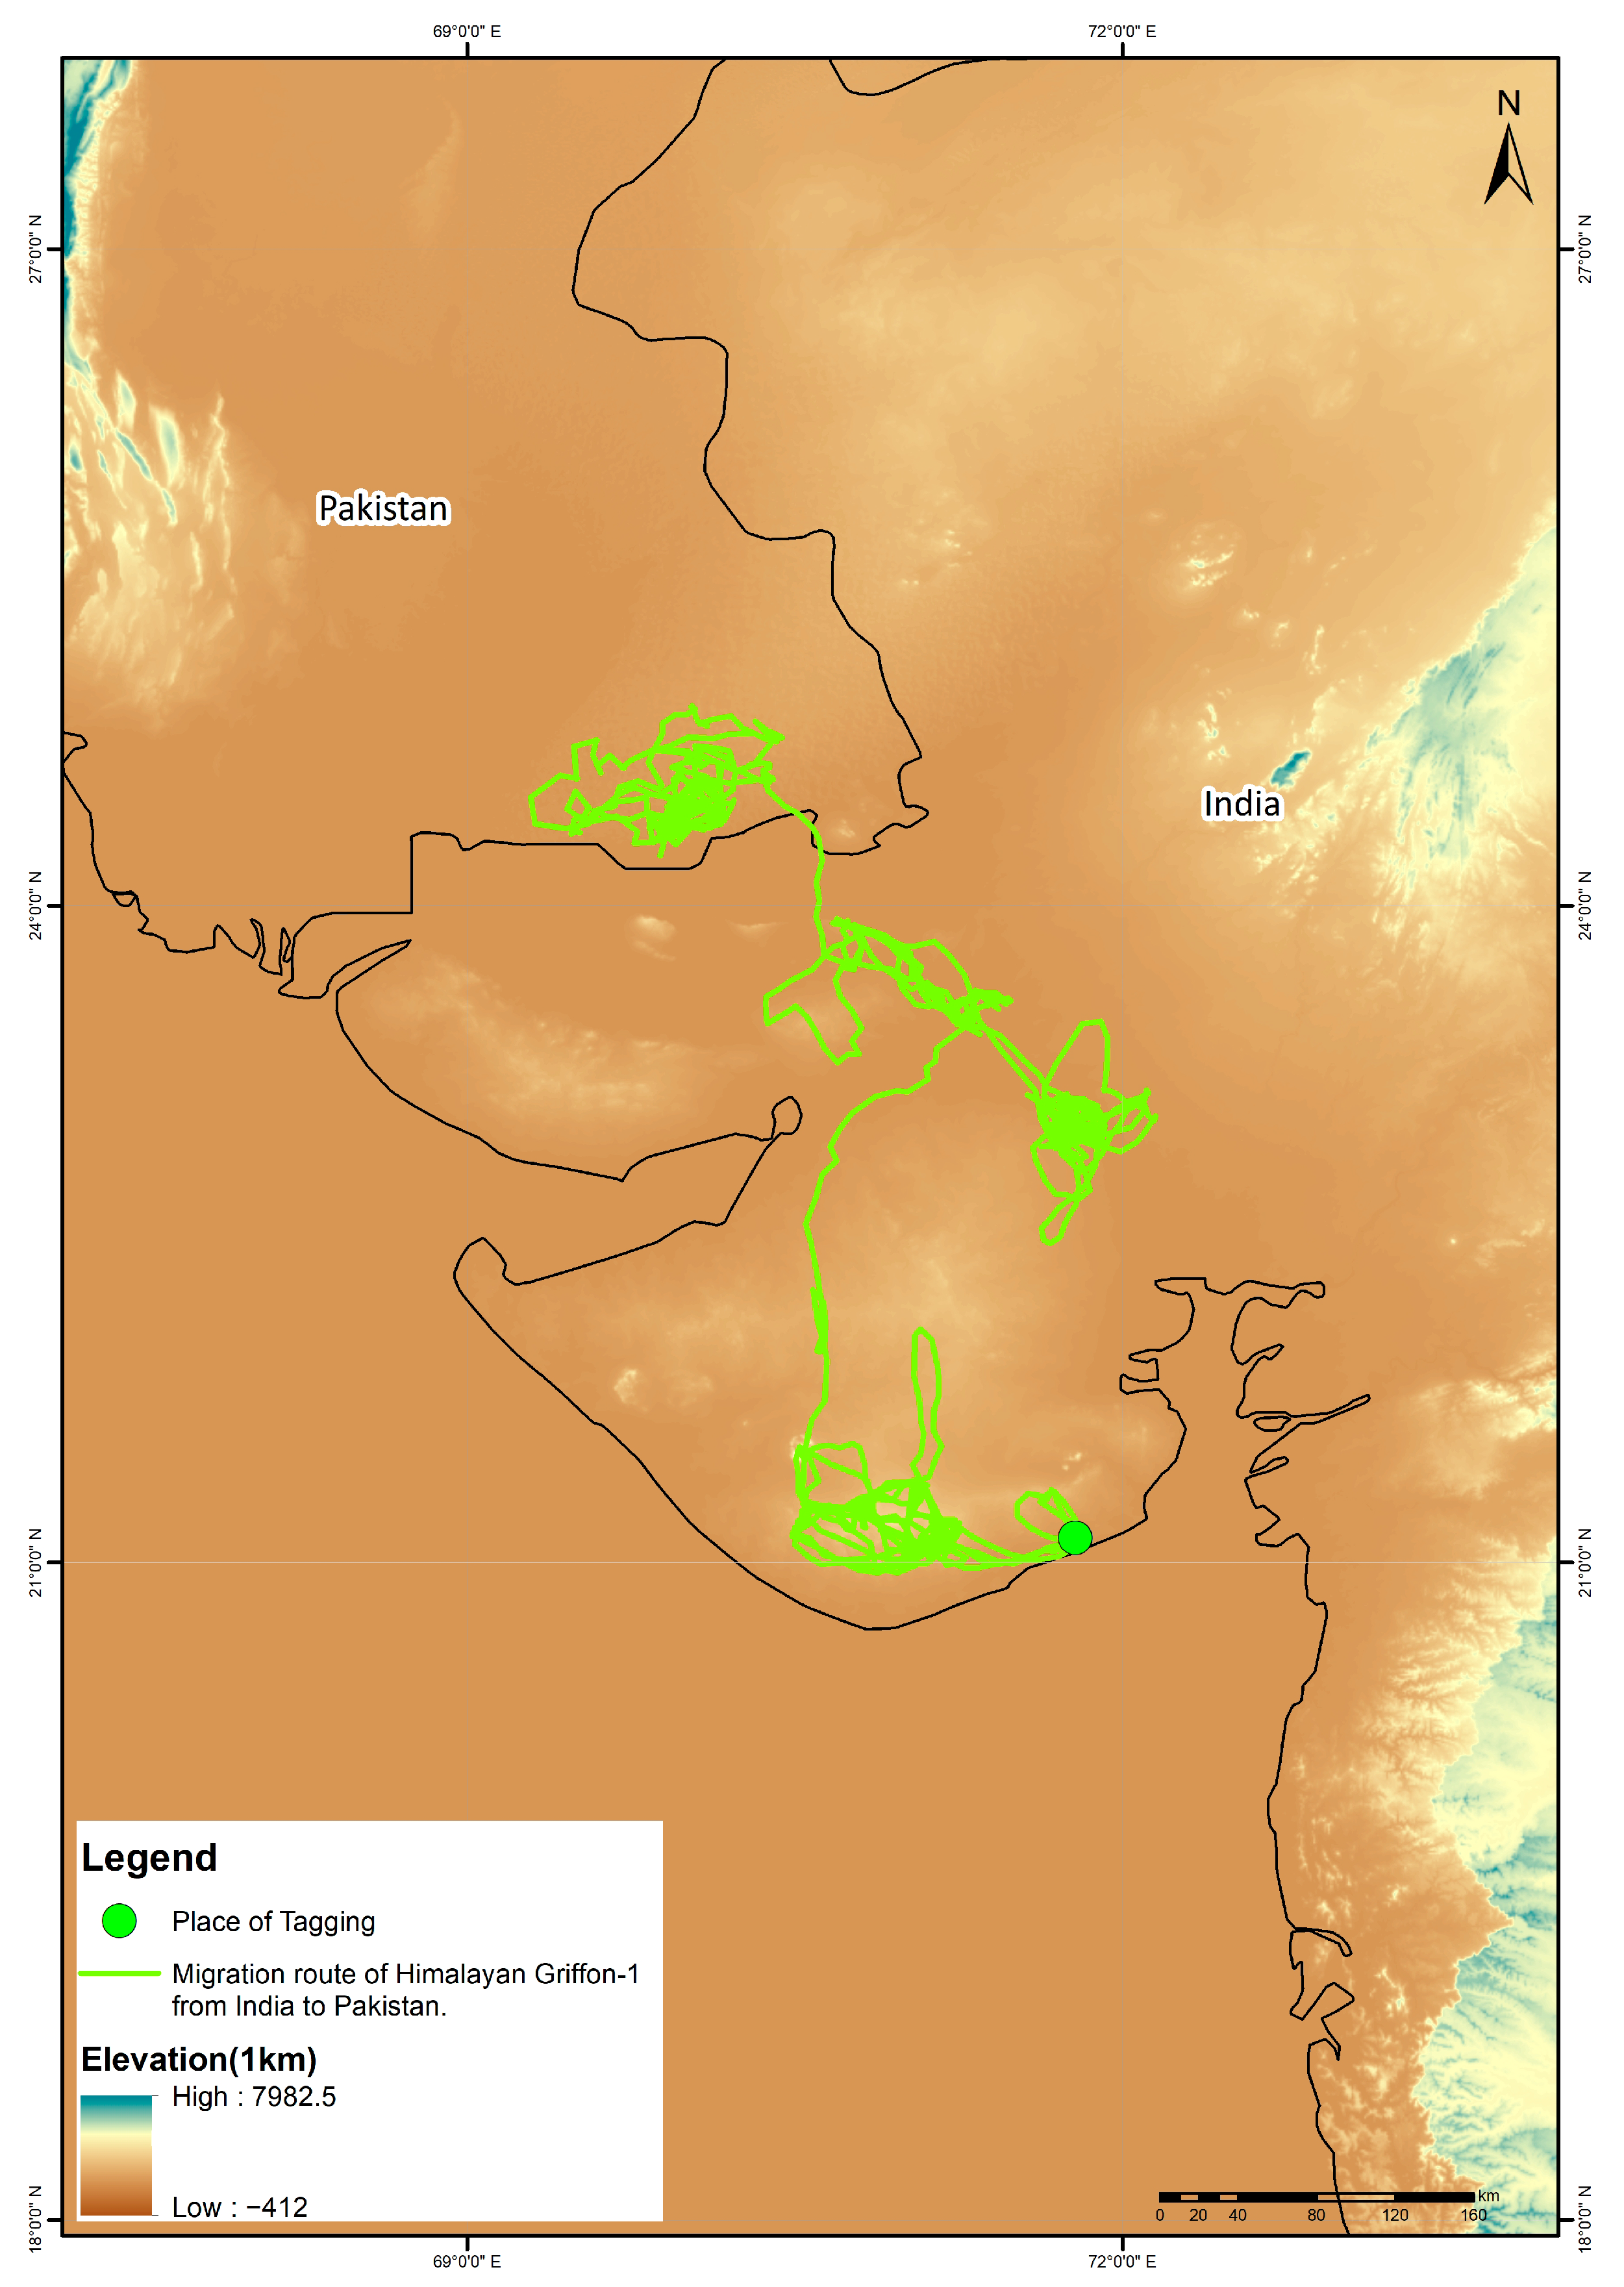
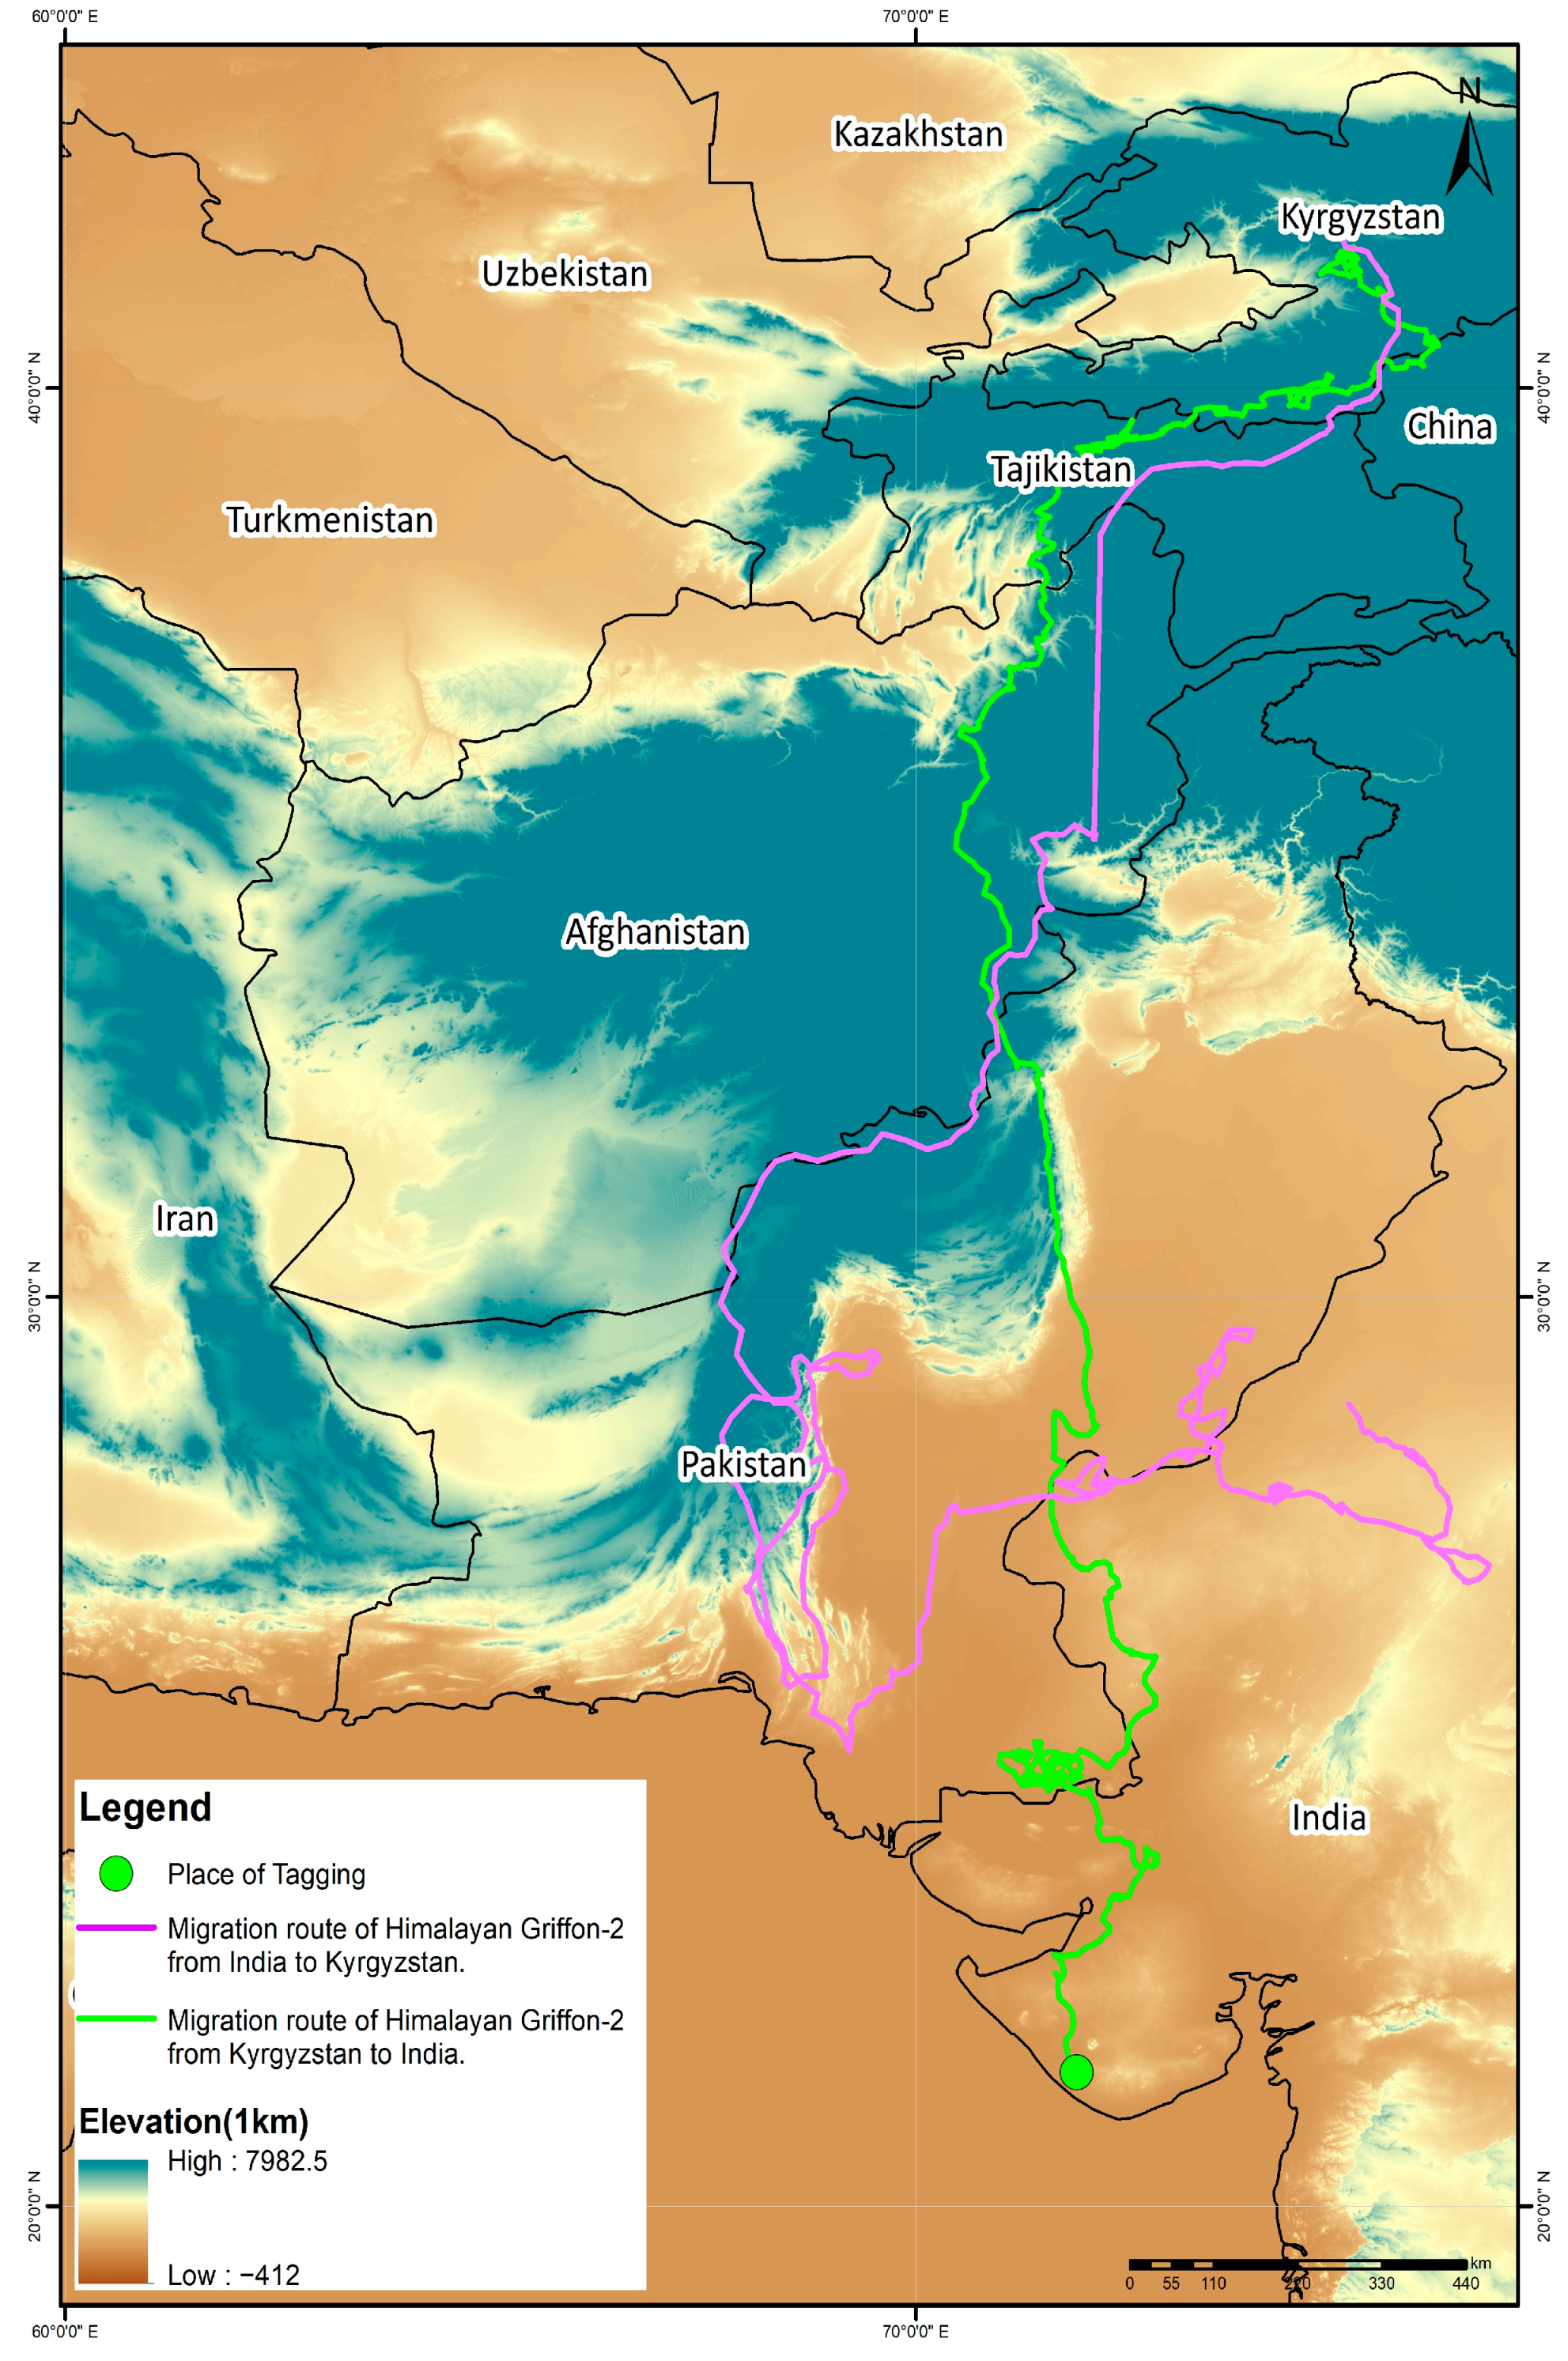
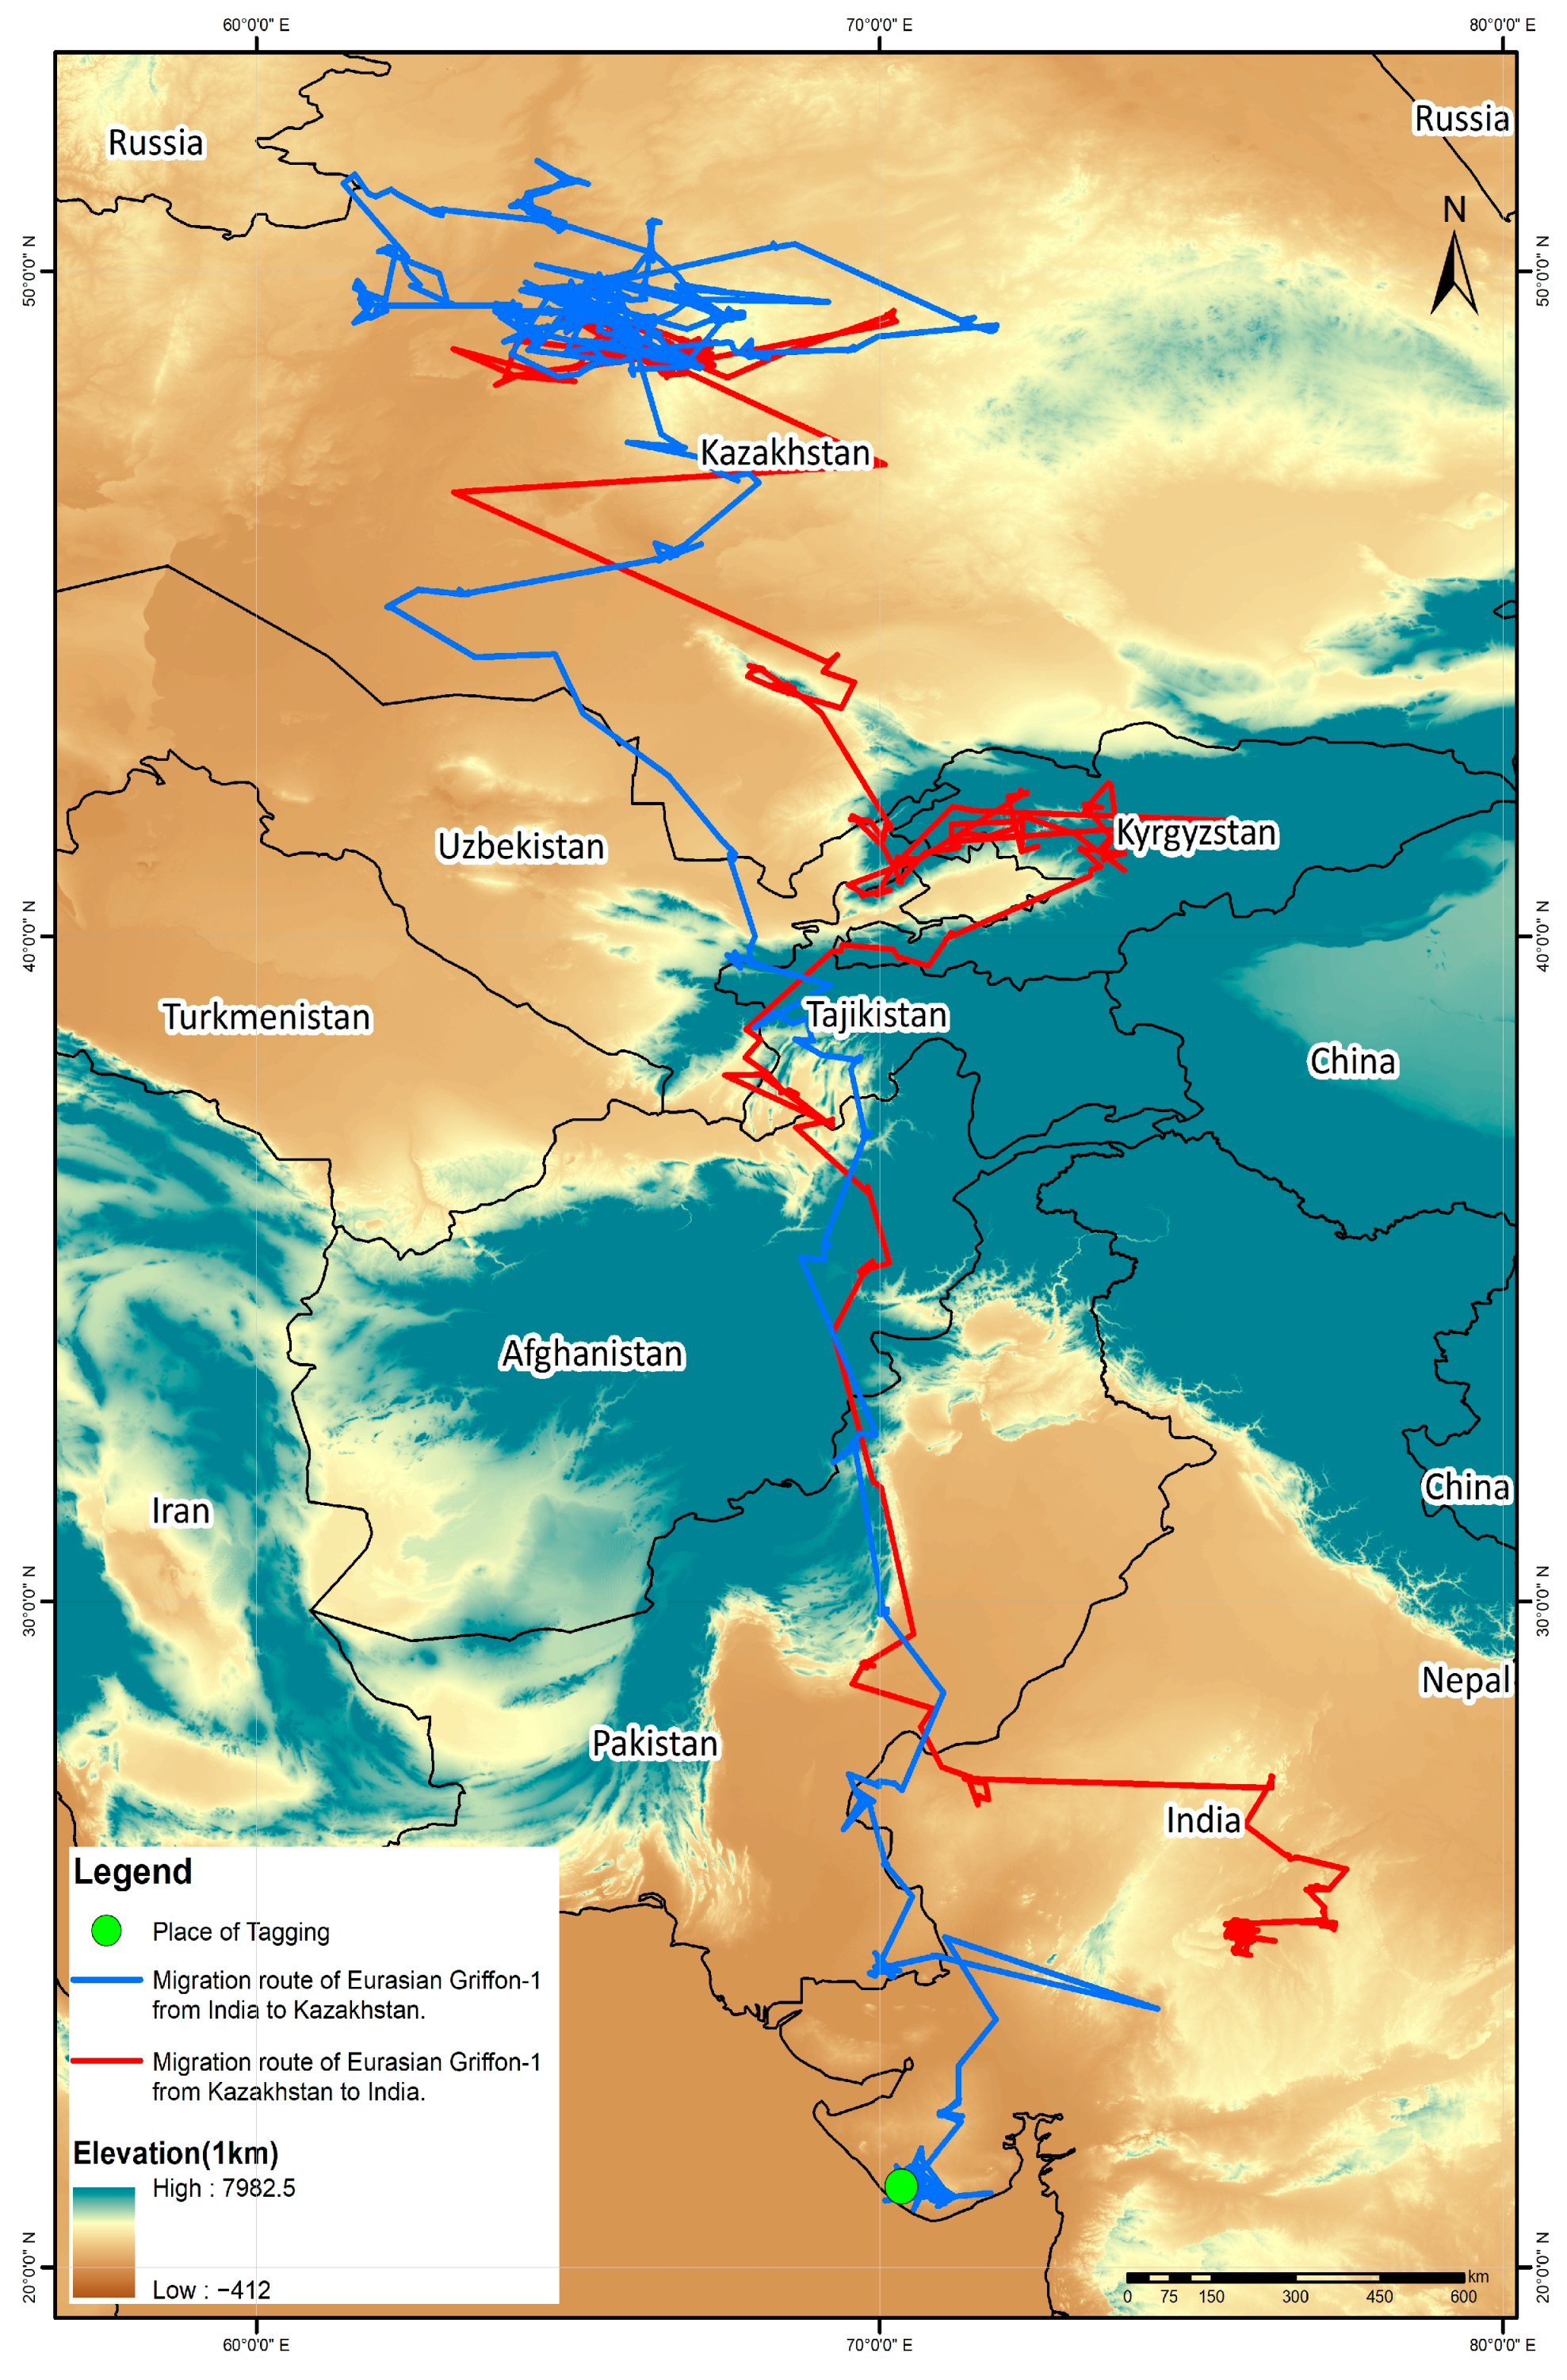
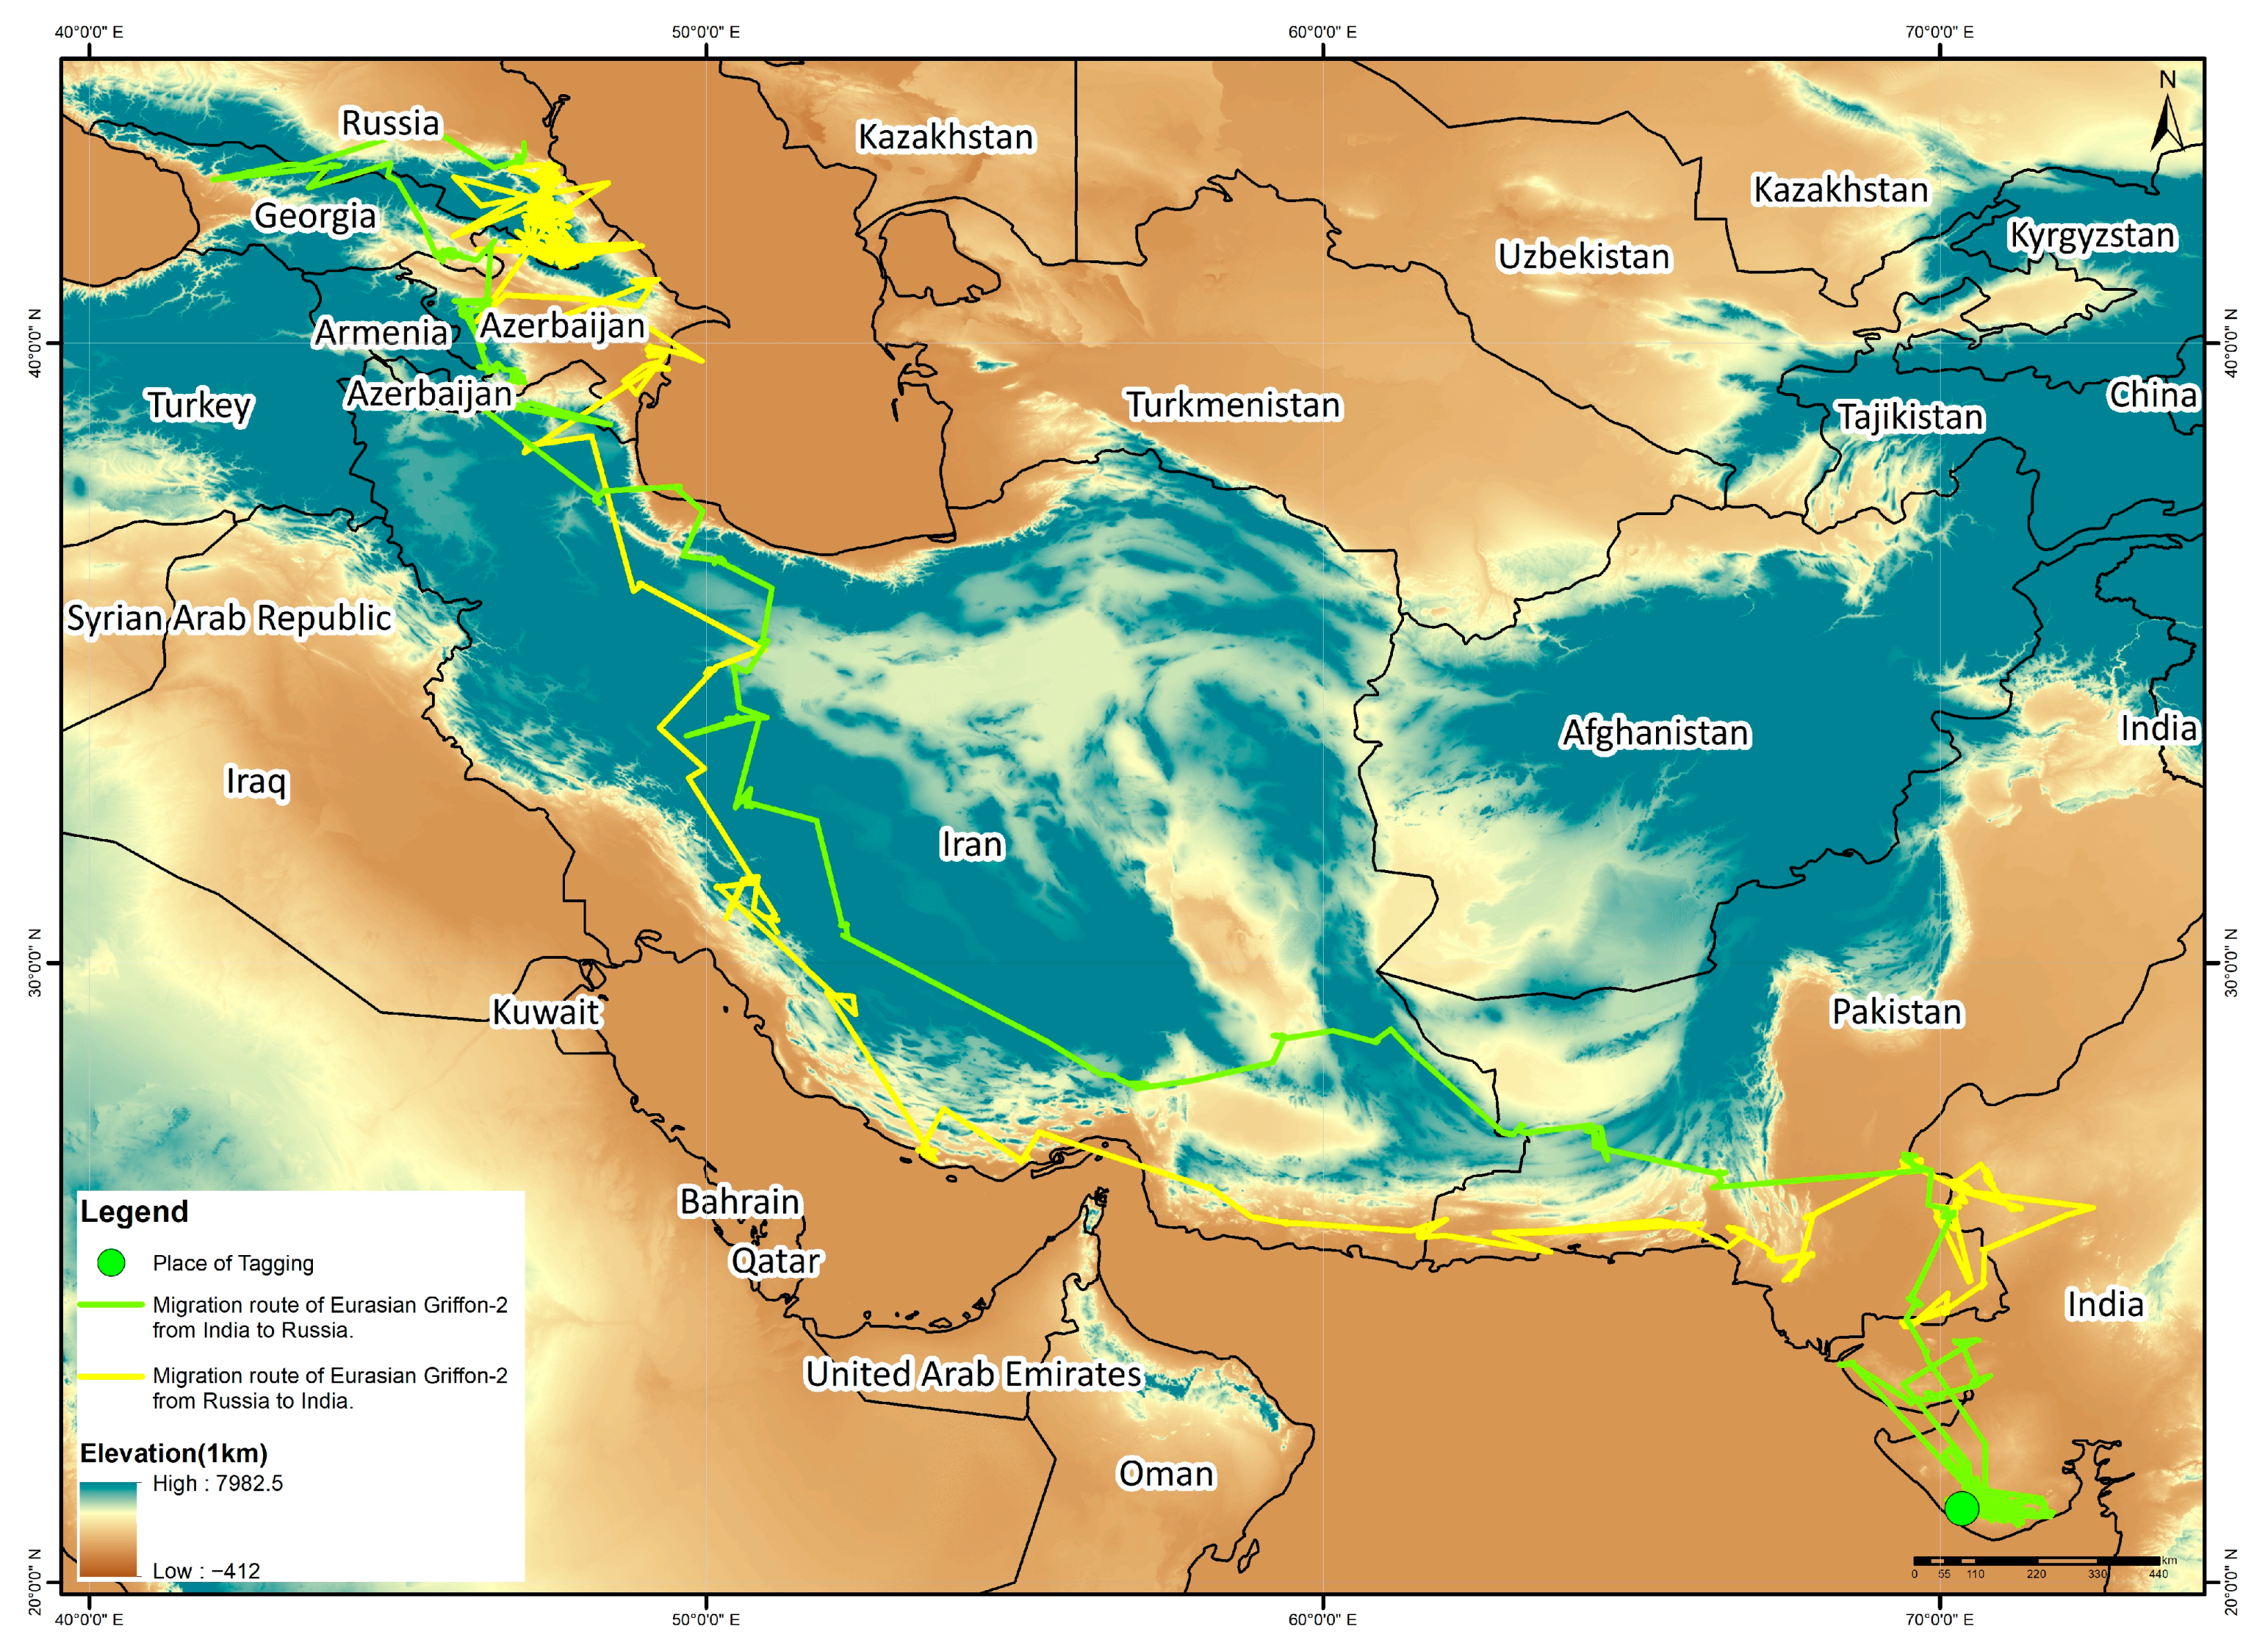
3.5. Migration Pattern

Himalayan griffon-1 started migrating by 12 February 2021 from the study area towards the north (Figure 2). It stayed in central Gujarat in Surendranagar district until the end of February 2021 and started migrating towards Pakistan. It reached Pakistan on 11 March 2021, crossing over northwest Gujarat (Kutch district) (Figure 2).
The transmitter encountered an error and could not broadcast a signal from the end of March 2021, and thus we lost the tracking details. It flew at an average altitude of 427 ± 7.5 m above sea level. The highest elevation recorded was 3229 m above sea level. Himalayan griffon-1 used only two stopovers during its migration to Pakistan.
Himalayan griffon-2 started migrating on 4 April 2021. HG2 travelled across Pakistan, Afghanistan, and Tajikistan during its migration to reach Kyrgyzstan, flying at an average elevation of 1999 ± 25.17 m above sea level. It travelled 25,198 km in 28 days to reach Kyrgyzstan (Figure 3).
Himalayan griffon-2 stayed in Kyrgyzstan until the last week of August 2021. The return journey started on 24 August 2021 towards south Kyrgyzstan. On its return journey, it followed almost the same path, differing only by a few kilometres (~40–50 km). It travelled across the same countries while migrating to India. Himalayan griffon-2 travelled at an average elevation of 2753 ± 9.17 m above sea level during its return journey from Kyrgyzstan (range: 549–4653).
Himalayan griffon-2 travelled 25,198 km to reach Kyrgyzstan from India in 28 days. During this journey, there were three recognisable stopovers located in Pakistan (20 days), Afghanistan (3 days), and Tajikistan (5 days). During its return journey, it travelled a total distance of 6400 km to reach India, taking 43 days and using three stopovers in Tajikistan (1 day), Afghanistan (30 days), and Pakistan (12 days).
Eurasian griffon-1 started migrating from the study area on 26 April 2021. It migrated across Pakistan, Tajikistan, and Uzbekistan to reach Kazakhstan (Figure 4).
Eurasian griffon-1 stayed in Kazakhstan until the end of August 2021. The migration started on 26 April and ended on 16 May 2021, taking 20 days to complete the journey by travelling a total distance of 21,020 km and flying at an average elevation of 417 ± 15.51 m above sea level (range: 123–4141). Eurasian griffon-1 made a total of four stopovers on its journey to Kazakhstan from India. On the return journey, it travelled from Kazakhstan, Kyrgyzstan, Tajikistan, Afghanistan, and Pakistan to reach India (Figure 4). While returning from Kazakhstan, Eurasian griffon-1 flew at an average elevation of 865 ± 29.83 m above sea level (range: 35–4137) and covered a total distance of 15,395 km from Kazakhstan to India in 37 days.
Eurasian griffon-2 took a different migratory route compared to Eurasian griffon-1 during its migration from Gujarat, India (Figure 5).
Eurasian griffon-2 travelled over Pakistan, Iran, Azerbaijan, and Georgia to reach Russia. It made four major stopovers during its journey to Russia from India in Pakistan (10 days), Iran (12 days), Azerbaijan (5 days), and Georgia (5 days). Eurasian griffon-2 covered a total distance of 15,534 km in 32 days to reach Russia and flew at an average elevation of 651 ± 23.54 m above sea level. On its return journey, Eurasian griffon started a southward journey towards India by the end of September 2021 and travelled over Azerbaijan, Iran and Pakistan. After reaching Pakistan, it travelled back and forth between Pakistan and India until the end of November 2021. On its return journey from Russia to India, Eurasian griffon-2 made three stopovers in Azerbaijan (6 days), Iran (15 days), and Pakistan (36 days). It covered a total distance of 15,342 km in 57 days to reach India by flying at an average elevation of 1312 ± 39.71 m above sea level while returning back to India.

4. Discussion

This study provides valuable and interesting insights into the spatial ecology of residents and migratory vultures. In this study, we provide information on vulture movements and activity patterns at a fine temporal scale. Our findings reflect the variation in the physiology, ecology, and behaviour of resident and migratory vultures, demanding specific conservation and management implementations.

4.1. Home Range Comparisons

Our results are in line with what is known about the space use of vultures—that they generally have larger home ranges due to their obligate scavenging behaviour [28,29]. The home range sizes were most stable for resident vultures, with minimum fluctuations indicating well-fixed and frequently visited foraging areas throughout the year. For Indian vultures, these areas were concentrated around Girnar Wildlife Sanctuary and Gir Protected Areas. Indian vultures and white-rumped vultures showed a minimum outlier distance steps outside their home range polygons, indicating site fidelity to foraging and nest sites throughout the year. These foraging areas include Protected Areas within Saurashtra Landscape, such as Gir Protected Areas and Girnar Wildlife Sanctuary. Girnar Wildlife Sanctuary holds the nesting and roosting sites for Indian vultures. These protected areas may also decrease the risk of diclofenac exposure to vultures due to the feeding by vultures on the remains of the prey species left over by Asiatic Lions and Indian Leopards. Egyptian and red-headed vultures had larger annual home range areas than Indian and white-rumped vultures among resident vultures. The red-headed vulture also showed unstable home range size, suggesting that foraging areas may differ for red-headed vultures within the study area. Egyptian vulture maintained a relatively stable home range within the study area (Saurashtra), while on the other hand, it was large in Rajasthan. The variation in home range size may be due to the small fraction of locations available from the Saurashtra landscape for a limited period, and a larger number of the locations were available from Rajasthan. Many studies have found that non-breeding Egyptian vultures range over larger areas with frequent visits to anthropogenic dumpsites [30,31,32]. Anthropogenic dumpsites may have influenced the foraging behaviour of the Egyptian vulture in Rajasthan, leading to a large home range size, while in the Saurashtra landscape, the frequent availability of prey remains from kills of the Asiatic Lion and Indian Leopards may provide accessible food resources leading to smaller home range sizes [pers obsr]. However, further research may provide insights into the relationship between food resources and the home range size of vultures within the study area.
As expected, monthly core areas (50% UD) differed significantly between breeding and non-breeding seasons for resident vultures. In our study area, the breeding season of the Indian vulture, white-rumped vulture, and red-headed vulture start towards winter, mainly in the months of November to December and hatchlings appear in the nest towards February and March. At the start of the breeding season, vultures spend most of the time in nest building and copulation, resulting in a gradual reduction in space use, as is evident in November and December in our study area [33] A pronounced reduction in space use occurred in January and February when eggs appeared in the nest and vultures started incubation. The space use increased gradually towards the later months of the breeding season and reached the peak by April and May, when vultures increased their space use to provide food for their young ones. Though it was not confirmed that all tagged vultures were actively breeding in our study area, we reasonably assumed that all adult birds breed actively under normal conditions.
The Himalayan griffon is a fairly common winter visitor in the lowland plains up to Rajasthan, Madhya Pradesh, and Gujarat. In wintering grounds, Himalayan griffon establishes wide foraging areas. In our study, the foraging areas of HG1 varied from within the Saurashtra landscape in central Gujarat and in Pakistan. The transmitter on Himalayan griffon-1 malfunctioned on 25 March 2021, when it was supposedly on its return journey to its breeding grounds. Thus, information on its foraging areas across its breeding range could not be calculated. Himalayan griffon-2 had a larger foraging area in India than in Kyrgyzstan, supporting our prediction that movements in breeding grounds are concentrated towards nest colonies. Similar observations have been found in Eurasian griffons as well [34,35]. Our results indicate that home range size varied greatly in Eurasian and Himalayan griffons across their wintering and summer grounds. It has been suggested that the griffon vultures favour specific areas while foraging [35]. In this study, Eurasian griffon showed a large home range size in their summer grounds indicating that Eurasian griffon range over large foraging areas in India. The relatively smaller home ranges in their breeding range may also be due to the restricted movements in the breeding season than in the non-breeding season.

4.2. Comparison of Monthly and Daily Distance

We expected monthly and daily distances moved by resident vultures to vary with the season. Specifically, we expected that resident vultures would restrict their movement around nests in the breeding season and would show a gradual increase in monthly and daily distance as the breeding season progresses. In our study area, resident vultures moved significantly less during the months of the breeding season (November to February) compared to non-breeding months (March to June). Though there was no significant difference in the monthly distance moved by all three individuals of the Indian vulture; however, their movements differed significantly between breeding and non-breeding season. Conversely, two tagged white-rumped vultures showed significant variation in the monthly distance they moved. Similar to the Indian vulture, they also reduced their daily and monthly movement during the breeding season. However, our results indicate that Indian vulture moved significantly more than white-rumped vultures. A similar pattern was noticeable in the red-headed vulture, where movements were restricted in the breeding season. On the other hand, migratory vultures were more active and moved significantly more than resident vultures, and as expected, they covered more daily and monthly distances while migrating.

4.3. Comparison of Activity Patterns

As we expected, our results show that migratory vultures spent significantly more time in flight than resident vultures. All resident vultures spent significantly more time in a rest state than in flight. Resident vultures showed significant variations across breeding and non-breeding season. Expectedly, the frequency of inflight fixes increased in February, March, and April in Indian vultures when eggs hatch and chicks appear. Thus, Indian vultures spent more time in flight as the breeding season progressed to provide food for the hatchlings. A similar pattern of increased activity in the later stages of the breeding season was noticeable in white-rumped vultures as well. Migratory vultures, as expected, showed a high rate of inflight fixes when they migrated to their breeding grounds and back. After they settled, the frequency of daily inflight fixes declined compared to when they were actively migrating.

4.4. Migration Patterns

Raptors of different age classes often employ different strategies for migration and the required energy demands [36,37]. One of the Eurasian griffons (Eurasian griffon-1) took a northward migration route from India to Kazakhstan, while the second individual, Eurasian griffon-2 followed the southwest route travelling over Iran to southern Russia. The actual reasons may not be clear; however, they may perhaps relate to weather conditions. Cinereous vultures (Aegypius monachus) have also been found not to follow a common migratory route [26]. Tagging a large number of migratory vultures in the future may provide useful information on their seasonal migration pattern. The movement, behaviour and migration patterns of the Eurasian griffon are well studied across Europe [38,39,40], where it has been reported that adults are largely sedentary, with partial migration occurring in juveniles and immature birds leaving their breeding areas at the end of the breeding season [34]. Results of our study indicate that some adult individuals of the Asian population may also migrate. The results suggest that the migration route may depend on the natal area of the migrants. Both Eurasian griffon individuals followed the same route while returning to their breeding areas and migrating back to India in the following winter. Thus, we report two new potential migration routes of Eurasian griffon for the Central Asian population migrating to India and the far-east Russian population migrating to India. A large sample size of tagged birds within the study area in future may provide further insights into the migration and movement patterns of the Eurasian griffon. Himalayan griffon-2 followed the same migratory route while migrating to its breeding range in Kyrgyzstan in Central Asia.

5. Conclusions

In conclusion, our study shows that resident and migratory vultures exhibit considerable variability in space use, movement and activity patterns across seasons and annual cycle. The breeding season highly influences the space use, daily and monthly movements, and seasonal activity rates in resident vultures. In our first attempt, we provide important information on the spatial ecology of critically endangered vultures at fine spatial and temporal scales.

Supplementary Materials

The following supporting information can be downloaded at: https://www.mdpi.com/article/10.3390/ecologies3040035/s1, All the necessary Supplementary Material (S1, S2, S3, S4) mentioned in the text of the manuscript is attached separately with the manuscript.

Author Contributions

Conceptualisation: M.R. and A.S.; Methodology: M.R., A.S., D.G. and T.A.R.; Formal acquisition, analysis and investigation: M.R., A.S., T.A.R., Y.Z. and L.J.; Writing original draft preparation: M.R., D.G. and T.A.R.; Writing—review and editing: M.R., D.G., T.A.R., Y.Z. and L.J.; Resources: M.R. and DG; Supervision: M.R., A.S. and S.T. All authors have read and agreed to the published version of the manuscript.

Funding

The research was undertaken by the Wildlife Division, Sasan-Gir, Gujarat Forest Department and is one of the works of the concerned division. Therefore, the work was conducted as per the fund received under different heads for conducting such work.

Institutional Review Board Statement

All scientific research activities involved in this study were carried out after taking approval from the competent authority [Ministry of Environment, Forests and Climate Change (MoEF&CC), Government of India (Letter No: F.No. 1-27/2020 WL, dated 14 July 2020)]. All experimental methods and works were carried out in accordance with relevant guidelines and regulations suggested by the Principal Chief Conservator of Forests (Wildlife) & Chief Wildlife Warden, Gujarat Forest Department, Government of Gujarat. Technical experts, experienced bird trappers and handlers, qualified and experienced veterinarians carried out the tagging work.

Informed Consent Statement

Not applicable.

Data Availability Statement

All data generated or analysed during the mentioned period for this study are included in this published article as supplementary materials.

Acknowledgments

The authors would like to thank the Principal Chief Conservator of Forests & Head of Forest Force (PCCF&HoFF), Gujarat State; and D.T. Vasavada, CCF (Rtd.), for their help and support. The field support extended by DCF, Shetrunji Wildlife Division, Palitana and staff at Mahuva is acknowledged. We are grateful to our technical experts, Krishna Bhusal, Indra Gadhvi, P. P. Dodia and Kedar Gore, who provided valuable input and support during the work. We also acknowledge the field support extended by Gambhirsinh S. Vala, Research Scientists and his staff at Agriculture Research Station, Mahuva, Junagadh Agriculture University. We also acknowledge the technical support extended by the staff of The Corbett Foundation. We are thankful to the Government of Gujarat and the Gujarat Forest Department for supporting this critical study. We are also thankful to the Ministry of Environment, Forest and Climate Change (MoEF&CC), Government of India, for issuing the necessary permission for the work. We also acknowledge the support of the staff at Wildlife Division, Sasan-Gir. We are thankful to the anonymous reviewers for their valuable inputs, comments and suggestions for the improvement of the manuscript.

Conflicts of Interest

The authors have no competing interest to declare relevant to this article’s content.

References

  1. DeVault, T.L.; Rhodes, O.E.; Shivik, J.A. Scavenging by Vertebrates: Behavioral, Ecological, and Evolutionary Perspectives on an Important Energy Transfer Pathway in Terrestrial Ecosystems. Oikos 2003, 102, 225–234. [Google Scholar] [CrossRef] [Green Version]
  2. Wilson, E.E.; Wolkovich, E.M. Scavenging: How Carnivores and Carrion Structure Communities. Trends Ecol. Evol. 2011, 26, 129–135. [Google Scholar] [CrossRef]
  3. Deygout, C.; Gault, A.; Duriez, O.; Sarrazin, F.; Bessa-Gomes, C. Impact of Food Predictability on Social Facilitation by Foraging Scavengers. Behav. Ecol. 2010, 21, 1131–1139. [Google Scholar] [CrossRef]
  4. Prakash, V. Status of Vultures in Keoladeo National Park, Bharatpur, Rajasthan, with Special Reference to Population Crash in Gyps Species. Bombay Nat. Hist. Soc. 1999, 96, 365–378. [Google Scholar]
  5. Gilbert, M.; Watson, R.T.; Virani, M.Z.; Oaks, J.L.; Ahmed, S.; Chaudhry, M.J.I.; Arshad, M.; Mahmood, S.; Ali, A.; Khan, A.A. Rapid Population Declines and Mortality Clusters in Three Oriental White-Backed Vulture Gyps bengalensis Colonies in Pakistan Due to Diclofenac Poisoning. Oryx 2006, 40, 388–399. [Google Scholar] [CrossRef] [Green Version]
  6. Gilbert, M.; Oaks, J.; Virani, M.; Watson, R.; Ahmed, S.; Iqbal, M.; Chaudhry, J.; Arshad, M.; Mahmod, S.; Ali, A.; et al. The Status and Decline of Vultures in the Provinces of Punjab and Sind, Pakistan: A 2003 Update. In Raptors Worldwide; Chancellor, R.D., Meyburg, B.U., Eds.; Princeton University Press: Princefton, NJ, USA, 2004; pp. 221–234. [Google Scholar]
  7. Gilbert, M.; Virani, M.Z.; Watson, R.T.; Oaks, J.L.; Benson, P.C.; Khan, A.A.; Ahmed, S.; Chaudhry, J.; Arshad, M.; Mahmood, S.; et al. Breeding and Mortality of Oriental White-Backed Vulture Gyps bengalensis in Punjab Province, Pakistan. Bird Conserv. Int. 2002, 12, 311–326. [Google Scholar] [CrossRef] [Green Version]
  8. Baral, H.; Giri, J.; Virani, M. On the Decline of Oriental White-Backed Vultures Gyps Bengalensis in Lowland Nepal. In Raptors Worldwide; Chancellor, R.D., Meyburg, B.U., Eds.; Princeton University Press: Princefton, NJ, USA, 2004; pp. 215–219. [Google Scholar]
  9. Acharya, R.; Cuthbert, R.; Baral, H.S.; Shah, K.B. Rapid Population Declines of Himalayan Griffon Gyps himalayensis in Upper Mustang, Nepal. Bird Conserv. Int. 2009, 19, 99–107. [Google Scholar] [CrossRef] [Green Version]
  10. Cuthbert, R.; Green, R.E.; Ranade, S.; Saravanan, S.; Pain, D.J.; Prakash, V.; Cunningham, A.A. Rapid Population Declines of Egyptian Vulture (Neophron percnopterus) and Red-headed Vulture (Sarcogyps calvus) in India. Wiley Online Libr. 2006, 9, 349–354. [Google Scholar] [CrossRef]
  11. Prakash, V.; Green, R.E.; Rahmani, A.R.; Pain, D.J.; Virani, M.Z.; Khan, A.A.; Baral, H.S.; Jhala, Y.V.; Naoroji, R.; Shah, N.; et al. Evidence to Support That Diclofenac Caused Catastrophic Vulture Population Decline. Curr. Sci. 2005, 88, 1533–1534. [Google Scholar]
  12. Houston, D.C. Food Searching in Griffon Vultures. Afr. J. Ecol. 1974, 12, 63–77. [Google Scholar] [CrossRef]
  13. Jackson, A.L.; Ruxton, G.D.; Houston, D.C. The Effect of Social Facilitation on Foraging Success in Vultures: A Modelling Study. Biol. Lett. 2008, 4, 311–313. [Google Scholar] [CrossRef] [PubMed]
  14. Alarcón, P.A.E.; Lambertucci, S.A. A Three-Decade Review of Telemetry Studies on Vultures and Condors. Mov. Ecol. 2018, 6, 13. [Google Scholar] [CrossRef] [PubMed]
  15. Ali, S.; Ripley, S.D. Hand Book of the Birds of India and Pakistan, Volume 1; Oxford University Press: London, UK, 1968. [Google Scholar]
  16. Vaidyanathan, S. A Complete Guide To The Vultures of India. Nature in Focus. Available online: https://www.natureinfocus.in/animals/a-complete-guide-to-the-vultures-of-india (accessed on 27 July 2022).
  17. SAVE. Report of 10th Annual Meeting of Saving Asia’s Vultures from Extinction; SAVE: Bedfordshire, UK, 2020. [Google Scholar]
  18. Bhusal, K.P.; Chapagain, D.; Joshi, A.B.; Chaudhary, I.P.; Chaudhary, K. First Release of Captive White-Rumped Vulture (Gyps Bengalensis) into the Wild in Nepal. Vulture Bull. 2018, 8, 3–8. [Google Scholar]
  19. Holland, A.E.; Byrne, M.E.; Bryan, A.L.; DeVault, T.; Rhodes, O.E.; Beasley, J.C. Fine-scale assessment of home ranges and activity patterns for resident black vultures (Coragyps atratus) and turkey vultures (Cathartes aura). PLoS ONE 2017, 12, e0179819. [Google Scholar] [CrossRef] [Green Version]
  20. Banerjee, K.; Jhala, Y.V. Demographic Parameters of Endangered Asiatic Lions (Panthera leo persica) in Gir Forests, India. J. Mammal. 2012, 93, 1420–1430. [Google Scholar] [CrossRef] [Green Version]
  21. Gujarat Forest Department. Poonam Avlokan (Full Moon Observations) of Asiatic Lions in the Asiatic Lion Landscape Forest Department, Gujarat State; Wildlife Division Sasan-Gir, Gujarat Forest Department: Gujarat, India, 2020.
  22. Rodgers, W.A.; Panwar, H.S. Planning a Wildlife Protected Area Network in India. Vol. I & II; Wildlife Institute of India: Dehradun, India, 1988.
  23. Byrne, M.E.; Holland, A.E.; Bryan, A.L.; Beasley, J.C. Environmental Conditions and Animal Behavior Influence Performance of Solar-Powered GPS-GSM Transmitters. Condor Ornithol. Appl. 2017, 119, 389–404. [Google Scholar] [CrossRef] [Green Version]
  24. Calenge, C. The Package “Adehabitat” for the R Software: A Tool for the Analysis of Space and Habitat Use by Animals. Ecol. Modell. 2006, 197, 516–519. [Google Scholar] [CrossRef]
  25. R Core Team. R: A Language and Environment for Statistical Computing; R Foundation for Statistical Computing: Vienna, Austria, 2020. [Google Scholar]
  26. Reading, R.P.; Azua, J.; Garrett, T.; Kenny, D.; Lee, H.; Paek, W.K.; Reece, N.; Tsolmonjav, P.; Willis, M.J.; Wingard, G. Differential Movement of Adult and Juvenile Cinereous Vultures (Aegypius monachus) (Accipitriformes: Accipitridae) in Northeast Asia. J. Asia-Pacif. Biodivers. 2020, 13, 156–161. [Google Scholar] [CrossRef]
  27. Biavati, G. RAtmosphere: Standard Atmospheric Profiles, R Package Version 1.1. Available online: https://rdrr.io/cran/RAtmosphere/ (accessed on 10 September 2022).
  28. Xirouchakis, S.M.; Grivas, C.; Andreou, G.; Georgopoulou, E. Home range size, space use and resource selection of griffon vultures in an insular environment. J. Zool. 2021, 314, 116–131. [Google Scholar] [CrossRef]
  29. DeVault, T.; Reinhart, B.; Brisbin, L., Jr.; Rhodes, O., Jr. Home Ranges of Sympatric Black and Turkey Vultures in South Carolina. Condor 2004, 106, 706–711. [Google Scholar] [CrossRef]
  30. Mundy, P.; Butchart, D.; Ledger, J.; Piper, S. The Vultures of Africa; Academic Press: London, UK, 1992. [Google Scholar]
  31. Eriksen, J.; Victor, R. Oman Bird List: The Official List of the Birds of the Sultanate of Oman, 7th ed.; Center for Environmental Studies and Research, Sultan Qaboos University: Muscat, Oman, 2013. [Google Scholar]
  32. Al Fazari, W.; MacGrady, M.J. Counts of Egyptian Vultures Neophron percnopterus and Other Avian Scavengers at Muscat’s Municipal Landfill, Oman, November 2013–March 2015. Sandgrouse 2016, 38, 99–105. [Google Scholar]
  33. Kumar, S.; Pandey, N.; Gore, K.G.; Rather, T.A.; Atri, K.S. Conservation of vultures in and around Bandhavgarh Tiger Reserve. Vulture News 2016, 70, 42. [Google Scholar] [CrossRef]
  34. Zuberogoitia, I.; González-Oreja, J.A.; Martínez, J.E.; Zabala, J.; Gómez, I.; López-López, P. Foraging movements of Eurasian griffon vultures (Gyps fulvus): Implications for supplementary feeding management. Eur. J. Wildl. Res. 2013, 59, 421–429. [Google Scholar] [CrossRef]
  35. Monsarrat, S.; Benhamou, S.; Sarrazin, F.; Bessa-Gomes, C.; Bouten, W.; Duriez, O. How Predictability of Feeding Patches Affects Home Range and Foraging Habitat Selection in Avian Social Scavengers? PLoS ONE 2013, 8, e53077. [Google Scholar] [CrossRef] [PubMed]
  36. Sergio, F.; Tanferna, A.; de Stephanis, R.; López-Jiménez, L.; Blas, J.; Tavecchia, G.; Preatoni, D.; Hiraldo, F. Individual improvements and selective mortality shape lifelong migratory performance. Nature 2014, 515, 410–413. [Google Scholar] [CrossRef]
  37. Miller, T.A.; Brooks, R.P.; Lanzone, M.J.; Brandes, D.; Cooper, J.; Tremblay, J.A.; Wilhelm, J.; Duerr, A.; Katzner, T.E. Limitations and mechanisms influencing the migratory performance of soaring birds. Ibis 2016, 158, 116–134. [Google Scholar] [CrossRef]
  38. Ramírez, J.; de Langarica, F.M.Z.G.; Molina, M.G. Spring Migration of Eurasian Griffon Vultures Across the Strait of Gibraltar: Number, Timing and Age Composition. Ardeola 2019, 66, 113–118. [Google Scholar] [CrossRef]
  39. Genero, F.; Franchini, M.; Fanin, Y.; Filacorda, S. Spatial ecology of non-breeding Eurasian Griffon Vultures Gyps ful-vus in relation to natural and artificial food availability. Bird Study 2020, 67, 53–70. [Google Scholar] [CrossRef]
  40. Xirouchakis, S.M.; Andreou, G. Foraging Behaviour and Flight Characteristics of Eurasian Griffons Gyps fulvus in the Island of Crete, Greece. Wildl. Biol. 2009, 15, 37–52. [Google Scholar] [CrossRef]
Figure 1. The location of the Asiatic Lion Landscape, Saurashtra, Gujarat, India. The map insets show the location of Gujarat State in India (A) and the Asiatic Lion Landscape in Gujarat State (B).
Ecologies 03 00035 g001
Figure 2. Migration route of Himalayan griffon-1 from Saurashtra Landscape (Gujarat). Green dot represents the place of tagging of Himalayan griffon-1. This map was generated using ArcGIS 10.8.1. Redlands, ESRI, Redlands, CA, USA. Country borders represented here are according to Google Earth imagery (Google India).
Ecologies 03 00035 g002
Figure 3. Migration route of Himalayan griffon-2 from Saurashtra Landscape to Kyrgyzstan (green line) during pre-breeding season and from Kyrgyzstan to India (purple line) during post-breeding season. The green dot represents the place of tagging. This map was generated using ArcGIS 10.8.1 (ESRI, Redlands, CA, USA). Country borders represented here are according to Google Earth imagery (Google India).
Ecologies 03 00035 g003
Figure 4. Migration route of Eurasian griffon-1 from Saurashtra Landscape to Kazakhstan (blue line) during pre-breeding season and from Kazakhstan to India (red line) during post-breeding season. Green dot represents the place of tagging. This map was generated using ArcGIS 10.8.1. Redlands, ESRI, Redlands, CA, USA. Country borders represented here are according to Google Earth imagery (Google India).
Ecologies 03 00035 g004
Figure 5. Migration route of Eurasian griffon-2 from Saurashtra Landscape to Russia (green line) during pre-breeding season and from Russia to India (yellow line) post-breeding season. Green dot represents the place of tagging. This map was generated using ArcGIS 10.8.1. Redlands, ESRI, California, USA. Country borders represented here are according to Google Earth imagery (Google India).
Ecologies 03 00035 g005
Table 1. Annual home range size (95% UD) and core area (50% UD) of eleven satellite-tagged individuals belonging to six vulture species as calculated using R package adehabitatHR.
SpeciesHome Range (95% UD) (km2)Core Area (50% UD) (km2)
Indian vulture-1 68971056
Indian vulture-2 5400879
Indian vulture-3 4265700
White-rumped vulture-138418
White-rumped vulture-23035
Red-headed vulture2779321
Egyptian vulture (Saurashtra Landscape)15122
Egyptian vulture (Rajasthan)53311057
Himalayan griffon-1 (Saurashtra)1109175
Himalayan griffon-1 (Surendranagar, Gujarat)710512
Himalayan griffon-1 (Pakistan)61701345
Himalayan griffon-2 (Saurashtra)6348954
Himalayan griffon-2 (Kyrgyzstan)4360677
Eurasian griffon-1 (Saurashtra)67941199
Eurasian griffon-1 (Kazakhstan)53,68416,228
Eurasian griffon-2 (Russia)17,5813064
Table 2. Average (mean ± SE) monthly distances travelled by satellite-tagged vultures.
SpeciesMonthly Average Distance (km)
(Mean ± SE)
Minimum Distance (km)Maximum Distance (km)
Indian vulture-12269.34 ± 355.10810.544510.06
Indian vulture-2 2445.15 ± 438.58580.954321.63
Indian vulture-3 2720.79 ± 361.191024.014754.48
White-rumped vulture-11450.51 ± 206.37520.192838.83
White-rumped vulture-2997.16 ± 260.01259.711887.94
Red-headed vulture 1191.62 ± 155.36241.182114.06
Egyptian vulture 1084.53 ± 181.01466.882051.60
Himalayan griffon-1 1864.32 ± 880.98350.573402.12
Himalayan griffon-23348.34 ± 570.64957.637099.87
Eurasian griffon-1 4908.24 ± 1234.36915.1911,738.11
Eurasian griffon-2 6457.11 ± 1619.501822.2615,958.98
Table 3. Average (mean ± SE) daily distances travelled by satellite-tagged vultures.
SpeciesAverage Daily Distance (km)
(Mean ± SE)
Maximum Daily Distance (km)
(Mean ± SE)
Minimum Daily Distance (km)
(Mean ± SE)
Indian vulture-1 78.28 ± 11.10145.48 ± 23.1932.40 ± 9.11
Indian vulture-2 85.02 ± 12.37144.05 ± 21.5352.40 ± 13.23
Indian vulture-3 91.50 ± 11.43153.37 ± 26.1834.13 ± 9.74
White-rumped vulture-1 48.27 ± 6.6291.57 ± 14.5323.64 ± 4.27
White-rumped vulture-239.12 ± 7.4159.61 ± 17.8324.09 ± 7.19
Red-headed vulture 40.80 ± 4.5468.21 ± 13.8121.11 ± 2.34
Egyptian vulture 40.39 ± 6.1668.38 ± 15.1315.56 ± 2.11
Himalayan griffon-1 114.37 ± 5.39125.12 ± 8.64108.25 ± 5.17
Himalayan griffon-2 115.62 ± 18.52236.66 ± 24.4431.92 ± 7.87
Eurasian griffon-1 161.02 ± 40.42391.27 ± 83.1129.52 ± 5.34
Eurasian griffon-2 214.52 ± 51.98514.80 ± 77.7483.52 ± 13.32
Publisher’s Note: MDPI stays neutral with regard to jurisdictional claims in published maps and institutional affiliations.

