1. Introduction
Animals change their locations over time for foraging, wandering, dispersal, and other life activities. Researchers aim to derive behavioral patterns (i.e., what animals are doing, when, where, and for how long) from such movement and location data in order to understand animals’ requirements and health status, and the effects of the external conditions on their typical behavior [
1,
2,
3,
4].
By using biotelemetry devices, the automated data acquisition of animal movements allows for overcoming the difficulty of monitoring animal behavior in the field [
5,
6,
7,
8]. Two approaches are used to derive activity states from such biotelemetry data [
9,
10]: (a) unsupervised learning (where field observations are not used as the training input), and (b) supervised learning (where field observations are collected at the same time as movement data). The former approach in turn splits into two different forms: (a) the expert-based unsupervised interpretation of sensor data, and (b) the automated unsupervised segmentation of sensor data. By contrast, the supervised classification of sensor data uses accelerometers that record body acceleration along orthogonal axes, which is then used to deduce behavior by means of analytical techniques applied to hundreds or thousands of records corresponding to field observations and/or video analyses [
11,
12]. Obtaining such a calibration set for cryptic species can be difficult, and continuous field observations of animals could sometimes be impracticable due to poor visibility, e.g., at night [
3]. Direct animal observation could also induce a deviation from normal animal behavior [
13]. Furthermore, budgetary limitations can discourage researchers from using accelerometer-based devices and ancillary data [
4]. The absence or insufficiency of calibration data restrains the application of supervised learning in behavioral studies, which renders unsupervised methods suitable.
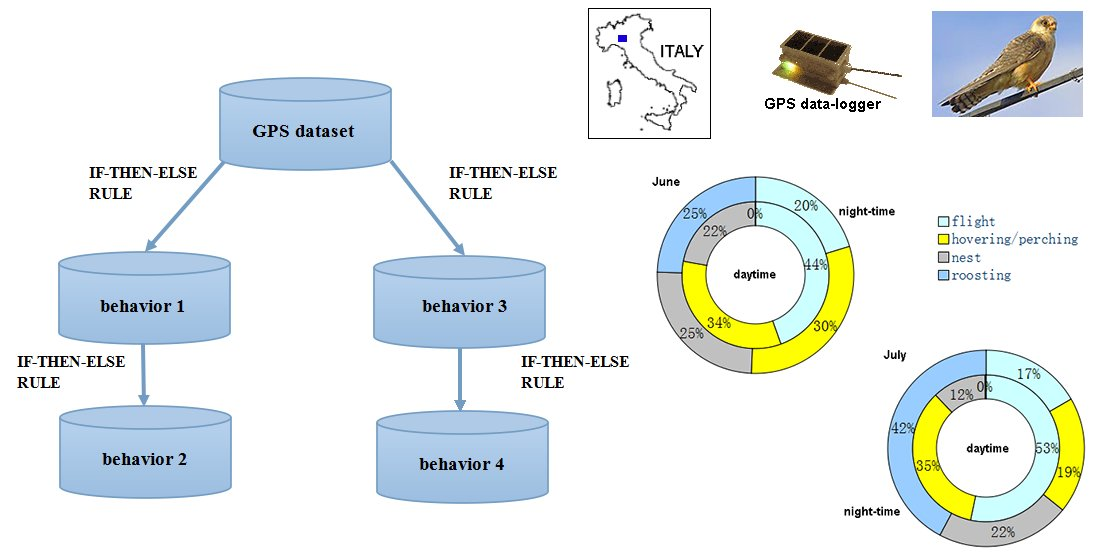
In this work, we used the recently introduced machine-learning methodology Unsupervised Animal Behaviour Examiner (UABE) [
14] to deduce the time-activity budgets of the red-footed falcon (
Falco vespertinus) in the province of Parma, Italy. UABE is a new and intelligible unsupervised method that uses if-then-else rules to derive animal behavior from GPS data under worst-case conditions, i.e., in absence of accelerometer data, continuous field observations, and camera trapping. UABE is a mixed approach that takes advantage of both inductive and deductive steps; behavioral classes are defined inductively by applying if-then-else rules to the GPS data, but rules are determined a priori through the observation of the study system [
14]. UABE allows for the creation of the unsupervised ethograms of both stationary (e.g., standing at nest) and nonstationary (e.g., flight) animal behaviors.
We purposed to: (a) derive the red-footed falcons’ time-activity budgets at the two largest colonies in Italy during the nestling period (the interval between hatching and fledging, which is approximately from mid-June to the end of July); (b) examine the red-footed falcons’ behaviors on monthly, daily, and hourly bases; and (c) advance explanations for the detected patterns.
2. Materials and Methods
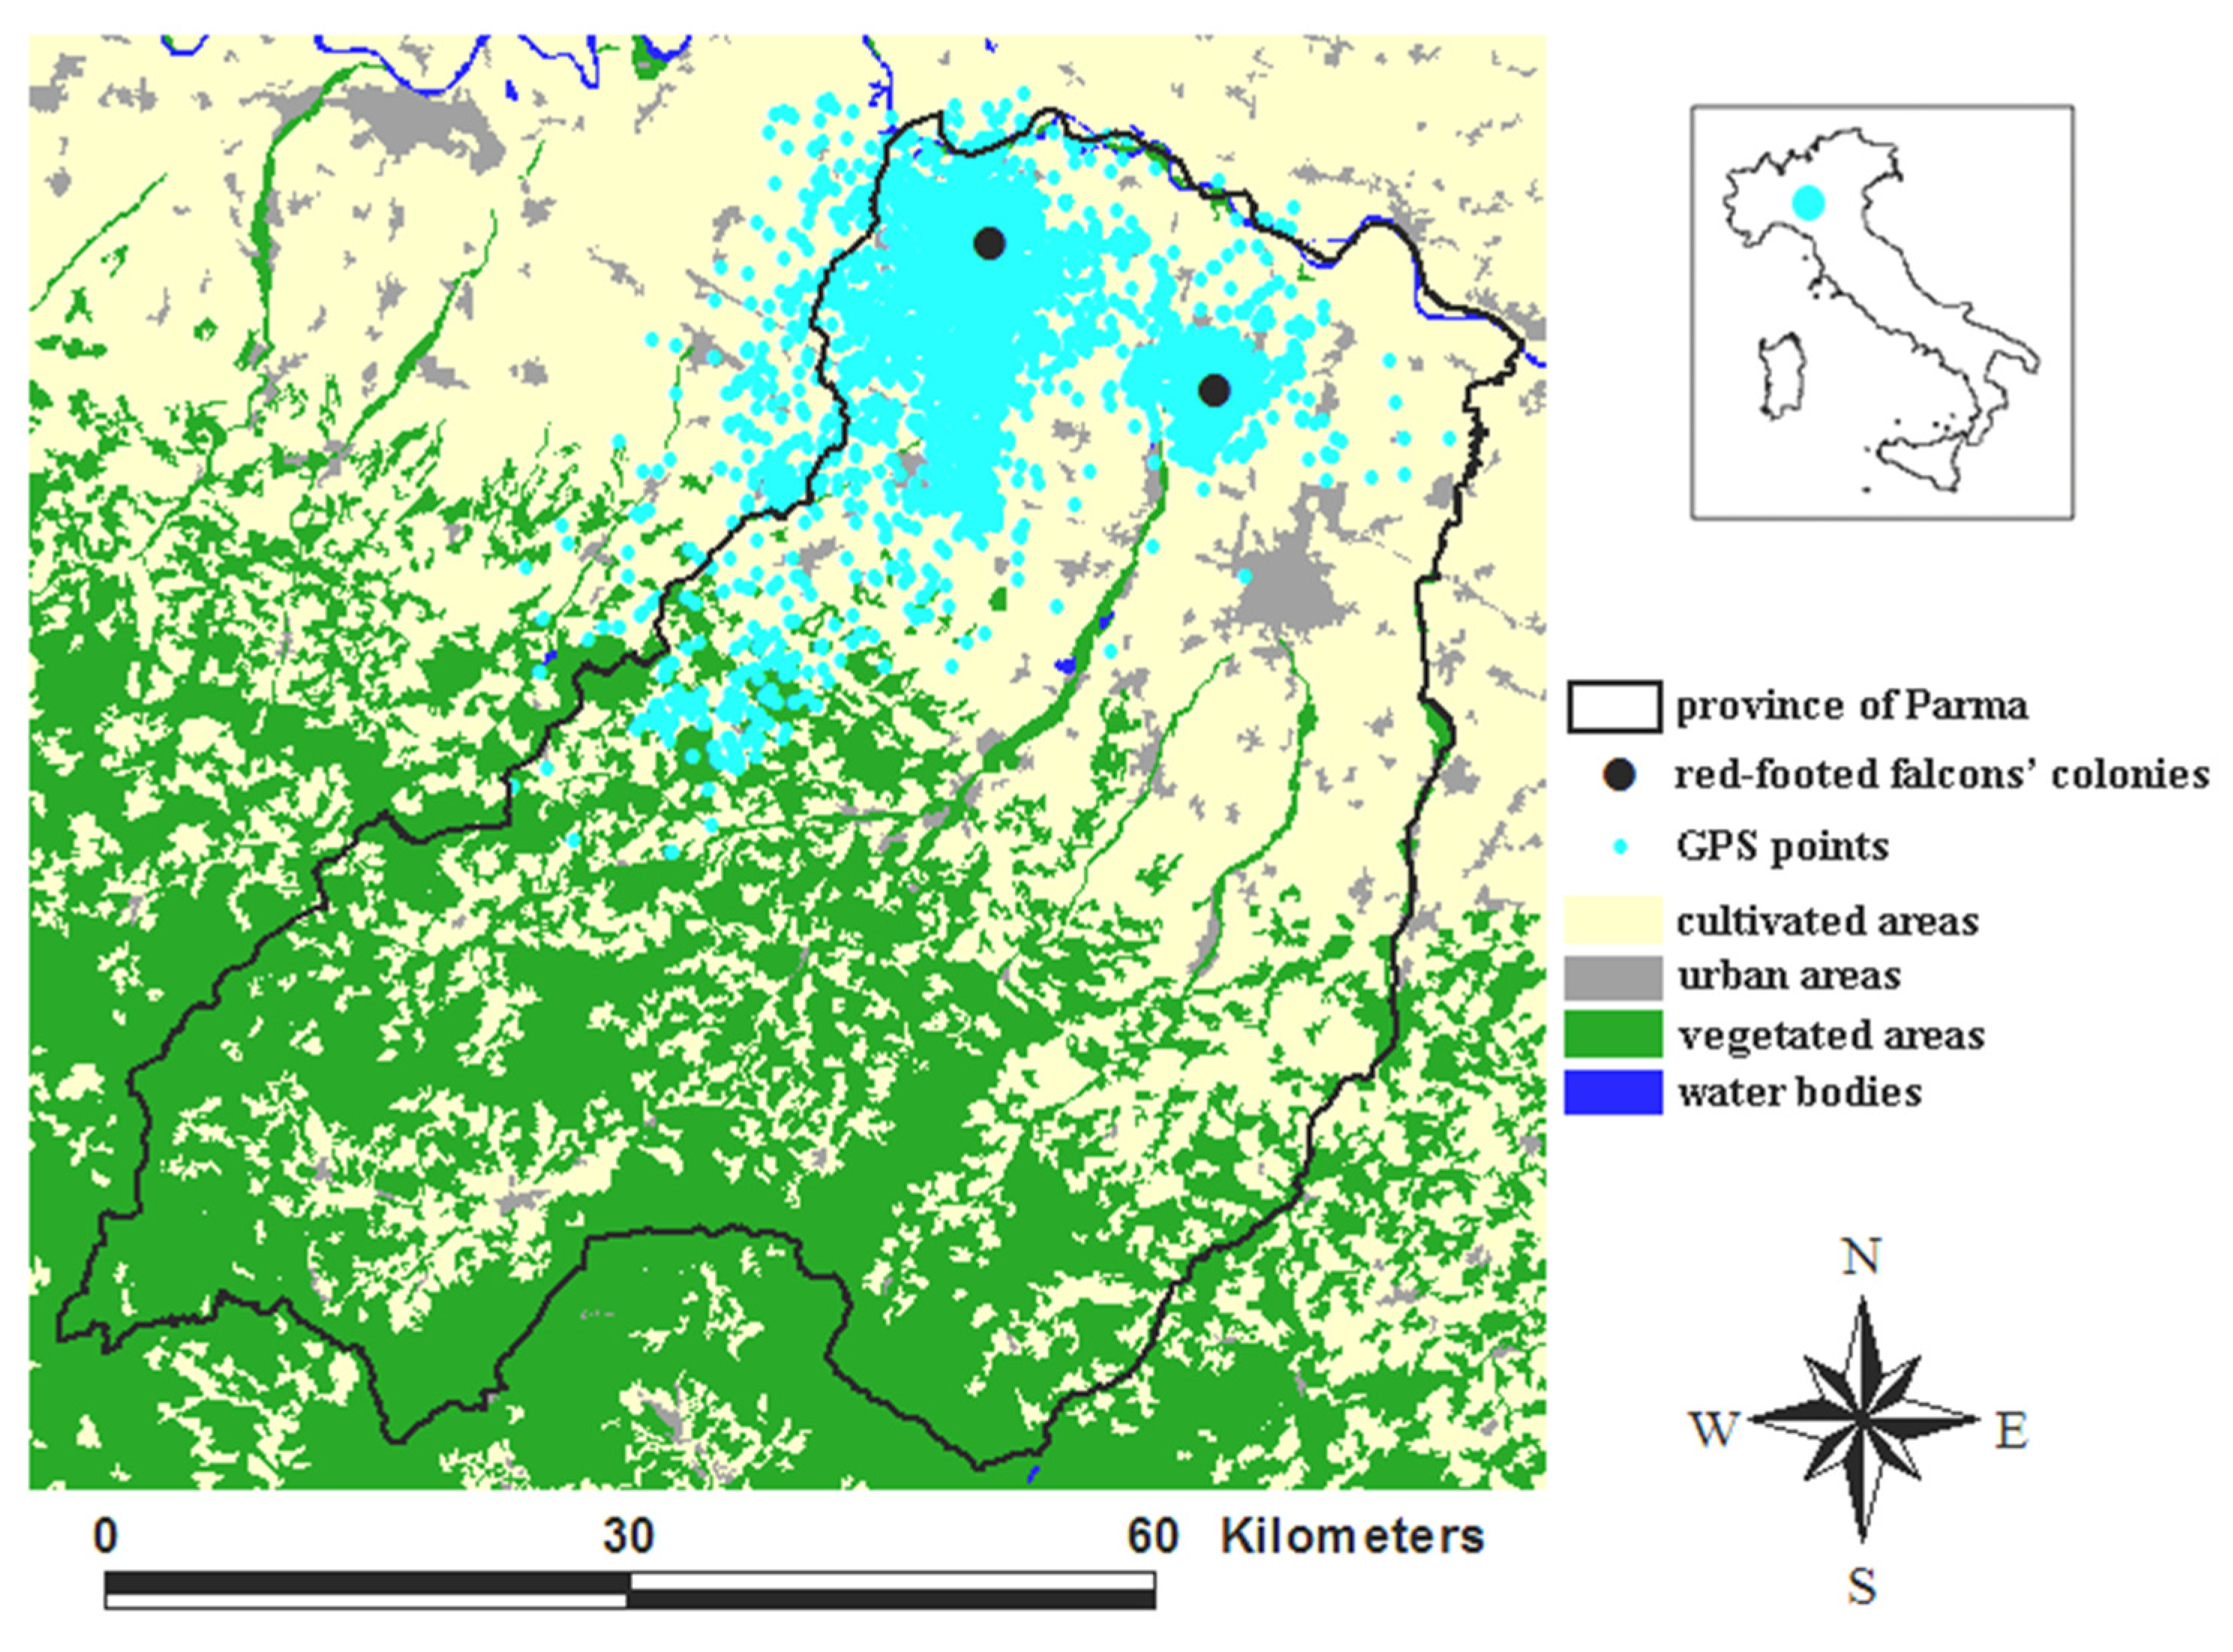
The study area (
Figure 1) hosts > 90% of the red-footed falcon population breeding in Italy [
15]. In 2020, we counted 82 breeding pairs in two colonies within two Natura 2000 sites (SPA IT4020018 and SAC-SPA IT4020017). The red-footed falcon breeds in open rural environments dominated by extensive cultivation, pasture, and the presence of rows of trees for nesting and roosting [
16]. It is a vulnerable species at both the global and the European level [
17], and its decline is due to habitat degradation, pesticide spraying, and the conversion of grasslands to agricultural fields [
18].
In June and July 2019, 2020, and 2021, by using decoy birds (eagle owls and Harris’ hawks) and mist nets, we captured the birds near their nests. We tracked 8 adult red-footed falcons in fit health conditions (
Table 1) belonging to eight different nests so as to avoid the pseudoreplication that occurs when individual observations are heavily dependent on each other [
19]. We dorsally secured the TechnoSmart RadioTag-14 miniature data loggers to the base of the central tail feathers by using a 2 mm wide Teflon tape knotted with a simple triple knot. Two tapes were crossed without a knot at the height of the sternum and fastened with seams so that the birds could fly freely. A wireless system allowed for data downloads. The GPS devices collected information on the date, time, latitude, longitude, flight height a.s.l. (m), and flight speed (
FS; m/s). The GPS fix was set at 15 min to minimize the spatial autocorrelation, i.e., the situation in which observations drawn from different locations are not independent of each other [
20]. We only retained GPS points with horizontal dilution of precision (HDoP) ≤ 5, i.e. ideal (HDoP = 1), excellent (HDoP = 2) or good (3 ≤ HdoP ≤ 5) positional measurements. Accordingly, we excluded 294 GPS fixes before the application of the UABE. Our procedure was approved by the Italian Institute for Environmental Protection and Research (ISPRA) and conformed to Directive 2010/63/EU.
Through field surveys, we located the birds’ nests and habitual roost sites (i.e., large patches of trees regularly used by falcons). By means of digital orthophotos, we mapped all the rows of trees (>800 km) present in the study area in order to also detect occasional roost sites, i.e., small patches of trees rarely used by the tracked red-footed falcons. GPS data were transferred to the ArcView GIS [
21] together with: (a) the boundaries of the province of Parma, (b) the digital orthophotos at a 1:500 scale, (c) the terrain elevation a.s.l. at 1:1000 scale, (d) the land cover at 1:10,000 scale, and (e) the nest and roost locations.
For each GPS point, we computed: (1) the distance from the individual’s nest (
DN), (2) the distance from the nearest habitual or occasional roost site (
DR), and (3) the land cover type (
LT) on the orthogonal projection of the GPS point onto the land cover GIS layer. The flight height above ground level (
FH; m) was computed for each GPS point by subtracting the terrain elevation a.s.l. from the flight height a.s.l. We assigned each GPS point to “daytime” or “night-time” according to sunrise and sunset data available at:
http://www.sunrise-and-sunset.com/en/sun/italy/parma (accessed on 8 April 2022). Sunset occurred at about 9:00 p.m. local time, and sunrise at about 5:45 a.m.
By using UABE, GPS points were labelled as “activity at nest” if
i.e., if birds were motionless within the rows of black poplar (
Populus nigra) and oak (
Quercus robur) trees that hosted the tracked birds; otherwise, they were classified as “not at nest”. In fact, through field surveys and digital orthophotos, the radius of the tree canopies used for nesting and roosting was estimated to be ≈ 1 m.
GPS points were assigned to the “roosting” category if
i.e., if birds were motionless in the close surrounding of habitual or occasional roost sites.
GPS points were labelled as “flight” if
i.e., if birds were moving in the air outside the rows of the trees used for nesting and roosting.
Red-footed falcons employ three hunting strategies: perching, hovering, and aerial insect capture [
22]. Perching is performed from power lines, pylons, and telephone cables, as they provide an unrestricted view straight beneath. By contrast, in active hunting, the birds catch large insects in flight or hover with fast wing beats and then strike the prey. Accordingly, GPS points were assigned to “hovering/perching activity” if
i.e., if birds were motionless in the air outside the nest and roost sites, and on the orthogonal projection of a cultivated area. Although it never occurred in this study, we also considered the condition
FH = 0 that would describe insect hunting on the ground.
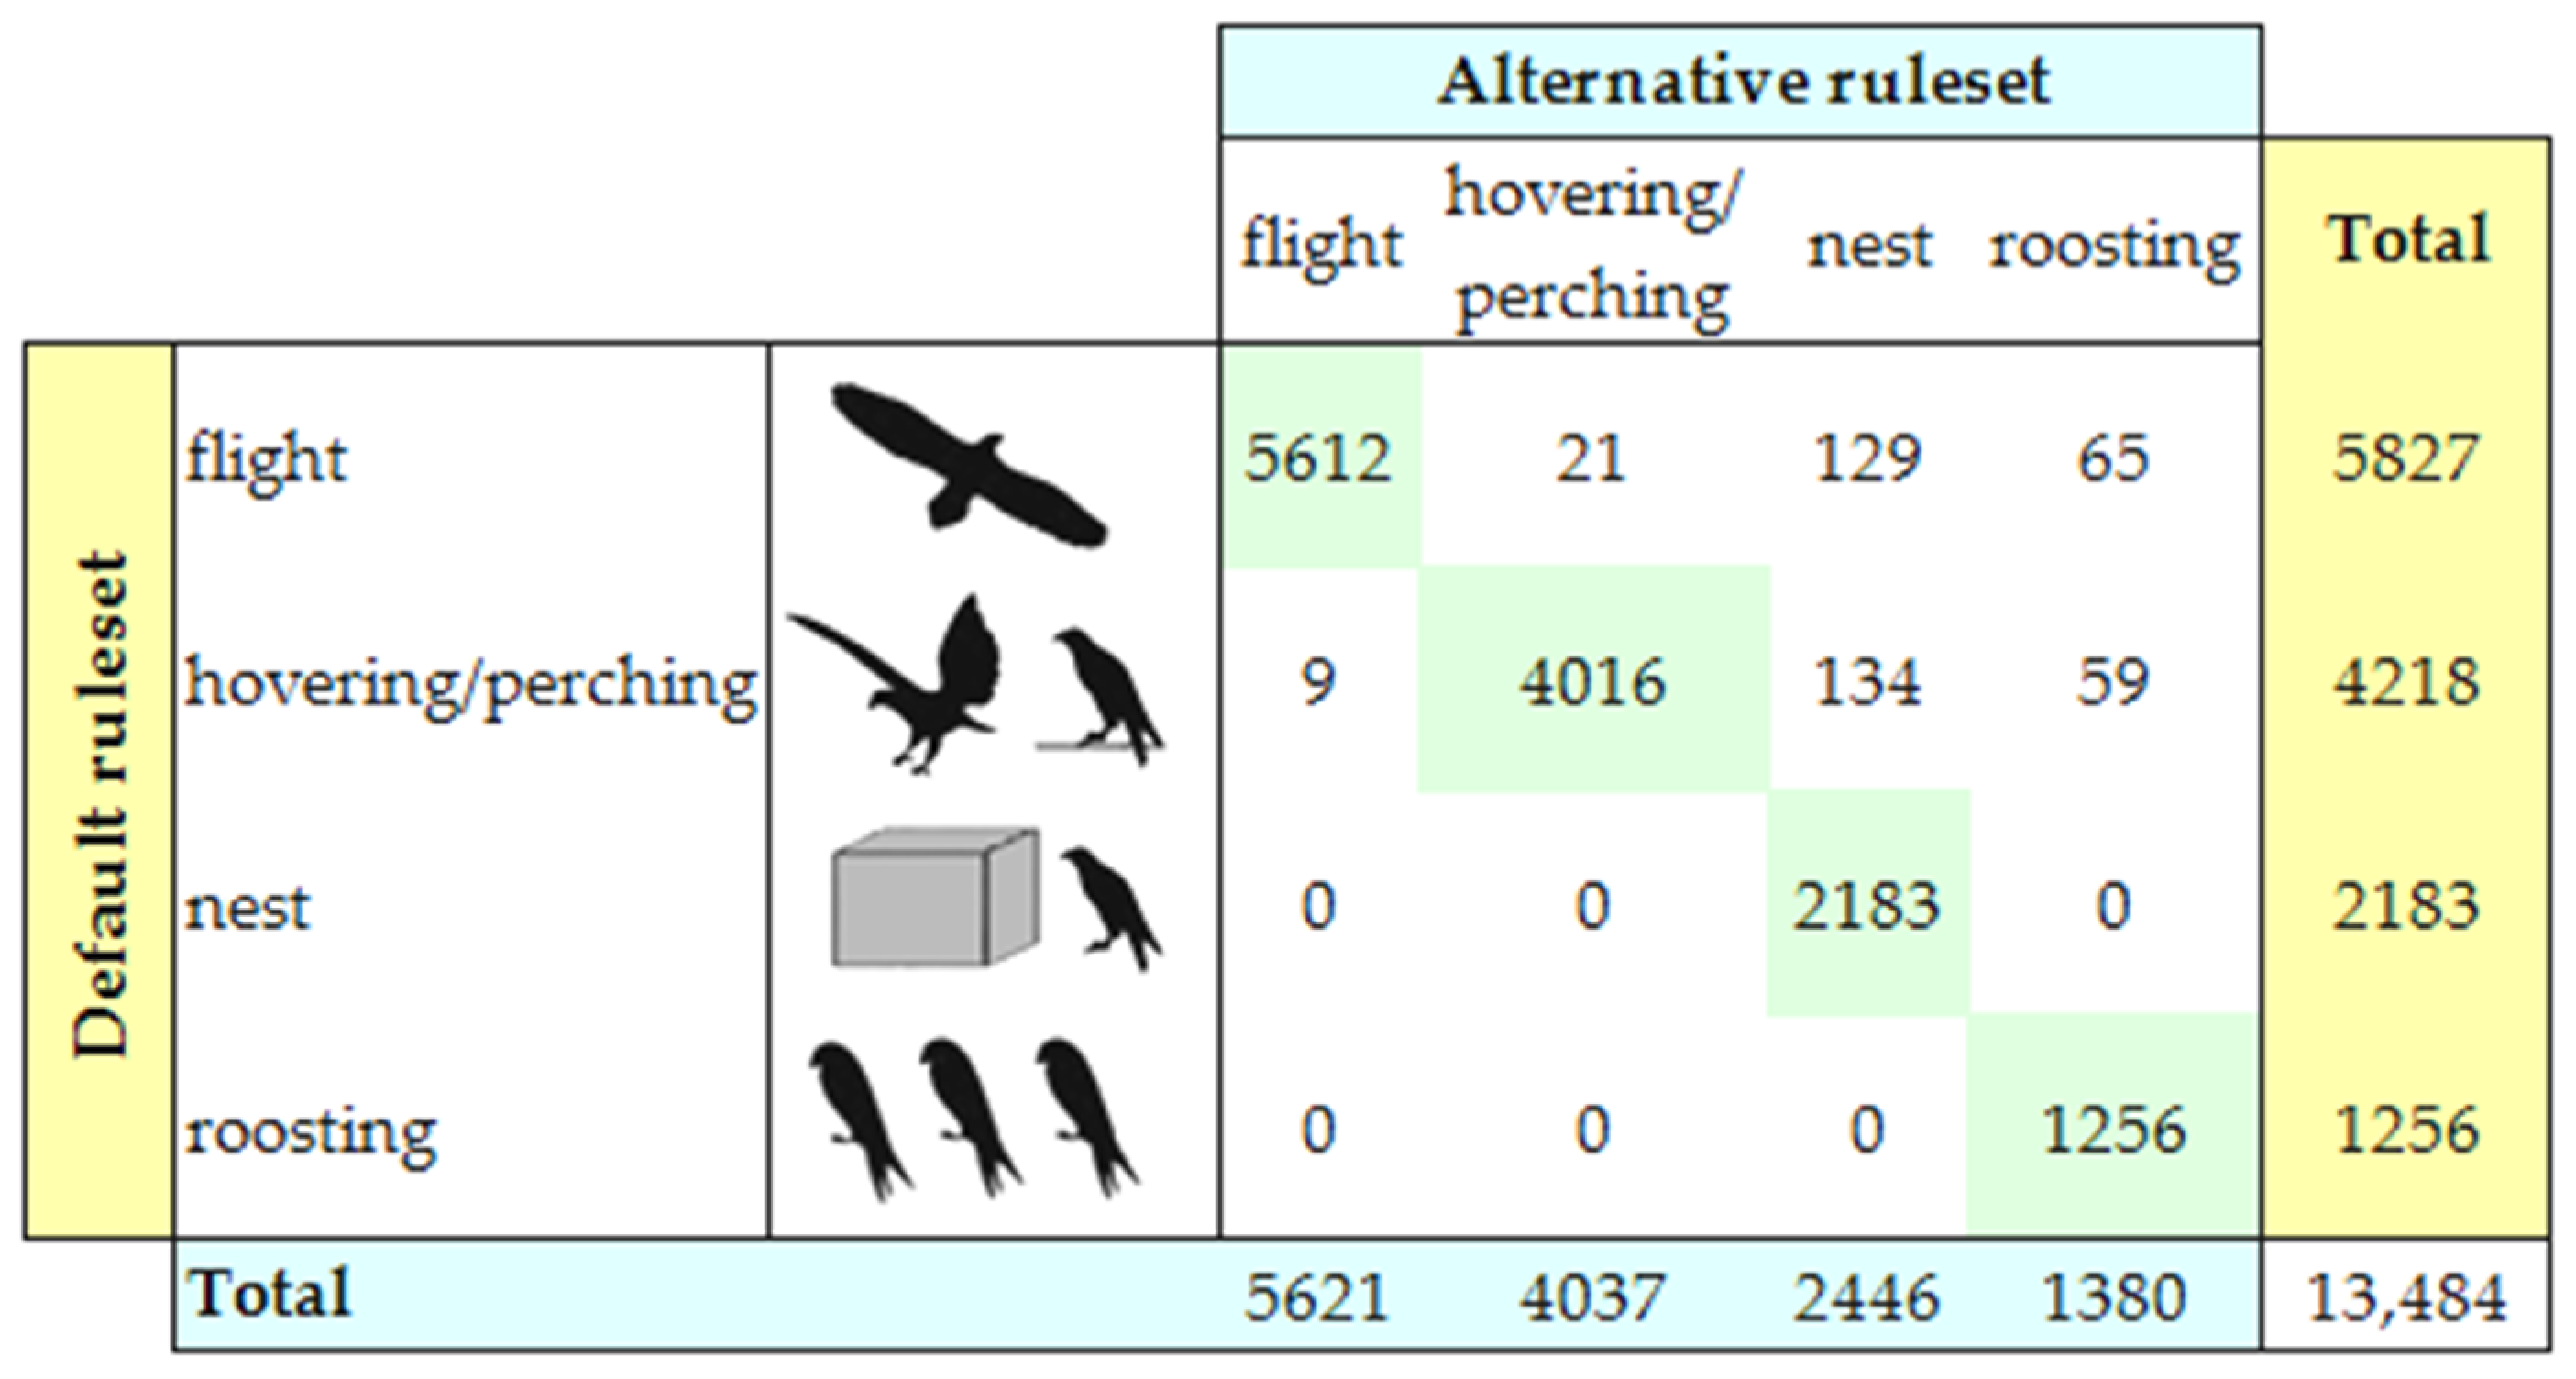
We used sensitivity analysis to evaluate the validity of the classification of previous GPS data [
14]. To take into account possible inaccuracies in the positional and speed data, we simulated different thresholds for
DN (2 m),
DR (2 m), and
FS (1 m/s), and calculated the corresponding confusion matrix, where each row represented the number of GPS points labelled in a certain class by using the default threshold ruleset (
DN = 1 m,
DR = 1 m,
FS = 0 m/s), and each column represented the number of GPS points labelled in an alternative class by using the alternative ruleset. The percentage of GPS points on the diagonal of the confusion matrix measured the robustness of our GPS data labelling (i.e., the number of GPS points that were classified in the same behavioral class by both the default and alternative threshold rulesets).
We analyzed the red-footed falcons’ behaviors on monthly, daily, and hourly bases by using the chi-squared goodness-of-fit test for count data [
23]. Tests were considered to be significant for
p < 0.01.
3. Results
Our dataset amounted to 13,484 GPS points (
Figure 1), of which 3070 in June and 10,414 in July, 10,278 in daytime, and 3206 in night-time.
The GPS dataset was split by UABE into the following time-activity budgets: flight (43.2% of the time; i.e., 5827 GPS points out of 13,484), hovering or perching (31.3% of the time; 4218 GPS points), activity at nest (16.2%; 2183 GPS points), roosting (9.3%; 1256 GPS points). The detected time-activity budgets significantly differed from the null hypothesis of perfect balance among the four activities (constrained sample vs. expected chi-squared test = 3748.9; d.f. = 3; p < 0.01).
Sensitivity analysis validated the identification of the activity states. In fact, 96.91% of the GPS points was labelled in the same class by both the default and alternative threshold rulesets (
Figure 2). The alternative ruleset estimated higher values for the two behavioral classes of “activity at nest” and “roosting”, and lower values for the two classes of “flight” and “hovering/perching”.
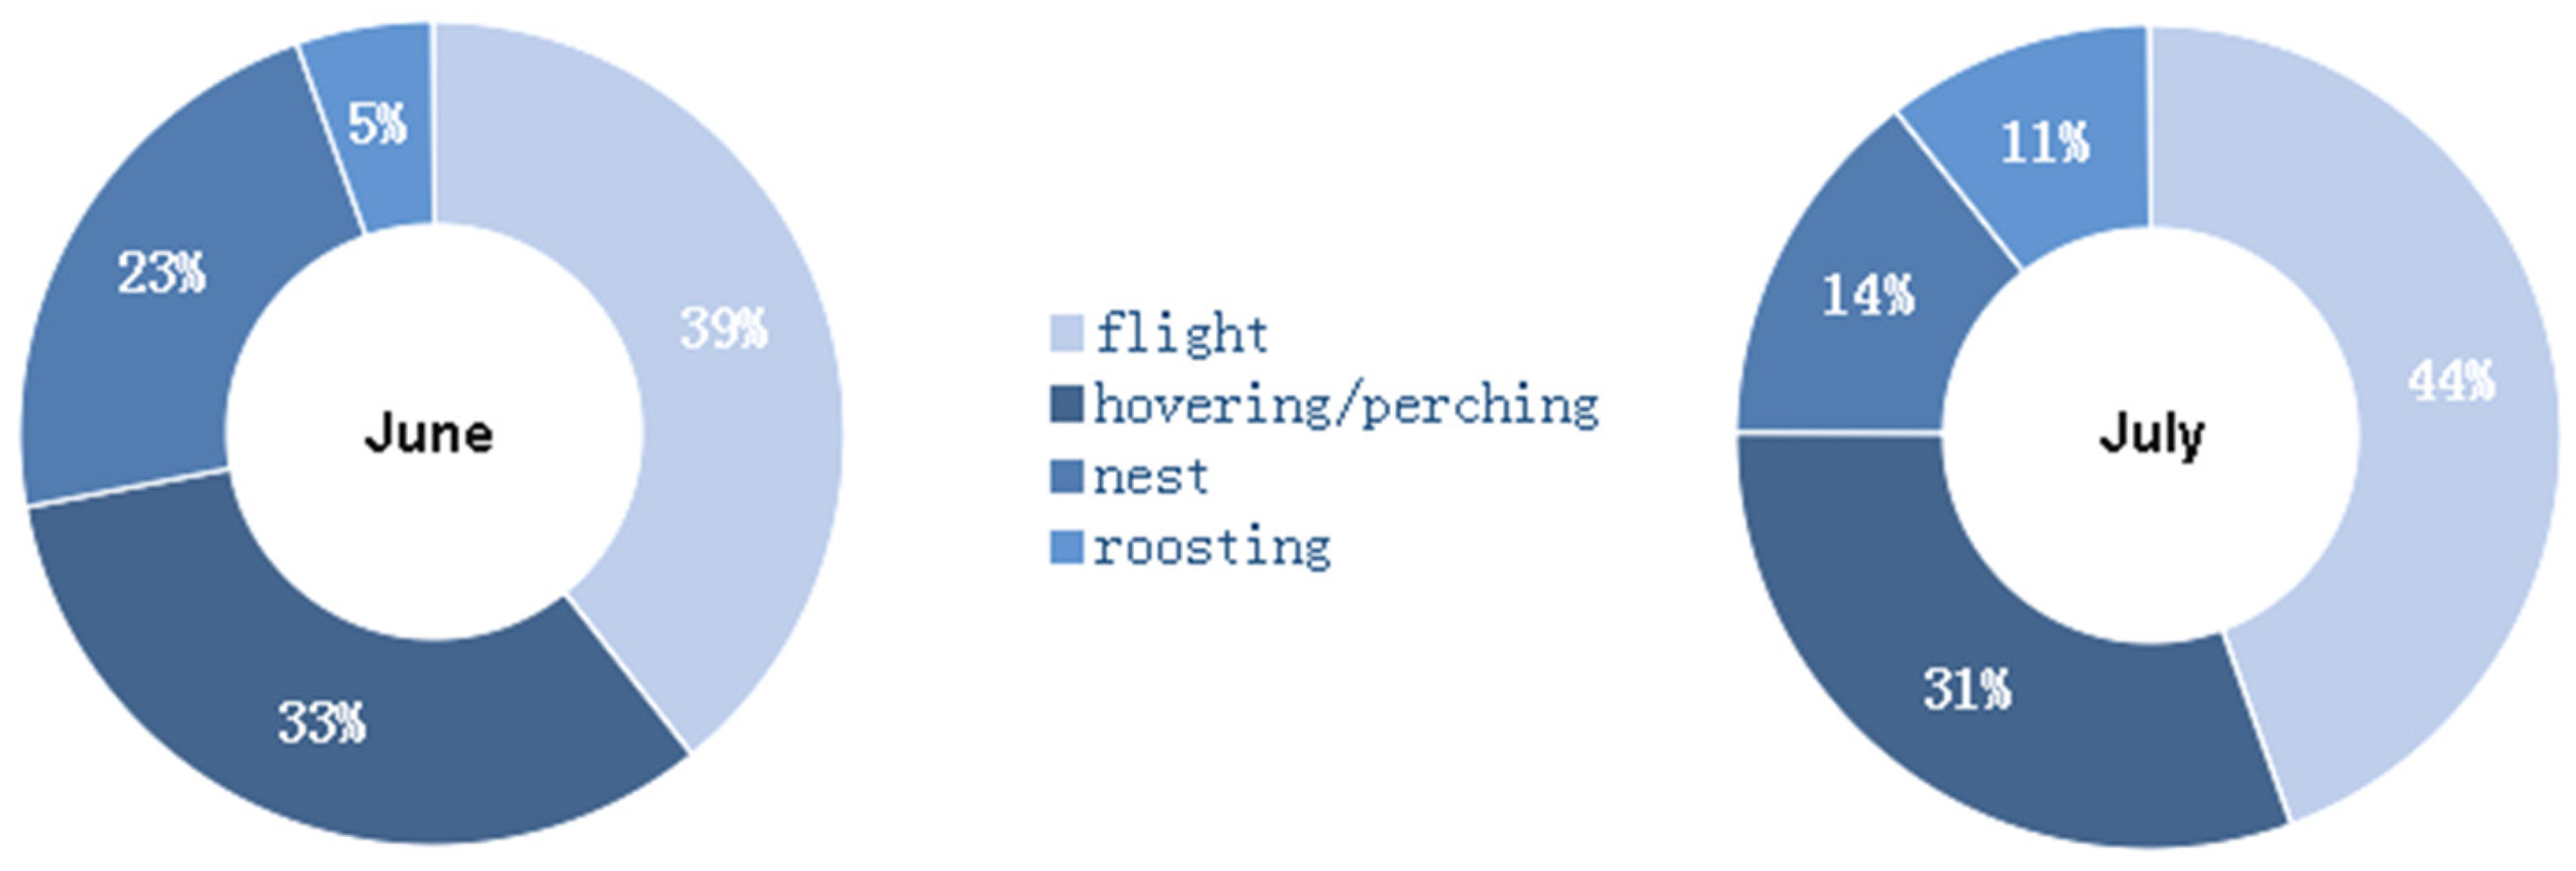
In both June (constrained sample vs. expected chi-squared test = 807.76; d.f. = 3;
p < 0.01) and July (constrained sample vs. expected chi-squared test = 3059.4; d.f. = 3;
p < 0.01), the behavioral classes were unevenly distributed with respect to the null hypothesis of a perfect balance among the four activities (
Figure 3). In July, the activity at nest decreased by 9% with respect to June, while roosting and flight activity increased by 6% and 5%, respectively (indicating that the tracked individuals were less compelled to stay at the nest for bringing food to the nestlings, guarding the nest, and driving away intruders). The June vs. July activity budgets were significantly different (unconstrained Sample 1 vs. Sample 2 chi-squared test = 185.26; d.f. = 4;
p < 0.01).
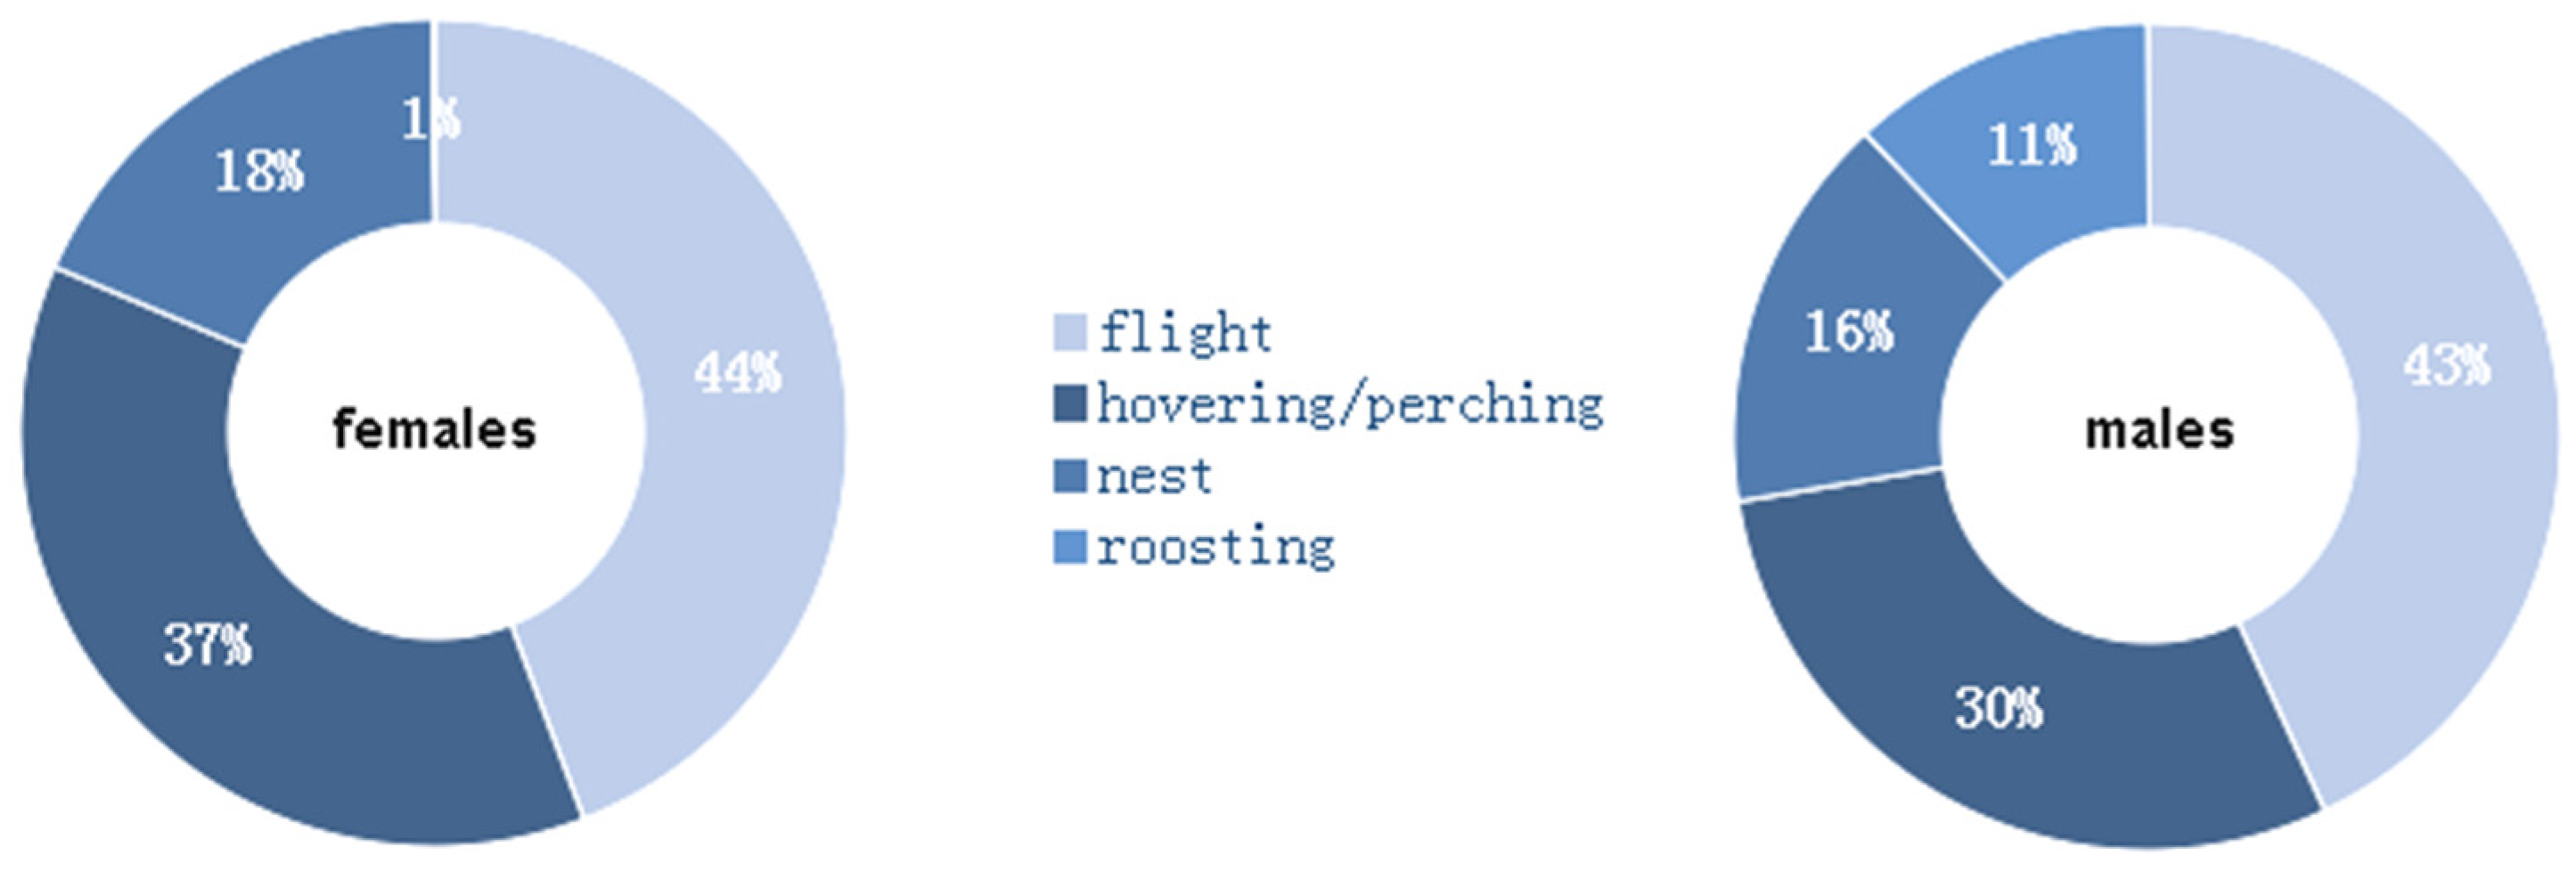
Both females (constrained sample vs. expected chi-squared test = 1405.4; d.f. = 3;
p < 0.01) and males (constrained sample vs. expected chi-squared test = 2538.4; d.f. = 3;
p < 0.01) diverged from the perfect balance among the four activities (
Figure 4). While roosting was almost null in females, this activity occupied 11% of the time in male red-footed falcons. By contrast, females spent 7% more of the time than males did for hovering and perching. The male vs. female activity budgets were significantly different (unconstrained Sample 1 vs. Sample 2 chi-squared test = 406.34; d.f. = 4;
p < 0.01).
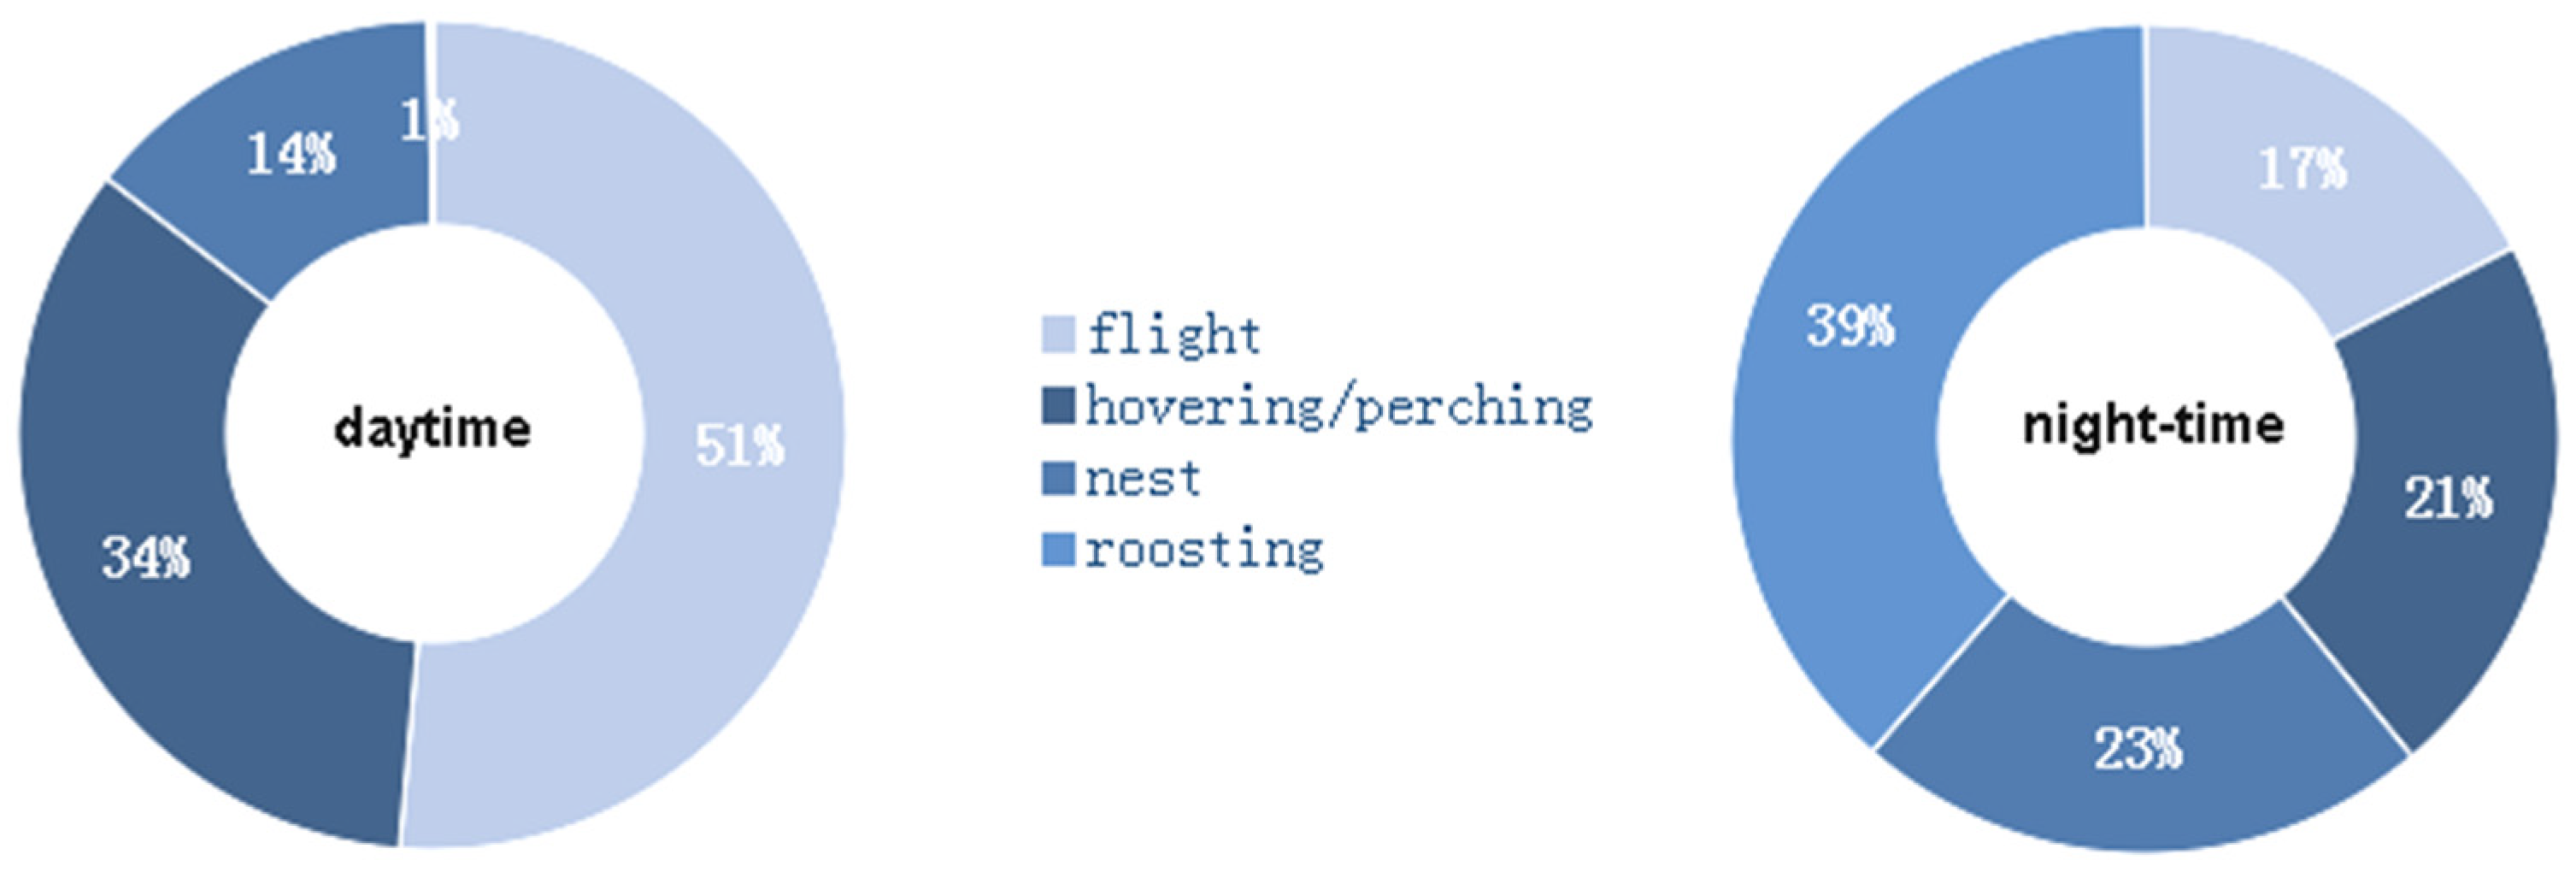
In the daytime, the red-footed falcons spent 51% of the time in flight, while hovering or perching activity accounted for 34% of the time (
Figure 5). In the night-time, flight activity was one-third of that in the daytime, while roosting increased by up to 39% of the time (1% in the daytime). Both in daytime (one constraint sample vs. expected chi-squared test = 6209.80; d.f. = 3;
p < 0.01) and at night (one constraint sample vs. expected chi-squared test = 334.66; d.f. = 3;
p < 0.01), the red-footed falcons’ behavior deviated from the null hypothesis of perfect balance among the four activities. The daytime vs. night-time activity budgets were significantly different (unconstrained Sample 1 vs. Sample 2 chi-squared test = 4756.9; d.f. = 4;
p < 0.01).
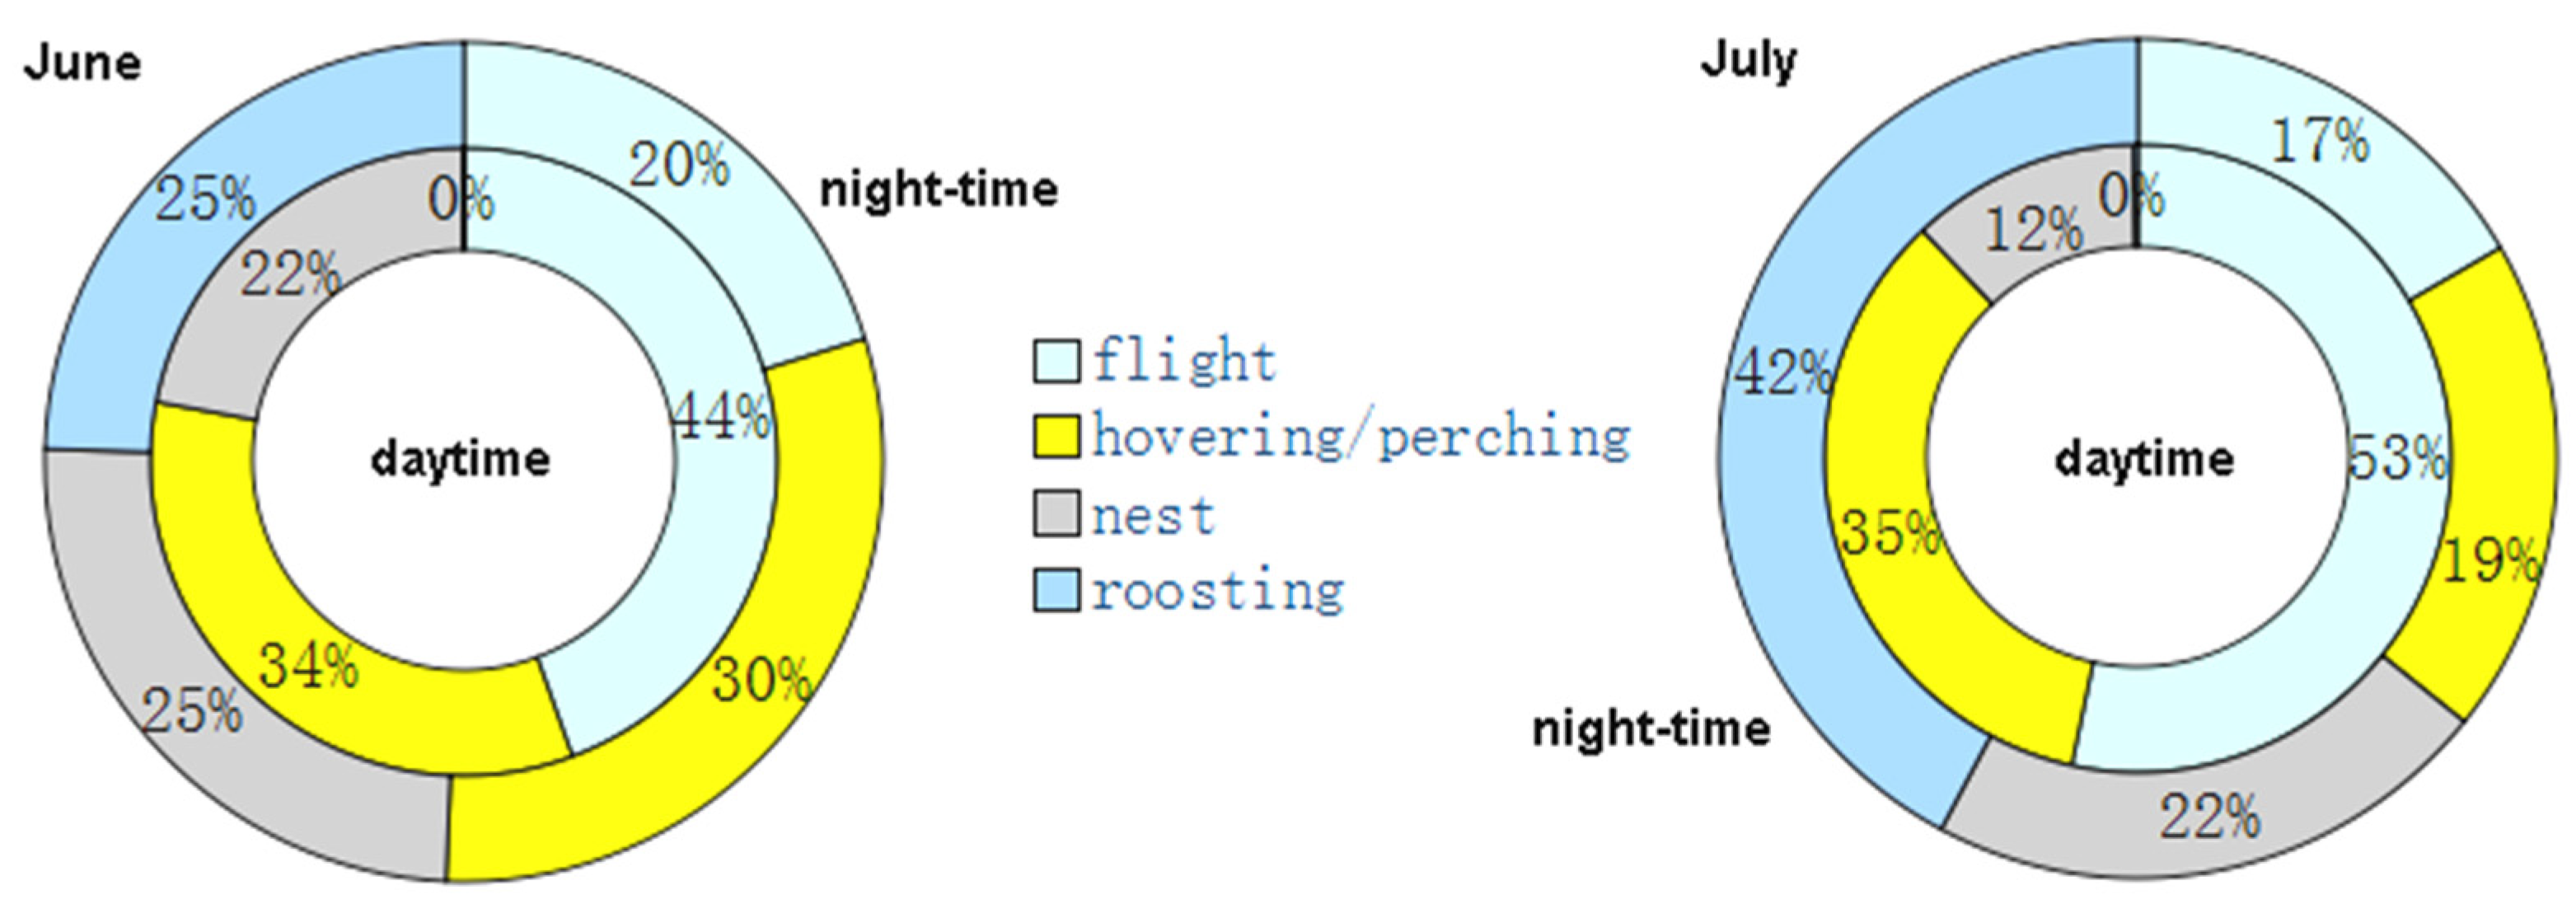
The nested ethograms (
Figure 6) show that, in June, the red-footed falcons’ behavior diverged between the daytime and night-time, primarily because of flight activity (44% and 20%, respectively) and roosting (<1% and 25%, respectively). Instead, hovering or perching and activity at the nest occupied about the same amount of time. By contrast, in July, all of the four behaviors were largely different between daytime and night-time, particularly roosting (<1% in the daytime and 42% at night).
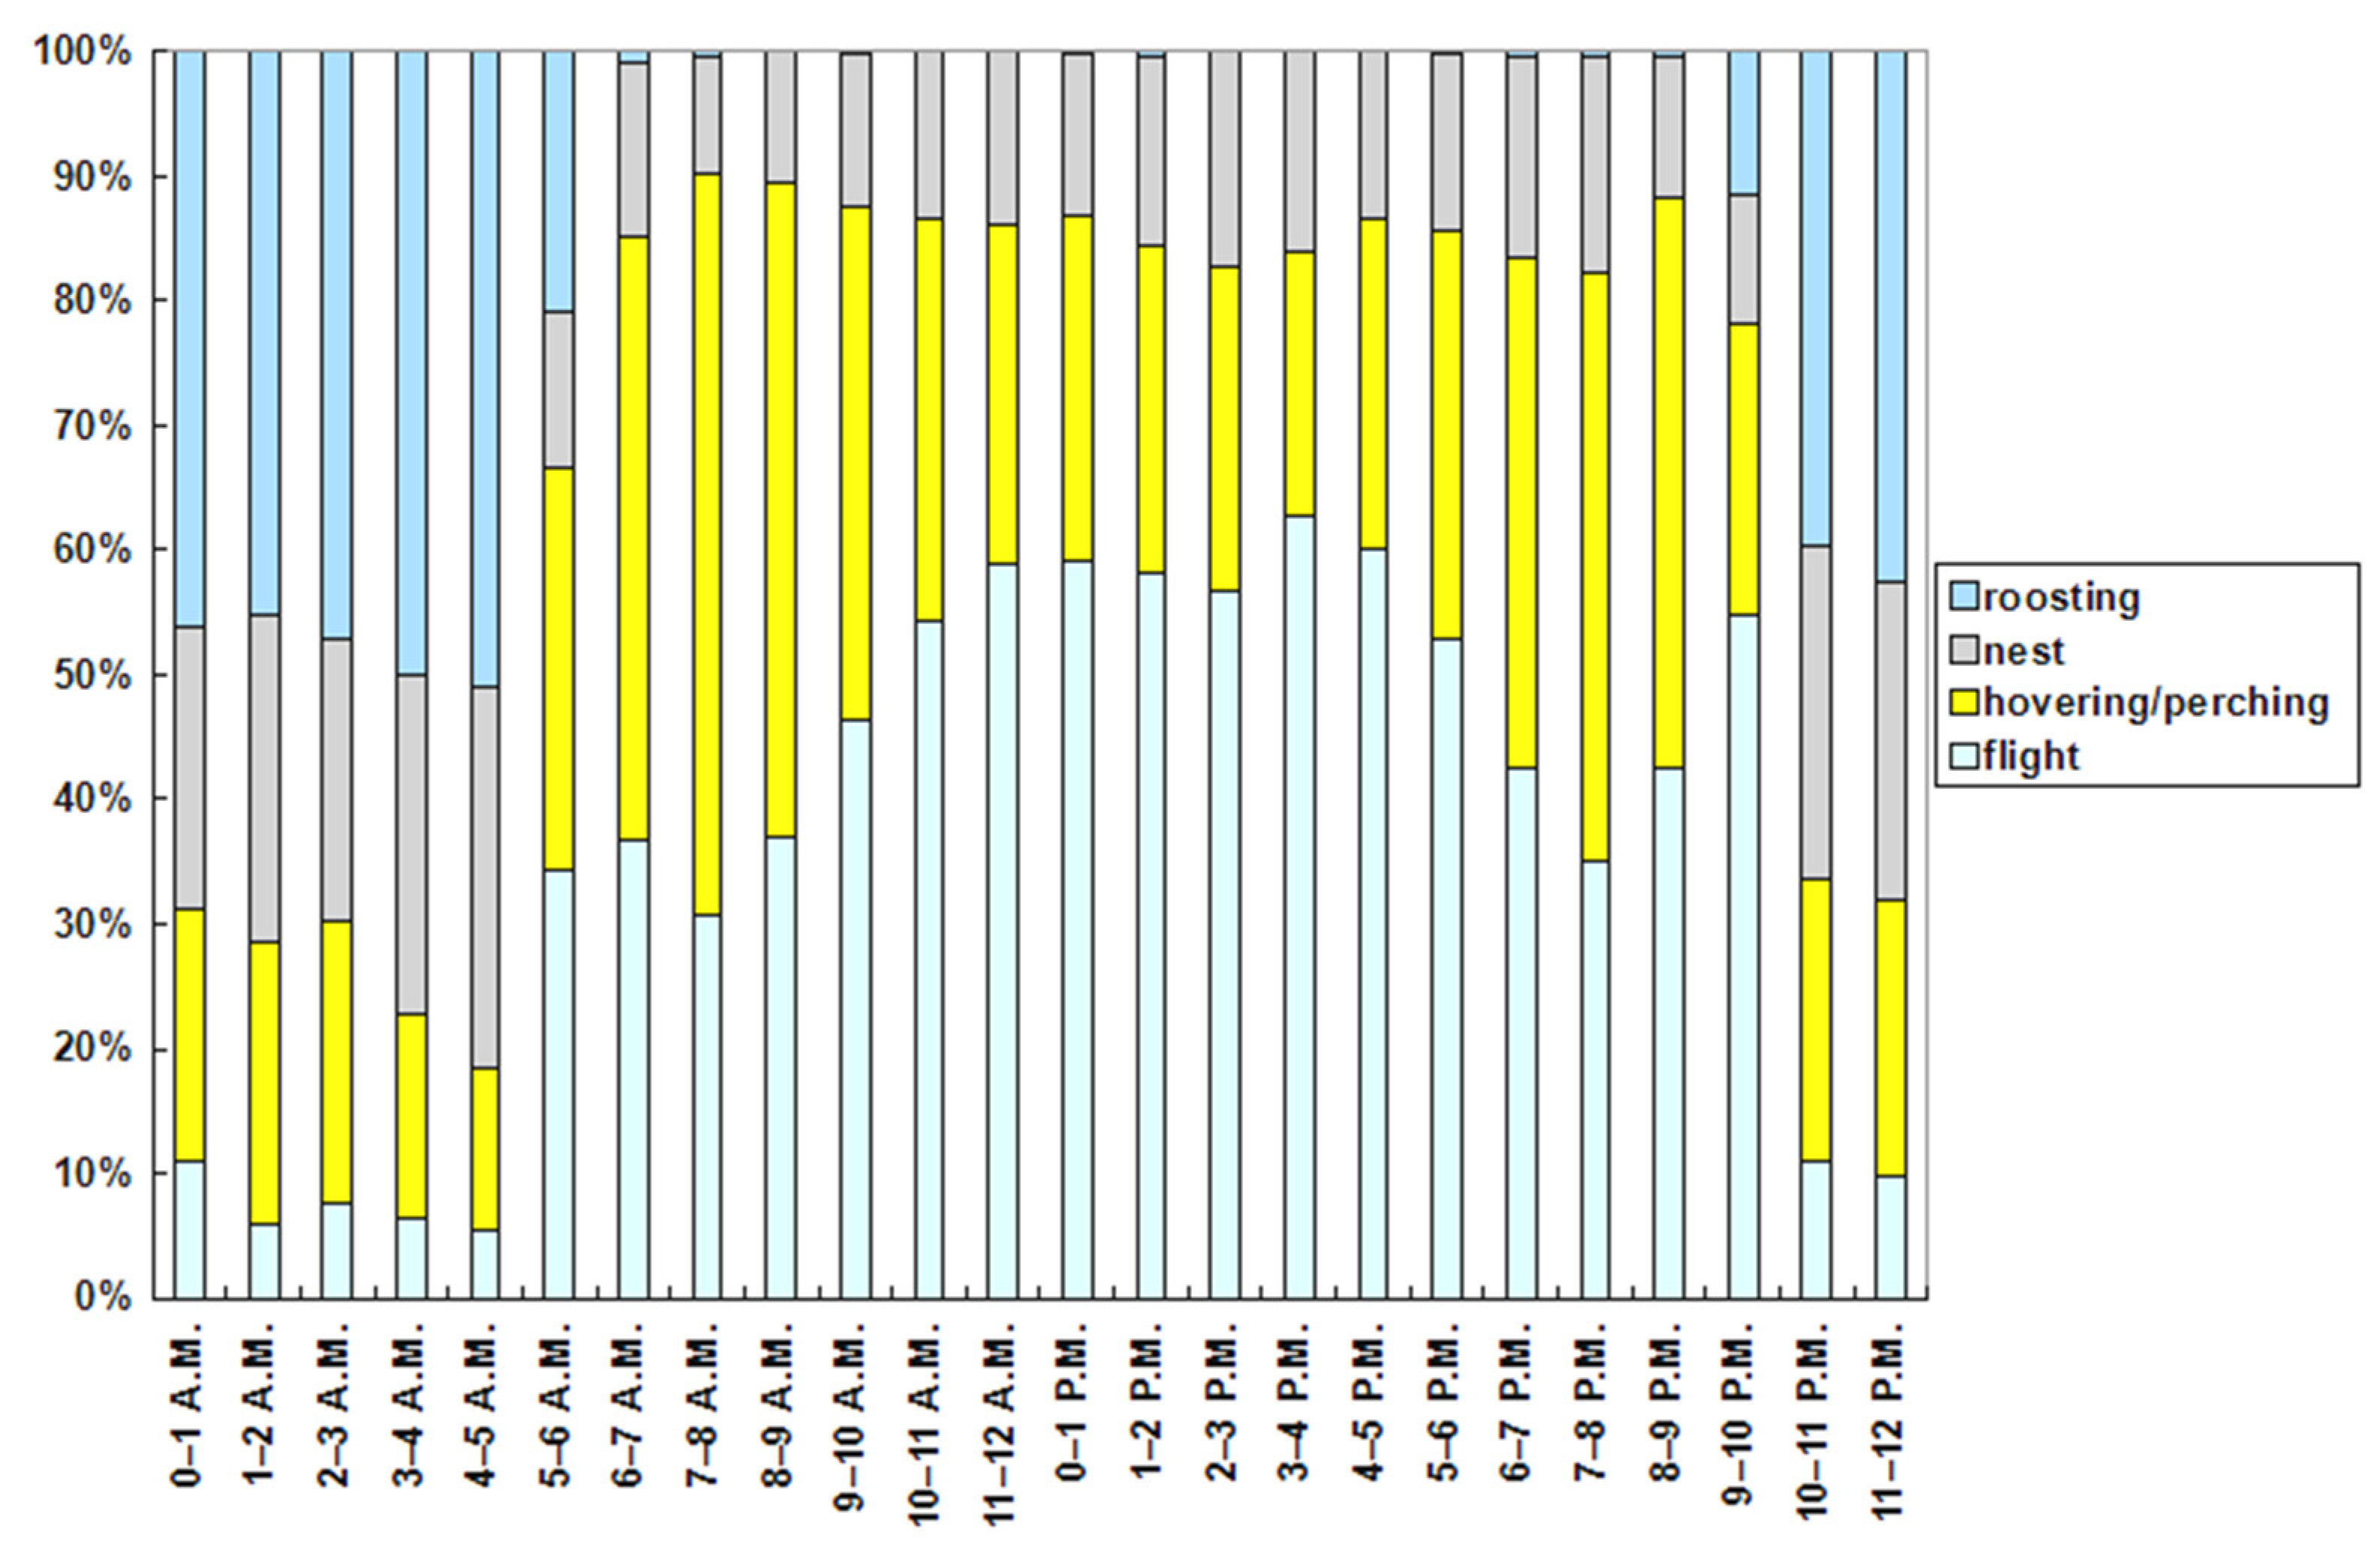
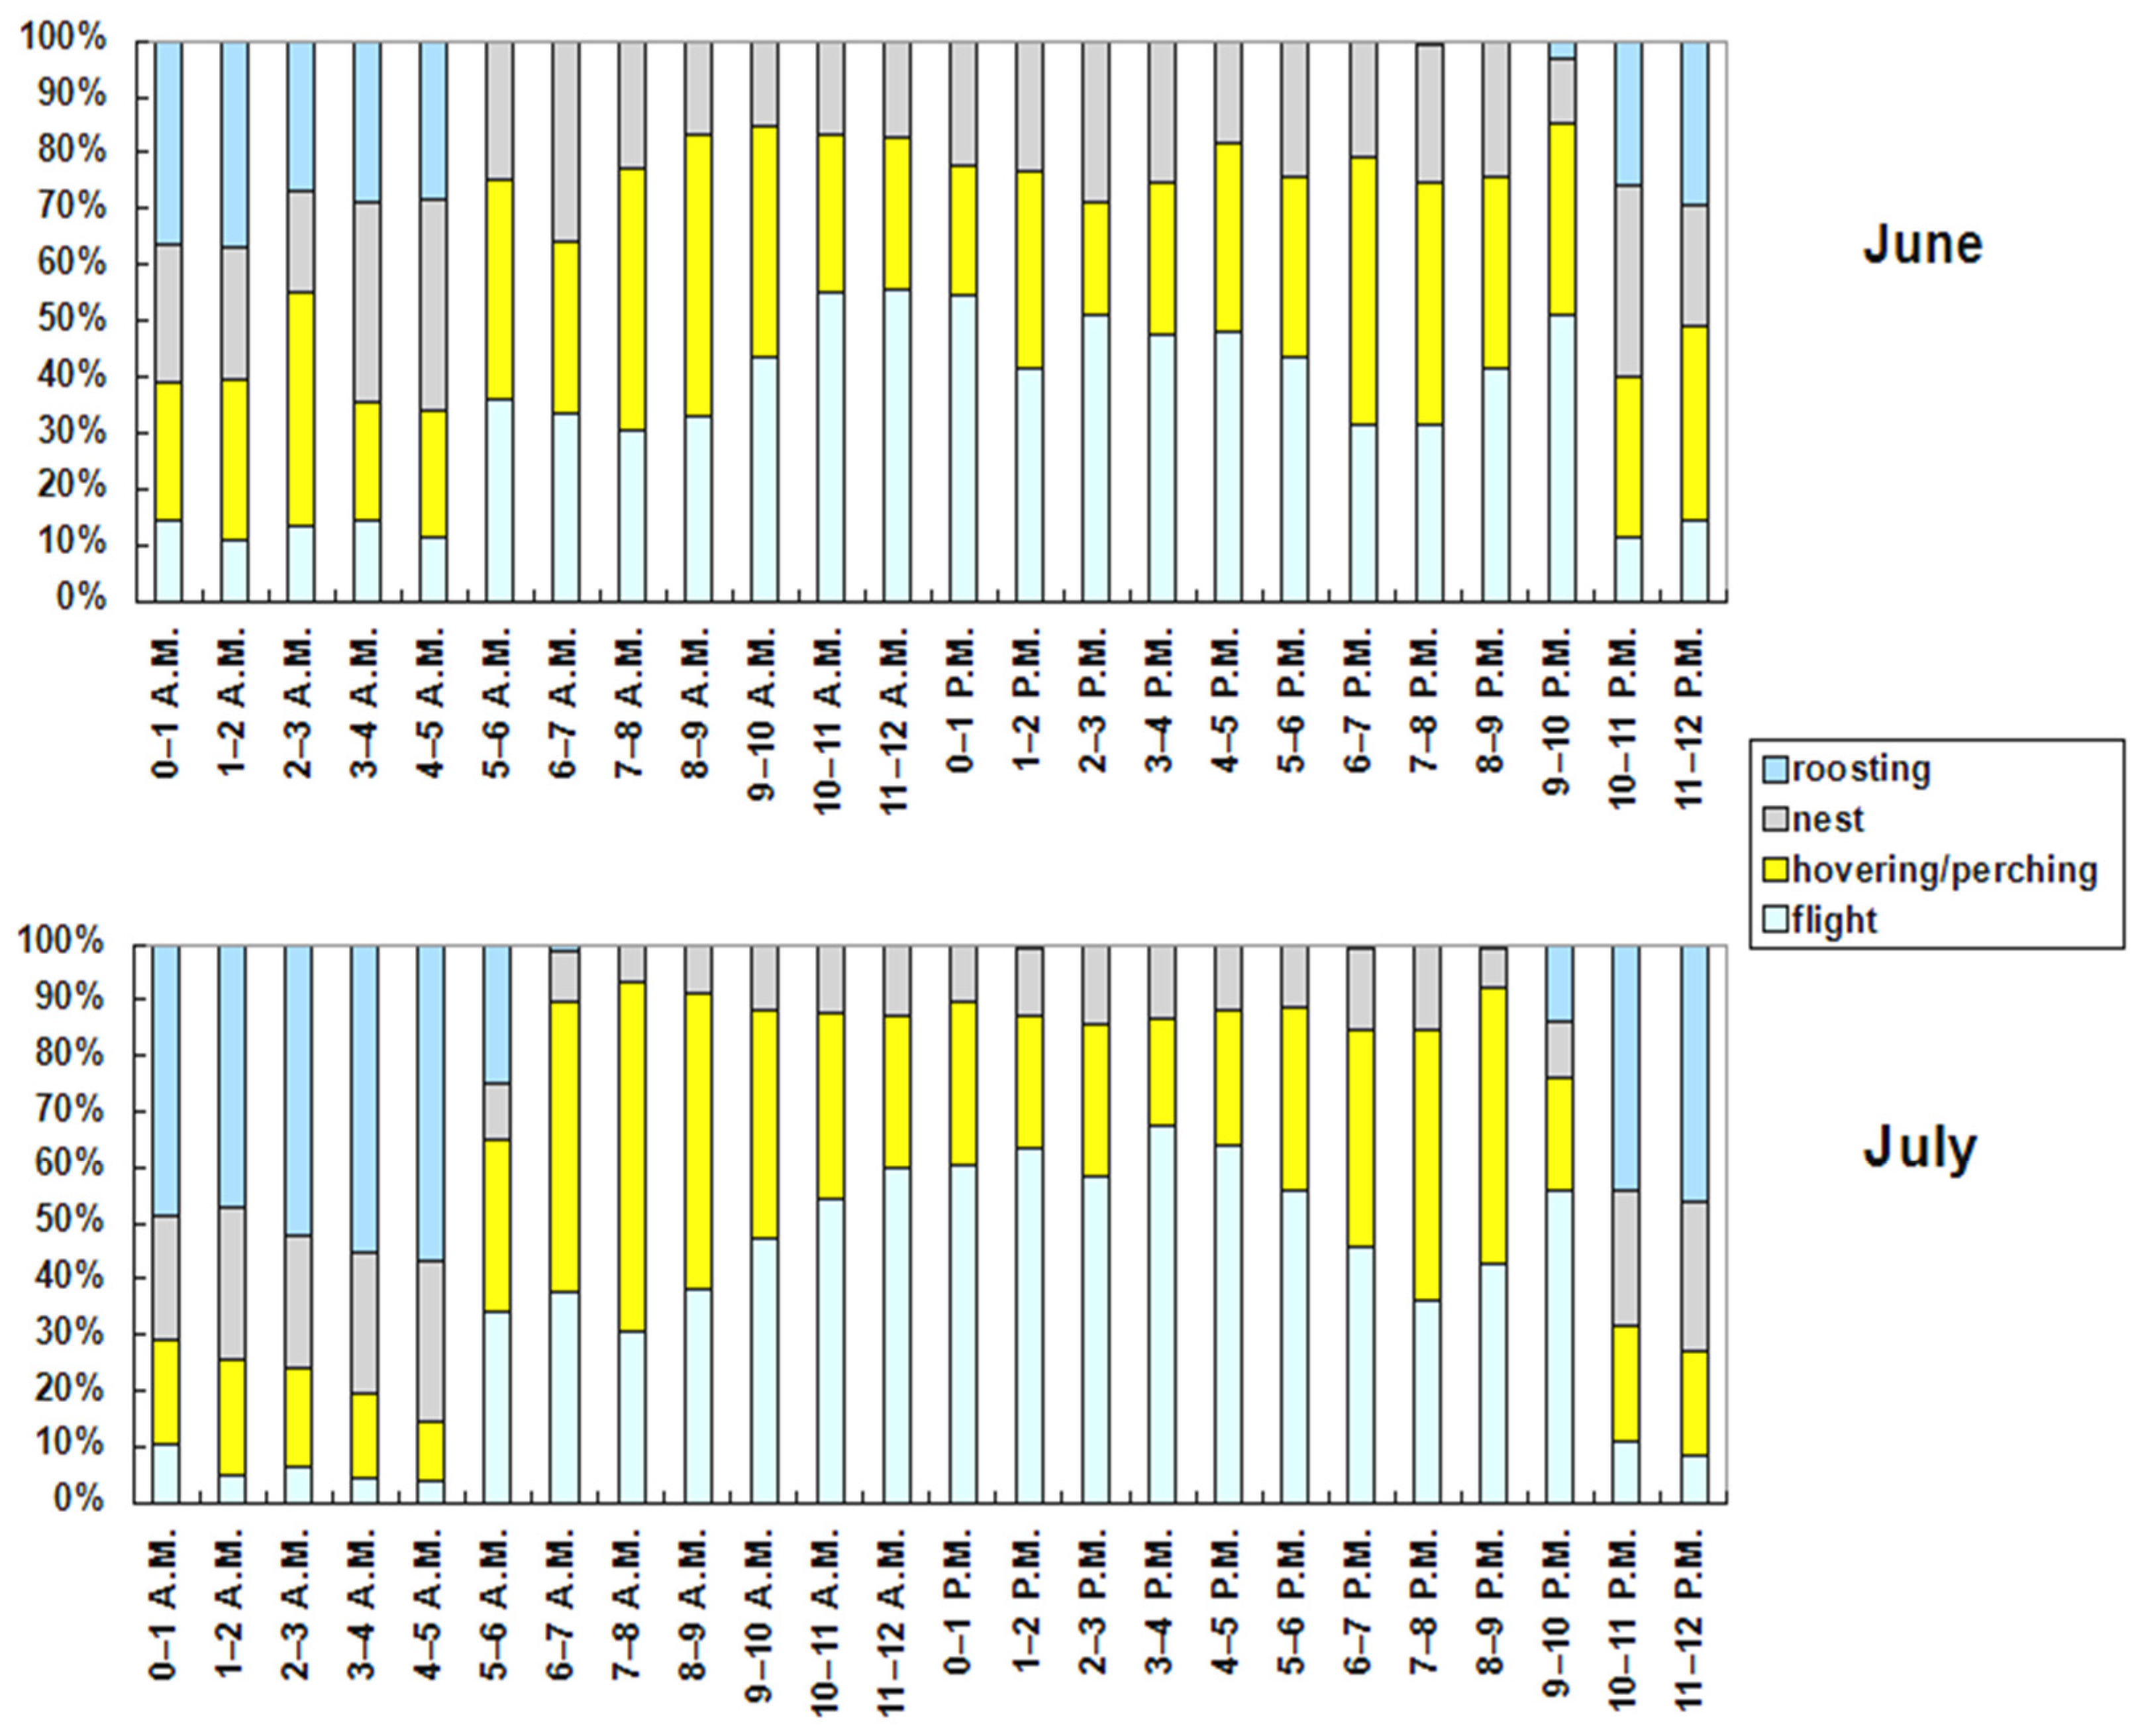
The hourly ethogram (
Figure 7) shows clear patterns of the red-footed falcons’ behaviors. The flight activity was the maximum between 3 and 4 p.m. (62.87% of time) and the minimum between 4 and 5 a.m. (5.46% of time). It was elevated even after sundown (9–10 p.m.; 54.87% of time). Hovering or perching was the maximum in the 3 h interval after sunrise (6–9 a.m.; between 48% and 60% of time), and the minimum at night between 3 and 5 a.m. (<18% of time). It was also elevated in the 3 h interval before sundown (6–9 p.m.; between 40 % and 48% of time). The activity at nest was the maximum between 4 and 5 a.m. (30.65% of time) and the minimum between 7 and 8 a.m. (9.42% of time). Roosting was the maximum between 3 and 5 a.m. (>50% of time), and the minimum throughout all of the daytime (<1% of time). Although the hourly ethogram was similar between June and July (
Figure 8), two activities (flight and roosting) in general increased in all the hourly intervals in July, while hovering or perching and activity at the nest decreased.
4. Discussion
In this work, we provided a detailed description of the red-footed falcons’ behavior during the nestling period using an unsupervised methodology based on a machine-learning framework [
14] without the support of expensive ancillary data.
The red-footed falcons’ behavior was significantly differentiated between sexes, months, daytime and night-time, and hours of the day. During the nestling period, this population carried out two prevalent activities (flight and hovering or perching) and two less frequent ones (activity at nest and roosting). While this hierarchy held between June and July and between sexes, it reverted between daytime and night-time, and highly varied on an hourly basis. Flight and hovering or perching were the dominant activities in the daytime, but they decreased a lot in the night-time in favor of the activity at nest and roosting. On an hourly basis, the detected behavioral hierarchy changed continuously although with a trend that approximately followed a daytime/night-time scheme.
The red-footed falcons spent 77% of time out of the nest in June and 86% in July, 86% in daytime and 77% in night-time. The nocturnal activities out of the nest were first detected in 2019 and 2020 for a smaller sample of individuals [
24,
25]. At night, the red-footed falcons of these two colonies used to carry out a frequent hunting activity (perching and hovering) in the close surroundings of the nests, probably because, during the daylight hours, they are unable to find enough prey due to the degradation of the foraging habitat [
24]. The frequent nocturnal flights are partly due to movements from or to the roost sites and partly aimed at supporting these short-distance hunting activities [
25]. The enlarged dataset used in this study confirmed this unexpected trend of a typically diurnal species.
The decrease in the activity at the nest from June to July was not surprising. During the nestling period, the red-footed falcons’ activity at the nest has several functions [
26]: the adults regularly bring food to the nestlings, rest, drive away the intruders, and guard the nest. During the first two–three weeks of age (in June), chicks require frequent parental care, while after about 30 days (in July), they are ready to leave the nest, at least temporarily [
27]. The decrease in activity at the nest in July allowed for the red-footed falcons to increase their activities out of the nest; in fact, the percentages of time dedicated to flight, roosting, and hovering or perching increased in this month. Interestingly, the main difference between male and female red-footed falcons was not activity at the nest, but roosting instead. However, this difference in the activity budgets between sexes occurred only at night.
From a methodological viewpoint, we valued the chance provided by UABE to build regular, nested, and hourly unsupervised ethograms, each of which revealed something new about the red-footed falcons’ behavior during the nestling period. However, we were unable to distinguish between hovering and perching. Power lines, pylons, and telephone cables are rather common in the study area, but not easily discernible in the digital orthophotos available for this study. Therefore, we could not distinguish between birds sitting on these vantage points or motionless in the air while hovering. Our field surveys were not sufficient to untangle this issue, as we observed both active and passive hunting. However, both hovering and perching belong to hunting behavior; thus, we regarded them as complementary hunting activities. In addition, UABE was unable to detect certain sub-behaviors. In particular, flight activity could have been used by the red-footed falcons to move from Point A to Point B, but also for aerial insect capture [
22]. In addition, the red-footed falcon’s activity at the nest involved several sub-behaviors that could not be individuated, such as bringing food to the nestlings and guarding the nest [
26,
27]. These limitations are inherent to conventional biotelemetry, where the collection of the ancillary data is impracticable, and they cannot be fixed by either the UABE or in general by other unsupervised methods. In order to overcome these limitations, the only solution would have been the use of the supervised classification of sensor data in combination with ancillary data regarding the birds’ behavior [
28]. However, this would have required behavioral observations at the time when movement data were collected, i.e., hundreds or thousands of records in June and July corresponding to field observations and/or video analyses as the training input. Budgetary limitations deterred us from using ancillary data. In addition, direct observation could have caused a deviation from normal behavior, as the presence of humans is easily perceived by the red-footed falcons [
29].
In this study, we used a 100% (i.e., 24 h on) duty cycle of the loggers because our previous studies on falcons [
30,
31] showed that they can be characterized by an unexpected attitude towards frequent nocturnal flights.
Implications for Conservation
Human disturbance is regarded as one of the principal issues in biodiversity conservation. Exposure to human activities can modify behavioural patterns and physiological status, with effects on individual fitness and on population dynamics [
32]. Animals may perceive humans as potential predators and apply different antipredator responses; thus, the effects of human disturbance on animals may be measured through changes in spatial distribution, habitat use, and/or behavioral patterns consistent with antipredatory strategies [
33,
34]. For example, the probability of detecting birds in flight is higher in response to higher levels of human disturbance, as escape requires more flying time to the detriment of foraging or resting [
35,
36].
Accordingly, our results can be of great importance for the conservation of this red-footed falcon population, as they provide an assessment of its current time-activity budgets with which results of future studies can be compared in order to detect potential behavioral changes acting as early warnings of increased human disturbance (particularly, agricultural practices). More in general, the recently introduced UABE methodology is low-cost and noninvasive tool (i.e., it does not require expensive and extended field surveys that could also induce a deviation from normal animal behavior) that provides quantitative baselines to support conservation plans.
5. Conclusions
Our study first documented the red-footed falcon’s time-activity budgets during the nestling period. It demonstrated that this species follows sharp time-dependent (monthly, daily, hourly) behaviors that can be proficiently extracted using an unsupervised machine-learning approach based on if-then-else rules. Sex is another variable that significantly influences the red-footed falcon’s time-activity budgets, in particular with regard to roosting activity. All the detected behavioral patterns could be explained in light of ecological and biological reasons, which supports the solidity of our results.
In addition, our study demonstrates that a mixed approach combining inductive and deductive unsupervised steps is able to reliably derive animal behavior, even in the absence of auxiliary data. Future studies on this red-footed falcon population should involve a larger number of individuals, in particular females, in order to also detect differences between subjects and within the population.


