Article

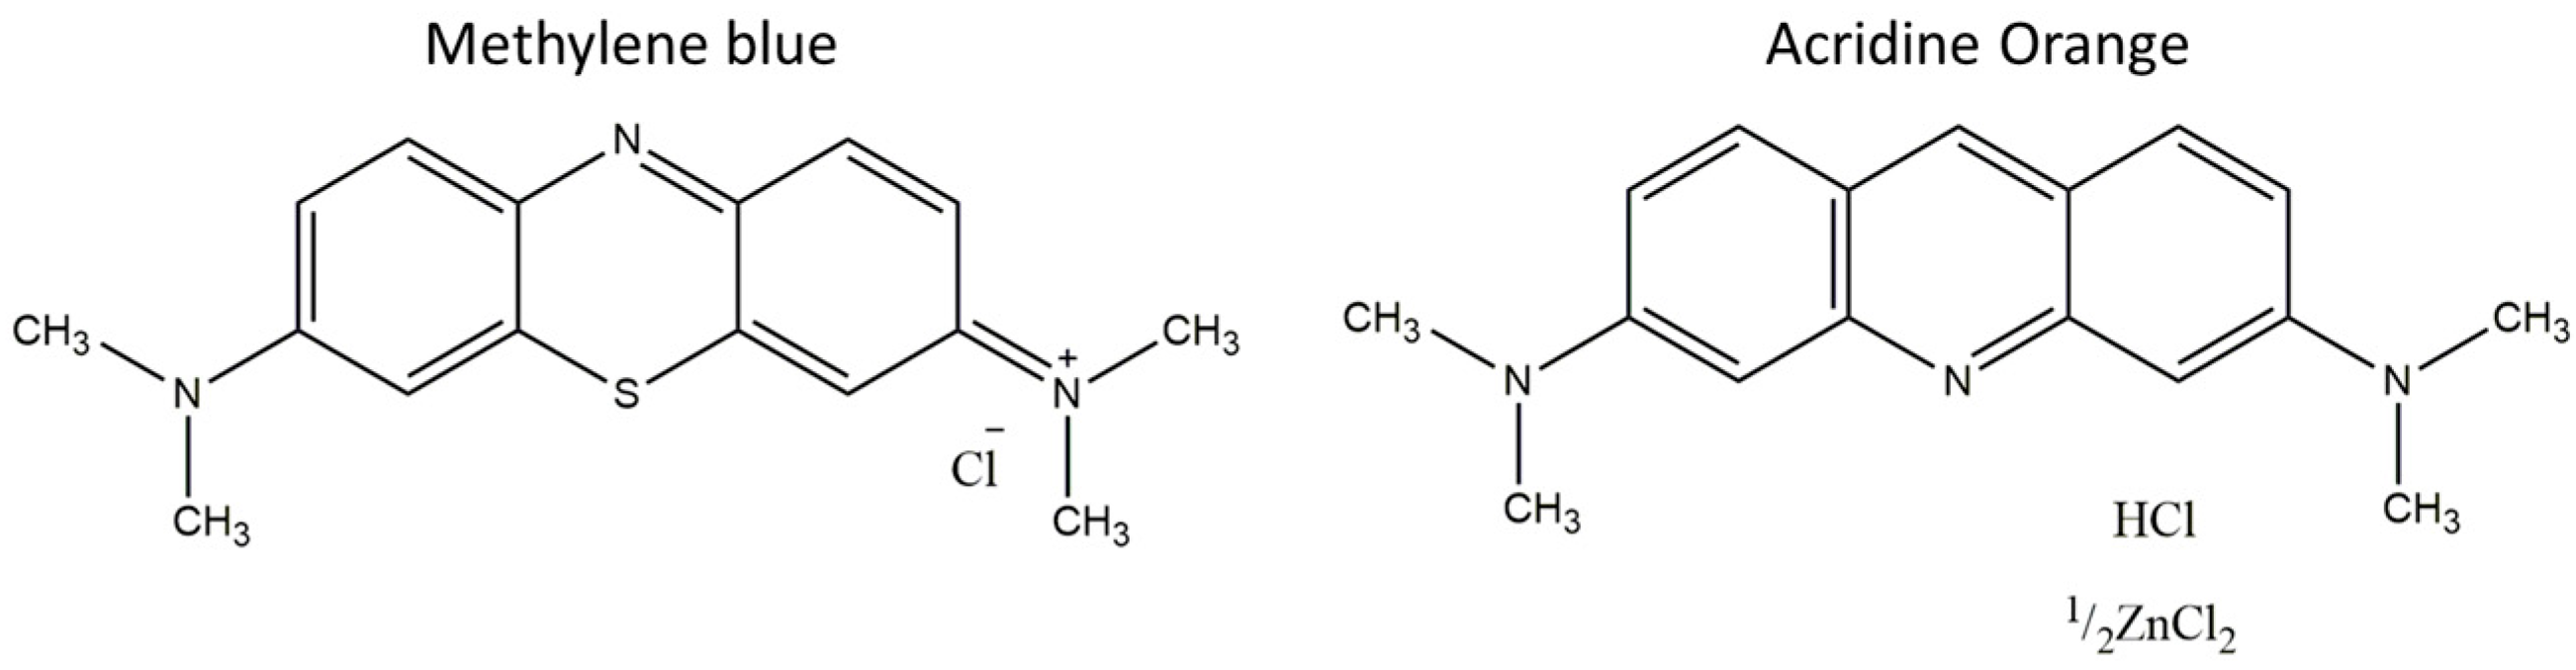
The Effect of UV-Vis Radiation on DNA Systems Containing the Photosensitizers Methylene Blue and Acridine Orange

1
CEFITEC, Department of Physics, NOVA School of Science and Technology, Universidade NOVA de Lisboa, 2829-516 Caparica, Portugal
2
Laboratory of Instrumentation, Biomedical Engineering and Radiation Physics (LIBPhys-UNL), Department of Physics, NOVA School of Science and Technology, Universidade NOVA de Lisboa, 2829-516 Caparica, Portugal
*
Authors to whom correspondence should be addressed.
Biophysica 2024, 4(1), 22-33; https://doi.org/10.3390/biophysica4010002
Submission received: 4 December 2023 / Revised: 30 December 2023 / Accepted: 8 January 2024 / Published: 12 January 2024
(This article belongs to the Special Issue Biological Effects of Ionizing Radiation)

Abstract

:
As a vital biomolecule, DNA is known as a target of antineoplastic drugs for cancer therapy. These drugs can show different modes of interaction with DNA, with intercalation and groove binding being the most common types. The intercalation of anticancer drugs with DNA can lead to the disruption of its normal function, influencing cell proliferation. Methylene blue (MB) and acridine orange (AO) are examples of DNA-intercalating agents that have been studied for their application against some types of cancer, mainly for photodynamic therapy. In this work, the impact of light irradiation on these compounds in the absence and presence of DNA was analyzed by means of UV-vis spectroscopy. Bathochromic and hypochromic shifts were observed in the absorbance spectra, revealing the intercalation of the dyes with the DNA base pairs. Dyes with and without DNA present different profiles of photodegradation, whereby the dyes alone were more susceptible to degradation. This can be justified by the intercalation of the dyes on the DNA base pairs allowing the DNA molecule to partially hinder the molecules’ exposition and, therefore, reducing their degradation.

1. Introduction

In living cells, deoxyribonucleic acid (DNA) plays an important role as the macromolecule responsible for genetic information carriage, and it is involved in several processes such as the synthesis of proteins and enzymes, mutagenesis, and carcinogenesis [1]. DNA is often pointed to as a target for drugs used in cancer therapy [2]. These drugs can interact with DNA mainly by means of intercalation or groove binding. DNA-intercalating molecules can interact through the insertion of these molecules between DNA base pairs, leading to disruption of their normal function and consequently affecting cell proliferation, resulting in anticancer activity [3,4,5]. Psoralen is an example of a molecule that is a DNA-intercalating agent and is used as a photosensitizer for photodynamic therapy applications [6,7]. Photosensitizers are molecules that, in the presence of O2 and upon activation by a determinate light wavelength, undergo photochemical reactions, producing reactive oxygen species (ROS) that can lead to cell death [8].
In this context, methylene blue (MB) is a photosensitizing agent that has been employed in many studies based on photodynamic therapy (PDT) for different types of cancer such as breast cancer, melanoma, and cervical cancer [9,10,11,12]. Due to the cationic nature of MB, it can interact with the DNA phosphate backbone through electrostatic interaction while a second possible interaction is attributed to the stacking with the DNA base pair, therefore in the intercalation mode [13,14,15,16].
Acridine orange (AO) is a weak base and known intercalating agent that is widely used in fluorescence. AO molecules can interact with acidic molecules such as double-stranded DNA, resulting in green fluorescence, or single-stranded DNA or RNA, resulting in red fluorescence, and can also interact with acidic structures such as lysosomes [13,17,18,19,20]. AO has already demonstrated promising application with PDT in bladder cancer and glioblastoma [21,22]. Furthermore, AO can be more selective to cancer cells. This selectivity is due to cancer cells presenting an acidic environment while normal cells are not acidic and because of that can eliminate AO quickly [23]. The dimeric form of AO presents electrostatic interactions predominantly with the DNA external part while the monomeric form acts mostly as an intercalator of the DNA base pairs [1]. As studied previously by Amado et al. [24], the interaction of DNA with AO presents two stages related to changes in the spectra with the increase in DNA. At low DNA concentrations, it presents a decrease in the ratio of absorbance at 490/470 nm, and in the second stage, there is an increase in the ratio, indicating aggregation of AO. Therefore, there is a certain proportion between AO and DNA that determines the mode of interaction.
For the application of drugs that interact with DNA, it is important to comprehend the involved interactions [1] as well as the effect of light irradiation on both DNA and molecules during PDT. The results obtained in previous studies in cell culture show the potential of MB and AO molecules (Figure 1) acting as photosensitizers [25,26,27]. As known DNA-intercalating agents, these compounds can play an important role in the photo-mediated damage of cancer cells. In this work, the interaction and the effect of radiation at different wavelengths were investigated for MB and AO molecules in the absence and presence of DNA. The results demonstrated that the effect of radiation is stronger on the MB and AO molecules, while in the presence of DNA, the molecules were not as susceptible to degradation as molecules only.

2. Materials and Methods

2.1. Preparation of Samples

Calf thymus DNA (ct-DNA), tris HCl, methylene blue (MB), and acridine orange (AO) were obtained from Sigma-Aldrich. A stock solution of calf thymus DNA (ct-DNA) was prepared by dissolving 50 mg of ct-DNA in tris-HCl buffer 10 mM pH 7.4. To completely dissolve the DNA, it was stirred for 48 h, and after complete dissolution of DNA fibers, it was transferred to a volumetric flask and the volume was adjusted with the buffer. The compound solutions were prepared from stock solutions of MB and AO to achieve a final concentration of 25 µM. For samples with DNA, ct-DNA was added at the concentration of 75 µM. The solutions were prepared in tris-HCl 10 mM pH 7.4 and transferred to a quartz cuvette. They were sealed in order to proceed with the irradiation studies.

2.2. Irradiation Studies
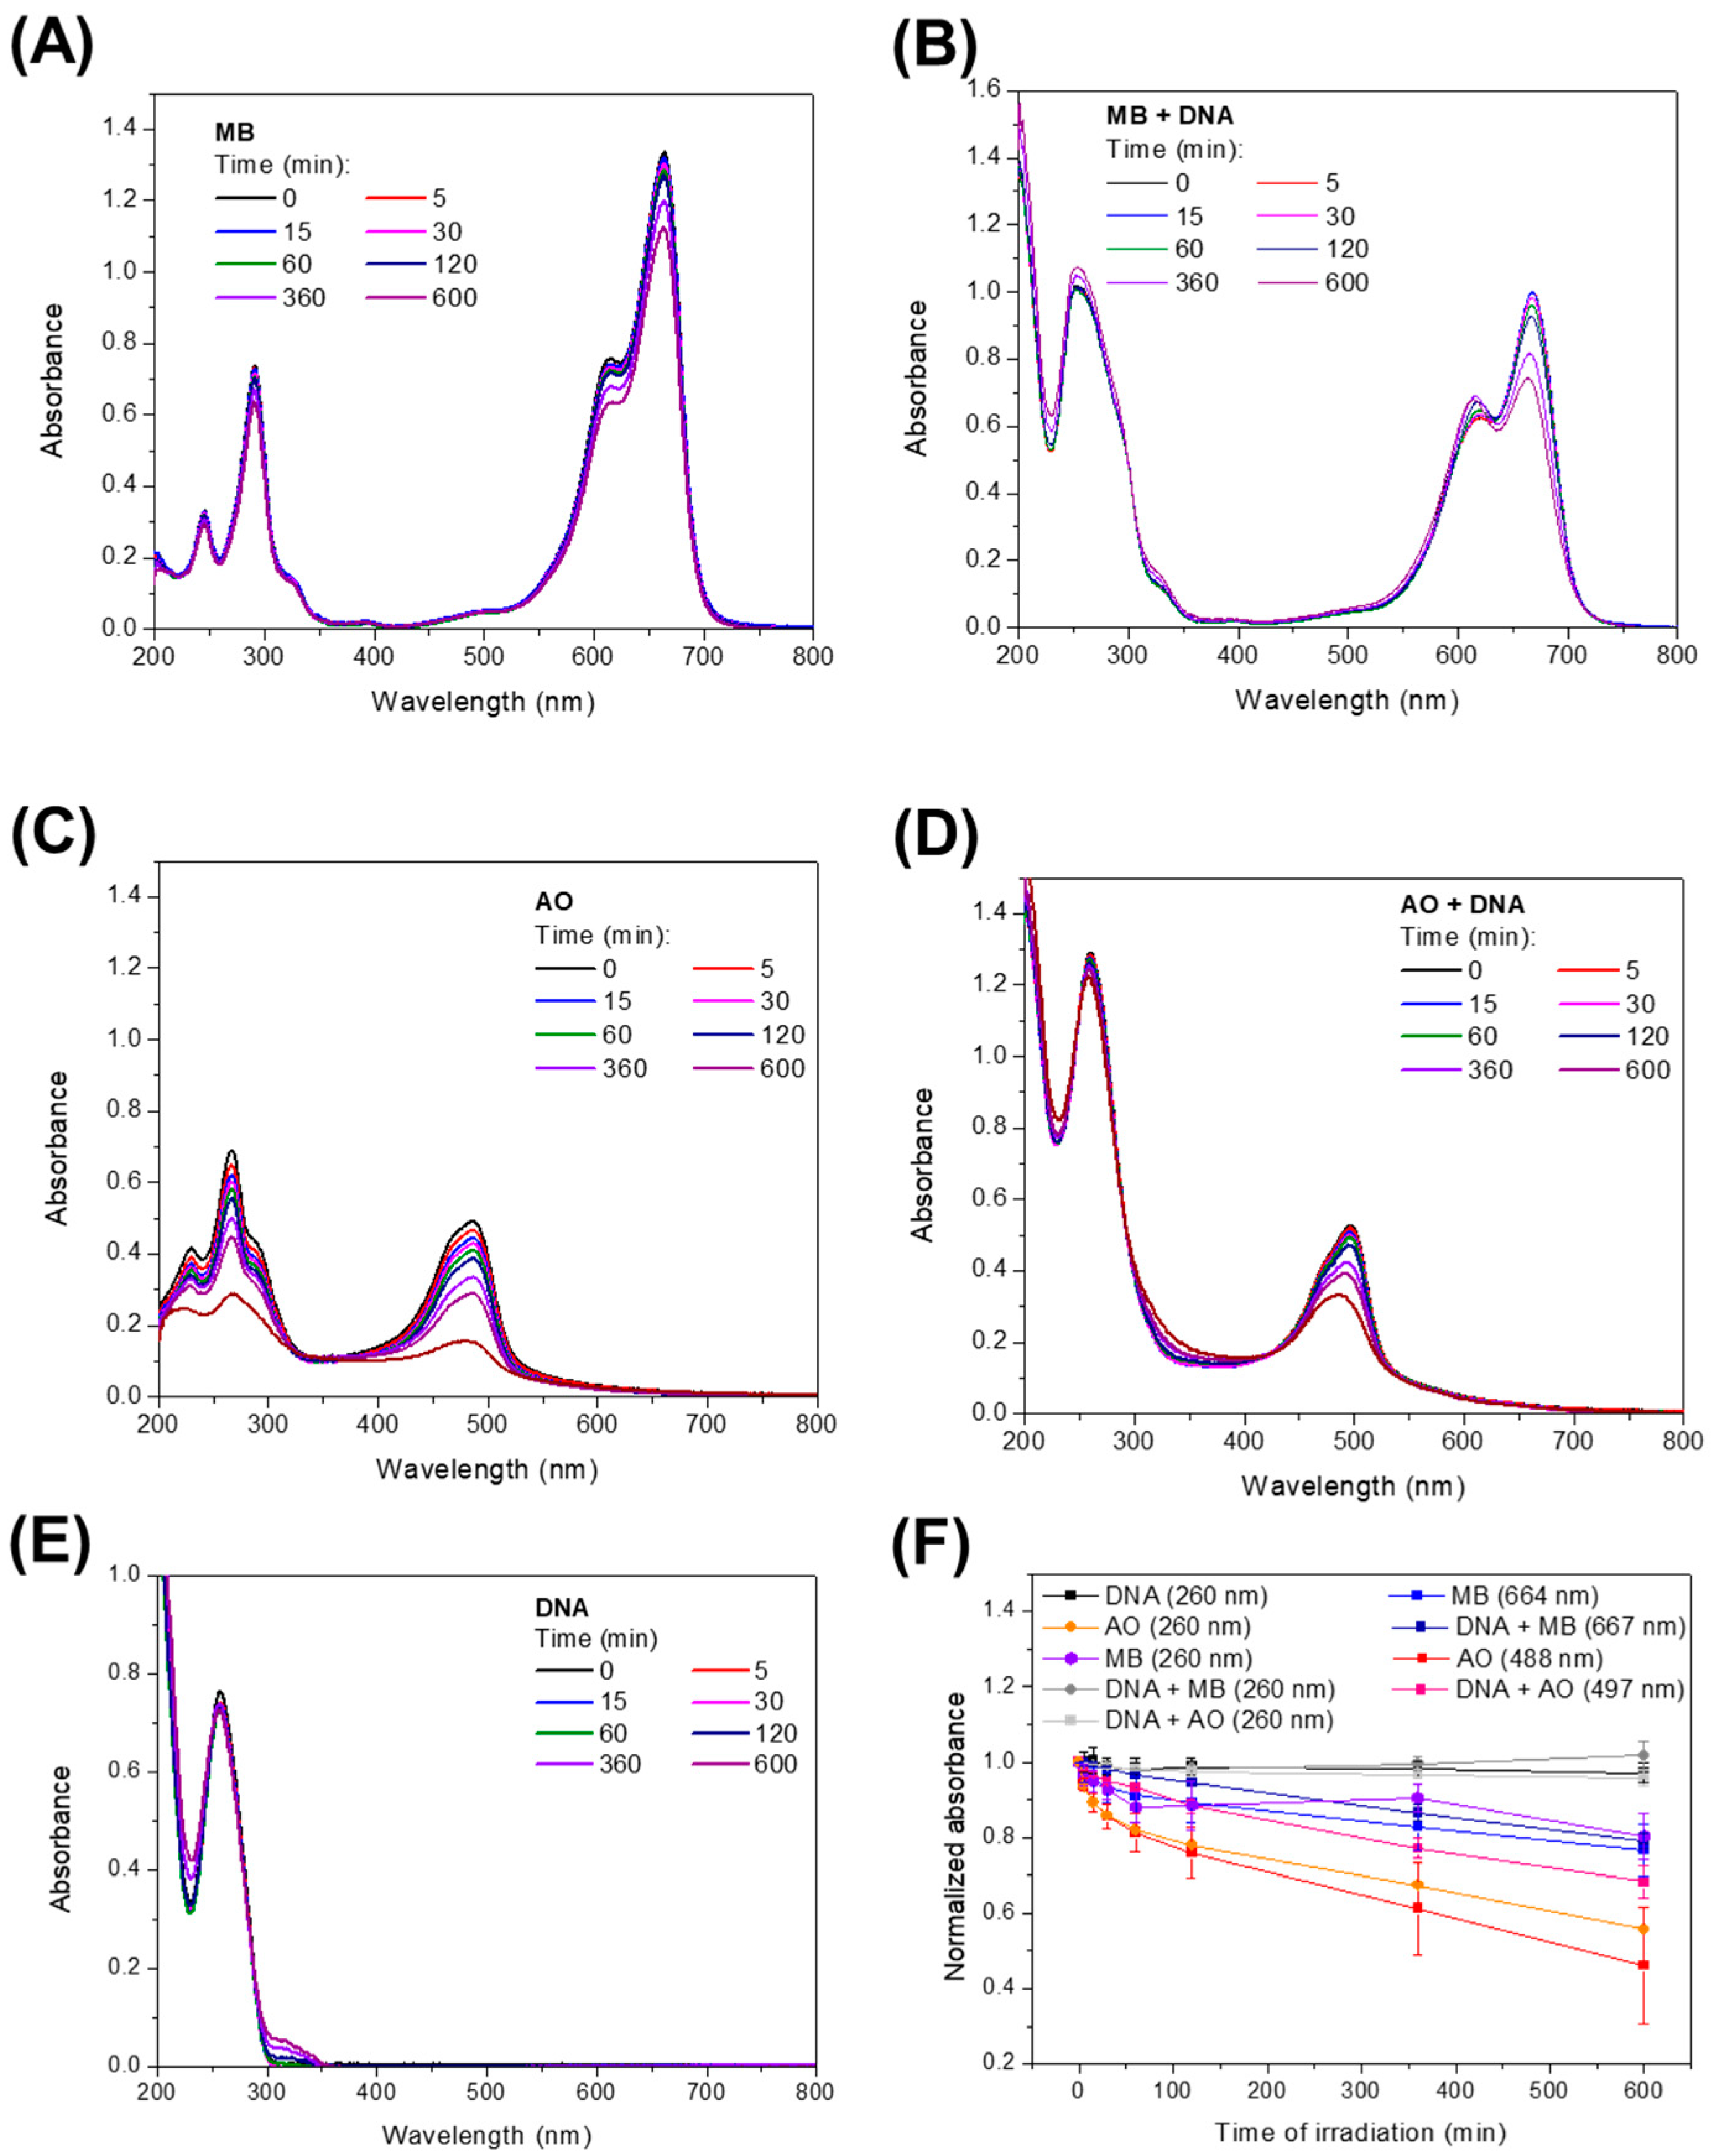
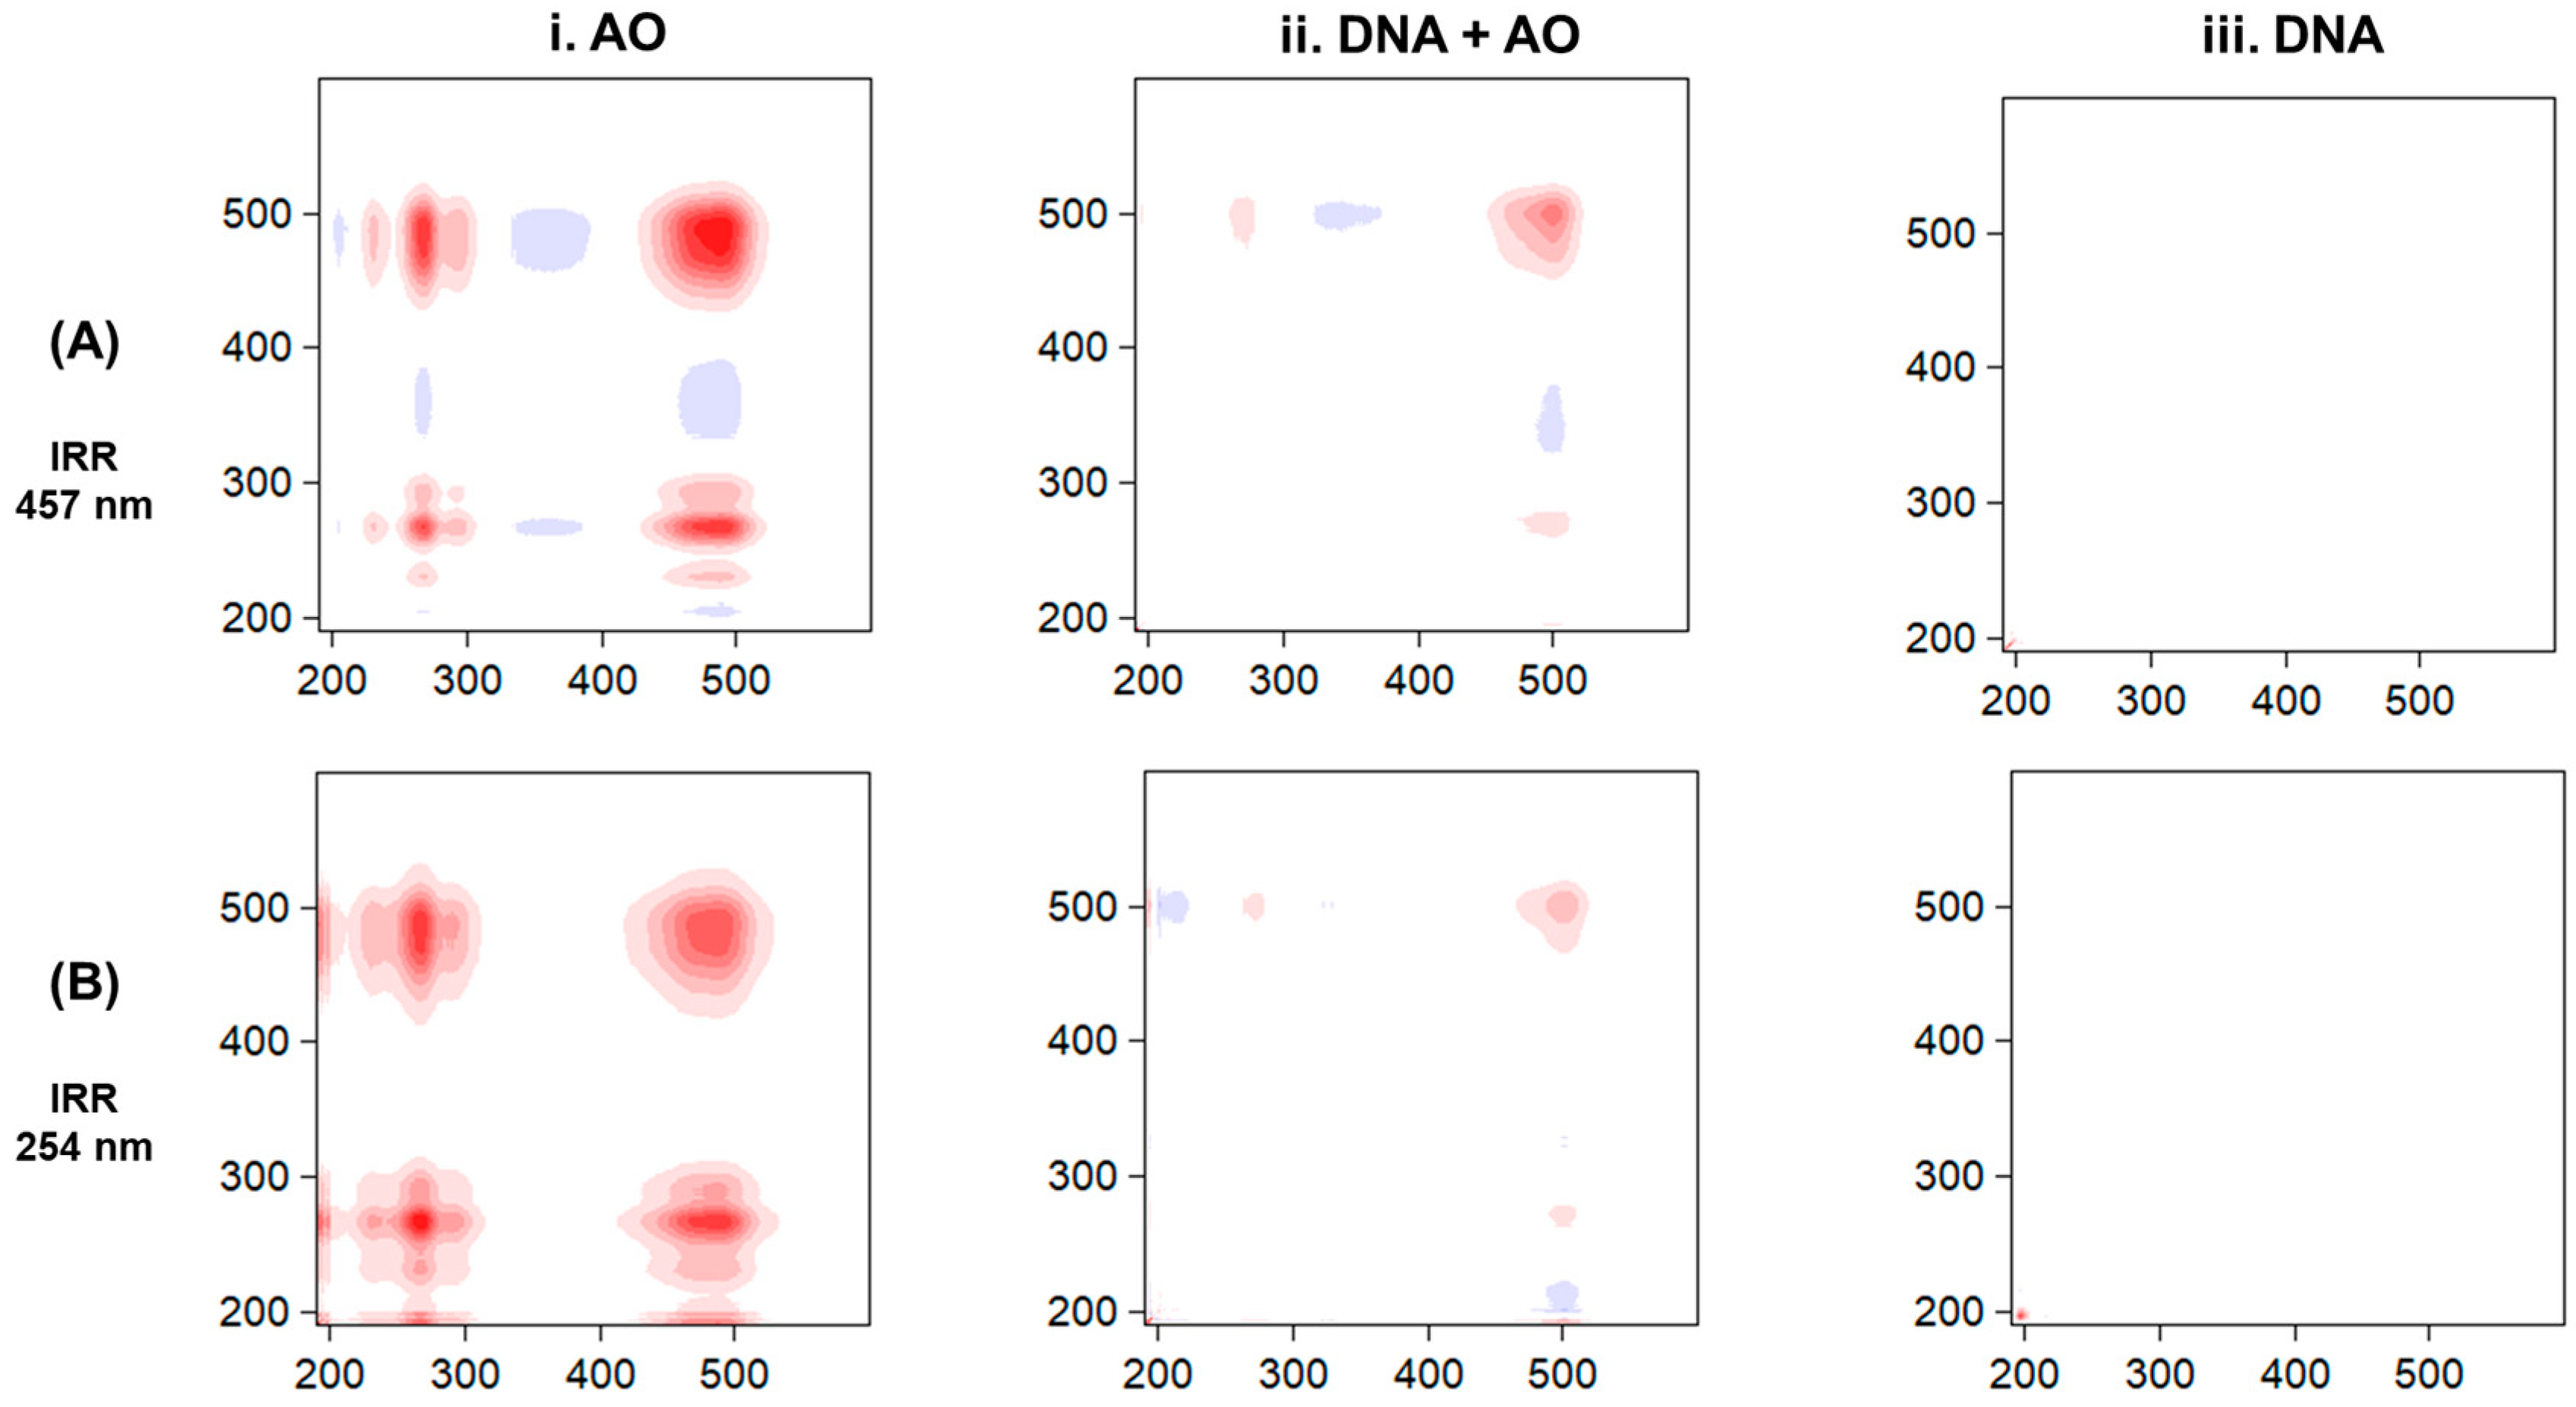
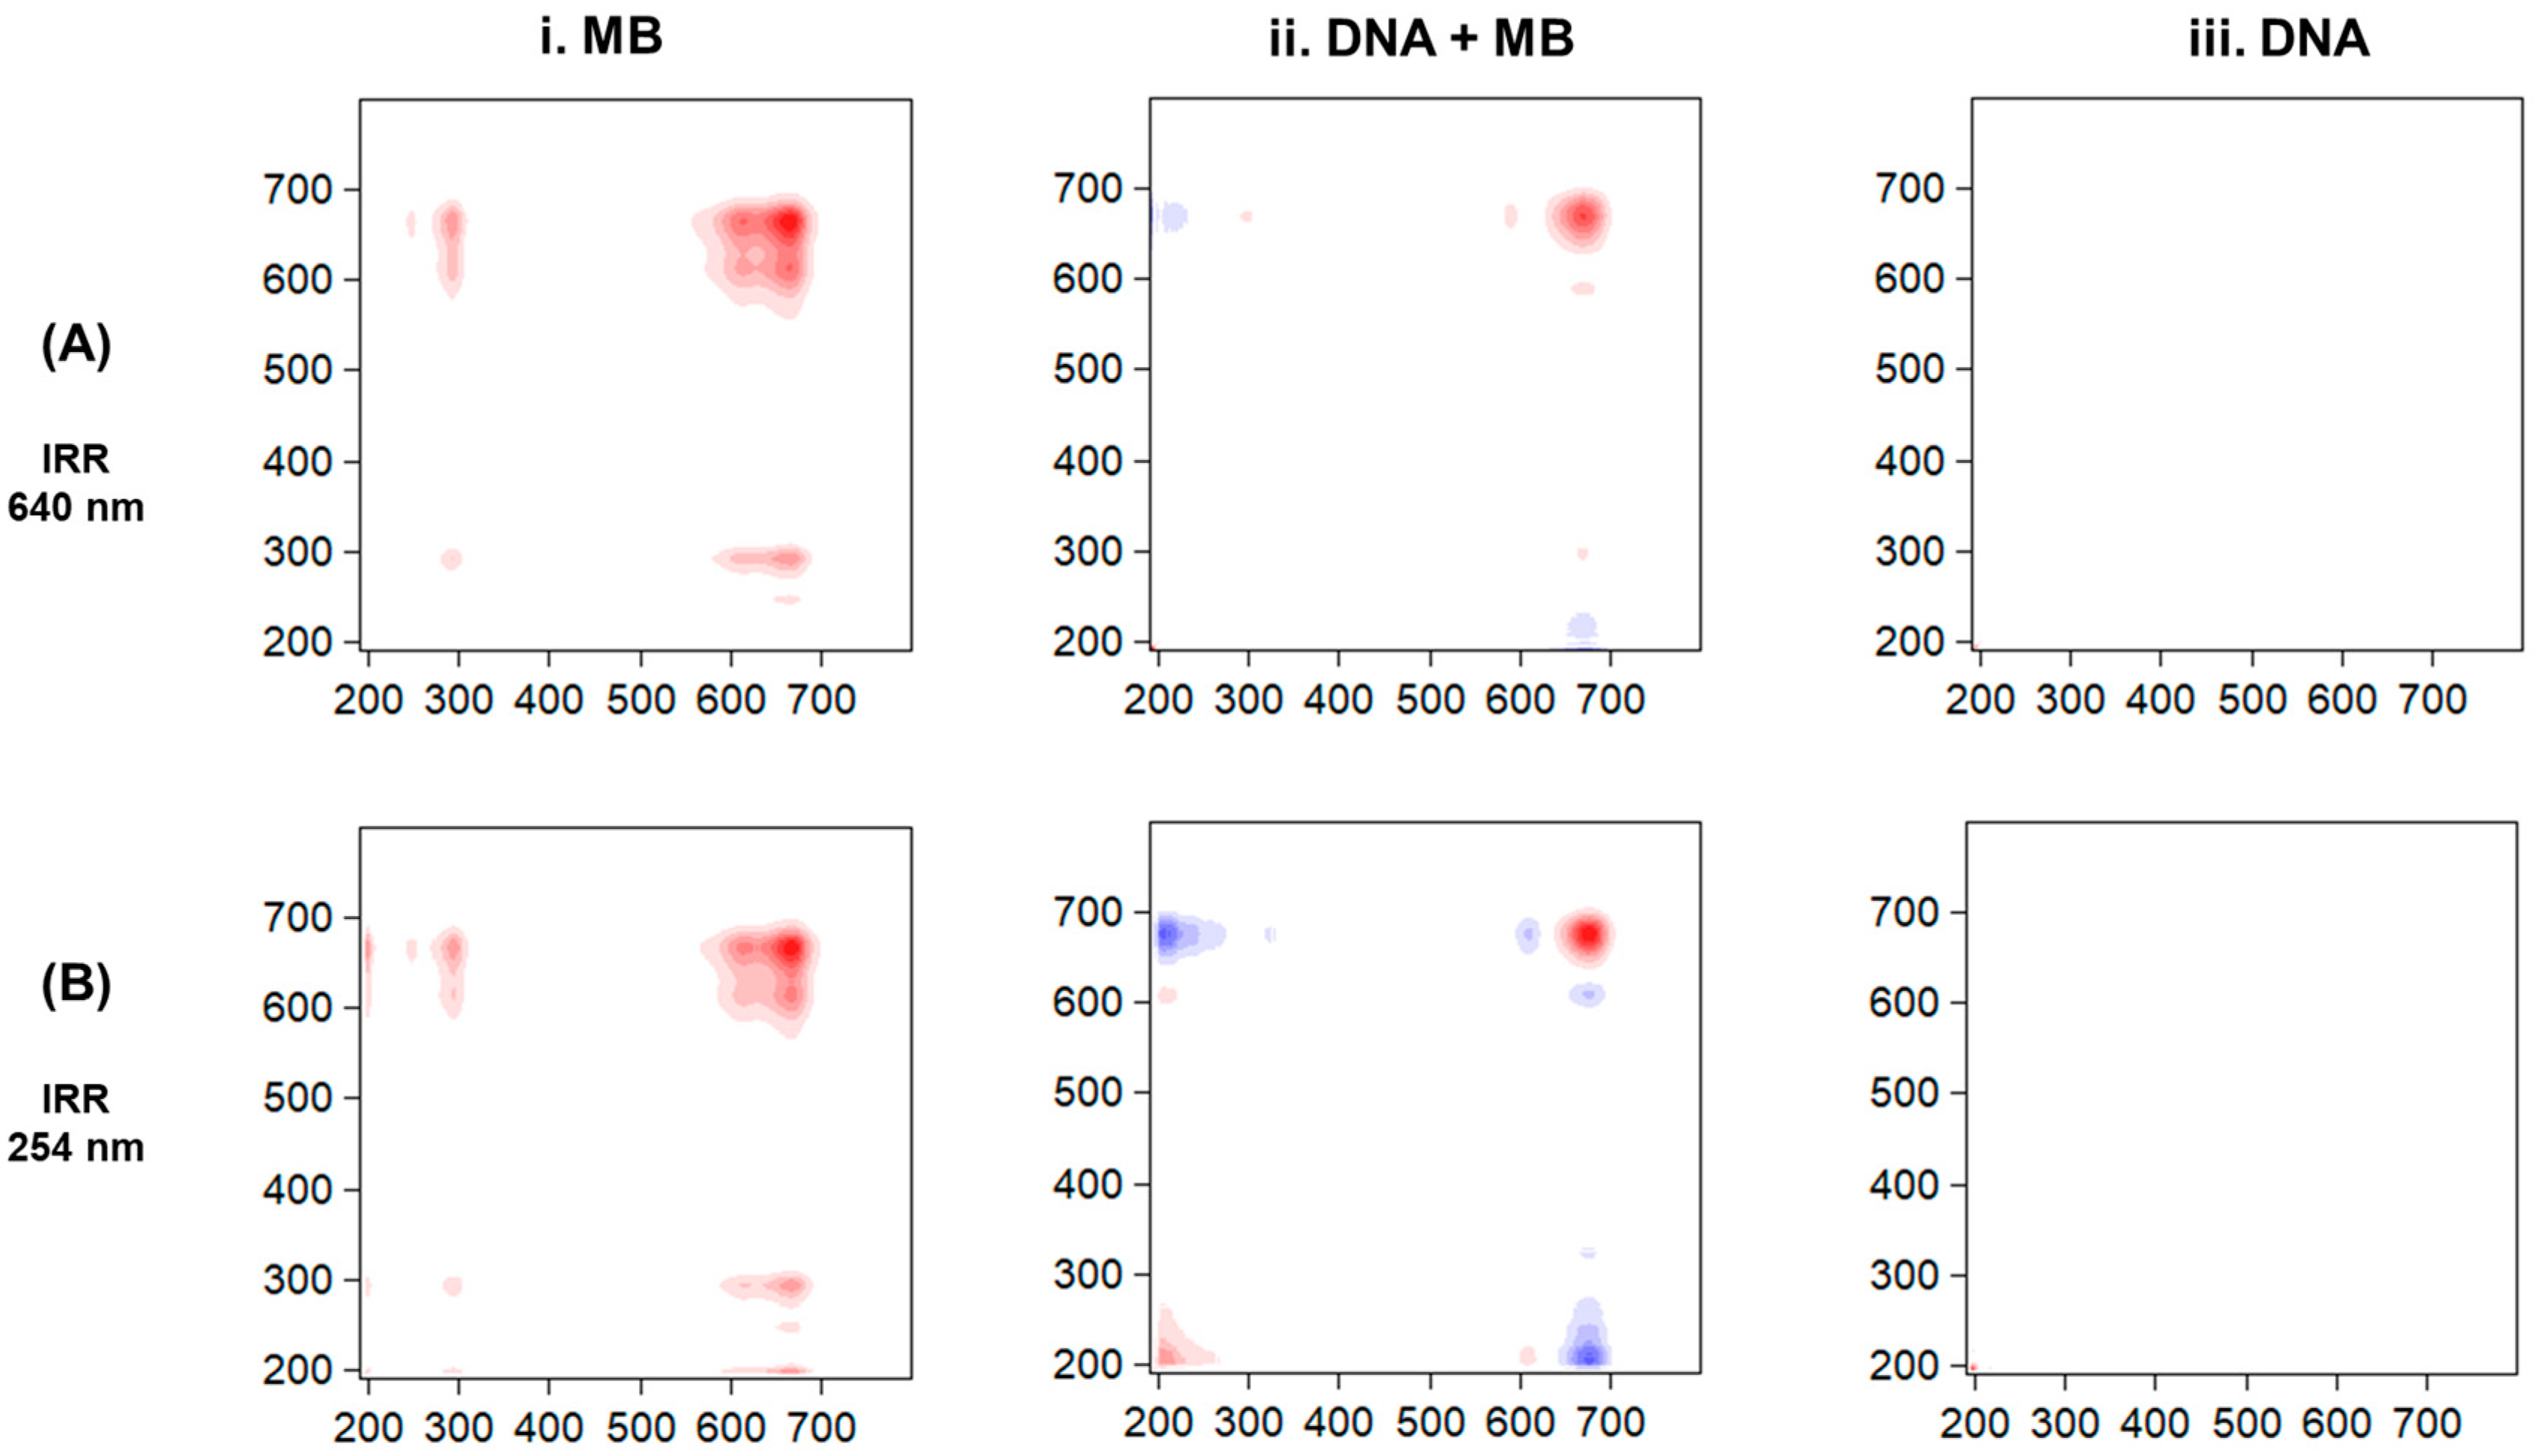
For the irradiation studies, the solutions were placed in the closed quartz cuvettes to be irradiated. The MB and DNA solutions and the AO and DNA solutions were exposed to a red LED light source at 640 nm and a blue LED light source at 457 nm, respectively. All of the solutions were submitted to UVC light with a peak at 254 nm (PHILIPS TUV PL-S 5W/2P Hg). The closed quartz cuvettes filled with the solution were placed at 12 cm under the source of light with an average irradiance of 9.5 W/m2 for the UVC light, 38.9 W/m2 for the blue light, and 24.3 W/m2 for the red light. The irradiance was measured by a Delta OHM photo/Radiometer (HD 2102.2) (Delta OHM—a member of the GHM GROUP, Via GMarconi, 5, Caselle di Selvazzano, Padua 35030, Italy). The solutions were submitted to different durations of irradiation (cumulative time), with the temperature and humidity maintained at around 22 °C and 60%, respectively. The analysis was performed using ultraviolet-visible light in a Shimadzu spectrophotometer (UV-2101PC) (SpectraLab Scientific Inc., 38 McPherson St., Markham, ON, Canada) with scanning from 900 to 190 nm, using appropriate solutions as a reference.
A mathematical technique of 2D-correlation spectroscopy was applied to analyze the changes induced by irradiation observed in the UV-vis spectra. This technique was applied to analyze minimal changes in the spectra [28] caused by the effect of the wavelength irradiation on the dye molecules with and without DNA. For the two-dimensional correlation spectroscopy the software 2D Shige 1.3 was used, free software developed by Shigeaki Morita (Osaka Electro-Communication University, Osaka, Japan) [29,30].

3. Results

We carried out via UV-vis spectroscopy the analysis of the molecules’ interaction and the effect of the application of irradiation. The UV-vis spectra of the DNA, MB, and AO molecules are presented in Figure 2. Three main regions in these spectra were analyzed, namely, the region around 260 nm related to the DNA absorbance peak, while for the intercalating molecules, the main regions of interest were the absorbance peaks in the visible region around 490 nm and 660 nm for the AO and MB molecules, respectively.
The DNA absorbance characteristic band at 260 nm (Figure 2A) is associated with the DNA bases [31,32,33]. The MB spectrum displayed in Figure 2B is also in accordance with the literature, presenting the band at 664 nm associated with n–π* electronic transitions related to the C = S+ chromophore group present in the dye [34], the band at 614 nm associated with vibronic 0–1 transition [35], and the band at 292 nm associated with π–π* benzene electronics transition [34]. In the case of the AO spectra (Figure 2C), there are two main peaks: one at around 488 nm and another at 266 nm, both corresponding to π–π* transitions [36].
Figure 2 also shows the comparison of the spectrum of the DNA and the spectra of the solutions of the dyes prepared with and without DNA. In Figure 2B, the spectra reveal the bathochromic effect that occurs in the MB band caused by the DNA, with it shifting from 664 nm to 667 nm and with a decrease of about 1.5 times in the absorbance when in the presence of DNA, which is expected from a DNA intercalator [37]. For AO Figure 2C, on the other hand, there is a slight hypochromic effect with a significant shift in the band from 488 nm to 497 nm in the presence of DNA. Furthermore, in the case of AO molecules, it is possible to have two different forms of AO: monomers and dimers. To evaluate the predominant form of AO in our studies, we evaluated the ratio between the 490 nm and 475 nm spectra associated with the monomeric and dimeric forms, respectively [24,38,39]. It is possible to observe a slightly broad peak around 490 nm for AO only, whereas a sharp peak in the AO in the presence of DNA (red line) was observed, indicating that the addition of DNA led to the disaggregation of AO molecules, which is also clarified by the ratio of 490/475 nm, where we obtained values of 1.02 for AO only and 1.16 for AO + DNA.
To understand the effect of irradiation on the DNA molecule in the presence of the dyes, irradiation kinetic studies were performed on MB and AO solutions in the presence and absence of DNA. The UV-vis spectra of control solutions without irradiation, kept in the dark for 24 h, did not reveal significant changes in the spectra (Supplementary Figure S1).
The spectra of MB, DNA + MB, and DNA solutions irradiated with 640 nm wavelength light during several time periods are shown in Figure 3A–C, respectively. From the evolution of MB and DNA + MB spectra with the increase in irradiation time, one can observe a decrease in absorbance, revealing the damage to MB molecules in both cases. The damage is stronger when the MB is alone, meaning that DNA avoids MB degradation. What is more, a bathochromic shift, with a deviation in the MB band when in the presence of DNA, changing from 664 nm to 667 nm, is observed as well as a hypochromic shift that is related to the intercalation between the DNA base pairs [37]. However, the irradiation of DNA solutions does not lead to DNA damage under the same irradiation conditions. The values of normalized absorbance at the 260 and 664 or 667 nm peaks as a function of irradiation time for the different solutions are shown in Figure 3D. The absorbance at 260 nm is time-independent for the DNA solutions and decreases slightly for the case of DNA and DNA + MB solutions. As the decay is similar for these last two solutions, these results suggest that DNA does not suffer significant alterations that lead to changes in the spectra when irradiated at 640 nm; however, during the time studied, the DNA was slowly damaged. Furthermore, the MB peak at around 664 nm shows different results from normalized absorbance, indicating that MB alone was more susceptible to damage by irradiation than MB in the presence of DNA.
The AO, DNA + AO, and DNA solutions were irradiated with 457 nm wavelength light. The UV-vis spectra achieved for the different periods of irradiation are presented in Figure 4A–C, respectively. The evolution of the AO absorbance in Figure 4A shows an accentuated decrease in the AO characteristic band and, compared to Figure 4B, the presence of DNA leads to a shift from 488 nm to 497 nm in the AO band. The plot of the normalized absorbance in Figure 4D shows a slight decrease in the normalized absorbance at 260 nm for DNA, which is more significant for DNA + AO and AO only. For the absorbance region at around 488 nm, there is a significant difference between samples with and without DNA, which shows the higher damage of AO in the absence of the DNA molecule.
As UVC can affect the DNA, MB, and AO molecules in common, the results of our irradiation studies are shown in Figure 5, where both intercalators were irradiated with a UVC lamp in the presence and absence of DNA. It is possible to observe some degradation of the MB in the absence and presence of DNA, as well as for AO. DNA only (Figure 5E) shows a minimal decrease in absorbance at 260 nm which could be due to the formation of photoproducts such as cyclobutene pyrimidine dimers (CPDs) and pyrimidine (6-4) pyrimidone photoproducts (6-4PPs) [40]. This indicates some damage to the biomolecule, which was not observed in the case of DNA irradiated with other wavelengths. In Figure 5F, the plot of the normalized absorbance in the function of the irradiation time shows that the peak at 260 nm does not have a significant decay effect when compared to the absorbance decay related to the MB and AO characteristic bands. Comparing the absorbance of the peaks of MB with AO, it is possible to see a higher degree of degradation affecting the AO band, mainly for AO alone.
The UV-vis spectra were analyzed over the radiation time using 2D spectroscopy. Synchronous 2D correlation maps of AO, DNA + AO, and DNA samples submitted to irradiation with blue light (457 nm) and UVC (254 nm) light sources are shown in Figure 6A,B, respectively. The synchronous maps resulting from spectra related to AO solutions irradiated at 457 nm are shown in Figure 6A(i), where it is possible to observe two autopeaks, one around 266 nm and another at 488 nm, which indicate a change in the intensity of the absorbance bands associated with π–π* transitions. A cross peak at (266 nm and 488 nm) indicates that the spectral variation of the 266 nm peak is related to changes in the 488 nm peak. It also shows a negative correlation from 300 to 400 nm. From the synchronous correlation map achieved from the DNA + AO solution spectra (Figure 6A(ii)), it is possible to see a significantly less intensive autopeak near to 488 nm, meaning that the change with time was minimal compared to AO alone. Figure 6A(iii) shows the synchronous map of the DNA submitted to the same wavelength of irradiation. This map only presents a very low intensity autopeak at around 200 nm. For the case of samples irradiated with 254 nm wavelength light, the synchronous map of AO solution spectra shows the two autopeaks at 266 nm and 488 nm associated with AO degradation (Figure 6B) and also the cross peak at (266 nm and 488 nm), and in the presence of DNA, only the autopeaks at 488 nm are observed, with them being less intense than those observed in the case of AO only. The synchronous map of DNA submitted to irradiation at 254 nm shows a minor signal near 200 nm, indicating some changes in the DNA molecules.
The 2D correlation maps from the spectra of MB in the presence and absence of DNA are presented in Figure 7A,B for the 640 nm and 254 nm irradiation, respectively. For the map of MB spectra submitted to irradiation of 640 nm, it is possible to observe a region of red color at around 600–700 nm, with two autopeaks which are related to the decrease in the MB absorbance bands associated with both n–π* electronic and vibronic 0–1 transitions. The intensity of these autopeaks is higher than the one observed for the spectra of MB with DNA submitted to the same irradiation conditions, as shown in Figure 7A(ii), which also shows a small autopeak at around the 664 nm band. For the sample of DNA only (Figure 7A(iii)), it is possible to observe a small signal at around 200 nm, while for the DNA submitted to 254 nm irradiation (Figure 7B(iii)), it shows a slightly more intense signal, meaning some changes in the DNA band. For the case of MB and DNA + MB solutions irradiated at 254 nm, the synchronous correlation maps are shown in Figure 7B(i,ii), respectively, and show similar patterns regarding the autopeaks to those irradiated at 640 nm, mainly in the region between 600–700 nm.

4. Discussion

MB and AO are molecules that have gained the interest of researchers for studies regarding their application in the photodynamic therapy of cancers [10,21,22,41]. However, fundamental experiments regarding the interaction of these molecules with DNA are still necessary. In our study, we have shown that these molecules in the presence of DNA show a similar pattern, with hypochromic and/or bathochromic shifts in the UV-vis spectra, which are characteristic of intercalator agents [37]. However, through the normalized absorbance of the irradiated samples, it is possible to observe that the presence of DNA resulted in lower degradation of these molecules, which could possibly be attributed to the insertion of the MB and AO into the DNA, partially hindering the effect of irradiation of these molecules. Furthermore, in the literature, the possible effect of intercalators leading to DNA condensation has been reported [42,43]. Therefore, the intercalating molecules, mainly considering the positively charged MB and AO, are probably able to interact with the elongated DNA strands, thus changing to a compact structure. This potential mechanism could be the reason why small intercalator molecules and also DNA can be less susceptible to light irradiation.
The fitting of the normalized absorbance with an exponential function exhibited different characteristics of time constants (τ) as shown in Table 1. For the region of the MB characteristic band, for both irradiation sources (red light and UVC), degradation was faster for the MB alone when compared to MB with DNA, with an increase in the time constant value, approximately double that of the τ obtained for MB only. The same behavior was observed for AO, which showed a time constant of around 130 min for AO alone, while for the system containing AO with DNA, it increased almost twice that of the time constant. This observed behavior demonstrates that the addition of DNA affected the degradation of the molecules by increasing the time constant of the compound’s degradation. This is possibly connected to the mode of interaction of the molecules that, through the intercalation between the DNA base pairs, are less susceptible to irradiation when compared to solution alone. On the other hand, as the interaction of the DNA with these molecules hinders their degradation, DNA can be more susceptible to radiation or not.
Although the light sources did not present the same irradiance values, there was no significant difference in the time constant obtained from the normalized absorbance of the AO peak in the absence of DNA. For the DNA + AO, the time constant of the AO peak of the sample irradiated with blue light presented a slightly reduced value when compared to the one achieved for irradiation with UVC. This may be attributed to the high sensitivity of AO to blue light [44]. MB, on the other hand, was more affected by UVC light when compared to the system irradiated with red light, showing that despite the different irradiance, the red light is less energetic [45], leading to smaller degradation when compared to UVC.
Since irradiation did not show much degradation of the DNA in our spectroscopic studies, it is important to emphasize that possibly through the irradiation of the DNA with the intercalants, the effects of damage on the DNA occur, since this has been extensively reported in the literature [46,47,48,49]. Possibly, this photodegradation of DNA could be evaluated by exploring other techniques, such as confocal fluorescence shown in the studies of Bernas et al. [50], who showed effective photo-denaturation of DNA with AO molecules. Moreover, future studies testing the effect of light dose as well as different concentrations of DNA could be interesting to understand the effect of these intercalating molecules on DNA.

5. Conclusions

The interaction of ct-DNA with MB and AO molecules was confirmed by the bathochromic and hypochromic shifts observed in the DNA UV spectra in the presence of photosensitizer molecules. These shifts are explained by the intercalation of photosensitizer molecules between the DNA base pairs. From the point of view of the analysis of the effect of radiation on the DNA in the presence of the dye molecules, different profiles of degradation with different characteristic times were observed for dyes in the presence and absence of DNA. These results demonstrate that dyes in the absence of DNA are more susceptible to photodegradation. This is justified by the intercalation of the dyes on the DNA base pairs allowing the DNA molecule to partially hinder the molecules’ exposition and, therefore, reduce their degradation. However, further studies should focus on the effects it has on the DNA molecule and the effects on the DNA bases separately, as a significant difference in the absorbance at 260 nm, the characteristic peak of DNA, was not observed.

Supplementary Materials

The following supporting information can be downloaded at: https://www.mdpi.com/article/10.3390/biophysica4010002/s1. Supplementary Figure S1: Spectra of samples kept in the dark with measurements immediately after the preparation (0 h) and 24 h later.

Author Contributions

Conceptualization, T.P.P. and M.R.; methodology, T.P.P. and P.A.R.; software, T.P.P. and M.R.; validation, T.P.P., P.A.R. and M.R.; formal analysis, T.P.P. and M.R.; investigation, T.P.P., P.A.R. and M.R.; resources, P.A.R. and M.R.; data curation, T.P.P. and M.R.; writing—original draft preparation, T.P.P. and M.R.; writing—review and editing, T.P.P., P.A.R. and M.R.; visualization, T.P.P. and M.R.; supervision, P.A.R. and M.R.; project administration, P.A.R. and M.R.; funding acquisition, P.A.R. and M.R. All authors have read and agreed to the published version of the manuscript.

Funding

This research was funded by Fundação para a Ciência e a Tecnologia (FCT-MCTES), Radiation Biology and Biophysics Doctoral Training Programme (RaBBiT, PD/00193/2012); the Applied Molecular Biosciences Unit—UCIBIO (UIDB/04378/2020); the CEFITEC Unit (UIDB/00068/2020); UIDB/04559/2020(LIBPhys); UIDP/04559/2020(LIBPhys); and the scholarship grant PD/BD/142829/2018 to T.P.P. from the RaBBiT Doctoral Training Programme.

Data Availability Statement

Data are contained within the article and supplementary materials.

Conflicts of Interest

The authors declare no conflicts of interest. The funders had no role in the design of the study; in the collection, analysis, or interpretation of data; in the writing of the manuscript; or in the decision to publish the results.

References

  1. Sayed, M.; Krishnamurthy, B.; Pal, H. Unraveling Multiple Binding Modes of Acridine Orange to DNA Using a Multispectroscopic Approach. Phys. Chem. Chem. Phys. 2016, 18, 24642–24653. [Google Scholar] [CrossRef] [PubMed]
  2. Zhang, F.; Sheng, H.; Wang, S.; Ma, Y.; Cai, C. Screening DNA-Targeted Anticancer Drug in Vitro Based on Cancer Cells DNA-Templated Silver Nanoclusters. Sci. Rep. 2019, 9, 8911. [Google Scholar] [CrossRef] [PubMed]
  3. Gill, M.R.; Harun, S.N.; Halder, S.; Boghozian, R.A.; Ramadan, K.; Ahmad, H.; Vallis, K.A. A Ruthenium Polypyridyl Intercalator Stalls DNA Replication Forks, Radiosensitizes Human Cancer Cells and Is Enhanced by Chk1 Inhibition. Sci. Rep. 2016, 6, 31973. [Google Scholar] [CrossRef] [PubMed]
  4. Palchaudhuri, R.; Hergenrother, P.J. DNA as a Target for Anticancer Compounds: Methods to Determine the Mode of Binding and the Mechanism of Action. Curr. Opin. Biotechnol. 2007, 18, 497–503. [Google Scholar] [CrossRef] [PubMed]
  5. Baguley, B.C.; Drummond, C.J.; Chen, Y.Y.; Finlay, G.J. DNA-Binding Anticancer Drugs: One Target, Two Actions. Molecules 2021, 26, 552. [Google Scholar] [CrossRef]
  6. Kitamura, N.; Kohtani, S.; Nakagaki, R. Molecular Aspects of Furocoumarin Reactions: Photophysics, Photochemistry, Photobiology, and Structural Analysis. J. Photochem. Photobiol. C 2005, 6, 168–185. [Google Scholar] [CrossRef]
  7. Vangipuram, R.; Feldman, S.R. Ultraviolet Phototherapy for Cutaneous Diseases: A Concise Review. Oral Dis. 2016, 22, 253–259. [Google Scholar] [CrossRef]
  8. Abrahamse, H.; Hamblin, M.R. New Photosensitizers for Photodynamic Therapy. Biochem. J. 2016, 473, 347–364. [Google Scholar] [CrossRef]
  9. Panikar, S.S.; Ramírez-García, G.; Banu, N.; Vallejo-Cardona, A.A.; Lugo-Fabres, P.; Camacho-Villegas, T.A.; Salas, P.; De la Rosa, E. Ligand-Targeted Theranostic Liposomes Combining Methylene Blue Attached Upconversion Nanoparticles for NIR Activated Bioimaging and Photodynamic Therapy against HER-2 Positive Breast Cancer. J. Lumin. 2021, 237, 118143. [Google Scholar] [CrossRef]
  10. Wu, P.-T.; Lin, C.-L.; Lin, C.-W.; Chang, N.-C.; Tsai, W.-B.; Yu, J. Methylene-Blue-Encapsulated Liposomes as Photodynamic Therapy Nano Agents for Breast Cancer Cells. Nanomaterials 2018, 9, 14. [Google Scholar] [CrossRef]
  11. Santos, G.M.P.; Oliveira, S.C.P.S.; Monteiro, J.C.S.; Fagnani, S.R.; Sampaio, F.P.; Correia, N.A.; Crugeira, P.J.L.; Pinheiro, A.L.B. ROS-Induced Autophagy Reduces B16F10 Melanoma Cell Proliferative Activity. Lasers Med. Sci. 2018, 33, 1335–1340. [Google Scholar] [CrossRef]
  12. Yu, J.; Hsu, C.-H.; Huang, C.-C.; Chang, P.-Y. Development of Therapeutic Au–Methylene Blue Nanoparticles for Targeted Photodynamic Therapy of Cervical Cancer Cells. ACS Appl. Mater. Interfaces 2015, 7, 432–441. [Google Scholar] [CrossRef] [PubMed]
  13. Nafisi, S.; Saboury, A.A.; Keramat, N.; Neault, J.-F.; Tajmir-Riahi, H.-A. Stability and Structural Features of DNA Intercalation with Ethidium Bromide, Acridine Orange and Methylene Blue. J. Mol. Struct. 2007, 827, 35–43. [Google Scholar] [CrossRef]
  14. Zhang, L.Z.; Tang, G.-Q. The Binding Properties of Photosensitizer Methylene Blue to Herring Sperm DNA: A Spectroscopic Study. J. Photochem. Photobiol. B 2004, 74, 119–125. [Google Scholar] [CrossRef] [PubMed]
  15. Vardevanyan, P.O.; Antonyan, A.P.; Parsadanyan, M.A.; Shahinyan, M.A.; Petrosyan, N.H. Study of Interaction of Methylene Blue with DNA and Albumin. J. Biomol. Struct. Dyn. 2021, 40, 7779–7785. [Google Scholar] [CrossRef] [PubMed]
  16. Pires, F.; Coelho, M.; Ribeiro, P.A.; Raposo, M. Methylene Blue: A Trendy Photosensitizer in Medicine and in Solar-Energy Conversion Systems. In Proceedings of the 2016 4th International Conference on Photonics, Optics and Laser Technology (PHOTOPTICS), Rome, Italy, 27–29 February 2016; pp. 1–5. [Google Scholar]
  17. Pitchaimani, A.; Renganathan, A.; Cinthaikinian, S.; Premkumar, K. Photochemotherapeutic Effects of UV-C on Acridine Orange in Human Breast Cancer Cells: Potential Application in Anticancer Therapy. RSC Adv. 2014, 4, 22123–22128. [Google Scholar] [CrossRef]
  18. Pierzyńska-Mach, A.; Janowski, P.A.; Dobrucki, J.W. Evaluation of Acridine Orange, LysoTracker Red, and Quinacrine as Fluorescent Probes for Long-Term Tracking of Acidic Vesicles. Cytom. Part A 2014, 85, 729–737. [Google Scholar] [CrossRef]
  19. Damas-Souza, D.M.; Nunes, R.; Carvalho, H.F. An Improved Acridine Orange Staining of DNA/RNA. Acta Histochem. 2019, 121, 450–454. [Google Scholar] [CrossRef]
  20. Thomé, M.P.; Filippi-Chiela, E.C.; Villodre, E.S.; Migliavaca, C.B.; Onzi, G.R.; Felipe, K.B.; Lenz, G. Ratiometric Analysis of Acridine Orange Staining in the Study of Acidic Organelles and Autophagy. J. Cell Sci. 2016, 129, 4622–4632. [Google Scholar] [CrossRef]
  21. Lin, Y.-C.; Lin, J.-F.; Tsai, T.-F.; Chen, H.-E.; Chou, K.-Y.; Yang, S.-C.; Tang, Y.-M.; Hwang, T.I.S. Acridine Orange Exhibits Photodamage in Human Bladder Cancer Cells under Blue Light Exposure. Sci. Rep. 2017, 7, 14103. [Google Scholar] [CrossRef]
  22. Osman, H.; Elsahy, D.; Saadatzadeh, M.R.; Pollok, K.E.; Yocom, S.; Hattab, E.M.; Georges, J.; Cohen-Gadol, A.A. Acridine Orange as a Novel Photosensitizer for Photodynamic Therapy in Glioblastoma. World Neurosurg. 2018, 114, e1310–e1315. [Google Scholar] [CrossRef] [PubMed]
  23. Kusuzaki, K.; Murata, H.; Matsubara, T.; Satonaka, H.; Wakabayashi, T.; Matsumine, A.; Uchida, A. Acridine Orange Could Be an Innovative Anticancer Agent under Photon Energy. In Vivo 2007, 21, 205–214. [Google Scholar] [PubMed]
  24. Amado, A.M.; Pazin, W.M.; Ito, A.S.; Kuzmin, V.A.; Borissevitch, I.E. Acridine Orange Interaction with DNA: Effect of Ionic Strength. Biochim. Et Biophys. Acta (BBA)-Gen. Subj. 2017, 1861, 900–909. [Google Scholar] [CrossRef] [PubMed]
  25. Pivetta, T.P.; Ferreira, Q.; Vieira, T.; Silva, J.C.; Simões, S.; Ribeiro, P.A.; Raposo, M. Liposomes Encapsulating Methylene Blue and Acridine Orange: An Approach for Phototherapy of Skin Cancer. Colloids Surf. B Biointerfaces 2022, 220, 112901. [Google Scholar] [CrossRef] [PubMed]
  26. Pivetta, T.P.; Vieira, T.; Silva, J.C.; Ribeiro, P.A.; Raposo, M. Phototoxic Potential of Different DNA Intercalators for Skin Cancer Therapy: In Vitro Screening. Int. J. Mol. Sci. 2023, 24, 5602. [Google Scholar] [CrossRef] [PubMed]
  27. Pivetta, T.P.; Jochelavicius, K.; Wrobel, E.C.; Balogh, D.T.; Oliveira, O.N.; Ribeiro, P.A.; Raposo, M. Incorporation of Acridine Orange and Methylene Blue in Langmuir Monolayers Mimicking Releasing Nanostructures. Biochim. Et Biophys. Acta (BBA)-Biomembr. 2023, 1865, 184156. [Google Scholar] [CrossRef] [PubMed]
  28. Pires, F.; Geraldo, V.P.N.; Antunes, A.; Marletta, A.; Oliveira, O.N., Jr.; Raposo, M. On the Role of Epigallocatechin-3-Gallate in Protecting Phospholipid Molecules against UV Irradiation. Colloids Surf. B Biointerfaces 2019, 173, 312–319. [Google Scholar] [CrossRef]
  29. Noda, I. Advances in Two-Dimensional Correlation Spectroscopy. Vib. Spectrosc. 2004, 36, 143–165. [Google Scholar] [CrossRef]
  30. Raposo, M.; Coelho, M.; Gomes, P.J.; Vieira, P.; Ribeiro, P.A.; Mason, N.J.; Hunniford, C.A.; McCullough, R.W. DNA Damage Induced by Carbon Ions (C3+) Beam Accessed by Independent Component Analysis of Infrared Spectra. Int. J. Radiat. Biol. 2014, 90, 344–350. [Google Scholar] [CrossRef]
  31. Isaacson, M. Interaction of 25 KeV Electrons with the Nucleic Acid Bases, Adenine, Thymine, and Uracil. I. Outer Shell Excitation. J. Chem. Phys. 1972, 56, 1803–1812. [Google Scholar] [CrossRef]
  32. Gomes, P.J.; Ribeiro, P.A.; Shaw, D.; Mason, N.J.; Raposo, M. UV Degradation of Deoxyribonucleic Acid. Polym. Degrad. Stab. 2009, 94, 2134–2141. [Google Scholar] [CrossRef]
  33. Liu, Y.; Dang, A.; Urban, J.; Tureček, F. Charge-Tagged DNA Radicals in the Gas Phase Characterized by UV/Vis Photodissociation Action Spectroscopy. Angew. Chem. Int. Ed. 2020, 59, 7772–7777. [Google Scholar] [CrossRef]
  34. Párkányi, C.; Boniface, C.; Aaron, J.J.; Maafi, M. A Quantitative Study of the Effect of Solvent on the Electronic Absorption and Fluorescence Spectra of Substituted Phenothiazines: Evaluation of Their Ground and Excited Singlet-State Dipole Moments. Spectrochim. Acta A 1993, 49, 1715–1725. [Google Scholar] [CrossRef]
  35. Heger, D.; Jirkovský, J.; Klán, P. Aggregation of Methylene Blue in Frozen Aqueous Solutions Studied by Absorption Spectroscopy. J. Phys. Chem. A 2005, 109, 6702–6709. [Google Scholar] [CrossRef] [PubMed]
  36. Le Bahers, T.; Di Tommaso, S.; Peltier, C.; Fayet, G.; Giacovazzi, R.; Tognetti, V.; Prestianni, A.; Labat, F. Acridine Orange in a Pumpkin-Shaped Macrocycle: Beyond Solvent Effects in the UV–Visible Spectra Simulation of Dyes. J. Mol. Struct. 2010, 954, 45–51. [Google Scholar] [CrossRef]
  37. Hajian, R.; Shams, N.; Mohagheghian, M. Study on the Interaction between Doxorubicin and Deoxyribonucleic Acid with the Use of Methylene Blue as a Probe. J. Braz. Chem. Soc. 2009, 20, 1399–1405. [Google Scholar] [CrossRef]
  38. Kapuscinski, J.; Darzynkiewicz, Z. Interactions of Acridine Orange with Double Stranded Nucleic Acids. Spectral and Affinity Studies. J. Biomol. Struct. Dyn. 1987, 5, 127–143. [Google Scholar] [CrossRef]
  39. Mondek, J.; Mravec, F.; Halasová, T.; Hnyluchová, Z.; Pekař, M. Formation and Dissociation of the Acridine Orange Dimer as a Tool for Studying Polyelectrolyte–Surfactant Interactions. Langmuir 2014, 30, 8726–8734. [Google Scholar] [CrossRef]
  40. Goto, N.; Bazar, G.; Kovacs, Z.; Kunisada, M.; Morita, H.; Kizaki, S.; Sugiyama, H.; Tsenkova, R.; Nishigori, C. Detection of UV-Induced Cyclobutane Pyrimidine Dimers by near-Infrared Spectroscopy and Aquaphotomics. Sci. Rep. 2015, 5, 11808. [Google Scholar] [CrossRef]
  41. dos Santos, A.F.; Terra, L.F.; Wailemann, R.A.M.; Oliveira, T.C.; Gomes, V.d.M.; Mineiro, M.F.; Meotti, F.C.; Bruni-Cardoso, A.; Baptista, M.S.; Labriola, L. Methylene Blue Photodynamic Therapy Induces Selective and Massive Cell Death in Human Breast Cancer Cells. BMC Cancer 2017, 17, 194. [Google Scholar] [CrossRef]
  42. Saraswathi, S.K.; Karunakaran, V.; Maiti, K.K.; Joseph, J. DNA Condensation Triggered by the Synergistic Self-Assembly of Tetraphenylethylene-Viologen Aggregates and CT-DNA. Front. Chem. 2021, 9, 716771. [Google Scholar] [CrossRef]
  43. Kapuscinski, J.; Darzynkiewicz, Z. Condensation of Nucleic Acids by Intercalating Aromatic Cations. Proc. Natl. Acad. Sci. USA 1984, 81, 7368–7372. [Google Scholar] [CrossRef] [PubMed]
  44. Byvaltsev, V.A.; Bardonova, L.A.; Onaka, N.R.; Polkin, R.A.; Ochkal, S.V.; Shepelev, V.V.; Aliyev, M.A.; Potapov, A.A. Acridine Orange: A Review of Novel Applications for Surgical Cancer Imaging and Therapy. Front. Oncol. 2019, 9, 925. [Google Scholar] [CrossRef] [PubMed]
  45. Espinoza, J.H.; Mercado-Uribe, H. Visible Light Neutralizes the Effect Produced by Ultraviolet Radiation in Proteins. J. Photochem. Photobiol. B 2017, 167, 15–19. [Google Scholar] [CrossRef] [PubMed]
  46. Freifelder, D.; Davison, P.F.; Geiduschek, E.P. Damage by Visible Light to the Acridine Orange-DNA Complex. Biophys. J. 1961, 1, 389–400. [Google Scholar] [CrossRef]
  47. Hendershot, J.M.; O’Brien, P.J. Critical Role of DNA Intercalation in Enzyme-Catalyzed Nucleotide Flipping. Nucleic Acids Res. 2014, 42, 12681–12690. [Google Scholar] [CrossRef]
  48. Bohne, C.; Faulhaber, K.; Giese, B.; Häfner, A.; Hofmann, A.; Ihmels, H.; Köhler, A.-K.; Perä, S.; Schneider, F.; Sheepwash, M.A.L. Studies on the Mechanism of the Photo-Induced DNA Damage in the Presence of Acridizinium SaltsInvolvement of Singlet Oxygen and an Unusual Source for Hydroxyl Radicals. J. Am. Chem. Soc. 2005, 127, 76–85. [Google Scholar] [CrossRef]
  49. Gicquel, E.; Souchard, J.-P.; Magnusson, F.; Chemaly, J.; Calsou, P.; Vicendo, P. Role of Intercalation and Redox Potential in DNA Photosensitization by Ruthenium(Ii) Polypyridyl Complexes: Assessment Using DNA Repair Protein Tests. Photochem. Photobiol. Sci. 2013, 12, 1517. [Google Scholar] [CrossRef]
  50. Bernas, T.; Asem, E.K.; Robinson, J.P.; Cook, P.R.; Dobrucki, J.W. Confocal Fluorescence Imaging of Photosensitised DNA Denaturation in Cell Nuclei. Photochem. Photobiol. 2005, 81, 960–969. [Google Scholar] [CrossRef]
Figure 1. Structure of the molecules methylene blue (MB) and acridine orange (AO).
Biophysica 04 00002 g001
Figure 2. Comparison of the DNA and the intercalating molecule spectra with and without DNA. (A) DNA (black line), (B) MB (blue line) DNA + MB (purple line), (C) AO (red line), and DNA + AO (pink line).
Biophysica 04 00002 g002
Figure 3. Kinetics of samples submitted to irradiation at 640 nm. (AC) Spectra of the irradiated samples: MB, DNA + MB, and DNA, respectively. (D) Kinetics of the two main regions found for these samples: region of the DNA (260 nm) and region of the MB (approximately 664 nm).
Biophysica 04 00002 g003
Figure 4. Kinetics of samples submitted to irradiation at 457 nm. (AC) Spectra of the irradiated samples: AO, DNA + AO, and DNA, respectively. (D) Kinetics of the two main regions found for these samples: region of the DNA (260 nm) and region of the AO (approximately 488 nm).
Biophysica 04 00002 g004
Figure 5. Kinetics of samples submitted to irradiation at 254 nm. (AE) Spectra of the irradiated samples: MB, DNA + MB, AO, DNA + AO and DNA, respectively. (F) Kinetics of the three main regions found for these samples: region of the DNA (260 nm), region of the AO (approximately 488 nm), and region of the MB (approximately 664 nm).
Biophysica 04 00002 g005
Figure 6. Synchronous 2D correlation maps in the wavelength range of 190 to 600 nm of AO solutions with and without DNA. (A) Samples submitted to irradiation at 457 nm and (B) samples submitted to irradiation at 254 nm. Red and blue colors mean positive and negative correlation, respectively.
Biophysica 04 00002 g006
Figure 7. Synchronous 2D correlation maps in the wavelength range of 190 to 600 nm of MB solutions with and without DNA. (A) Samples submitted to irradiation at 640 nm and (B) samples submitted to irradiation at 254 nm. Red and blue colors mean positive and negative correlation, respectively.
Biophysica 04 00002 g007
Table 1. Comparison of the time constant obtained from the exponential fitting of the regions of interest for the samples irradiated at 640, 457, and 254 nm.
SamplePeak (nm)τ (min)
Red Light (640 nm)Blue Light (457 nm)UVC (254 nm)
MB664639.4 ± 191.3-181.1 ± 87.3
AO488-129.4 ± 14.8179.2 ± 60.2
DNA + MB6671167.3 ± 258.3--
DNA + AO497-279.5 ± 43.9328.9 ± 71.5
Disclaimer/Publisher’s Note: The statements, opinions and data contained in all publications are solely those of the individual author(s) and contributor(s) and not of MDPI and/or the editor(s). MDPI and/or the editor(s) disclaim responsibility for any injury to people or property resulting from any ideas, methods, instructions or products referred to in the content.

