Article

Screening for Bioactive Metabolites in Leaves, Branches, and Roots of Mansoa hirsuta: Phytochemical, Toxicological and Antioxidant Aspects

1
Post-Graduation Department in Chemistry, Federal University of Piauí, Teresina 64000-040, Brazil
2
Marine Biodiscovery Centre, Department of Chemistry, University of Aberdeen, Aberdeen AB24 3UE, UK
3
Nucleus of Applied Research to Sciences (NIAC), Federal Institute of Maranhão, Presidente Dutra 65630-000, Brazil
4
Laboratory of Research in Toxicological Genetics (LAPGENIC), Federal University of Piauí, Teresina 64049-550, Brazil
5
Department of Chemistry, Federal Institute of Piaui, Teresina 64000-040, Brazil
6
Chemistry Institute, Federal University of Goias, Goiania 74690-900, Brazil
*
Author to whom correspondence should be addressed.
Biophysica 2023, 3(3), 425-445; https://doi.org/10.3390/biophysica3030028
Submission received: 1 April 2023 / Revised: 24 June 2023 / Accepted: 26 June 2023 / Published: 28 June 2023
(This article belongs to the Special Issue Molecular Structure and Simulation in Biological System)

Abstract

:
In this study, secondary metabolites, toxicology and antioxidant properties of chloroform fractions from leaves (FCFMh), branches (FCGMh), and roots (FCRMh) of Mansoa hirsuta were investigated. The phytochemical screening detected flavonoids, especially chalcones. Through Liquid chromatography with mass spectrometry—LC–MS analysis, the flavonoids (isoorientin-2″-O-arabinoside), triterpenes (oleanolic acid and ursolic acid) and ceramide (phytosphingosine) were identified. From the Artemia salina assay, the fraction FCGMh was the most toxic (LC50 = 64.21 µg·mL−1), followed by FCRMh (LC50 = 87.61 µg·mL−1) and FCFMh (LC50 = 421.9 µg·mL−1). Concerning the cytotoxic potential, the root fraction (IC50 16.48 μg mL−1) displayed the highest cytotoxicity against the breast cancer cell line (4T1), followed by leaves (IC50 33.13 μg mL−1) and branches (IC50 of 47.13 μg mL−1). In conclusion, all the fractions of M. hirsuta showed cytotoxicity at the highest concentrations; however, remarkable biological properties were found for the root fractions. Computational analysis was performed using a molecular docking and pharmacophore approach to understand the antioxidant activity of its major metabolites.

1. Introduction

Plants produce several active metabolites, which differ widely in terms of chemical structure and biological properties, with different biological effects which can cause damage, including genetic material [1]. They are considered effective in treating or preventing various diseases, including other forms of cancer, as their bioactive substances can interrupt several pathways that lead to cancer development [2].
I highlight a secondary metabolite of fundamental importance for medicinal chemistry, flavonoid compounds, which have a range of benefits, including anti-inflammatory, antiviral, powerful antioxidant action, as well as being potent anticancer substances, since they act in the inactivation of free radicals. The presence of this can add a satisfactory therapeutic potential to plant species [3].
The importance of evaluating plants’ toxicological and antioxidant potential is the discovery of compounds with chemotherapeutic action since the pharmacological activity of plant-based antioxidants can be verified by determining the level of cytotoxicity in various cell lines with minimal toxicity in the normal cell [4]. Thus, the cytotoxic activity of species must be evaluated to verify the presence or interaction of additional constituents [5,6], thus revealing the importance of bioassays and toxicity tests of active compounds before their clinical use to prevent possible side effects [7].
Studies indicate that, in anticancer therapy, it is possible to use different natural compounds targeting programmed cell death mechanisms [8,9,10]. Although several approaches are accessible for discovering new and potential therapeutic agents that modulate cell signaling, natural products from medicinal plants and other sources appear to be the most cost-effective and promising approach [11,12,13].
M. hirsuta D. C. has chemopreventive and anti-inflammatory activities by inhibiting cyclooxygenase (COX) enzymes, nuclear factor kappa B (NF-κB) and via tumor necrosis factor alpha (TNF-α), cytokines that are closely related to the inflammatory process, capable of causing the death of tumor cells (apoptosis) [14,15].
Regarding the toxicology of this species, there are few reports. However, Pereira et al. [16] evaluated the cytotoxic potential of M. hirsuta compounds against murine fibroblasts, revealing no harmful effects at concentrations of up to 100 µg mL−1 for leaf extracts and fractions, using solvents, crude ethanol, hydroalcoholic, alcoholic, ethyl acetate, chloroform and hexane.
The presence of secondary metabolites in extracts of leaves, branches and roots of M. hirsuta, such as saponins, organic acids, phenols, tannins, flavonoids and alkaloids is noteworthy [17], and their medicinal importance reported in its genus Mansoa for the treatment of pathologies such as inflammation, pain, flu and rheumatic diseases [18,19,20], as well as the importance of its family Bignoniaceae, in which they have several activities, pharmacological as anti-inflammatory, antitumor, antioxidant, healing, antidiabetic, antimalarial and antimicrobial [21], motivated us to explore the M. hirsuta species.
Because of the scarcity of scientific research on the M. hirsuta species, the present work aimed to carry out a chemical and biological investigation through the metabolomic profile and molecular docking, as well as through the toxicological potential, antioxidant action or oxidative power, and cytotoxicity of different parts referring to leaves, branches and roots of M. hirsuta.

2. Experiment

2.1. Reagent Solvents and Equipment

The solvents used in the extraction and chromatographic fractionation were analytical and spectroscopic grades and included methanol (MeOH), chloroform (CHCl3), ethyl acetate (AcOEt), and n-hexane (Synth and Dinâmica). The stationary phase used was Silica C18 (particle size: 40–63 μm; Merck, Darmstadt, Germany).
For the chromatographic analysis and mass spectrometry experiments, the solvents methanol, acetonitrile (HPLC grade), formic acid (Sigma Aldrich® Vetec®, AppliChem Panreac®, San Luis, MI, USA, and Recife, Brazil) and ultrapure water (18.2 MΩ in Elga Purelab system Option -Q) were used.
The extracts and fractions were concentrated in a Fisatom rotary evaporator R-801 under reduced pressure with PRSIMATEC BBV-132 vacuum pumps.
The standards K2Cr2O7 (potassium dichromate) from the Vetec® brand and H2O2 (hydrogen peroxide) were used for the tests of A. salina and S. cerevisiae. For the (3-(4,5-dimethylthiazol-2-yl)- 2,5-diphenyltetrazolium bromide) (MTT) test, Dulbecco’s Modified Eagle Medium (DMEM) was obtained from GIBCO® (Grand Island, NY, USA) and MTT was purchased from Sigma (St. Louis, MO, USA).
For Artemia salina Leach, samples were diluted in pure sterile dimethylsulfoxide (DMSO, Tedia, Fairfield, OH, USA, EUA), at 0.1%, then diluted in working solutions to concentrations that varied between 31.25 and 1000 μg mL−1. In Saccharomyces cerevisiae, concentrations (50; 250 and 500 μg mL−1) dissolved in DMSO at 0.1%) were used. For MTT, M. hirsuta fractions were also diluted in 0.1% DMSO and only a concentration of 100 μg mL−1 was used.

2.2. Plant Material

Leaves, branches, and roots of M. hirsuta were collected at Sitio do Mocó—Coronel José Dias, near the municipality of São Raimundo Nonato-PI (Northeast Brazil, geographic coordinates Latitude 09°00′55″ S × longitude 42°41′58″ W), under the registration number in the National System for the Management of Genetic Heritage and Associated Traditional Knowledge (SisGen) (A2CA781), during March and December 2020. The species was deposited at the Herbarium Graziela Barroso (TEPB) from UFPI, Teresina—PI, under voucher TEPB.32.277.
The extractions were carried out by the maceration method. Initially, the different parts of the plant were ground in an industrial blender and mill until obtaining 378.77 g (leaves), 650.12 g (branches) and 107.32 g (roots). Then, the methanol solvent was placed in contact with the dried and crushed plant materials. Finally, the extracts were concentrated in a rotary evaporator at 40 °C and 180 bar of pressure, resulting in 38.4 g of the methanolic extract of M. hirsuta leavesEMFMh (10.16% yield), 21.66 g of methanolic extract from the branches of M. hirsuta—EMGMh (3.33% yield) and 9.9 g of methanolic extract from the roots of M. hirsuta—EMRMh (9.18% yield).

2.3. Liquid–Liquid Partition Chromatography

The extracts of leaves, branches, and roots of M. hirsuta were fractionated for a liquid–liquid partition, and this liquid–liquid extraction technique was based on the methodology of Queiroz [22], with adaptations. First, the dry extracts of EMFMh (38.4 g), EMGMh (21.66 g), and EMRMh (9.9 g) were suspended in CHCl3: MeOH 1:1, and the solution obtained was transferred to a separatory funnel. Then, water was added until the separation between the hydroalcoholic and CHCl3 phases was observed. The yields obtained resulted in 30.4 g of the chloroform fraction of the leaves of M. hirsuta—FCFMh (79.16% of yield), 21.0 g of the chloroform fraction of the branches of M. hirsuta—FCGMh (97.22% of yield), 9.9 g of the chloroform fraction of the roots of M. hirsuta—FCRMh (68.68% yield). The samples were stored in glass vials in a refrigerator at −20 °C until the moment of the biological tests.

2.4. General Experimental Methods

2.4.1. HPLC-PDA

The analysis used a Shimadzu analytical liquid chromatograph, model LC20A, CBM-20 controller, UV–visible detector with “Diode Array” (PDA) model SPDM-20A, DGU-20A3 degasser and LC solutions software. First, 1 mg of M. hirsuta fractions was injected with a gradient method of 65.5 min. The mobile phase consisted of a mixture of water + 0.1% formic acid (A) and acetonitrile + 0.1% formic acid (B), pumped at a 1.0 mL min−1. The gradient system was defined as follows: 5% B (0–0.01 min), 100% B (50–55 min), and 5% B (60–65.5 min). Afterwards, they were submitted to the clean-up process in a Chromabond® C18 cartridge (previously activated with CH3OH), stationary phase column C18 reversed phase (250 × 4.6 mm, particle size 5 µm), brand Macherey-Nagel and filtered with 0.45 µm membrane, the column oven was heated to 40 °C using a UV–visible detector chromatograph in 50 min.

2.4.2. LC–MS

Liquid chromatography with mass spectrometry (LC–MS) analysis was performed on a Shimadzu® instrument (LC System—model SIL 20AHT), with a Diode Array Detector (SPD-M20A), a mass spectrometer (Bruker®) (Billerica, MA, U.S.) and electrospray interface ionization (ESI). The chromatographic separation was analyzed in a C18 column of the Phenomenex Gemini brand (250 × 4.6 mm, 5 m), with a mobile phase composed of H2O (ultrapure)—(A) and CH3OH (methanol)—(B). An elution method was used—a gradient from 5 to 100% B in 45 min, maintaining the condition of 100% B for 10 min, returning to 5% (B) in 2 min, and maintaining this exploratory gradient until a time of 10 min. A flow rate of 1 mL min−1 was used, and 0.1 μL aliquots of the fractions were injected and solubilized at a concentration of 1 mg mL−1 in CH3OH/H2O (95:5, v/v).

2.5. Nuclear Magnetic Resonance

1H NMR spectra (one-dimensional) were obtained on a Bruker Avance DRX-600 spectrometer with a 5 mm TCI cryoprobe and a 14.1 T magnetic field. The 1 H chemical shifts were referenced according to the peak of the MeOD solvent used to solubilize the samples, operating at 600 (1H) MHz. TMS or residual non-deuterated solvent was used as an internal reference.

2.6. Toxicity against Artemia salina Leach

A. salina lethality bioassay was performed according to the procedure reported [23]. The growth medium was prepared with artificial salt water. Artemia cysts (10 mg) commercially available at an aquarium store were incubated in artificial salt water (35 gL−1 in 1000 mL of distilled water), with the lighting of 25 °C and 9W. Sodium bicarbonate (NaHCO3) was used as a buffer at pH 10.0 of the brine solution. After 48 h of incubation, ten live nauplii (A. salina) were transferred to each test tube. The samples were kept in incubation for 24 h and 48 h. Live nauplii were counted to determine the number of deaths per sample. Artificial saline water and K2Cr2O7 were used as negative control (NC) and positive control (PC). Each treatment was performed in triplicate for NC and PC controls (dissolved in DMSO at 0.1%), and concentrations of extracts and bioactive fractions of M. hirsuta (31.25; 62.5; 125; 250; 500; 1000 μg mL−1 dissolved in DMSO at 0.1%) and the results were expressed as a percentage of mortality.

2.7. Oxidative/Antioxidant Action for Saccharomyces cerevisiae

The test strains of S. cerevisiae used in this study are shown in Table 1. The culture of S. cerevisiae was kindly provided by Dr E. Gralla (University of California, Los Angeles, USA). First, S. cerevisiae was cultivated in a liquid medium (YEL) containing (0.5% yeast extract, 2% bacto peptone and 2% glucose) at 28 °C in an orbital shaker until reaching a stationary growth stage, according to Rosa et al. [24]. Next, a suspension containing 1 × 10⁸ cells mL−1 was stirred for three hours at 30 °C. Then the cells were harvested by centrifugation and washed twice with phosphate buffer. Finally, cell density was determined using a Neubauer counting chamber, and cells were stained on plates containing the oxidizing agents.
In one cycle of cell inoculation, 10 mL of each concentration of M. hirsuta bioactive fractions (50, 250 and 500 μg mL−1 dissolved in 0.1% DMSO) were added around the center to the edge of a Petri dish in a continuous course on both sides of the dish. Four different treatments were performed on the fractions (pre-treatment, co-treatment, post-treatment and in the treatment). In the pre-treatment, the concentrations of the tested samples were first added to a filter paper disc in the center of the YEPD plate, and two hours later, the oxidizing agent (30% hydrogen peroxide and H2O2 (10 mM) was added. In the co-treatment, samples and H2O2 (10 mM) were added simultaneously. In the post-treatment, H2O2 (10 mM) was added, and the samples were added two hours later. In the treatment, only the fractions without the use of H2O2 (10 mM) were added.
After 48 h, the plates were incubated in an oven at 30 °C. Growth inhibition was measured in centimeters from the growth of the filter edge at the beginning of cell growth. Values can range from 0 mm (total growth of the filter disc) to 40 mm (no growth to the edge of the Petri dish). The NC was a saline solution (0.9%), while the PC was the oxidizing agent H2O2 (10 mM). All assays were performed in quadruplicate. Controls were diluted in 0.1% DMSO.

2.8. Cytotoxicity Test for the MTT Method

The MTT assay was performed according to Mosmann [25]. Cell lines L929 (mouse fibroblasts) and 4T1 (murine breast tumor) were distributed in 96-well multiplates at a density of 1 × 10⁶ cells mL−1. Test substances and controls were incubated for 68 h together with the cells. After incubation, 20 μL of the MTT solution (5 mg mL−1) was added to the cultures and reincubated for four hours in an oven at 37 °C and 5% CO2. After this period, the culture medium was discarded, and the plates were carefully stored away from light and left overnight for complete drying. Subsequently, the precipitate was resuspended in 100 µL of isopropyl alcohol. To quantify the reduced salt in live cells, the absorbances were analyzed with a plate spectrophotometer at a wavelength of 550 nm.

2.9. Statistical Analysis

For the A. salina, the values were expressed as the means and standard deviation (SD), and the data were verified by the non-parametric Kruskal–Wallis test, followed by the Student–Newman–Keuls “a posteriori” test (p < 0.05), comparing the means of controls and treated groups.
For the S. cerevisiae assay, the results were analyzed by Analysis of Variance (ANOVA), followed by the Bonferroni test for multiple comparisons.
For cell viability by the MTT method, the IC50 (average inhibitory concentration capable of causing 50% of the maximum effect) and their respective Confidence Intervals (95% CI) were calculated from non-linear regression.
All results were statistically analyzed using GraphPad PRISMA version 8.00 for Windows, GraphPad Software, San Diego, CA, USA, Copyright ©.

2.10. Molecular Docking

To elucidate the mechanism of the antioxidant activity of the metabolites identified in this study, molecular docking of the enzymes tyrosinase, human peroxiredoxin number 5 (prdx5) and superoxide dismutase (SOD1) with the metabolites (isoorientin-2″-O-arabinoside and phytosphingosine) was carried out. This analysis was performed using the docking program Autodock Vina version 1.2.0 (The Scripps Research Institute (TSRI), United States) [26].
Molecular docking took place in two stages; the first consisted of predicting the ligand’s conformations and orientations around the receptor’s active site, followed by obtaining the binding energy values of the formed receptor–ligand complex [17]. LigandScout by (Inte Ligand) 4.4/ADV was used to identify binding pockets [27].
To perform the molecular docking, the crystallographic structure of the enzyme tyrosinase (PDB 3NM8) [28], human peroxiredoxin 5 (PDB 1HD2) [29], superoxide dismutase (PDB 2C9V) [30], obtained from the Protein Data Bank program.
Standard search parameters were used: the number of binding modes was 5, the exhaustion was 32, whereas 3 kcalmol −1 is the maximum energy difference between the best binding mode of a ligand and the worst one displayed. In addition, Chimera version 1.16, UCSF USA [31], LigPlot+, EMBL EBI, Cambridgeshire—United Kingdom [32] and Samson by OneAngstrom, French Institute for Research in Computer Science and Automation 2022 [33], were also used for calculating, analyzing as well as visualization of the computational data.

2.11. Pharmacophore Model Generation

Pharmacophore model generation was performed using the same approach [17]. LigandScout by Inte Ligand, Advanced software [27], Vienna, Austria, Europe [27], was used to generate a pharmacophore model. The espresso algorithm was used to create a ligand-based pharmacophore. The scoring function was Relative Pharmacophore-Fit, Merged feature pharmacophore type and feature tolerance scale factor were set to 1.0 for Ligand-Based Pharmacophore creation. The best model was selected from the ten generated models.

3. Results and Discussion

3.1. Metabolite Profiling of M. hirsuta Fractions

3.1.1. HPLC-PDA

The FCFMh, FCGMh and FCRMh fractions by HPLC-PDA have been screened in a simple gradient of 60 min with monitoring at the following wavelengths: 254 nm, 280 nm and 366 nm. The presence of medium- and high-intensity peaks with retention times in the range of approximately 2.5–57 min was verified, indicating the presence of metabolites of different polarities (Figure S1 in the Supplementary Materials).
The HPLC-PDA chromatographic profile of the chloroform fractions of M. hirsuta provided information about the significant metabolic composition and the polarity of different compounds present in other parts of the plant. The UV spectra associated with these peaks showed similar profiles, such as those of Rt at 23.8 and 24.18 min with λmax 280 nm and 320 nm, and peaks with Rt at 4 min, 13 min 17 min, 19 min, 21 min, and 26 min with λmax 200 and 206, 328, 208 and 307, 309 and 325, 223 and 334 nm that may be characteristic of phenolic compounds or suggest the presence of flavonoids, proanthocyanidins, tannins, isoflavones, flavanones and dihydro flavonols by comparison with characteristic wavelengths of each class of secondary metabolites, similar to the study carried out by Alves et al. [17].
The possible presence of chalcones was also detected (Figure S2 in Supplementary Materials), with characteristic UV absorption maximums with band II between (λ max) 220 and 270 nm and a band I with a maximum between (λmax) 340 and 390 nm/300 and 320 nm at retention times 25.64, 26.67, 44.25 min in FCGMh; 28.30 in FCFMh and 24.51, 27.53 min in FCRMh. These values are similar to those described by Simões et al. [34].

3.1.2. LC–MS

Chloroform fractions of leaves (FCFMh), branches (FCGMh) and roots (FCRMh) of M. hirsuta were analyzed using LC–MS in the positive ion mode, with peak identification performed for comparing retention times (Rt) and mass spectral data with reference standards, literature data and database, as shown in Figure S3 in Supplementary Materials and Table 2.
The analyses revealed high metabolite complexity and a better chromatographic resolution for the root fraction (FCRMh). The compounds detected in the leaf fraction corresponded to retention times from 0.2 min to approximately 11 min. For the branches (FCGMh), they presented substances with similar retention times, with a variation between 0.2 min and approximately 10.5 min. At the same time, the roots (FCRMh) revealed compounds at retention times between 0.2 min and 11 min.
Among the metabolites identified in this study, the presence of flavonoid (isoorientin-2″-O-arabinoside), pentacyclic triterpenes (oleanolic acid and ursolic acid) and ceramide (phytosphingosine) was detected in all the fractions studied (FCFMh, FCGMh and FCRMh), and verified by comparing molecular weights, empirical formula, and MS/MS data.
For FCFMh, FCGMh and FCRMh (positive ion mode), the compound with a retention time of 2.0 min showed a fragmentation profile, as described in Table 2, as well as other characteristics of this flavonoid, including fragments at m/z 285 (1.32%), m/z 309 (1.10%), m/z 339 (4.73%) for FCFMh. In branches, it presented fragments m/z 429 (0.18%), m/z 447 (2.95%), and m/z 459 (0.77%). In comparison, the roots showed ions detected at m/z 429 (5.5%), m/z 447 (11.64%), and m/z 459 (1.49%). These MS/MS data were similar to the fragments described in the literature by Shao et al. [35], in which he identified the presence of the flavonoid (isoorientin-2″-O-arabinoside) in the extract of leaves of Phyllostachys edulis, whose characteristic harmful ionization fragments were (m/z 285, 309, 327, 339, 357, 429, 447, 459).
All the fractions displayed fragmentation profile of the triterpenes oleanolic acid and ursolic acid (positive mode) with fragments of m/z 393 (3.84%) and m/z 411 (5.83%) for leaves (FCFMh), m/z 393 (2.95%), m/z 411 (3.35%); m/z 457 (4.21%) for branches (FCGMh), and m/z 393 (0.22%) and m/z 411 (0.36%) for roots (FCRMh) at a retention time of 2.2 min for leaves and branches, and 2.3 min for roots. These data are consistent with the studies of Chen et al. [36].
In addition, the fractions of leaves, branches, and roots also showed fragments characteristic of ceramides (positive ion mode), such as m/z 300 (5.55%) and m/z 318 (100%) in MS spectra from leaves, branches, and the root fraction samples, at a retention time of 5.1 min. Dapic and collaborators [37] characterized ceramides using MS analysis in the positive ionization mode and identified abundant ions attributed to phytosphingosine (m/z 282, 300 and 318).

3.1.3. H-NMR

The 1H-NMR spectra of FCFMh, FCGMh and FCRMh exhibited different profiles (Figure S4 in Supplemental Materials). In the analysis of the 1 H-NMR of the FCRMh, signals close to the region of 8.0 ppm were noticed, which is indicative of aromatic hydrogens—singlets in the region between 3.76 and 3.78 ppm, which could be attributed to methoxyl groups. On the other hand, an important detail is the appearance of intense signals of hydrogens in the region of 3.0 and 4.5 ppm only in the FCRMh, which may be due to the high concentration of free sugars and heterosides.
Similar spectroscopic results were reported by Munikishore et al. [38] to free sugars and heterosides, such as glycosylated flavonoids. Free sugars and heterosides can be easily detected by analyzing their 1 H NMR spectrum, indicated by signals often appearing as multiplets between 3.0 and 4.5 ppm. Such NMR data were consistent with the chemo systematic data from M. hirsuta.
The 1 H-NMR profile of FCFMh and FCGMh is similar since it was possible to observe that they presented intense signals in the range of 1.5–4.00 ppm, a region of more excellent protection of the couplings. The appearance of signals in the region between 2.00 and 2.90 suggests the presence of ethylenic units that unite unsaturated systems (under the influence of unprotected fields with the possible presence of aromatic groups). Thus, the difference in signals in the root fractions may be related to its toxicity in A. salina and its cytotoxic action on breast cancer and murine fibroblast tumor lines.

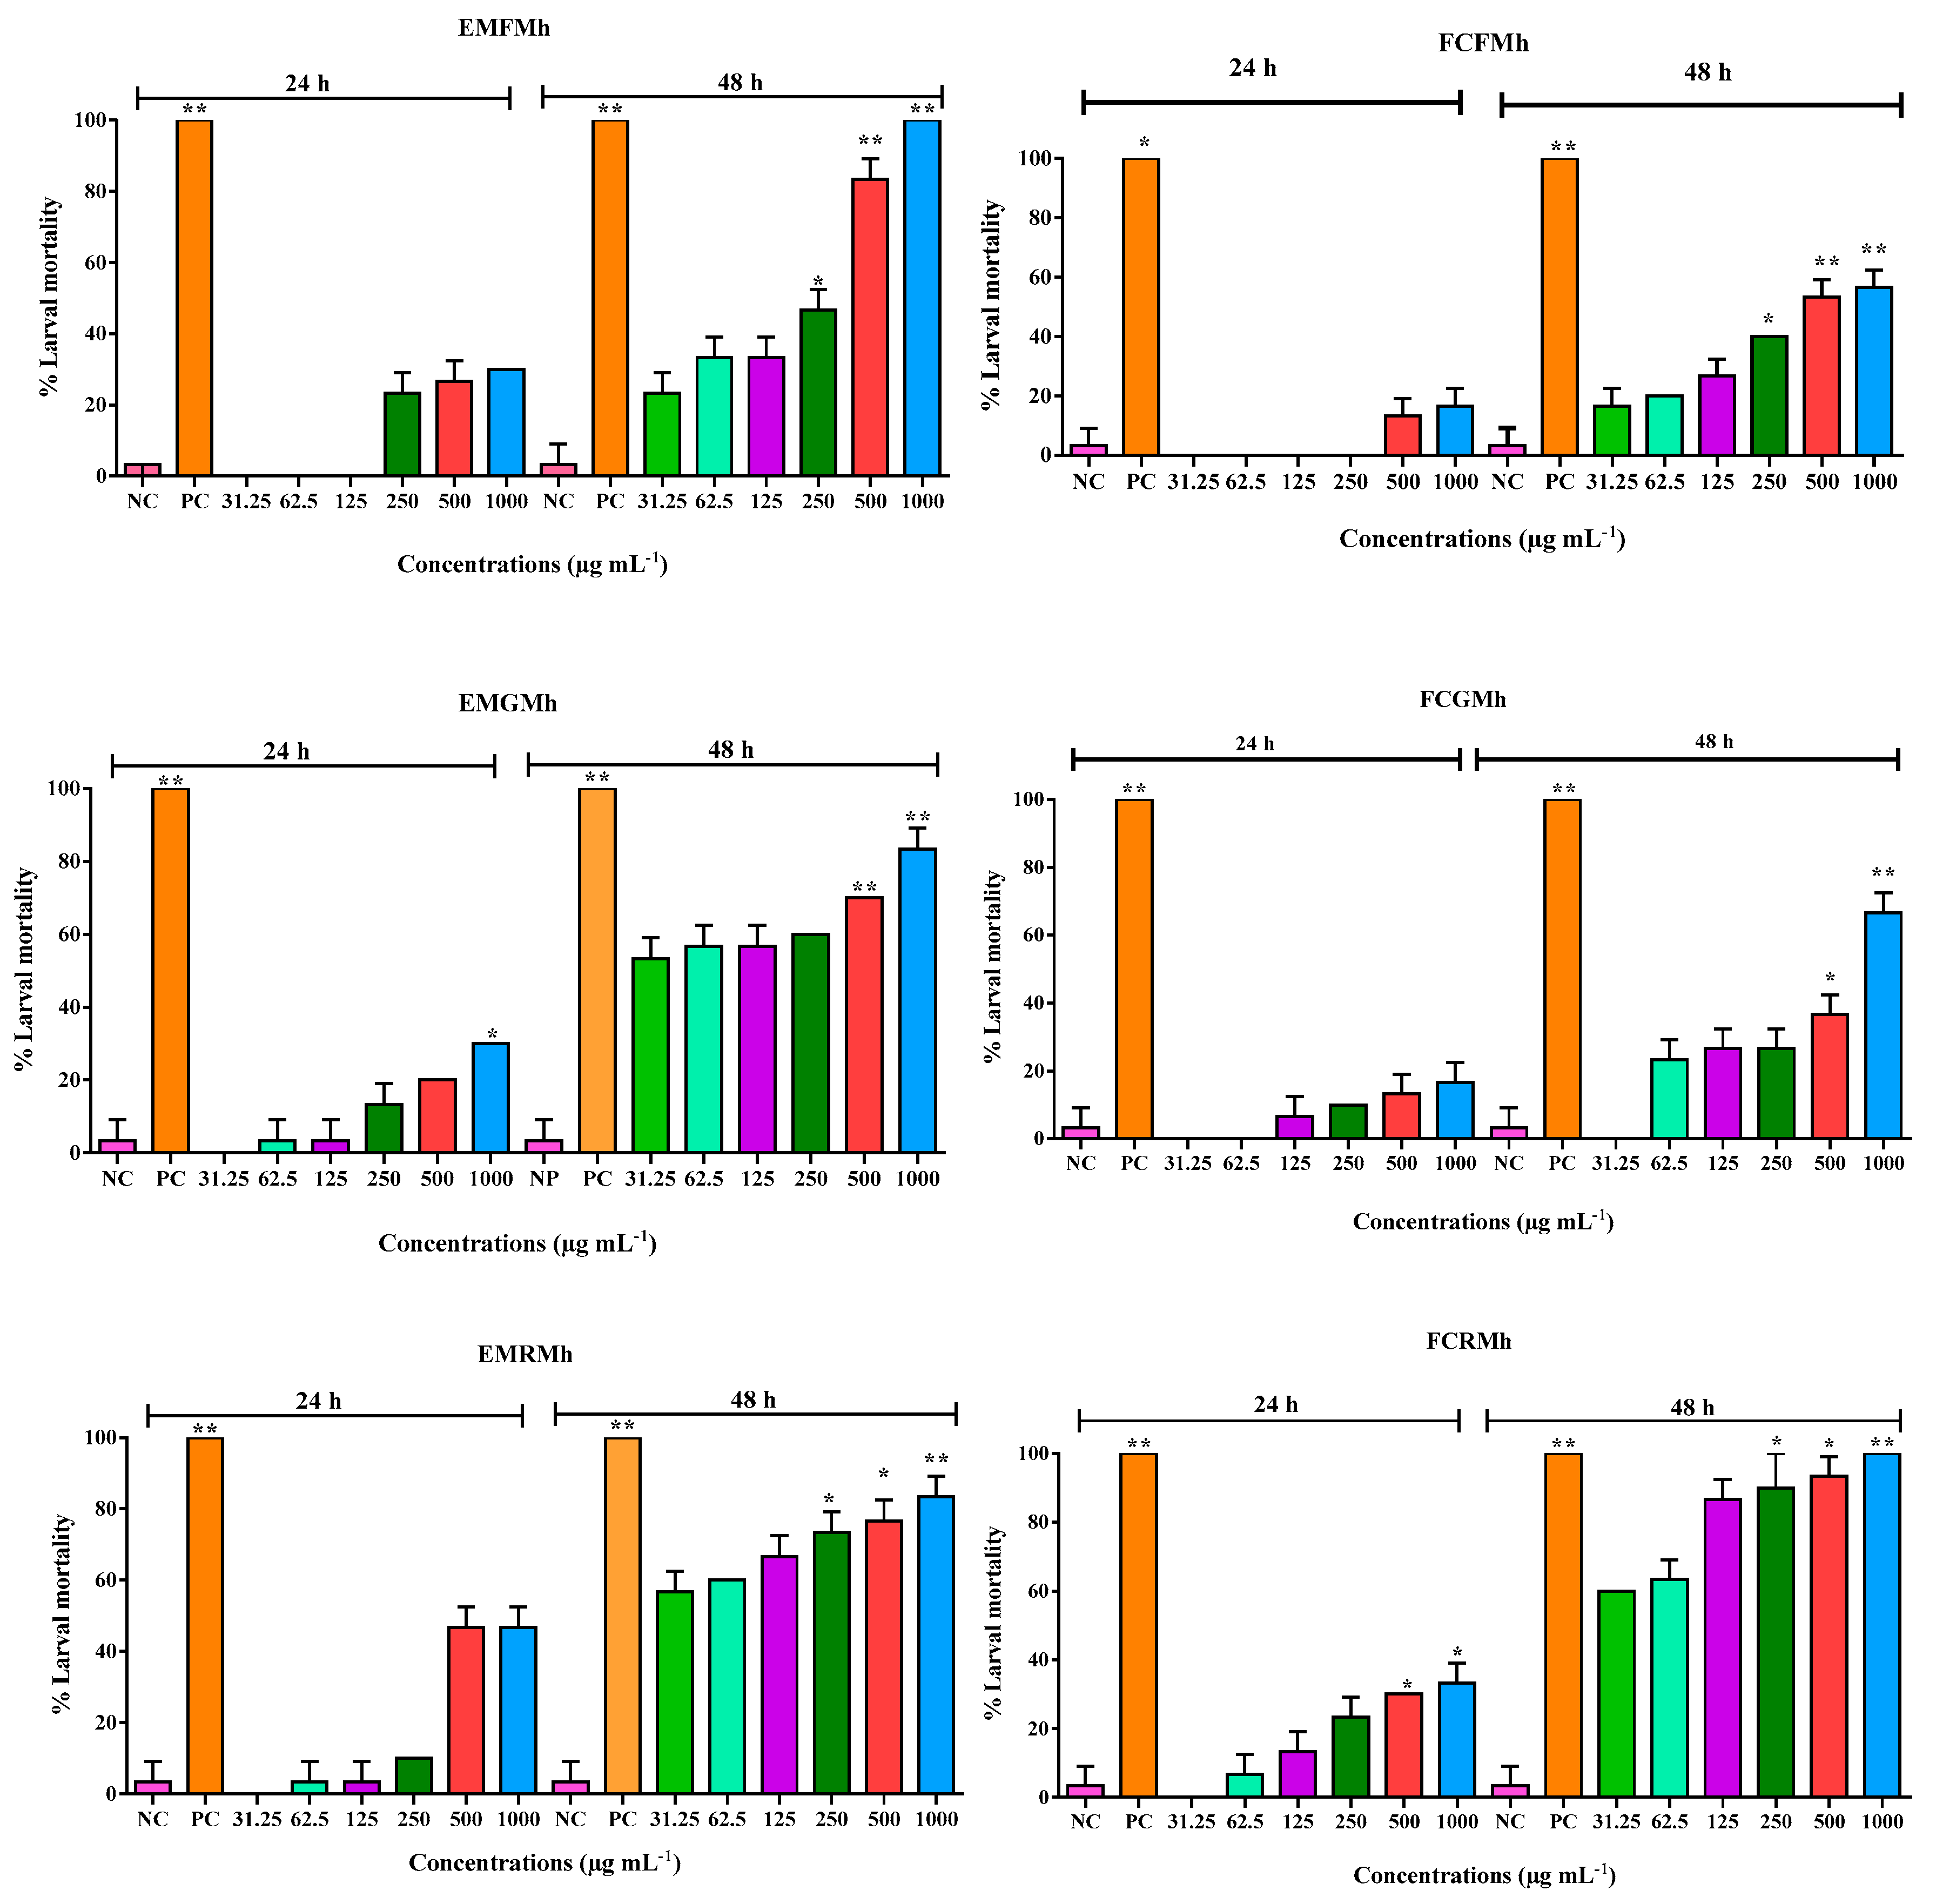
3.2. Bioassay of Toxicity in Brine Shrimp

The preliminary toxicity profile of M. hirsuta was evaluated using the Artemia salina lethality assay, which is commonly used to detect the antitumor, antimicrobial, insecticidal and anticancer properties of test samples [39].
The percentage of mortality of A. salina exposed to varying concentrations of extracts and fractions of M. hirsuta is shown in Figure 1. At the exposure time of 24 h, for the extracts, only the highest concentration of EMGMh (1000 μg mL−1) was significant when compared to the negative control (NC), about fractions, even at the exposure time of 24 h, only FCRMh was significant for the two highest concentrations (500 and 1000 μg mL−1).
As for the incubation time of 48 h, a higher percentage of mortality of A. salina larvae can be verified in all concentrations of extracts and fractions; however, EMFMh and EMRMh were significant only for the highest concentrations (250, 500 and 1000 μg mL−1), and for EMGMh were effective only for the two highest concentrations (500 and 1000 μg mL−1) when compared to NC. For the fractions in the time of 48 h, similarly, there was a higher mortality of larvae, in which they obtained significance for all at the highest concentrations, for FCFMh and FCRMh (250; 500 and 1000 μg mL−1), while for FCGMh (500 and 1000 µg mL−1).
Survival of nauplii in extracts and fractions at 24 h was approximately more significant than 70%, except for EMRMh (approximately 50%). In 48 h, the degree of survival was significantly reduced for all samples tested (extracts and fractions), in a range of variation from 20% to approximately 100%. The extracts of branches (EMGMh) and roots (EMRMh) obtained a percentage of mortality for most concentrations above 50% of the mortality of A. salina larvae. For the fractions, the roots (FCRMh) showed the highest percentage of mortality at all concentrations tested, above 60% of larval mortality.
Thus, in summary, in the 24 h and 48 h, the extracts toxicity order was given for EMRMh > EMGMh > EMFMh. For the fractions, 24 h followed this exact order, FCRMh > FCGMh > FCFMh. In 48 h, FCGMh presented the highest toxicity, so the order was given in FCGMh > FCRMh > FCFMh. Considering that at both exposure times and samples tested, it was observed that Artemia mortality increased concomitantly with the increase in concentration for the exposure time of 48 h.
Some factors may have influenced the more significant toxicity in the exposure time of 48 h, given that, according to the literature, toxicity depends on the concentration and properties of the chemical substance to which the organism is exposed, as well as on the exposure time. Studies involving toxicity tests reveal the time and concentration at which the material under study is potentially harmful, in which any product contact with the membrane or biological system may not produce an adverse effect if the product concentration is low or the contact time is insufficient [40,41].
The LC50 (mean lethal concentration—50%) refers to the concentration of a chemical substance in the air or water, leading to the death of 50% of individuals in a given time [42]. This value was obtained from the linear regression between the percentage of dead individuals and the concentration of the tested compounds (Table 3). It was observed that the LC50 for 24 h for all extracts and fractions was in the range of approximately 100–500 (µg·mL−1); that is, the extracts and fractions showed medium toxicity, while the LC50 of 48 h for extracts and fractions such values decreased from approximately 64.21 to 421.9 (µg·mL−1), presenting a moderate to high toxicity range.
According to the literature and the WHO, the crude extract of a plant has toxicity if the LC50 value is less than 1000 µg·mL−1. In addition, if the LC50 value is more significant than 1000 µg·mL−1, extracts or fractions are considered non-toxic or inactive [23,43]. Other toxicity criteria were adopted by Clarkson et al. [44] for the evaluation of the toxicity of plant extracts; according to these, LC50 in the range of 500–1000 µg·mL−1 are considered of low toxicity, extracts with LC50 of 100–500 µg·mL−1 are termed medium toxicity, while extracts with LC50 of 0–100 µg·mL−1 are highly toxic.
The toxicological capacity of the extracts and fractions in this study may be due to secondary metabolites. Chakraborty et al. [45] attribute the cytotoxicity in extracts to these metabolites found naturally in plants.
However, non-toxic extracts were generally not sought for further study as potential anticancer compounds [23]. Nevertheless, scientific evidence shows that plant extracts with low LC50 values will likely produce anticancer compounds. This evidence was provided by the works of Croton macrostates [46], Maytenus putterlickioides [46], Psorospermum febrifugum [47] and Ximenia americana [46].

3.3. Oxidant/Antioxidant Activity in Saccharomyces cerevisiae

The single-cell eukaryote Saccharomyces cerevisiae in antioxidant defenses is generally similar to those of higher organisms. Similar to most eukaryotes, there are two types of superoxide dismutase, one mitochondrial (MnSOD—Sod2) and another cytosolic (CuZnSOD—Sod1). The Mutant Double Bloodline sod1Δsod2Δ, deficient in both enzymes Sod-CuZn and SodMn, is more sensitive to reactive oxygen species. Table 4, Table 5 and Table 6 show the sensitivity of cells of WT, sod1, sod2, and dismutase-deficient sod1sod2 strains after pre-treatment, co-treatment and post-treatment with the fractions of M. hirsuta (50, 250 and 500 µg mL−1) in aerobic metabolism and in the exponential phase of growth. It was possible to observe that in the M. hirsuta fractions, the SodWT strain (wild) was the one that presented the highest inhibition halo when compared to the other mutant and deficient strains, which may be due to this strain having all the antioxidant defenses.
The following tables show the growth inhibition values of the proficient and mutated strains and the test substances. In the pre-treatment (Table 4), all the fractions (leaves, branches and roots of M. hirsuta) in all concentrations tested (50, 250 and 500 µg mL−1) showed antioxidant/protective effects, as the samples modulated the oxidative effect of the stressing agent hydrogen peroxide. Furthermore, at the lowest concentration (50 µg mL−1) of the three fractions, the antioxidant power (protective) was statistically compared to the negative control, showing the protective potential of these fractions against oxidative damage. In relation to the pre-treatment strains (Table 4), the leaf fraction exhibited greater sensitivity in the SodWT strain, at the highest concentration (500 µg mL−1), as it had the highest inhibition halo. For the fraction of the branches, the Sod2∆ strain showed greater sensitivity at a concentration of 500 µg mL−1, while the fraction of the roots was more sensitive in the Sod1∆Sod2∆ and Sod1∆Cat1∆ strains, both at the highest concentration tested, when compared to the stressor agent hydrogen peroxide.
In addition, it was also possible to observe that with increasing concentrations, the inhibition halos of both fractions studied (FCFMh, FCGMh and FCRMh) decreased their antioxidant effects.
In the co-treatment, the antioxidant effect of the M. hirsuta fractions was evaluated simultaneously with the stressor agent (Table 5). The results showed that all the fractions in the three concentrations (50, 250 and 500 µg mL−1) presented antioxidant effects, as they did not potentiate the effect of H2O2. These antioxidant effects were more expressive at the lowest concentration tested, equivalent to 50 µg mL−1, with some values significantly equal to the NC. For the co-treatment (Table 5), the leaf fraction showed a higher sensitivity for the Sod1∆ strain at (500 µg mL−1). The fraction of the branches, however, showed a similarity of sensitivity in the SodWT and Sod2∆ strains, being more sensitive to the latter, at a concentration of 500 µg mL−1. On the other hand, in relation to the root fraction, it showed greater sensitivity for the SodWT strain at 500 µg mL−1.
For post-treatment (Table 6), the repair potential (ability to minimize induced oxidative damage) of M. hirsuta fractions was verified. It was observed that all the fractions of the species under study at the three concentrations (50, 250 and 500 µg mL−1), when compared with the PC control group, modulated the damage induced by H2O2, showing an antioxidant/repair potential. For post-treatment strains (Table 6), all the fractions were also more sensitive for all strains at the highest concentration (500 µg mL−1). For the fraction of leaves and branches, the Sod1∆ strain was more sensitive; however, for the fraction of roots, the Sod1∆Sod2∆ strain showed greater sensitivity.
The oxidant/cytotoxic effect of the M. hirsuta fractions was evaluated without the addition of the stressor agent (Table 7), the results showed oxidant/cytotoxic potentials in the concentrations of the M. hirsuta fractions (250 and 500 µg mL−1), with the exception of a concentration of 250 µg mL−1 in SodWT, Sod1Sod2 and cat1 strains for FCFMh. Furthermore, only a concentration of 50 µg mL−1 of the Sod2 strain showed oxidant/cytotoxic potential. For the FCGMh and FCRMh fractions, they also showed oxidant/cytotoxic potential at the concentrations 250 and 500 µg mL−1, with the exception of a concentration of 250 µg mL−1 in the SodWT strain for both fractions. These findings collaborate with the results of A. salina and MTT found in the present study.
The yeast S. cerevisiae presents mechanisms that respond to oxidative stress; this oxidative stress, according to Mascarenhas et al. [48], occurs when reactive oxygen species overcome cellular antioxidant defenses. Our data showed that the fractions of M. hirsuta had the ability to neutralize free radicals and reactive oxygen species, that is, the oxidative stress induced for H2O2, especially at lower concentrations; however, at higher concentrations, the antioxidant capacity was reduced.
Concerning the lowest concentrations (50 and 250 µg mL−1), they demonstrated more significant antioxidant effects in the yeast S. cerevisiae. These results may be related to M. hirsuta metabolites responsible for free radical scavenging and anti-inflammatory activity. According to Oliveira et al. [49] and Nemudzivhadi and Masoko [50], constituents such as terpenoids, phenolic compounds (flavonoids) and nitrogen compounds (alkaloids) are potent antioxidant constituents of medicinal plants.
This fact was verified by Campana et al. [51], who studied the antioxidant activity of M. hirsuta through the test with superoxide dismutase (SOD) against the ethanolic extract of M. hirsuta leaves (EEF). The authors reported that the protective action of polyphenol compounds is directly related to other activities, which include antithrombotic, anti-ischemic and vasorelaxant properties. The EEF results for this study were concentration-dependent vasodilator activity pEC50 = 5.6 ± 0.2 and 6.3 ± 0.1 in the absence and presence of EEF (50 mg mL−1), respectively, where these results were compared with the response curve through the addition of SOD, giving the following results pEC50 = 5.6 ± 0.2 and 6.3 ± 0.2 in the absence and presence of SOD, respectively. Therefore, in this study, there was no formation of reactive oxygen species in the presence of EEF at a low concentration (50 mg mL−1), confirming its antioxidant potential. According to the authors, the antioxidant property of the polyphenols found in EEF is likely related to heterogeneous proanthocyanidins [52].
Research has shown that plant phenolics are secondary metabolites that can act as potential anticancer compounds and have cytotoxic activities. In addition, its cytotoxic capacity promotes apoptosis, reduces cell proliferation, and targets various aspects of cancer (angiogenesis, growth and differentiation, and metastasis) [53,54].

3.4. Cell Viability for the MTT Method

The fractions of M. hirsuta showed cytotoxic effects against the two strains analyzed. Furthermore, the inhibitory effect of the root fractions showed better cytotoxicity values against the murine mammary tumor cell line (4T1), as well as against the murine fibroblast cell line (L929) (Table 8). The cytotoxic effect was evident, as the concentrations of the fractions of leaves, branches and roots of M hirsuta that inhibited cell growth by half (IC50) in both strains were below 1000 μg mL−1. According to Onyancha et al. [55], extracts or fractions exhibit remarkable anticancer activities with IC50 values < 1000 μg mL−1; values above this concentration are considered inactive or non-cytotoxic.
Regarding the selectivity index of the fractions, the analysis showed from Table 7 that the fraction of roots and leaves exhibited selective cytotoxicity against 4T1 cells. However, they did not show selectivity for a fraction of branches since the IC50 was similar in both strains.
This selectivity index (SI) indicates the differential cytotoxicity of a compound against tumor and normal cells. It is worth noting that the higher the SI value of a compound, the more selective it is, and an SI value above 2 indicates cytotoxic selectivity [56]. Therefore, the fractions of roots and leaves, mainly of roots (FCRMh), were considered selective against cancer cells. Furthermore, the order of cytotoxicity evaluated by MTT was given in the following order FCRMh > FCFMh > FCGMh.
Endringer et al. [14] determined results similar to our study, which evaluated thirty-two extracts from seven species of Brazilian plants for their cancer chemoprevention activity. The methanolic fraction of the ethanolic extract of the leaves of M. hirsuta was the only one among the evaluated extracts that showed a solid inhibitory response of the COX-1 enzyme. This enzyme may be part of the genesis of cancer. However, no studies are reported in the literature for the chemopreventive activity of branches and roots of M. hirsuta.

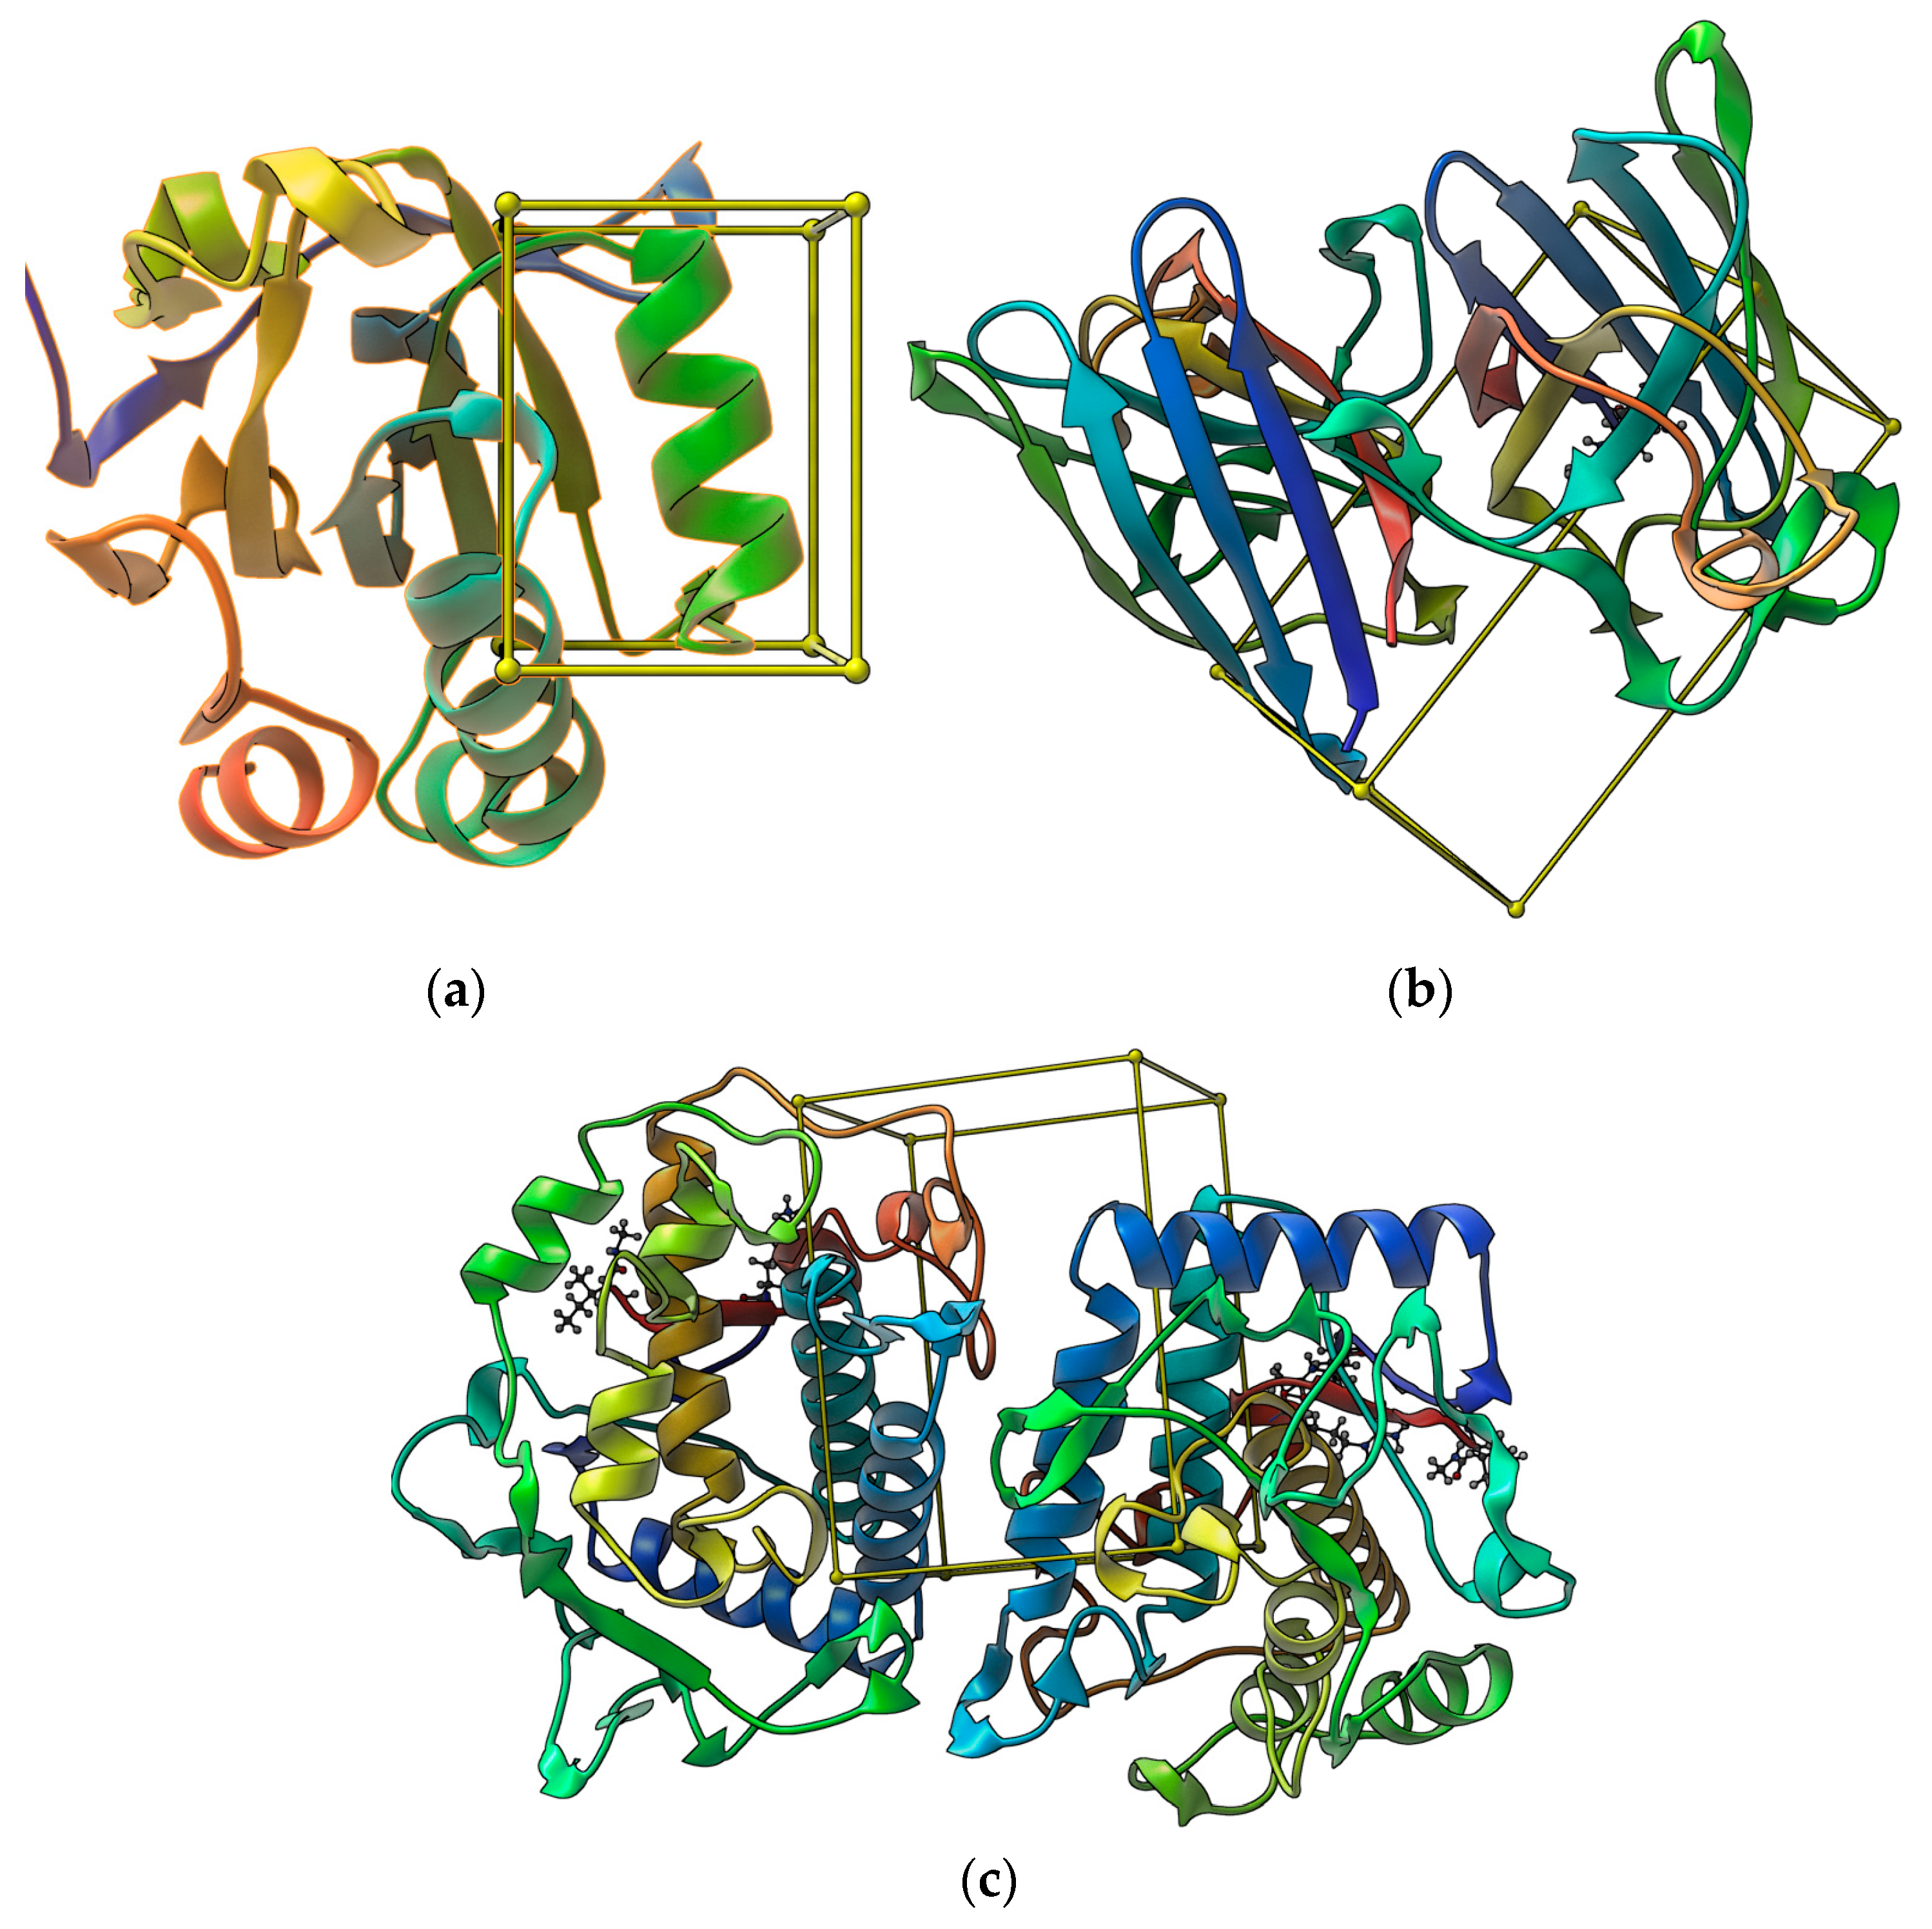
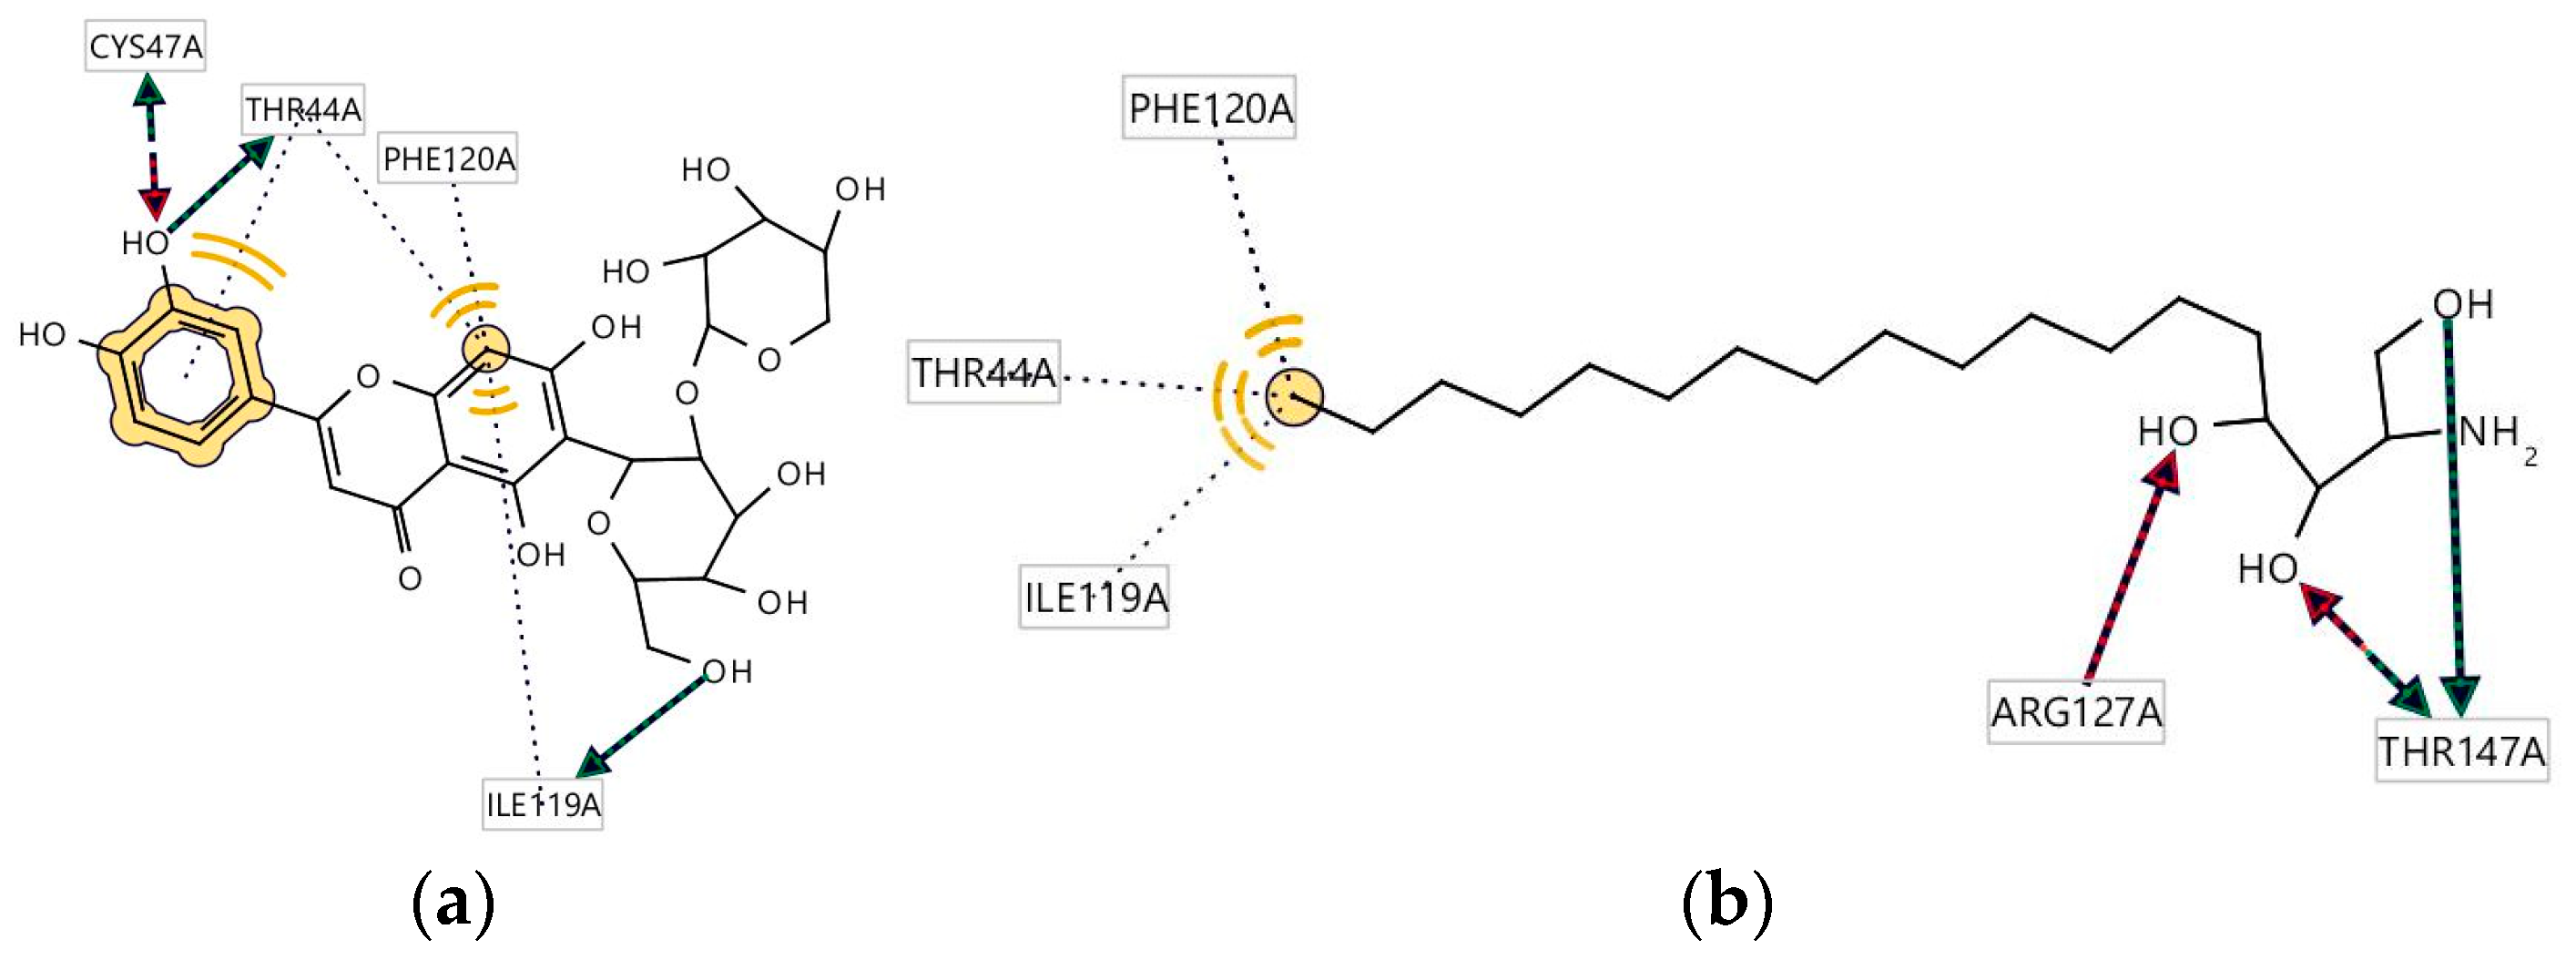
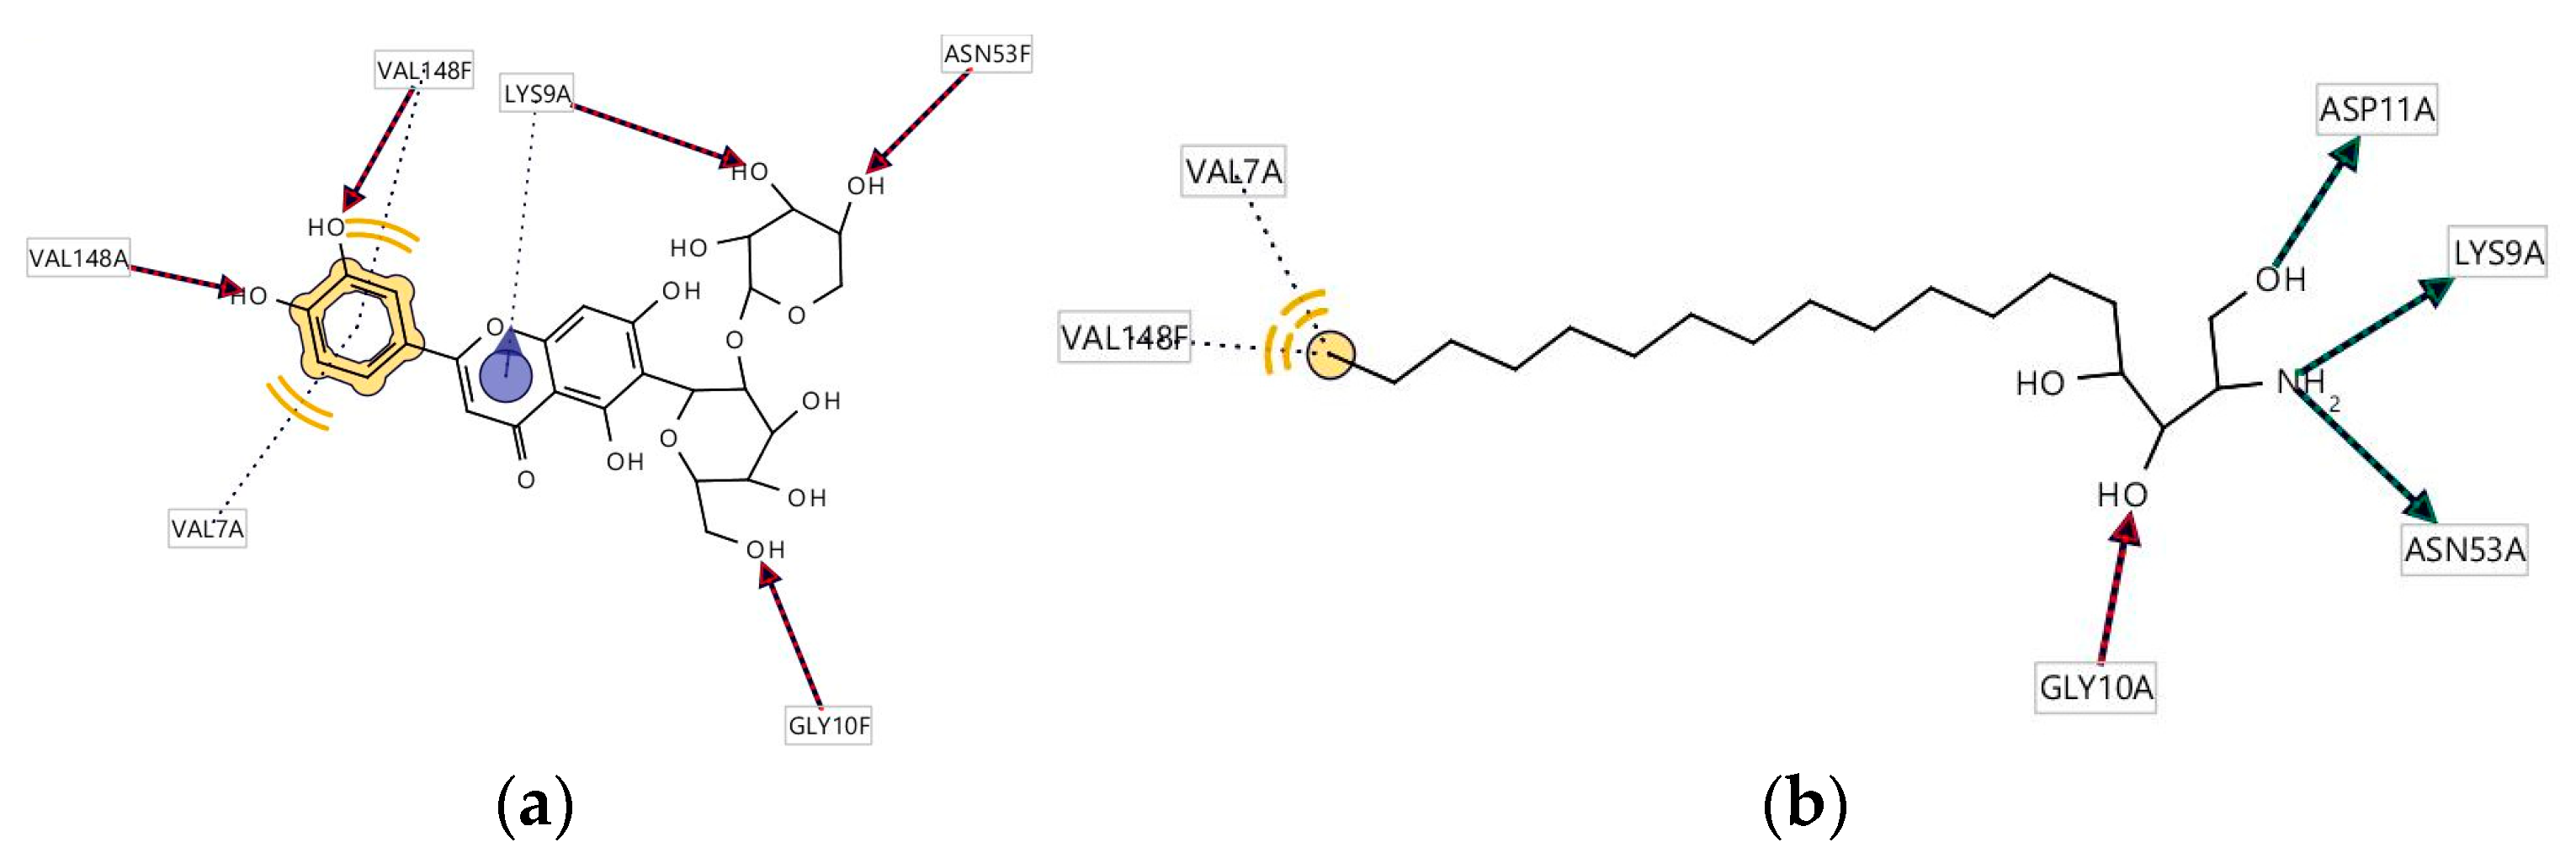
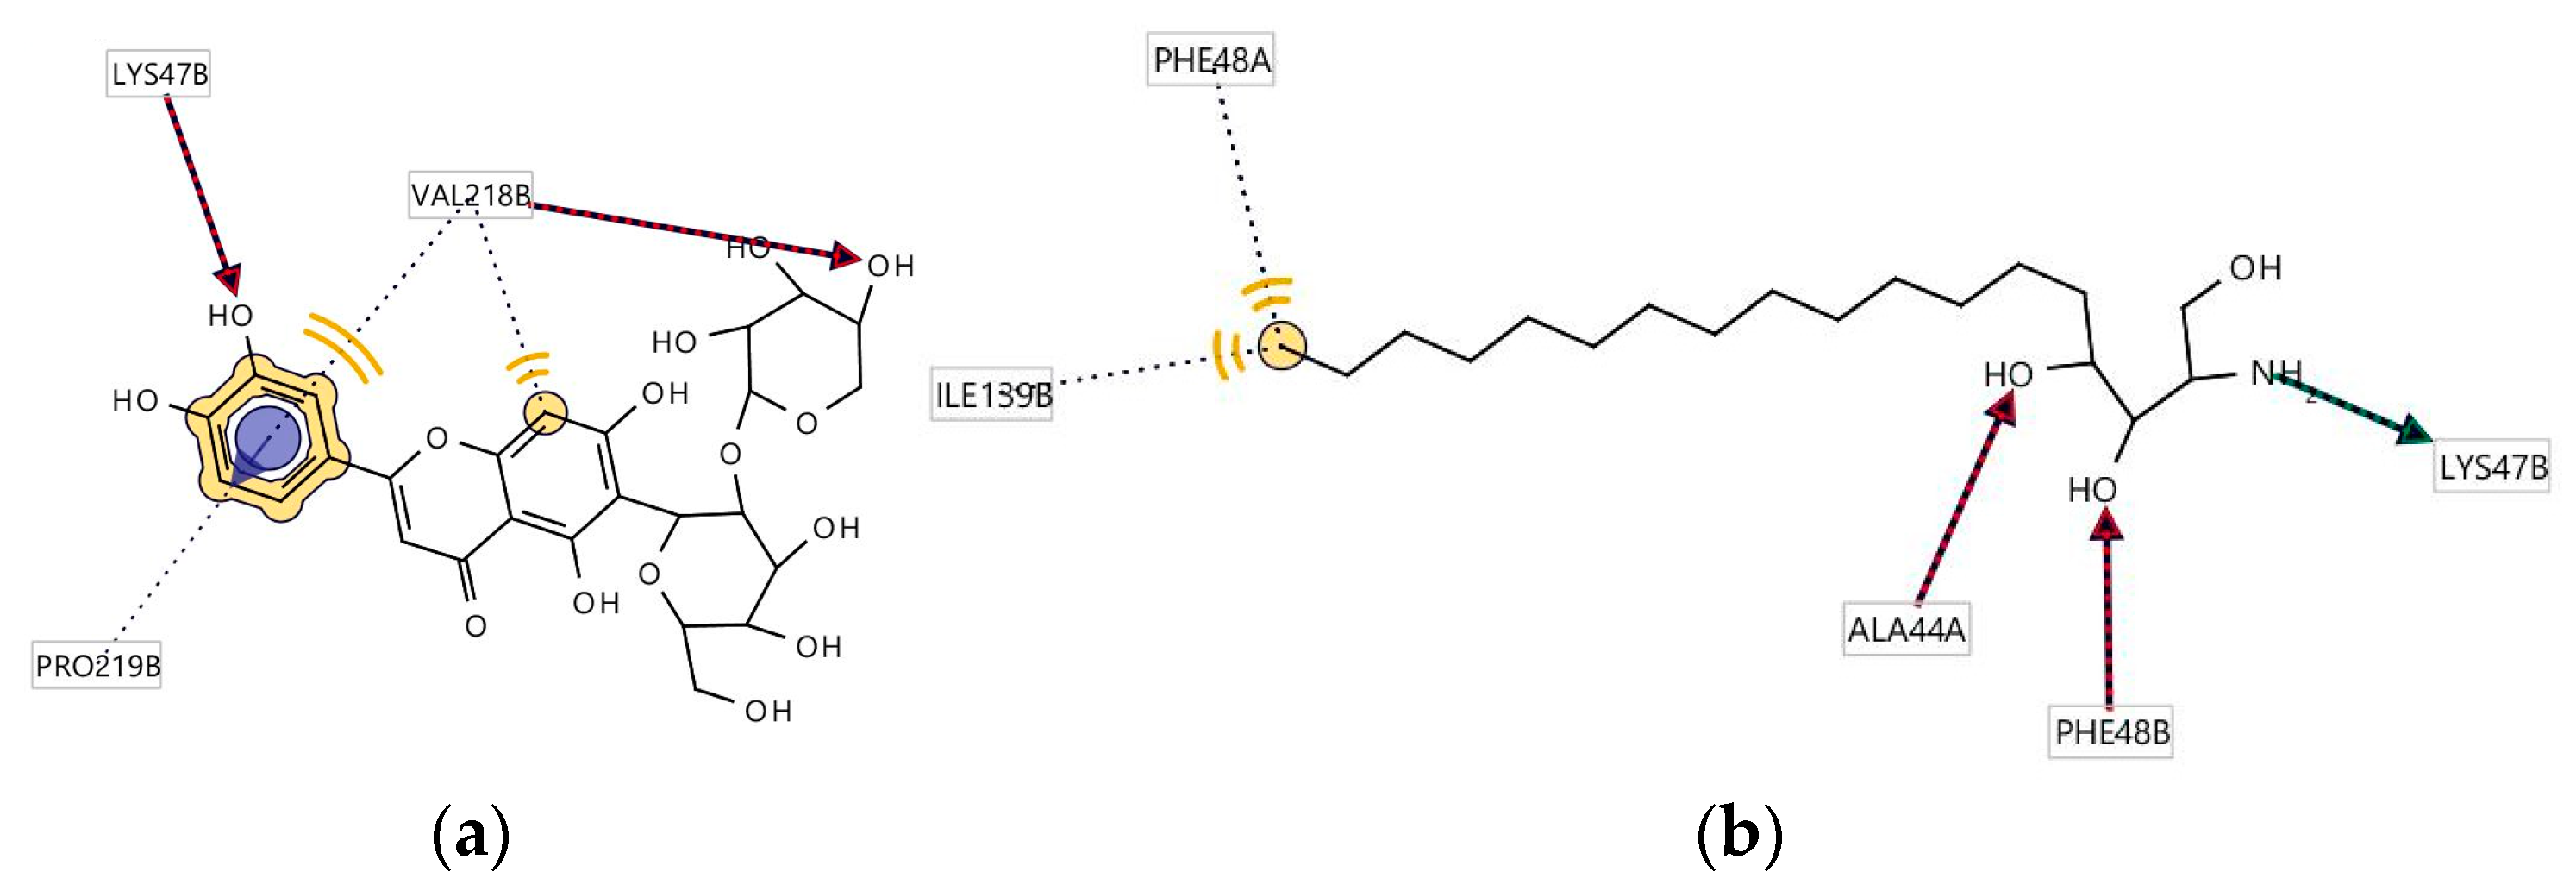
3.5. Molecular Docking

The molecular modelling aimed to determine whether there could be a favorable energetic interaction of the bioactive compounds isoorientin-2″-O-arabinoside and phytosphingosine in anchorage with the enzymes to elucidate the antioxidant potential responsible for the ligand/receptor interaction. One of the enzymes studied was tyrosinase [28], considered one of the key enzymes for the biosynthesis of melanin pigmentation, used in coloring the skin, eyes, and hair, as well as food browning. However, according to the literature, many substances can inhibit the tyrosinase enzyme’s action. However, they present toxicology, so searching for new effective inhibitors that do not cause adverse effects is fundamental. The other enzymes used in this study were human peroxiredoxin 5 [29] and superoxide dismutase [30], which act as essential enzymes in the antioxidant defenses of most cells exposed to oxygen.
It should be noted that the receptor was kept rigid during the molecular docking to gain knowledge of the differences in binding between the chemical structures and the proteins. Docking results were analyzed and further compared to the standard hydrogen peroxide. The first docking experiment was done on the tyrosinase from Bacillus megaterium (PDB 3NM8) [28]. Human peroxiredoxin 5, a Mammalian Peroxiredoxin (PDB 1HD2), was used in this computational study to generate second docking data values [29]. On the other hand, the third docking experiment was performed on human superoxide dismutase (SOD1) and protects cells from the effects of oxidative stress (PDB: 2C9V) [30]. The two isoorientin-2″-O-arabinoside and phytosphingosine were used in the docking experiment, and their interaction with these targets, as shown in Figure 2, was investigated. The experimental results were obtained for the best-docked complexes based on binding energies and interacting residues and then compared to the docking values generated for the standard. From the three molecular docking experiments isoorientin-2″-O-arabinoside and phytosphingosine showed well docking values in comparison to the standard docking generated values (Table 9, Figure 2). According to the literature, isoorientin-2″-O-arabinoside and phytosphingosine bind directly to protein receptors, data shown in research on [57,58,59,60].
Concerning the triterpenes oleanolic acid and ursolic acid, a molecular docking approach was used in our previous research [17], in which these triterpenes were also identified in the methanolic extracts, it was possible to verify that both triterpenes fitted with favorable energy with ligand/protein interaction, through the enzymes tyrosinase, human peroxiredoxin 5 and superoxide dismutase, with the standard quercetin, a powerful antioxidant flavonoid, thus suggesting that the triterpenes had considerable antioxidant action.
Ligplots in Figure 3 show that both compounds interact with amino acids Phe120A, Thr44A and Ile119A and are involved in hydrogen bonding. Thr44A and Ile119A are involved in hydrogen bond donators, while CYS47A acts as a hydrogen bond donator and an acceptor in isoorientin-2″-O-arabinoside. Phytosphingosine interacts with Arg127A and Thr147A in forming hydrogen bond donators and acceptor interactions. Thr147A is also involved in hydrogen bond acceptor interaction with the compound phytosphingosine.
Ligplots in Figure 4 show that both compounds interact with amino acids Val7A and Val148F and are involved in hydrogen bonding. Val148A, Val148F, Lys9A, Asn53F, Gly10A and Gly10F amino acids are involved in hydrogen bond acceptors with both compounds. Amino acids Asp11A, Lys9A and Asn53A are involved in hydrogen bond donators with the compound phytosphingosine. Amino acid LYS9A are involved in Aromatic interactions with the compound isoorientin-2″-O-arabinoside.
Ligplots in Figure 5 show that compound isoorientin-2″-O-arabinoside involves hydrogen bonding and hydrogen bond donator interaction with amino acids Lys47B, Val218B and Pro219B. Pro219B is also involved in aromatic interactions with this compound. In compound phytosphingosine, hydrogen bond interactions are with Phe48A and Ile139B amino acids, while Phe48B and Ala44A are involved in hydrogen bond acceptor interactions and Lys47B in hydrogen bond donator interactions.

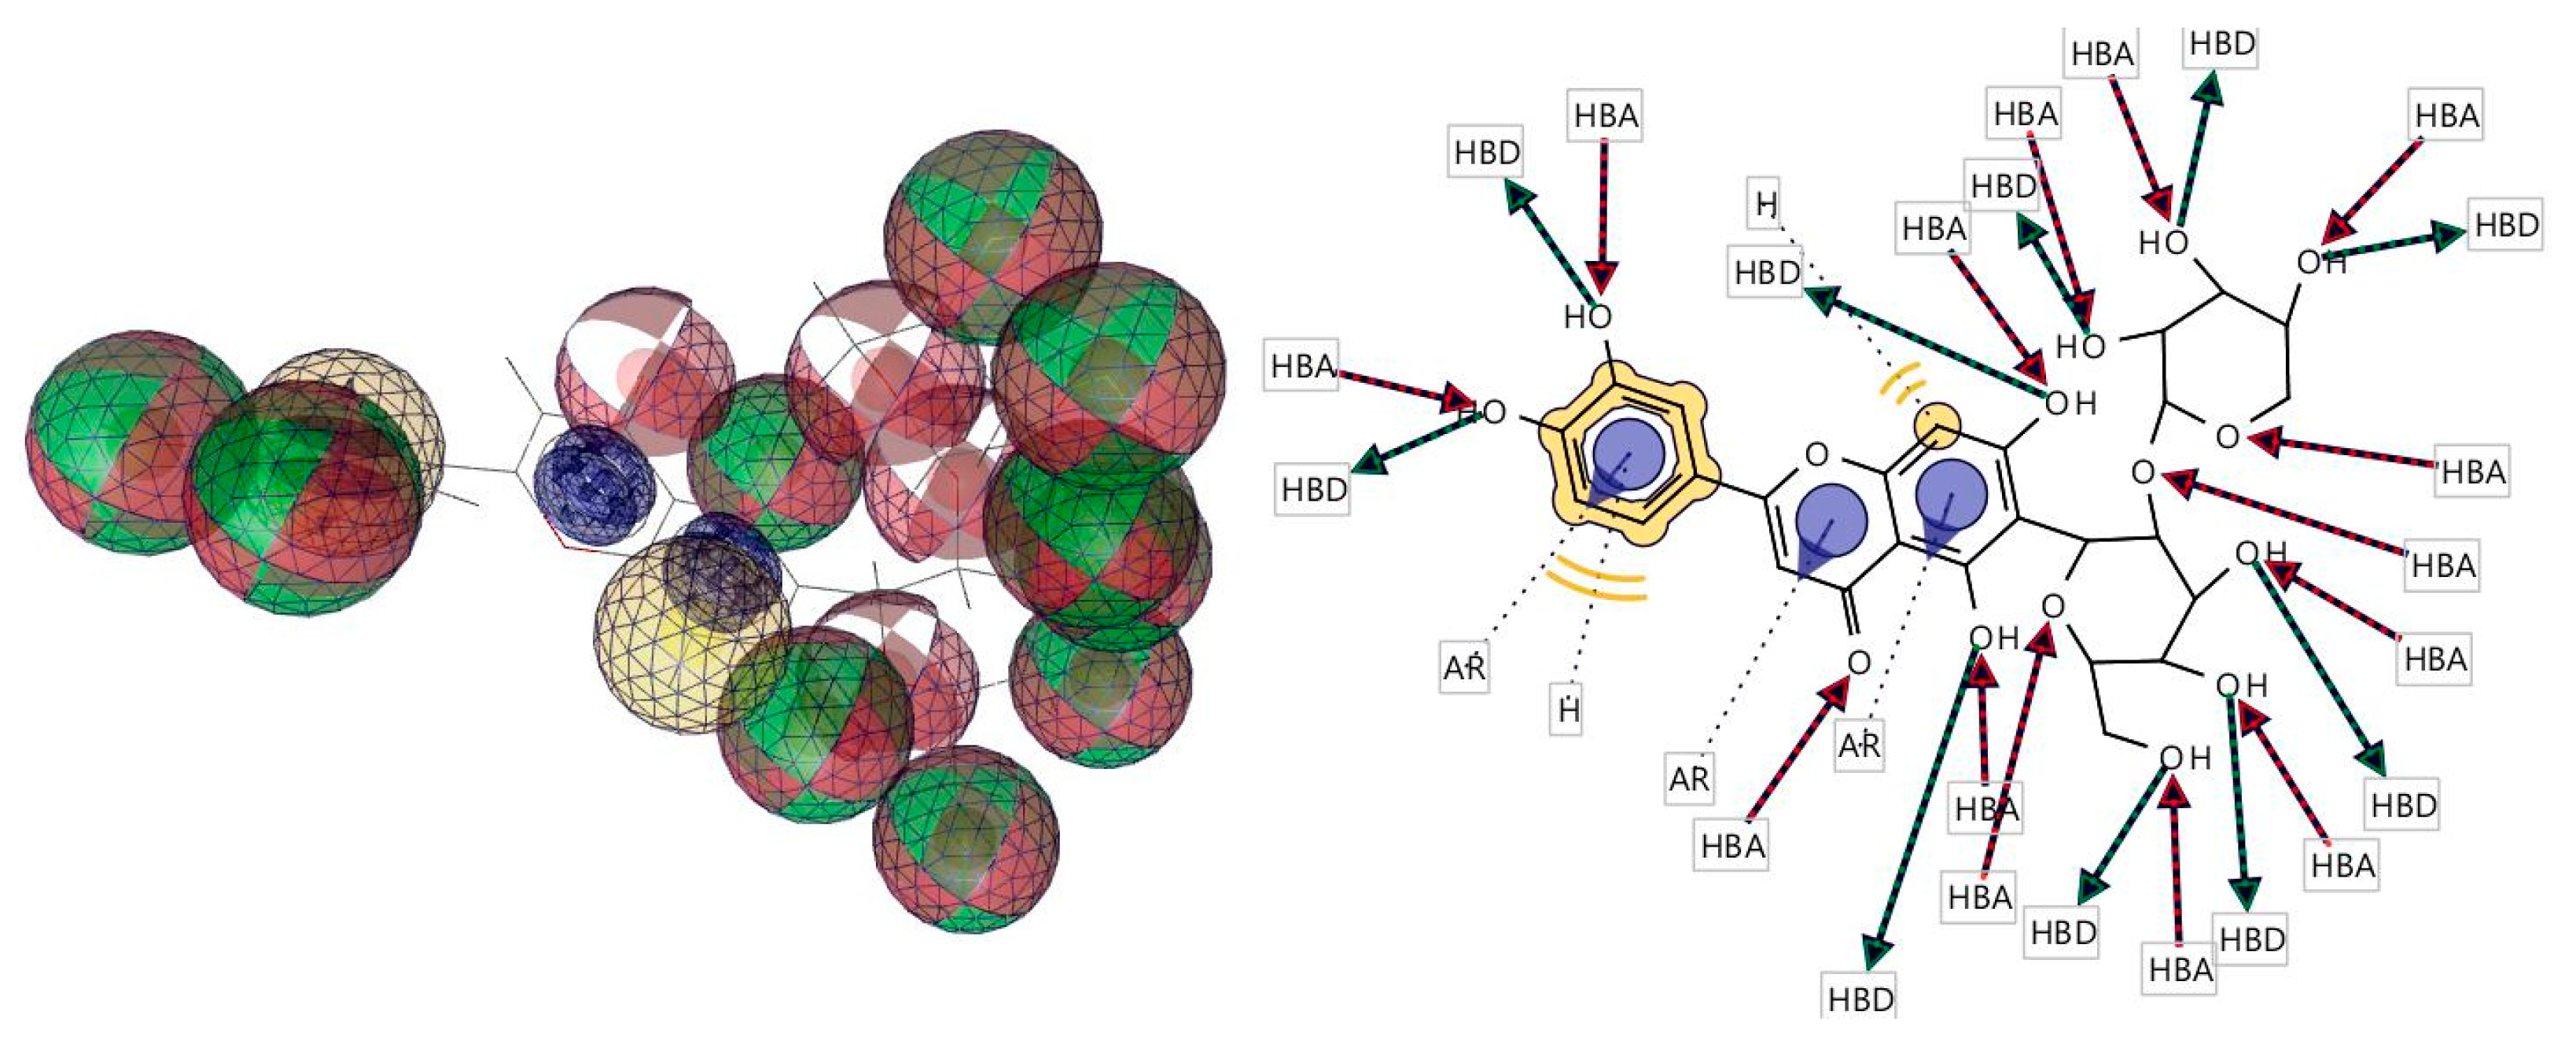
3.6. Pharmacophore Evaluation

The algorithm calculated by the software [27] selected the best pharmacophoric model based on its minimum energy of conformers of the compound isoorientin-2″-O-arabinoside. Furthermore, the intramolecular measurements of the pharmacophore model provided some essential chemical characteristics such as aromatic interactions—Ar; hydrogen bond acceptors or HBAs; hydrophobic interactions or H and hydrogen bond donors or HBDs. Studies with 3D and 2D pharmacophoric models are seen in Figure 6.

4. Conclusions

The chemical profile from M. hirsuta showed the presence of phenolic compounds, such as proanthocyanidins, tannins, isoflavones, flavanones and dihydro flavonols, chalcones, and other polyphenols. In addition, different chemical classes were identified through the LC–MS analysis, such as the flavonoid isoorientin-2″-O-arabinoside, the pentacyclic triterpenes oleanolic acid and ursolic acid, and the ceramide phytosphingosine.
The toxicological action of A. salina demonstrated that all chloroform fractions of leaves, branches and roots were toxic; however, this toxicology was more evident in the fractions of roots and branches in an exposure time of 48 h.
For cell viability, all leaf, branch and root fractions exhibited cytotoxicity. However, the root fraction (FCRMh) which is expected to be due to polyphenols in M. hirsuta fractions, but further experimental results are needed to properly understand the cytotoxicity.
In S. cerevisiae, all chloroform fractions of leaves, branches and roots of M. hirsuta exhibited antioxidant effects mainly at lower concentrations (50 and 250 µg mL−1), which can be justified by the existence of antioxidant compounds reported in these fractions, in which they are responsible for scavenging free radicals.
Molecular docking analysis gave strong binding potentials associated with antioxidant activity. These results proposed a pharmacophore model for the flavonoid isoorientin-2″-O-arabinoside to help guide future studies. Additionally, the proposed pharmacophore model should be used as a future guide for selecting and designing flavonoids as antioxidants.
Therefore, the chemical and biological profile demonstrated that the species M. hirsuta, referring specifically to leaves, branches and roots, has remarkable biological activity; however, further studies are suggested to isolate or characterize the bioactive phytochemical compounds of these fractions.

Supplementary Materials

The following supporting information can be downloaded at: https://www.mdpi.com/article/10.3390/biophysica3030028/s1, Figure S1: Analytical chromatograms of M. hirsuta chloroform fractions by HPLC-PDA, detection at wavelengths 254 nm, 280 nm and 366 nm, an FCFMh, b FCGMh and c FCRMh, where FCFMh: chloroform fraction of Mansoa hirsuta leaves; FCGMh: chloroform fraction of Mansoa hirsuta branches; FCRMh: chloroform fraction of Mansoa hirsuta roots. 1: compound—isoorientin-2″-O-arabinoside; 2: compound—phytosphingosine. Figure S2: UV spectra at wavelengths characteristic of chalcones in the range from 220 nm to 390 nm. 1 (a) Retention time of 28.30 min, absorption bands at 224 nm and 313 nm—FCFMh. 2 (a), 2 (b) and 2 (c) Retention time of 25.64 min, 26.67 min and 44.25 min, respectively. Absorption bands: (λ 222 nm and 342 nm), (λ 223 nm and 334 nm) and (λ223 nm and 310 nm), respectively, for FCGMh. 3 (a) and 3 (b) Retention time of 24.51 min and 27.53 min, respectively. Absorption bands: (λ220 nm and 325 nm) and (λ220 nm and 327 nm), respectively, for FCRMh. Figure S3: Spectra with the m/z fragments corresponding to the compounds identified in the positive ionization mode: 1 (a) FCFMh—isoorientin-2″-O-arabinoside, 1 (b) FCGMh—isoorientin-2″-O-arabinoside, 1 (c) FCRMh—isoorientin-2″-O-arabinoside, 2 (a) FCFMh—oleanolic and ursolic acid, 2 (b) FCGMh—oleanolic and ursolic acid, 2 (c) FCRMh—oleanolic and ursolic acid, 3 (a) FCFMh—phytosphingosine, 3 (b) FCGMh—phytosphingosine, 3 (c) FCRMh—phytosphingosine. Figure S4: 1 H NMR spectra (Methanol-D4, 600 MHz) of chloroform fractions from leaves, branches and roots of M. hirsuta.

Author Contributions

Conceptualization, P.e.S.A., J.M.S. and T.A.; methodology, P.e.S.A..; software, G.P., P.e.S.A. and L.D.; validation, P.e.S.A., M.O., T.A. and C.F.; formal analysis, P.e.S.A., M.L.N. and A.R.; investigation, P.e.S.A., C.F. and T.A.; resources, P.e.S.A. and G.S.; data curation, P.e.S.A. and J.J.; writing—original draft preparation, P.e.S.A.; writing—review and editing, J.M.S. and T.A.; visualization, P.e.S.A. and C.F.; supervision, T.A. and N.M.L.; project administration, L.D., M.O. and G.S.; funding acquisition, J.J., T.A. and C.F. All authors have read and agreed to the published version of the manuscript.

Funding

This research was funded by FAPEMA, IFMA (23249.031946.2020-62) (23249.020554.2022-30), Cactvs Institution of Payments SA and of Cactvs Educa—Masters and Doctorate Scholarships and Cnpq 316647/2020-9.

Data Availability Statement

The data presented in this work are available on request from the corresponding author.

Acknowledgments

The authors would like to thank the Research Support Foundation of the State of Maranhão (FAPEMA), Cactvs Instituto de Pagamentos SA and Cactvs Educa—Masters and Doctoral Scholarships, National Council for Scientific and Technological Development (CNPq), Federal University of Piauí (UFPI), and the Federal Institute of Piauí (IFPI).

Conflicts of Interest

The authors declare no conflict of interest.

References

  1. Vieira, P.M.; Costa, P.M.; e Silva, C.R.; Chen-Chen, L. Assessment of the genotoxic, antigenotoxic, and cytotoxic activities of the ethanolic fruit extract of Solanum lycocarpum A. St. Hill. (Solanaceae) by micronucleus test in mice. J. Med. Food 2010, 13, 1409–1414. [Google Scholar] [CrossRef]
  2. Sharma, V.; Sarkar, I.N. Bioinformatics opportunities for identification and study of medicinal plants. Brief. Bioinform. 2013, 14, 238–250. [Google Scholar] [CrossRef] [Green Version]
  3. Ullah, A.; Munir, S.; Badshah, S.L.; Khan, N.; Ghani, L.; Poulson, B.G.; Emwas, A.-H.; Jaremko, M. Important Flavonoids and Their Role as a Therapeutic Agent. Molecules 2020, 25, 5243. [Google Scholar] [CrossRef]
  4. Ogbole, O.O.; Segun, P.A.; Adeniji, A.J. In vitro cytotoxic activity of medicinal plants from Nigeria ethnomedicine on Rhabdomyosarcoma cancer cell line and HPLC analysis of active extracts. BMC Complement. Altern. Med. 2017, 17, 494. [Google Scholar] [CrossRef]
  5. Maciel, M.; Pinto, A.C.; Veiga, J.R. Plantas medicinais: A necessidade de estudos multidisciplinares. Quím. Nova 2002, 25, 429–438. [Google Scholar] [CrossRef] [Green Version]
  6. Shitan, N. Secondary metabolites in plants: Transport and self-tolerance mechanisms. Biosci. Biotechnol. Biochem. 2016, 80, 1283–1293. [Google Scholar] [CrossRef] [Green Version]
  7. Rates, S.M.K. Plants as source of drugs. Toxicon 2001, 39, 603–613. [Google Scholar] [CrossRef]
  8. Ke, B.; Tian, M.; Li, J.; Liu, B.; He, G. Targeting Programmed Cell Death Using Small-Molecule Compounds to Improve Potential Cancer Therapy. Med. Res. Rev. 2016, 36, 983–1035. [Google Scholar] [CrossRef] [PubMed]
  9. Oren, O.; Smith, B.D. Eliminating Cancer Stem Cells by Targeting Embryonic Signaling Pathways. Stem Cell Rev. Rep. 2017, 13, 17–23. [Google Scholar] [CrossRef] [PubMed]
  10. Varoni, E.M.; Lo Faro, A.F.; Sharifi-Rad, J.; Iriti, M. Anticancer Molecular Mechanisms of Resveratrol. Front. Nutr. 2016, 3, 8. [Google Scholar] [CrossRef] [PubMed] [Green Version]
  11. Atanasov, A.G.; Waltenberger, B.; Pferschy-Wenzig, E.M.; Linder, T.; Wawrosch, C.; Uhrin, P.; Temml, V.; Wang, L.; Schwaiger, S.; Heiss, E.H.; et al. Discovery and resupply of pharmacologically active plant-derived natural products: A review. Biotechnol. Adv. 2015, 33, 1582–1614. [Google Scholar] [CrossRef] [PubMed] [Green Version]
  12. Dutta, S.; Sadhukhan, P.; Saha, S.; Sil, P.C. Regulation of oxidative stress by different naturally occurring polyphenolic compounds: An emerging anticancer therapeutic approach. ROS 2017, 3, 81–95. [Google Scholar] [CrossRef]
  13. Dutta, S.; Saha, S.; Mahalanobish, S.; Sadhukhan, P.; Sil, P.C. Melatonin attenuates arsenic induced nephropathy via the regulation of oxidative stress and inflammatory signaling cascades in mice. FCT 2018, 118, 303–316. [Google Scholar] [CrossRef] [PubMed]
  14. Endringer, D.C.; Valadares, Y.M.; Campana, P.R.V.; Campos, J.J.; Guimarães, K.G.; Pezzuto, J.M.; Braga, F.C. Evaluation of Brazilian Plants on Cancer Chemoprevention Targets in vitro. Phytother. Res. 2010, 24, 928–933. [Google Scholar] [CrossRef] [PubMed]
  15. Campana, P.R.; Coleman, C.M.; Sousa, L.P.; Teixeira, M.M.; Ferreira, D.; Braga, F.C. Mansoins C–F, Oligomeric Flavonoid Glucosides Isolated from Mansoa hirsuta Fruits with Potential Anti-inflammatory Activity. J. Nat. Prod. 2016, 79, 2279–2286. [Google Scholar] [CrossRef] [PubMed]
  16. Pereira, J.R.; Queiroz, R.F.; Siqueira, E.A.; Brasileiro-Vidal, A.C.; Sant’ana, A.E.G.; Silva, D.M. Evaluation of cytogenotoxicity, antioxidant and hypoglycemiant activities of isolate compounds from Mansoa hirsuta D.C. (Bignoniaceae). An. Acad. Bras. Cienc. 2017, 89, 317–331. [Google Scholar] [CrossRef] [PubMed] [Green Version]
  17. Alves, P.S.; Preet, G.; Dias, L.; Oliveira, M.; Silva, R.; Castro, I.; Silva, G.; Joaquim, J.; Lima, N.; Silva, D.H. The Free Radical Scavenging Property of the Leaves, Branches, and Roots of Mansoa hirsuta DC: In vitro assessment, 3d pharmacophore, and molecular docking study. Molecules 2022, 27, 6016. [Google Scholar] [CrossRef]
  18. Zoghbi, M.G.; Oliveira, J.; Skelding, G.M.; Guilhon, P. The genus Mansoa (Bignoniaceae): A source of organosulphur compounds. Rev. Bras. Farmacogn. 2009, 19, 795–804. [Google Scholar] [CrossRef] [Green Version]
  19. Lohmann, L.G. Untangling the phylogeny of neotropical lianas (Bignonieae, Bignoniaceae). Am. J. Bot. 2006, 93, 304–318. [Google Scholar] [CrossRef]
  20. Lohmann, L.G.; Taylor, C.M. A new generic classification for tribe Bignonieae (Bignoniaceae). Ann. Mo. Bot. Gard. 2014, 99, 348–489. [Google Scholar] [CrossRef]
  21. Padhy, G.K. Spathodea campanulata P. Beauv. A review of its ethnomedicinal, phytochemical, and pharmacological profile. J. Appl. Pharm. Sci. 2021, 11, 017–044. [Google Scholar] [CrossRef]
  22. Queiroz, M.M.F. Identificação dos Inibidores de Acetilcolinesterase em Tetrapterys mucronata Cav. (Malpighiaceae) e Comparação Quali e Quantitativa dos Derivados Triptamícos Presentes na Espécie em Estudo e Ayahuasca. Ph.D. Thesis, Universidade Estadual Paulista, São Paulo, Brazil, 2013. [Google Scholar]
  23. Meyer, B.N.; Ferrigni, N.R.; Putnam, J.E.; Jacobsen, L.B.; Nichols, D.E.; McLaughlin, J.L. Brine shrimp: A convenient general bioassay for active plant constituents. Planta Med. 1982, 45, 31–34. [Google Scholar] [CrossRef] [PubMed]
  24. Rosa, R.M.; Melecchi, M.I.; Halmenschlager, R.; Abad, F.C.; Simoni, C.R.; Caramão, E.B.; Henriques, J.A.; Saffi, J.; de Paula Ramos, A.L. Antioxidant and antimutagenic properties of Hibiscus tiliaceus L. methanolic extract. J. Agric. Food Chem. 2006, 54, 7324–7330. [Google Scholar] [CrossRef] [PubMed]
  25. Mosmann, T. Rapid colorimetric assay for cellular growth and survival: Application to proliferation and cytotoxicity assays. J. Immunol. Methods 1983, 65, 55–63. [Google Scholar] [CrossRef]
  26. Trott, O.; Olson, A.J. AutoDock Vina: Improving the speed and accuracy of docking with a new scoring function, efficient optimization and multithreading. J. Comput. Chem. 2010, 31, 455–461. [Google Scholar] [CrossRef] [PubMed] [Green Version]
  27. Wolber, G.; Thierry, L. LigandScout: 3-D pharmacophores derived from protein-bound ligands and their use as virtual screening filters. J. Chem. Inf. Model. 2005, 45, 160–169. [Google Scholar] [CrossRef] [PubMed]
  28. Sendovski, M.; Kanteev, M.; Ben-Yosef, V.S.; Adir, N.; Fishman, A. First structures of an active bacterial tyrosinase reveal copper plasticity. J. Mol. Biol. 2011, 405, 227–237. [Google Scholar] [CrossRef]
  29. Declercq, J.P.; Evrard, C.; Clippe, A.; Stricht, D.V.; Bernard, A.; Knoops, B. Crystal structure of human peroxiredoxin 5, a novel type of mammalian peroxiredoxin at 1.5 A resolution. J. Mol. Biol. 2001, 311, 751–759. [Google Scholar] [CrossRef] [Green Version]
  30. Strange, R.W.; Antonyuk, S.V.; Hough, M.A.; Doucette, P.A.; Valentine, J.S.; Hasnain, S.S. Variable metallation of human superoxide dismutase: Atomic resolution crystal structures of Cu-Zn, Zn-Zn and as-isolated wild-type enzymes. J. Mol. Biol. 2006, 356, 1152–1162. [Google Scholar] [CrossRef]
  31. Pettersen, E.F.; Goddard, T.D.; Huang, C.C.; Couch, G.S.; Greenblatt, D.M.; Meng, E.C.; Ferrin, T.E. UCSF Chimera- a visualization system for exploratory research and analysis. J. Comput. Chem. 2004, 25, 1605–1612. [Google Scholar] [CrossRef] [Green Version]
  32. Laskowski, R.A.; Swindells, M.B. LigPlot+: Multiple ligand-protein interaction diagrams for drug discovery. J. Chem. Inf. Model. 2011, 51, 2778–2786. [Google Scholar] [CrossRef] [PubMed]
  33. SAMSON: Software for Adaptive Modeling and Simulation Of Nanosystems. Available online: https://www.samson-connect.net (accessed on 22 January 2023).
  34. Simões, C.M.O.; Schenkel, E.P.; De Mello, J.C.P.; Mentz, L.A.; Petrovick, P.S. Farmacognosia: Do Produto Natural ao Medicamento; Artmed Editora: Porto Alegre, Brazil, 2016. [Google Scholar]
  35. Shao, S.Y.; Ting, Y.; Wang, J.; Sun, J.; Guo, X.F. Characterization and identification of the major flavonoids in Phyllostachys edulis leaf extract by UPLC–QTOF–MS/MS. Acta Chromatogr. 2020, 32, 228–237. [Google Scholar] [CrossRef]
  36. Chen, Q.; Zhang, Y.; Zhang, W.; Chen, Z. Identification and quantification of oleanolic acid and ursolic acid in Chinese herbs by liquid chromatography–ion trap mass spectrometry. Biomed. Chromatogr. 2011, 25, 1381–1388. [Google Scholar] [CrossRef] [PubMed]
  37. Dapic, I.; Jakasa, I.; Kobetic, R.; Brkljacic, L. Characterization of Ceramides with Phytosphingosine Backbone by Hydrogen-deuterium Exchange Mass Spectrometry. Croat. Chem. Acta 2019, 92, 411–417. [Google Scholar] [CrossRef]
  38. Munikishore, R.; Padmaja, A.; Gunasekar, D.; Blond, A.; Bodo, B. Two new flavonoids from Ageratum conyzoides. Indian J. Chem. Sect. B 2013, 52, 1479–1482. [Google Scholar] [CrossRef]
  39. Ramamurthy, V.; Rajeswari, D.M.; Gowri, R.; Vadivazhagi, M.; Jayanthi, G.; Raveendran, S. Study of the phytochemical analysis and antimicrobial activity of Dodonaea viscosa. J. Pure Appl. Zool. 2013, 1, 178–184. [Google Scholar]
  40. Rand, G.M. Fundamentals of Aquatic Toxicology: Effects, Environmental Fate and Risk Assessment, 2nd ed.; Taylor & Francis: Washington, DC, USA, 1995; cap. 1. [Google Scholar]
  41. Fonseca, A.L. A Biologia das Espécies Daphnia laevis, Ceriodaphnia dubi Silvestris (Crustacea, Cladocera) e Poecilia reticulata (Piscis, Poeciledae) e o Comportamento Destes em Testes de Toxicidade Aquática com Efluente Industriais. Dissertação de Mestrado em Hidráulica e Saneamento, USP São Carlos, São Carlos, Brazil, 1991. [Google Scholar]
  42. Queiroz, S. Tratado de Toxicologia Ocupacional, 2nd ed.; Biblioteca 24 Horas: Rio de Janeiro, Brazil, 2015; p. 554. [Google Scholar]
  43. Olowa, L.F.; Nuñeza, O.M. Brine shrimp lethality assay of the ethanolic extracts of three selected species of medicinal plants from Iligan City Philippines. Int. J. Biol. Sci. 2013, 2, 74–77. [Google Scholar]
  44. Clarkson, C.; Maharaj, V.J.; Crouch, N.R.; Grace, O.M.; Pillay, P.; Matsabisa, M.G.; Bhagwandin, N.; Smith, P.J.; Folb, P.I. In vitro antiplasmodial activity of medicinal plants native to ornaturalized in South Africa. J. Ethnopharmacol. 2004, 92, 177–191. [Google Scholar] [CrossRef]
  45. Chakraborty, A.K.; Rambhade, S.; Patil, U.K. Chromolaena odorata (L.): An overview. J. Pharm. Res. 2011, 4, 573–576. [Google Scholar]
  46. Moshi, M.J.; Cosam, J.C.; Mbwambo, Z.H.; Kapingu, M.; Nkunya, M.H.H. Testing Beyond Ethnomedical Claims: Brine Shrimp Lethality of Some Tanzanian Plants. Pharm. Biol. 2004, 42, 547–551. [Google Scholar] [CrossRef]
  47. Moshi, M.J.; Mbwambo, Z.H.; Nondo, R.S.O.; Masimba, P.J.; Kamuhabwa, A.; Kapingu, M.C.; Thomas, P.; Richard, M. Evaluation of ethnomedical claims and brine shrimp toxicity of some plants used in Tanzania as traditional medicines. AJTCAM 2006, 3, 48–58. [Google Scholar]
  48. Mascarenhas, C.; Edwards-Ingram, L.C.; Zeef, L.; Shenton, D.; Ashe, M.P.; Grant, C.M. Gcn4 is required for the response to peroxide stress in the yeast Saccharomyces cerevisiae. Mol. Biol. Cell 2008, 19, 2995–3007. [Google Scholar] [CrossRef] [PubMed] [Green Version]
  49. Oliveira, A.S.; Ferreira, C.; Pereira, J.O.; Pintado, M.E.; Carvalho, A.P. Spent brewer’s yeast (Saccharomyces cerevisiae) as a potential source of bioactive peptides: An overview. Int. J. Biol. Macromol. 2022, 208, 1116–1126. [Google Scholar] [CrossRef] [PubMed]
  50. Nemudzivhadi, V.; Masoko, P. In vitro assessment of cytotoxicity, antioxidant, and anti-inflammatory activities of Ricinus communis (Euphorbiaceae) leaf extracts. Evid.-Based Complement. Altern. Med. 2014, 2014, 625961. [Google Scholar] [CrossRef] [PubMed] [Green Version]
  51. Campana, P.R.; Braga, F.C.; Cortes, S.F. Endothelium-dependent vasorelaxation in rat thoracic aorta by Mansoa hirsuta D.C. Phytomedicine 2009, 16, 456–461. [Google Scholar] [CrossRef]
  52. Stoclet, J.C.; Chataigneau, T.; Ndiaye, M.; Oak, M.; Bedoui, J.; Chataigneau, M.; Schini-Kerth, V.B. Vascular protection by dietary polyphenols. Eur. J. Pharmacol. 2004, 500, 299–313. [Google Scholar] [CrossRef]
  53. Abotaleb, M.; Liskova, A.; Kubatka, P.; Büsselberg, D. Therapeutic Potential of Plant Phenolic Acids in the Treatment of Cancer. Biomolecules 2020, 10, 221. [Google Scholar] [CrossRef] [Green Version]
  54. Yanez, J.; Vicente, V.; Alcaraz, M.; Castillo, J.; Benavente-García, O.; Canteras, M.; Teruel, J.A. Cytotoxicity and antiproliferative activities of several phenolic compounds against three melanocytes cell lines: Relationship between structure and activity. Nutr. Cancer 2004, 49, 191–199. [Google Scholar] [CrossRef]
  55. Onyancha, J.M.; Gikonyo, N.K.; Wachira, S.W.; Mwitari, P.G.; Gicheru, M.M. Anticancer activities and safety evaluation of selected Kenyan plant extracts against breast cancer cell lines. J. Pharmacogn. Phytother. 2018, 10, 21–26. [Google Scholar] [CrossRef] [Green Version]
  56. Badisa, R.B.; Darling-Reed, S.F.; Joseph, P.; Cooperwood, J.S.; Latinwo, L.M.; Goodman, C.B. Selective cytotoxic activities of two novel synthetic drugs on human breast carcinoma MCF-7 cells. Anticancer Res. 2009, 29, 2993–2996. [Google Scholar]
  57. Seo, S.Y.; Kim, Y.J.; Kim, J.; Nam, M.H.; Park, K.Y. Phytosphingosine induces systemic acquired resistance through activation of sphingosine kinase. Plant Direct 2021, 5, e351. [Google Scholar] [CrossRef] [PubMed]
  58. Lee, W.J.; Bang, S.; Chung, B.Y.; Jung, H.; Oh, E.S.; Chang, S.E. Inhibitory effects of N,N,N-trimethyl phytosphingosine-iodide on melanogenesis via ERK activation-mediated MITF degradation. Biosci. Biotechnol. Biochem. 2016, 80, 121–127. [Google Scholar] [CrossRef] [PubMed]
  59. Lee, S.B.; Ho, J.N.; Yoon, S.H.; Yang, G.Y.; Hwang, S.G.; Um, H.D. Peroxiredoxin 6 promotes lung cancer cell invasion by inducing urokinase-type plasminogen activator via p38 kinase, phosphoinositide 3-kinase, and Akt. Mol. Cells 2009, 28, 583–588. [Google Scholar] [CrossRef]
  60. Miyamoto, N.; Izumi, H.; Miyamoto, R.; Kondo, H.; Tawara, A.; Sasaguri, Y.; Kohno, K. Quercetin induces the expression of peroxiredoxins 3 and 5 via the Nrf2/NRF1 transcription pathway. Investig. Ophthalmol. Vis. Sci. 2011, 52, 1055–1063. [Google Scholar] [CrossRef] [PubMed] [Green Version]
Figure 1. Mortality percentage of A. salina larvae in the incubation time of 24 h and 48 h exposed to concentrations of extracts and fractions of Mansoa hirsuta. Results were expressed as the mean ± standard deviation, using the non-parametric Kruskal–Wallis post-Student-Newman-Keuls test. Significance values for ** (p < 0.01) and * (p < 0.05) when compared to NC (distilled water). NC: Negative Control (Artificial saline water). PC: Positive Control (K2Cr2O7—Potassium dichromate). EMFMh methanolic extract of M. hirsuta leaves. EMGMh methanolic extract of M. hirsuta branches. C. EMRMh methanolic extract of M. hirsuta roots. FCFMh chloroform fraction of M. hirsuta leaves. FCGMh chloroform fraction of M. hirsuta branches. FCRMh chloroform fraction of M. hirsuta roots.
Biophysica 03 00028 g001
Figure 2. Binding site (box) of human peroxiredoxin 5 (a); binding site (box) of superoxide dismutase (SOD1) (b). Binding site (box) of tyrosinase from Bacillus megaterium (c).
Biophysica 03 00028 g002
Figure 3. LIGPLOTs showing interacting residues of Human Peroxiredoxin 5 with isoorientin-2″-O-arabinoside (a) and phytosphingosine (b). Red arrow dotted lines, HBAs; green arrow dotted lines, HBDs; yellow lines, H interactions.
Biophysica 03 00028 g003
Figure 4. LIGPLOTs showing interacting residues of Human Superoxide Dismutase with isoorientin-2″-O-arabinoside (a) and phytosphingosine (b). Red arrow dotted lines, HBAs; green arrow dotted lines, HBDs; yellow lines, H interactions; purple arrow dotted lines, Ar.
Biophysica 03 00028 g004
Figure 5. LIGPLOTs showing interacting residues of Bacterial Tyrosinase with isoorientin-2″-O-arabinoside (a) and phytosphingosine (b). Red arrow dotted lines, HBAs; green arrow dotted lines, HBDs; yellow lines, H interactions; purple arrow dotted lines, Ar.
Biophysica 03 00028 g005
Figure 6. Three-dimensional and two-dimensional representations of pharmacophoric features of isoorientin-2″-O-arabinoside used in three-dimensional pharmacophore generation. Red, HBAs; green, HBDs; yellow, H; purple, Ar.
Biophysica 03 00028 g006
Table 1. S. cerevisiae strains and genotypes used in this study.
DescriptionGenotypeDeficiency in
Enzymatic Defenses
Origin
EG103
(SODWT)
MATa leu2-3.112 trp1-289 ura3-52NoneEdith Gralla, Los Angeles
EG118 (Sod1∆)Sod 1:: URA3 all other markers such as EG103Cu-Zn superoxide dismutase (cytoplasmic)Edith Gralla, Los Angeles
EG110 (Sod2∆)Sod 2:: TRP1 all other markers such as EG103Mn superoxide dismutase (mitochondrial)Edith Gralla, Los Angeles
EG133
(Sod1∆Sod2∆)
Sod 1:: URA3 Sod2::TRP1 double mutant all other markers as EG103Cytoplasmic and mitochondrial superoxide dismutaseEdith Gralla, Los Angeles
EG223 (Cat1∆)EG103, except Cat 1:: TRP1cytoplasmic catalaseEdith Gralla, Los Angeles
EG (Sod1∆Cat1∆)EG103, except Sod1::URA3 and Cat1::TRP1Cu-Zn superoxide dismutase and cytoplasmic catalaseEdith Gralla, Los Angeles
Table 2. Analysis of the fractions of leaves, branches, and roots of M. hirsuta by LC–MS in the positive ion mode.
FractionsRt (Min)Ionization ModeFragments
(Relative
Abundance (R %)
CompoundReferences
FCFMh2.0Positivem/z 285 (1.32%), m/z 309 (1.10%), m/z 339 (4.73%)Isoorientin-2″-O -arabinoside[35]
FCGMh2.0Positivem/z 429 (0.18%), m/z 447 (2.95%), m/z 459 (0.77%)Isoorientin-2″-O -arabinoside[35]
FCRMh2.0Positivem/z 429 (5.5%), m/z 447 (11.64%), m/z 459 (1.49%)Isoorientin-2″-O -arabinoside[35]
FCFMh2.2Positivem/z 393 (3.84%) and m/z 411 (5.83%)Oleanolic acid and ursolic acid[36]
FCGMh2.2Positivem/z 393 (2.95%), m/z 411 (3.35%) and m/z 457 (4.21%)Oleanolic acid and ursolic acid[36]
FCRMh2.3Positivem/z 393 (0.22%) and m/z 411 (0.36%)Oleanolic acid and ursolic acid[36]
FCFMh5.1Positivem/z 300 (5.55%) and m/z 318 (100%)Phytosphingosine[37]
FCGMh5.1Positivem/z 300 (19.93%) and m/z 318 (100%)Phytosphingosine[37]
FCRMh5.1Positivem/z 300 (5.43%) and m/z 318 (100%)Phytosphingosine[37]
FCFMh: chloroform fraction of M. hirsuta leaves; FCGMh: chloroform fraction of M. hirsuta branches; FCRMh: chloroform fraction of M. hirsuta roots; Rt: retention times.
Table 3. Toxicity against Artemia salina Leach of the methanolic extracts, chloroform fractions of the leaves, branches and roots of M. hirsuta.
SamplesLC50 (µg·mL−1) LC50 (µg·mL−1)
24 h48 h
EMFMh355.7339.9
EMGMh316.589.26
EMRMh287.383.92
FCFMh479.0421.9
FCGMh421.464.21
FCRMh142.987.61
LC50 Mean lethal concentration in µg·mL−1. LC50 values obtained from a minimum of three experiments performed in triplicate are shown (95% confidence limits). EMFMh methanolic extract of M. hirsuta leaves. EMGMh methanolic extract of M. hirsuta branches. EMRMh methanolic extract of M. hirsuta roots. FCFMh chloroform fraction of M. hirsuta leaves. FCGMh chloroform fraction of M. hirsuta branches. FCRMh chloroform fraction of M. hirsuta roots.
Table 4. Pre-treatment of S. cerevisiae strains on the chloroform fractions of leaves, branches and roots of M. hirsuta.
GroupsSodWTSod1∆Sod2∆Sod1∆Sod2∆Cat1∆Sod1∆Cat1∆
NC0.50 ± 0.710.50 ± 0.610.37 ± 0.390.41 ± 0.450.52 ± 0.490.50 ± 0.55
PC18.25 ± 0.70 a20.25 ± 2.16 a 19.25 ± 0.55 a 23.00 ± 0.39 a 21.75 ± 0.55 a 24.25 ± 0.34 a
FCFMh µg mL−1
500.75 ± 0.30 b 1.66 ± 0.58 b1.00 ± 0.60 b2.33 ± 0.61 b0.71 ± 0.59 b 1.33 ± 0.34 b
25010.50 ± 0.4 ab 6.66 ± 0.62 ab7.33 ± 0.55 ab9.00 ± 0.42 ab7.50 ± 0.42 ab7.00 ± 0.37 ab
50012.33 ± 0.60 ab12.00 ± 0.63 ab12.00 ± 0.60 ab12.00 ± 0.40 ab 11.50 ± 0.40 ab 11.50 ± 0.30 ab
FCGMh µg mL−1
500.50 ± 0.52 b2.66 ± 0.9 b 0.75 ± 0.25 b 2.75 ± 0.63 b 0.75 ± 0.55 b 1.25 ± 0.33 b
2507.00 ± 0.95 ab 7.33 ± 0.92 ab 7.33 ± 0.73 ab 7.66 ± 0.68 ab 6.66 ± 0.58 ab 7.00 ± 0.36 ab
5009.75 ± 0.88 ab 9.75 ± 0.85 ab 13.00 ± 0.70 ab 11.25 ± 0.55 ab 9.25 ± 0.51 ab 11.33 ± 0.35 ab
FCRMh µg mL−1
501.50 ± 0.83 b 2.25 ± 0.75 b 1.50 ± 0.54 b 2.00 ± 0.48 b 1.66 ± 0.67 b 1.25 ± 0.34 b
2507.00 ± 0.95 ab 5.33 ± 0.82 ab 7.33 ± 0.59 ab 7.66 ± 0.52 ab 7.25 ± 0.62 ab 7.00 ± 0.36 ab
5009.75 ± 0.88 ab 9.00 ± 0.76 ab 10.00 ± 0.54 ab 10.50 ± 0.44 ab 8.00 ± 0.52 ab 10.50 ± 0.32 ab
FCFMh: chloroform fraction of M. hirsuta leaves; FCGMh: chloroform fraction of M. hirsuta branches; FCRMh: chloroform fraction of M. hirsuta roots; PC: H2O2—10 mM. Test concentrations (µg mL−1). NC: saline solution (negative control); PC: hydrogen peroxide (stressor). Values in mean ± standard deviation of inhibition halos (0–40 mm). ANOVA (multiple comparisons), Bonferroni post-test. Significance values for a (p < 0.0001) when compared to NC (saline); significance values for b (p < 0.0001) when compared to PC (stressor, hydrogen peroxide).
Table 5. Co-treatment in S. cerevisiae strains on the chloroform fractions of leaves, branches and roots of M. hirsuta.
GroupsSodWTSod1∆Sod2∆Sod1∆Sod2∆Cat1∆Sod1∆Cat1∆
NC0.50 ± 0.570.50 ± 0.570.50 ± 0.570.50 ± 0.570.50 ± 0.570.50 ± 0.57
PC18.75 ± 0.65 b21.25 ± 0.63 b 19.25 ± 0.58 b 23.00 ± 0.71 b 21.75 ± 0.64 b 24.25 ± 0.34 b
FCFMh µg mL−1
502.00 ± 0.71 b4.00 ± 0.60 ab1.33 ± 0.62 b4.00 ± 0.77 ab3.00 ± 0.64 ab 4.33 ± 0.37 ab
2504.33 ± 0.71 ab4.66 ± 0.68 ab4.00 ± 0.63 ab4.33 ± 0.77 ab4.00 ± 0.64 ab5.00 ± 0.37 ab
50012.00 ± 0.70 ab14.50 ± 0.63 ab14.33 ± 0.60 ab14.33 ± 0.70 ab11.50 ± 0.64 ab12.50 ± 0.34 ab
FCGMh µg mL−1
500.66 ± 0.16 b4.00 ± 0.51 ab2.67 ± 0.98 b2.00 ± 0.83 b2.33 ± 0.59 b2.33 ± 0.41 b
2503.00 ± 0.66 ab4.00 ± 0.56 ab4.66 ± 0.93 ab4.75 ± 0.77 ab4.33 ± 0.58 ab5.33 ± 0.40 ab
50010.00 ± 0.60 ab 9.50 ± 0.54 ab10.00 ± 0.80 ab -8.00 ± 0.84 ab8.50 ± 0.54 ab8.50 ± 0.38 ab
FCRMh µg mL−1
501.50 ± 0.77 b4.00 ± 0.57 ab 5.66 ± 1.10 ab 3.33 ± 0.82 b 1.25 ± 0.68 b 2.75 ± 0.48 b
2503.00 ± 0.83 b5.33 ± 0.62 ab 6.00 ± 1.02 ab 3.50 ± 0.76 b 3.00 ± 0.73 b 4.66 ± 0.53 ab
50013.00 ± 0.78 ab 9.00 ± 0.58 ab 10.00 ± 0.90 ab 9.66 ± 0.81 ab 10.00 ± 0.68 ab 11.00 ± 0.49 ab
FCFMh: chloroform fraction of M. hirsuta leaves; FCGMh: chloroform fraction of M. hirsuta branches; FCRMh: chloroform fraction of M. hirsuta roots; PC: H2O2—10 mM. Test concentrations (µg mL−1). NC: saline solution (negative control); PC: hydrogen peroxide (stressor). Values in mean ± standard deviation of inhibition halos (0–40 mm). ANOVA (multiple comparisons), Bonferroni post-test. Significance values for a (p < 0.0001) when compared to NC (saline); significance values for b (p < 0.0001) when compared to PC (stressor, hydrogen peroxide).
Table 6. Post-treatment in S. cerevisiae strains on the chloroform fractions of leaves, branches and roots of M. hirsuta.
GroupsSodWTSod1∆Sod2∆Sod1∆Sod2∆Cat1∆Sod1∆Cat1∆
NC0.50 ± 0.580.50 ± 0.580.50 ± 0.580.50 ± 0.580.50 ± 0.580.50 ± 0.58
PC18.75 ± 0.63 b 21.25 ± 0.48 b 19.25 ± 0.50 b 23.00 ± 0.45 b 21.00 ± 0.50 b 23.00 ± 0.37 b
FCFMh µg mL−1
500.50 ± 0.68 b 1.00 ± 0.52 b 1.00 ± 0.55 b 1.66 ± 0.49 b 0.50 ± 0.49 b 1.33 ± 0.40 b
2506.00 ± 0.68 ab 4.75 ± 0.48 ab 6.00 ± 0.50 ab 4.33 ± 0.45 ab 6.00 ± 0.54 ab 3.33 ± 0.37 ab
50011.75 ± 0.63 ab 12.33 ± 0.50 ab 12.00 ± 0.55 ab 11.67 ± 0.36 ab 12.25 ± 0.50 ab 12.25 ± 0.34 ab
FCGMh µg mL−1
500.50 ± 0.69 b 1.33 ± 0.76 b 0.75 ± 0.25 b 1.50 ± 0.68 b 0.75 ± 0.62 b 1.25 ± 0.00 b
2500.50 ± 0.62 b 2.00 ± 0.79 b 2.00 ± 0.65 b 4.00 ± 0.73 ab 0.75 ± 0.64 b 1.66 ± 0.40 b
50011.75 ± 0.74 ab 13.75 ± 0.73 ab 13.67 ± 0.71 ab 12.50 ± 0.66 ab 12.75 ± 0.63 ab 11.25 ± 0.37 ab
FCRMh µg mL−1
501.66 ± 0.68 b1.50 ± 0.51 b 1.75 ± 0.50 b 2.50 ± 0.51 b 1.50 ± 0.56 b 2.75 ± 0.47 b
2504.00 ± 0.63 ab 6.66 ± 0.55 ab 6.00 ± 0.48 ab 6.66 ± 0.55 ab 5.00 ± 0.56 ab 4.66 ± 0.53 ab
50010.50 ± 0.60 ab 11.50 ± 0.53 ab 11.00 ± 0.52 ab 11.75 ± 0.59 ab 10.75 ± 0.58 ab 11.00 ± 0.49 ab
FCFMh: chloroform fraction of M. hirsuta leaves; FCGMh: chloroform fraction of M. hirsuta branches; FCRMh: chloroform fraction of M. hirsuta roots; PC: H2O2—10 mM. Test concentrations (µg mL−1). NC: saline solution (negative control); PC: hydrogen peroxide (stressor). Values in mean ± standard deviation of inhibition halos (0–40 mm). ANOVA (multiple comparisons), Bonferroni post-test. Significance values for a (p < 0.0001) when compared to NC (saline); significance values for b (p < 0.0001) when compared to PC (stressor, hydrogen peroxide).
Table 7. Treatment of S. cerevisiae strains on the chloroform fractions of leaves, branches and roots of M. hirsuta.
GroupsSodWTSod1∆Sod2∆Sod1∆Sod2∆Cat1∆Sod1∆Cat1∆
NC0.50 ± 0.580.50 ± 0.580.50 ± 0.580.50 ± 0.580.50 ± 0.580.50 ± 0.58
PC18.75 ± 0.72 a21.25 ± 0.71 a19.25 ± 0.58 a23.00 ± 0.44 a21.75 ± 0.41 a24.25 ± 0.44 a
FCFMh µg mL−1
500.50 ± 0.72 1.25 ± 0.73 b4.00 ± 0.62 ab1.50 ± 0.44 b1.66 ± 0.44 b2.50 ± 0.44 b
2501.00 ± 0.78 b4.33 ± 0.80 ab4.66 ± 0.63 ab1.50 ± 0.40 b2.00 ± 0.45 b5.00 ± 0.47 ab
5009.50 ± 0.70 ab8.00 ± 0.79 ab9.66 ± 0.62 ab8.50 ± 0.45 ab9.00 ± 0.45 ab9.50 ± 0.44 ab
FCGMh µg mL−1
500.50 ± 0.96 b1.25 ± 1.26 b1.50 ± 1.15 b2.66 ± 0.85 b2.75 ± 0.64 b3.00 ± 0.89 b
2501.25 ± 0.96 b3.75 ± 1.06 ab5.66 ± 1.24 ab3.66 ± 0.85 ab3.33 ± 0.69 ab4.00 ± 0.96 ab
50015.67 ± 1.04 ab11.00 ± 1.10 ab10.00 ± 1.16 ab9.66 ± 0.84 ab11.75 ± 0.63 ab13.75 ± 0.89 ab
FCRMh µg mL−1
501.25 ± 0.66 b1.75 ± 0.56 b2.25 ± 0.54 b0.33 ± 0.44 b0.50 ± 0.49 b1.75 ± 0.38 b
2502.25 ± 0.63 b4.00 ± 0.52 ab6.33 ± 0.58 ab3.50 ± 0.40 ab3.75 ± 0.43 ab4.00 ± 0.44 ab
50012.00 ± 0.80 ab15.00 ± 0.50 ab12.00 ± 0.54 ab10.00 ± 0.39 ab10.00 ± 0.48 ab12.00 ± 0.45 ab
FCFMh: chloroform fraction of M. hirsuta leaves; FCGMh: chloroform fraction of M. hirsuta branches; FCRMh: chloroform fraction of M. hirsuta roots; PC: H2O2—10 mM. Test concentrations (µg mL−1). NC: saline solution (negative control); PC: hydrogen peroxide (stressor). Values in mean ± standard deviation of inhibition halos (0–40 mm). ANOVA (multiple comparisons), Bonferroni post-test. Significance values for a (p < 0.0001) when compared to NC (saline); significance values for b (p < 0.0001) when compared to PC (stressor, hydrogen peroxide).
Table 8. Cytotoxicity (MTT) against breast cancer tumor line 4T1 and lineage L929 from the chloroform fractions of leaves, branches and roots of M. hirsuta.
Samples IC50 (μg mL−1)Range IC50 (μg mL−1)
4T1 aL929 b
FCFMh33.13
6.003–82.9
45.05
31.40–64.64
FCGMh47.13
2.329–953.8
47.82
34.45–68.06
FCRMh16.48
10.64–25.52
33.74
23.65–48.15
FCFMh: chloroform fraction of M. hirsuta leaves; FCGMh: chloroform fraction of M. hirsuta branches; FCRMh: chloroform fraction of M. hirsuta roots; IC50: average inhibitory concentration capable of causing 50% of the maximum effect; range IC50: confidence interval of 95%; 4T1 a: tumor lineage (breast cancer); L929 b: non-tumor lineage (murine fibroblast).
Table 9. Docking analysis on three different protein receptors with respect to the standard.
CompoundsDocking Score kcalmol−1Docking Score kcalmol−1Docking Score kcalmol−1
PDB ID: 1HD2
(Human
Peroxiredoxin 5)
PDB ID: 2C9V
(Human
Superoxide
Dismutase)
PDB ID: 3NM8
(Bacterial
Tyrosinase)
H2O2 (Standard)−2.8−2.6−2.4
Isoorientin-2″-O-arabinoside−5.0−8.2−8.2
Phytosphingosine−4.0−4.7−5.0
Disclaimer/Publisher’s Note: The statements, opinions and data contained in all publications are solely those of the individual author(s) and contributor(s) and not of MDPI and/or the editor(s). MDPI and/or the editor(s) disclaim responsibility for any injury to people or property resulting from any ideas, methods, instructions or products referred to in the content.

