1. Introduction
The misfolding and aberrant aggregation of proteins and peptides into amyloid aggregates have been associated with more than 50 human disorders, including the most common neurodegenerative diseases Alzheimer’s and Parkinson’s, as well as type 2 diabetes [
1]. These aggregates share a common β-sheet rich conformation, referred to as a cross-β structure, independently of the sequence and topology of the monomeric protein precursor [
2,
3]. In this characteristic structure, the monomeric units are stacked one on top of the other, with their β-strands disposed perpendicularly to the elongating axis, generating the typical fibrillar morphology. The β-strands interact laterally and vertically primarily through hydrogen bonds with characteristic regular distances of 10–12 Å and 4.7–4.8 Å, respectively, as visualised in X-ray diffraction experiments [
4]. The remarkable stability of these aggregates originates from the intricate hydrogen bonding network and the van der Waals interactions between the complementary, typically dry, interfaces of adjacent β-sheets [
5]. The cross-β structure has a high affinity for different dyes such as Congo Red and thioflavin T (ThT) [
6], which have been extensively used to identify amyloid aggregates both in vitro and in vivo. Given that the main stabilising interactions of this particular structure correspond to hydrogen bonds between main chain atoms, it has been suggested to be an inherent structure of the polypeptide chains [
7]. Nature has used this structure to fulfil certain physiological functions [
8,
9]. These functional amyloid aggregates, despite sharing the same structural topology, are non-toxic to the cells, in contrast to those of the pathological amyloidogenic proteins. The lack of toxicity of the amyloid process in the functional amyloids has been associated with two main factors: fast and optimised kinetics of fibril formation, with remarkable short half-lives of intermediate oligomeric species, and sophisticated cellular regulatory mechanisms that specifically control the spatio-temporal formation and disassembly of the aggregates [
10].
The fibrillation process is based on a nucleation-dependent polymerisation mechanism, where protein monomers self-assemble first in different sized oligomers with increasing β-sheet structure [
11]. Once a significant number of aggregates acquire the cross-β structure and their elongation rates become faster than their disaggregation rates, there is an exponential growth both in size and number of aggregates until most of the monomeric protein is consumed in the assembly reaction [
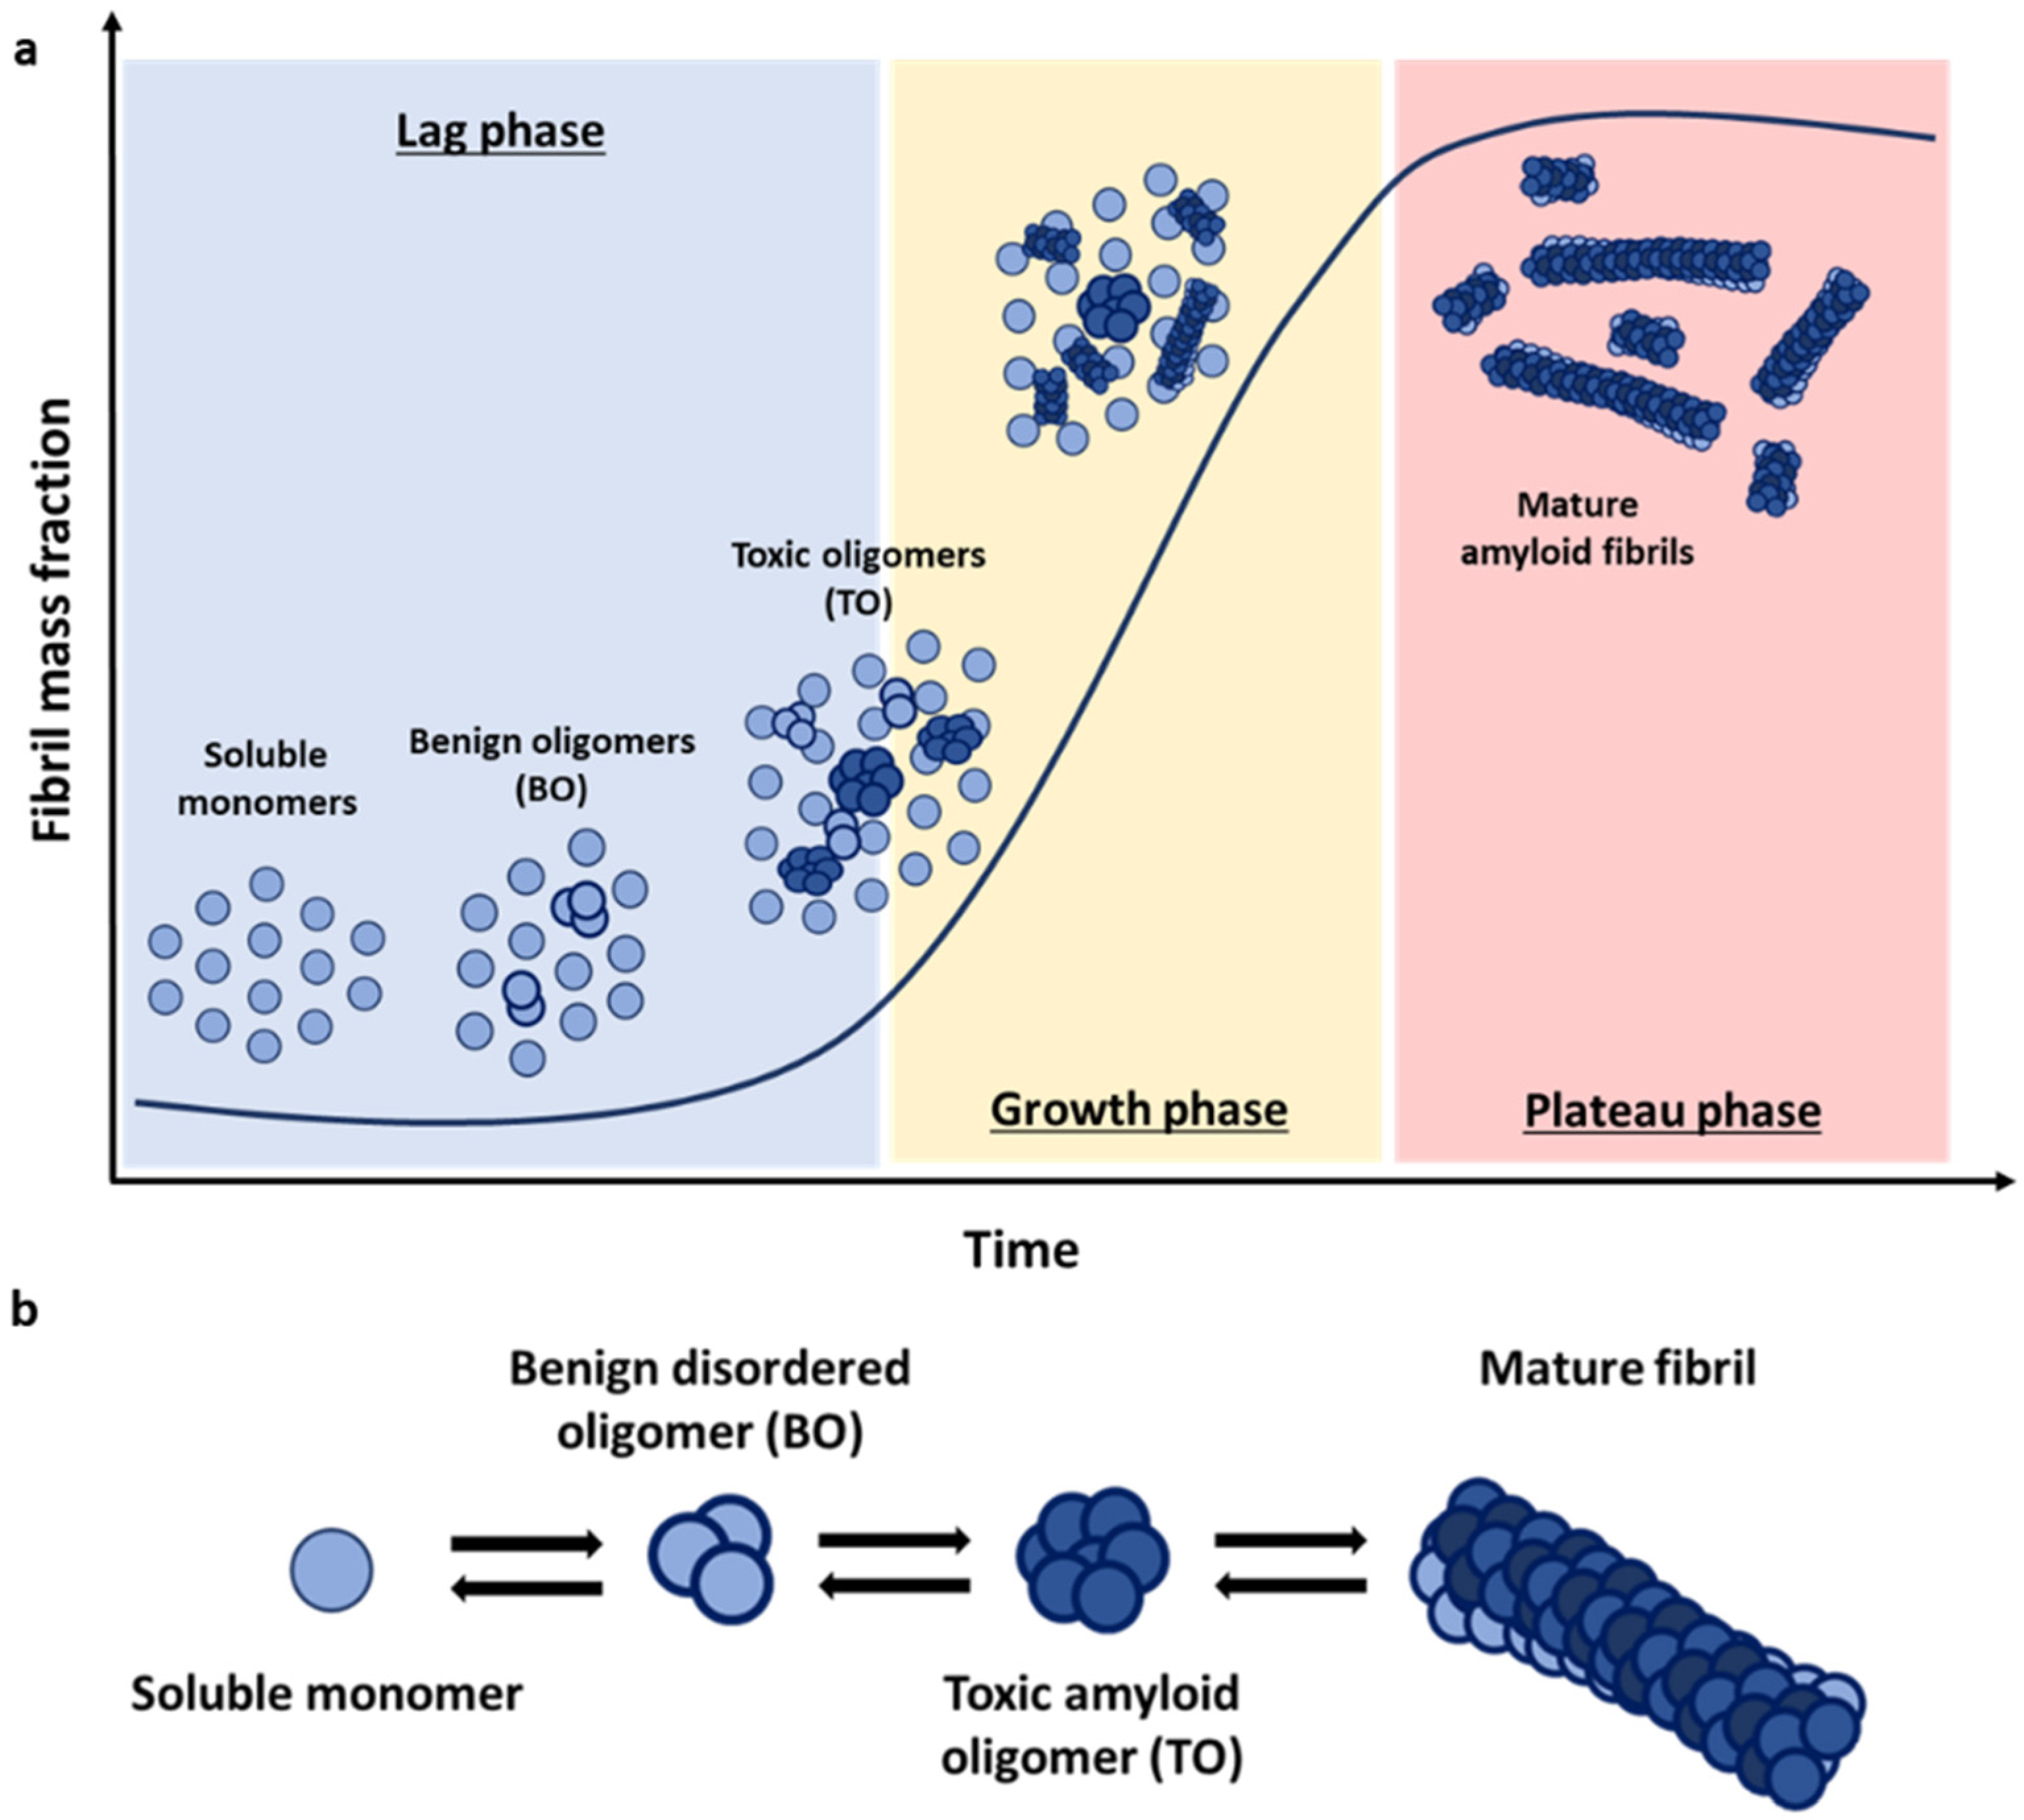
12]. The characteristic kinetics that result from this nucleation-polymerization mechanism adopt, thus, a sigmoidal growth profile, where the typical initial lag phase reflect the greater ease of addition of monomers onto existing stable aggregates compared with the de novo formation of new oligomers directly from monomers alone (
Figure 1a). Additional processes to those of primary nucleation and elongation, such as fibril fragmentation and fibril-based secondary nucleation, can sometimes govern the kinetic growth of amyloid aggregates under certain conditions, which add further elements of complexity to the system [
13,
14].
Three main types of species emerge during amyloid aggregation: monomers, soluble oligomers, and insoluble fibrillar species. Each of these pools of protein species encompasses an array of individual species, particularly in the case of soluble oligomers, which globally can show very high heterogeneity in terms of size and structure. Increasing experimental evidence points to oligomers as the main structural conformations responsible for the cytotoxic effect associated with the deposition of amyloid fibrils [
15,
16,
17,
18,
19,
20]. While both oligomers and fibrillar structures are thought to promote the spread of the aggregates to new brain regions contributing to the progression of the pathology [
21,
22], the mechanisms whereby the monomeric proteins rearrange to acquire the β-sheet conformation characteristic of mature fibrils is not fully understood, and several models have been proposed. In the case of α-synuclein (αS), the protein whose aggregation and deposition in the form of amyloid aggregates is related to Parkinson’s disease and other neurodegenerative disorders collectively referred to as synucleinopathies, there is strong experimental evidence pointing to a nucleation–conversion–polymerization model [
23,
24]. In this model, the acquisition of β-sheet structure occurs at the oligomer level once a certain number of protomers guarantees its stabilisation [
11,
23]. According to this model, oligomers can be classified into two distinct structural groups: oligomers that retain the structure of their monomeric precursors—in the case of αS, these oligomers are primarily disordered—and more compact oligomers with a partial β-sheet (
Figure 1b). Studies again on the αS system have shown that oligomers lacking persistent structure are sensitive to protease degradation and are benign to the cells (BO), while the partially formed β-sheet oligomers (TO) are more resistant against degradation and are toxic to neuronal cells by inducing lipid membrane disruption, oxidative stress, and calcium dysregulation [
23,
25,
26].
Significant structural diversity, commonly referred to as structural polymorphism, in the amyloid fibrillar species has been observed, which has been linked to the diversity of diseases associated with the aggregation of the same protein [
27]. The fibrillar fold acquired by αS in Lewy body pathology seems to be different from that of the patients suffering from multiple system atrophy or Parkinson’s disease [
28], suggesting a link between distinct αS fibrillar polymorphs and particular types of disease. A similar degree of structural polymorphism, likely also associated with distinct diseases, can be expected at the oligomeric level, as it is likely that the structural hallmarks of the fibril polymorphisms are imprinted at the early stages of self-assembly. However, the identification of oligomeric species generated during the fibrillation reaction and the structural and biological characterisation of such species has been proven extremely challenging.
Our understanding of the process of amyloid aggregation and its role in disease has been typically limited by the use of ensemble-based biochemical and biophysical techniques. In-bulk techniques, such as dynamic light scattering (DLS) or steady-state fluorescence using small, amyloid-binding probes such as ThT [
29,
30], have been crucial to monitor the onset of fibril formation [
31], and circular dichroism (CD), infrared spectroscopy, or X-ray fiber diffraction to identify the amyloid-like nature of the aggregates formed. The fibrillar nature of the final aggregates generated in the reaction is generally determined by microscopic techniques and in some cases their atomic structures have been resolved by solid-state nuclear magnetic resonance (NMR) spectroscopy [
32]. However, the study of the initially formed oligomeric species by in-bulk techniques is extremely difficult giventhe high heterogeneity of such species, both in terms of structure and size, their dynamic nature and typically high interconversion rates, and the fact that they are typically very low-populated and always overwhelmed by either the monomeric or the fibrillar forms at any point during the aggregation reaction. Single-particle techniques have been proven to be particularly useful to better resolve and characterise the complexity of amyloid aggregation.
Microscopy techniques with single-molecule resolution, such as atomic force microscopy (AFM) and particularly cryoelectron microscopy (cryoEM), have been recently instrumental in describing the structure of particular types of amyloid fibrils at atomic resolution. With the recent explosion of cryoEM techniques, the remarkable multiplicity and polymorphism of amyloid aggregates composed of the same protein or peptide has been demonstrated [
27,
28,
33]. Super-resolution imaging techniques have allowed the localization and morphological characterisation of aggregates in vivo [
34], and in combination with multi-dimensional fluorescence detection, have revealed their conformational diversity [
35]. Fluorescence-based single-molecule techniques, on the other hand, have provided unique information on the dynamic nature of the fibril-forming process, as well as the characterisation of the heterogeneity of the amyloid aggregates. In addition, they are extremely useful for the detailed characterisation of hetero-aggregates composed of different amyloidogenic proteins, as well as for the study of the interaction of amyloid aggregates with other molecules, allowing the estimation of the binding sites, affinities, and avidities.
In this article, we review some recent contributions on the characterisation of amyloid aggregates and the identification of novel inhibitors of the toxicity associated with this process by diffusion-based single-molecule fluorescence techniques as examples of the type of relevant information we can obtain about these processes using these techniques.
2. Diffusion-Based Single-Molecule Fluorescence Techniques
Fluorescence-based single-molecule methods typically require the attachment of particularly bright fluorophores to the macromolecule of interest and the use of sophisticated instrumentation. Two different types of fluorescence-based single-molecule approaches can be differentiated. Surface-immobilised methods, typically using Total Internal Reflection Fluorescence (TIRF), that monitor the time-evolution of the fluorescence signal associated with one molecule that is immobilised onto a surface. This approach is very useful to determine the rate constants of macromolecular processes such as protein conformational transitions or protein-protein/ligand interactions. An interesting immobilised-based technique in the amyloid field is photobleaching, which refers to the photochemical alteration of a fluorophore molecule such that it is permanently unable to produce a fluorescence signal. This otherwise avoided phenomenon is particularly useful for the characterisation of the number of subunit copies in homotypic oligomers, since the probability of two fluorophores within an aggregate to bleach at the same time is extremely low. So, when fluorescent labelled monomers within an oligomer are illuminated, the fluorophores bleach one at a time, creating a stepwise intensity time trace. By counting the photobleaching steps, the number of monomeric units of that particular oligomer can be estimated [
36].
Alternatively, fluorescently labelled molecules can be individually detected when diffusing in solution, either freely or in a flow, and crossing the illuminating volume. These diffusion-based methods are typically carried out in confocal microscopes, where the laser beams are focused into a dilute solution (typically 50–100 pM) of fluorescently labelled molecules using a high-numerical aperture (NA) objective (typically a 1.2 NA water immersion objective) [
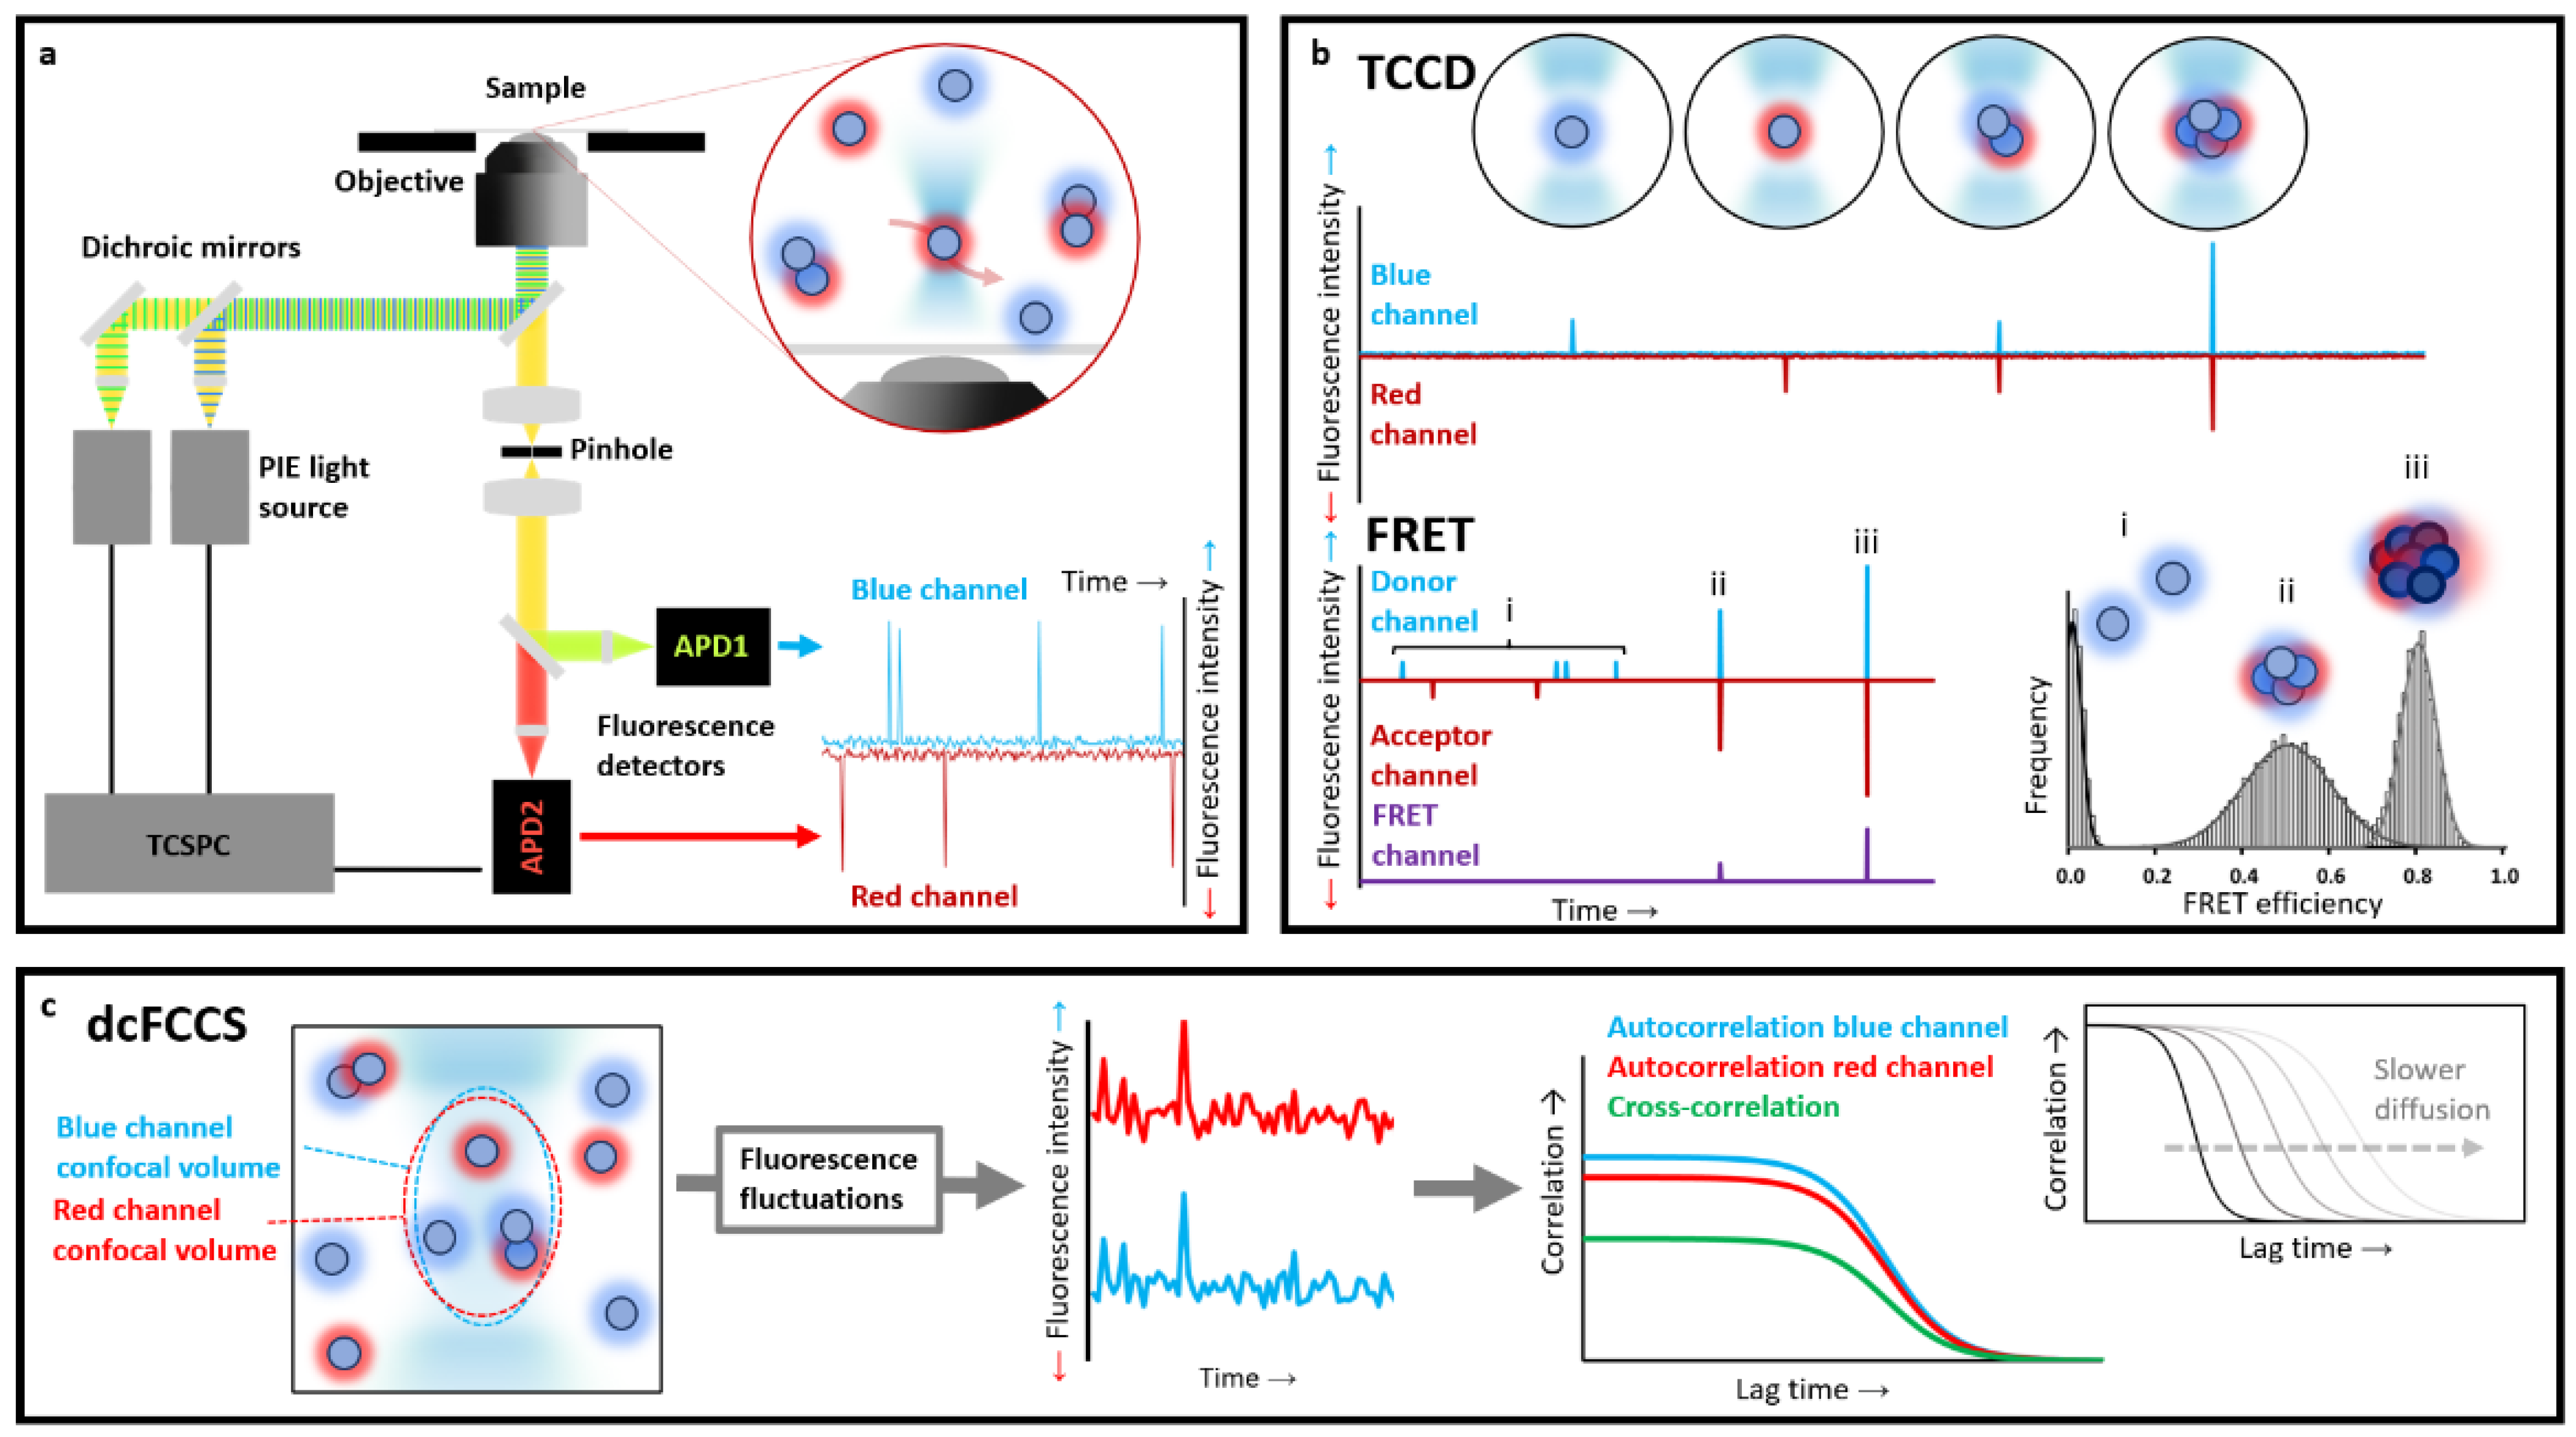
37]. The emitted fluorescence is then collected using the same objective, filtered through a pinhole, which provides the diffraction-limited fL detection volume, sorted according to their wavelengths and detected using high-sensitivity avalanche photodiode detectors (APDs) (
Figure 2a). This approach is preferred when determining populations and equilibrium constants in complex heterogeneous samples.
Among the different diffusion-based methods, multiple-colour detection approaches are extremely informative. To maximise the information available from each burst analysis when using multiple distinct fluorophores, a pulsed interleaved alternating excitation source, typically in the pulsed interleaved excitation PIE regime, and a time-correlated single-photon-counting (TCSPC) unit for the detection are used. In this way, all photons detected from a single molecule burst are analysed, making it possible to determine burst-integrated fluorescence parameters such as average fluorescence lifetime for each fluorophore, intensity-based and lifetime-based Förster resonance energy transfer (FRET) efficiency, and anisotropy. In addition, by analysing the time fluctuations in fluorescence intensity in the detection volume for each type of fluorophore, information about the size, conformation and concentration of the labelled molecules can be extracted.
Three multiple-colour (typically two-colour) diffusion-based single-molecule fluorescent techniques stand out as the most frequently used to study amyloid aggregates: two-colour coincidence detection (TCCD), Förster resonance energy transfer (smFRET), and fluorescence correlation spectroscopy (FCS).
2.1. Two-Colour Coincidence Detection (TCCD)
TCCD is based on detecting the fluorescence emission of two distinct types of fluorophores upon their direct excitation. The strategy relies on labelling each molecule of interest with a distinct fluorophore and directly exciting them by a spatially overlapped diffraction-limited confocal laser volume. When a fluorescently labelled particle passes through the confocal volume, it is excited by two lasers, and its emission is recorded as a fluorescence burst in its respective channel. The fluorescent particles in solution are typically in the picomolar range so that the probability of two different labelled particles crossing the confocal volume at the same time is extremely low, thus ensuring that a burst showing emission in both detectors (i.e., a coincident event) essentially only arises from a particle that contains both fluorophores. There are some methods to account for the probability of chance coincidence, if significant, in the experiments [
38]. This technique is therefore highly sensitive for detecting small populations of interacting particles, although it typically requires high-affinity complexes, allowing for the quantification of the fraction of associated versus non-associated particles as well as the stoichiometry of each detected complex [
38].
In the case of protein aggregation studies, TCCD experiments are typically performed using two samples of monomeric proteins independently labelled with different dyes, and then mixed at equimolecular concentrations under aggregation-triggering conditions. Small aliquots are then taken at different time points of the aggregation reaction, diluted up to single-molecule conditions (low picomolar concentrations), and analysed. Each individual molecule that passes through the confocal volume is illuminated by the two lasers and detected as an isolated burst. Free monomers will be excited by one of the lasers and then spotted only by one or the other detector, whilst particles containing at least two differently labelled peptides will be simultaneously detected in both channels within the same time window [
39] (
Figure 2b). Based on the average intensity from the individual fluorescently-labelled monomers (corrected by FRET if required), the approximate number of monomers per oligomer event can be extracted [
39]. The size of the oligomers calculated this way is only an estimate of the real oligomer size, since it is not corrected by the actual path that particular oligomer has taken when crossing the confocal volume, which will affect its brightness. However, the estimated size distribution of oligomers can be used to determine relative differences in sizes between the oligomeric species across samples or conditions. This method, therefore, is very suitable to follow the first steps of an amyloid aggregation process with great temporal accuracy, so subtle changes amongst different conditions or protein mutant variants regarding monomer affinity and fraction of oligomers formed during the primary nucleation step can be determined [
40].
2.2. Förster Resonance Energy Transfer (smFRET)
FRET is a non-radiative transfer process of singlet excitation energy from a donor molecule to an acceptor molecule via a dipole–dipole coupling. Because the transfer efficiency is inversely proportional to the sixth power of the donor–acceptor distance, the obtained FRET value is a very sensitive indicator of differences between protein conformations and binding processes. Suitable FRET fluorophore pairs are required, which will define the accessible probe distance range. For the most commonly used dye pairs, the method can typically provide distance information in the 10–100 Å range. This technique is widespread across in-bulk techniques, but it is particularly useful in single-molecule fluorescence measurements. In these experiments, FRET efficiency (
EFRET) is determined for each protein species detected by exciting the molecule with only the donor laser and recording the emission of both donor and acceptor fluorophores. The most typical experiments use ratiometric methods, with
EFRET derived from the relative intensities of donor and acceptor photon emission, and in the PIE regime. In this way, for the same molecule it is possible to excite alternatively donor and acceptor, recording their emissions after direct excitation, and also recording the acceptor emission after exciting only the donor molecules (indirect excitation through FRET). With this information, together with the appropriate intensity-based corrections, it is possible to determine de
EFRET and the stoichiometry or association quotient (
S) of the particle using the following expressions [
41]:
where
and
are the donor and acceptor emission after direct excitation, respectively,
is the sensitised emission or acceptor indirect excitation through energy transfer after donor excitation,
α is the bleedthrough of photons emitted by the donor into the acceptor channel,
δ is the direct excitation of acceptor molecules with the donor specific excitation wavelength,
γ is a correction factor for the different detection efficiencies in both channels, and, similarly,
β is a correction factor for the different excitation efficiencies in both channels.
α and
δ can be experimentally obtained, while
γ and
β can be calculated from the technical data of the dyes and the microscope setup [
41]. Finally, if the molecular brightness (the number of photons emitted by one molecule per unit of time) of each species is known, this ratio can be used to obtain the number of molecules of each species (colour) that are forming that particular molecular complex.
After recording sufficiently high numbers of particles, and constructing meaningful histograms, one can directly obtain the distributions of macromolecular properties, avoiding the loss of information caused by averaging in-bulk measurements. Different structural species will have different donor–acceptor distances, which will show up as differences in average
EFRET values, allowing for the real heterogeneity of biomolecules to be unambiguously revealed (
Figure 2b). This technique has been widely used to characterise protein folding [
42,
43,
44], conformational transitions upon functioning/binding [
45,
46,
47], protein–protein/macromolecule interactions [
48] and in the context of protein amyloid aggregation, for the identification of structural groups of oligomeric species [
23,
49,
50].
2.3. Fluorescence Correlation Spectroscopy (FCS)
FCS, also referred to as fluorescence fluctuation spectroscopy, is a single-molecule technique (although typically conducted at nM concentrations) based on correlating the temporal fluctuations of the fluorescence intensity when fluorescently labelled molecules are diffusing in and out of a tiny observation volume. These intensity changes can be quantified in their strength and duration by temporally auto-correlating the recorded intensity signal. These correlations offer insights into the photophysics that cause these characteristic fluorescence intensity fluctuations,
F(
t), as well as the diffusive behaviour and absolute concentrations of detected particles. Eventually, important biochemical parameters such as the size or shape of the particle (or molecule), as well as the viscosity of the environment can be determined [
51]. For instance, the larger a molecule or a particle is, the more slowly it will freely diffuse through the confocal volume, and the larger the autocorrelation times of its fluctuations will be (
Figure 2c). The autocorrelation of the fluorescence fluctuations is defined as follows:
where
G(
τ) is the autocorrelation amplitude at a given
τ,
F(
t) is the fluorescence intensity at time
t, ⟨
F(
t)⟩ = (1/
T)
F(
t)
δt denotes the time average of the signal,
δF(
t) = ⟨
F(
t)⟩ −
F(
t) are the fluctuations around the mean value
F(
t), and
τ is the correlation or lag time.
G(0) is inversely proportional to the average number of molecules passing through the confocal volume, which can be obtained as follows:
where
is the auto-correlation amplitude when
N is the average number of molecules in the confocal volume,
C is the concentration of fluorescent molecules in the sample, and
Veff is the effective confocal volume, which is calibrated experimentally for each fluorescence channel.
Fluorescence autocorrelation spectroscopy is, thus, a powerful tool to compare between monomeric and oligomeric species if their diffusion coefficients are different enough [
52]. Knowing the confocal volume makes it possible to calculate diffusion coefficients with only a few minutes of measurement. FCS has been used to characterise the amyloid aggregation process and determine the presence of different oligomeric species, both in vitro and in vivo [
53,
54,
55,
56,
57]. Mittag et al. [
58], fitted FCS data to Gaussian distribution models to clearly distinguish different Aβ oligomeric species in vitro. FCS can also be used to quantitatively investigate the effect of compounds on the amyloid aggregation process [
59], or the interaction of amyloid proteins with membranes [
60].
FCS can also be performed with two different colours, and similarities in the fluctuation of both channels can be detected, giving as result a new parameter that is cross-correlation. In dual-colour fluorescence cross-correlation spectroscopy (FCCS) experiments, two species of interest are labelled with two different types of spectrally distinct fluorophores, and the analysis of their co-diffusion is extracted. This technique allows for the accurate determination of the fraction of interacting molecules in solution, even if only a tiny portion of doubly labelled particles are present on the background of larger amounts of singly labelled particles, irrespective of their relative diffusion coefficients. The degree of binding can be quantified from the amplitude of the cross-correlation curve and the ligand autocorrelation curve. From here, Krüger et al. developed a theoretical framework which was tested experimentally to obtain binding parameters from FCCS experiments [
61]. In summary, the degree of ligand binding
(number of bound ligand molecules) can be calculated from the absolute cross-correlation amplitude and the free ligand concentration
from the relative cross-correlation (see Krüger et al. [
61] or Gracia et al. [
62] for more details on the analysis). If we perform a ligand titration experiment, plotting
versus
yields a standard model-independent binding curve. The half-saturation point of this curve allows for an estimation of the affinity of the ligand for the receptor, although more accurate determinations can be obtained by fitting specific binding models to the FCS-derived experimental titration curves.
Analysing the aggregation reaction of amyloidogenic proteins by FCCS when mixing equimolecular concentrations of singly-labelled monomeric proteins with two colours, aggregates are unambiguously detected as cross-correlated events [
63]. More complex amyloid processes such as amyloid co-aggregation of two different proteins [
64,
65] or ligand binding to amyloid aggregates [
66] can also be approached by FCCS.
3. Identification of Structural Groups of Oligomers Generated during the Amyloid Aggregation Process
The most commonly used technique for studying amyloid aggregation is based on fluorescence, using extrinsic dyes capable of binding amyloid structures specifically. Among these, ThT is the gold standard. When it binds to cross-β structures, such as amyloid fibrils, ThT displays enhanced fluorescence quantum yield and a characteristic blue shift in the emission spectrum [
67]. The large size and the rigidity of the fibrils allow the binding of a large amount of ThT, while providing an environment with restricted mobility, which enhances ThT fluorescence emission. In contrast, disordered or partially folded oligomers have much weaker interactions with ThT and their flexible structures significantly restrict the increase in its fluorescence quantum yield. Consequently, other protein species than the fibrils are typically invisible in ThT aggregation assays. Other bulk ensemble average analysis of the reaction will essentially record on the disappearance of monomeric protein and the concomitant appearance of the fibrillar state, as these two conformations are the most populated ones along the aggregation process. However, the low-populated oligomeric species are not only essential for driving amyloid formation and determining the type of fibrillar polymorphism adopted, but also for the acquisition of toxic and degradation-resistant structural properties [
23]. The intrinsic heterogeneity of such oligomeric species challenges the type of techniques suitable for their identification and analysis.
We used single-particle fluorescence spectroscopy techniques, specifically TCCD and smFRET, in order to obtain meaningful information about the initial self-assembly process of αS amyloid fibril formation. We performed a series of TCCD and smFRET experiments at different time points during the αS aggregation process. Equimolecular mixtures of αS labelled with either AlexaFluor488 (AF488) or AlexaFluor647 (AF647) (experiments performed with 100% of labelled protein molecules) were incubated under conditions used previously to form fibrils in vitro [
68], and aliquots were taken at a series of time points and then diluted rapidly by a factor of 10
5 to a final concentration of ca. 100 pM. In TCCD experiments, the confocal volume was excited by the overlapped red (633 nm) and blue (488 nm) lasers, and oligomers were detected as coincident bursts of fluorescence and readily distinguished from single-labelled monomers, once the chance of coincidental background events was taken into account [
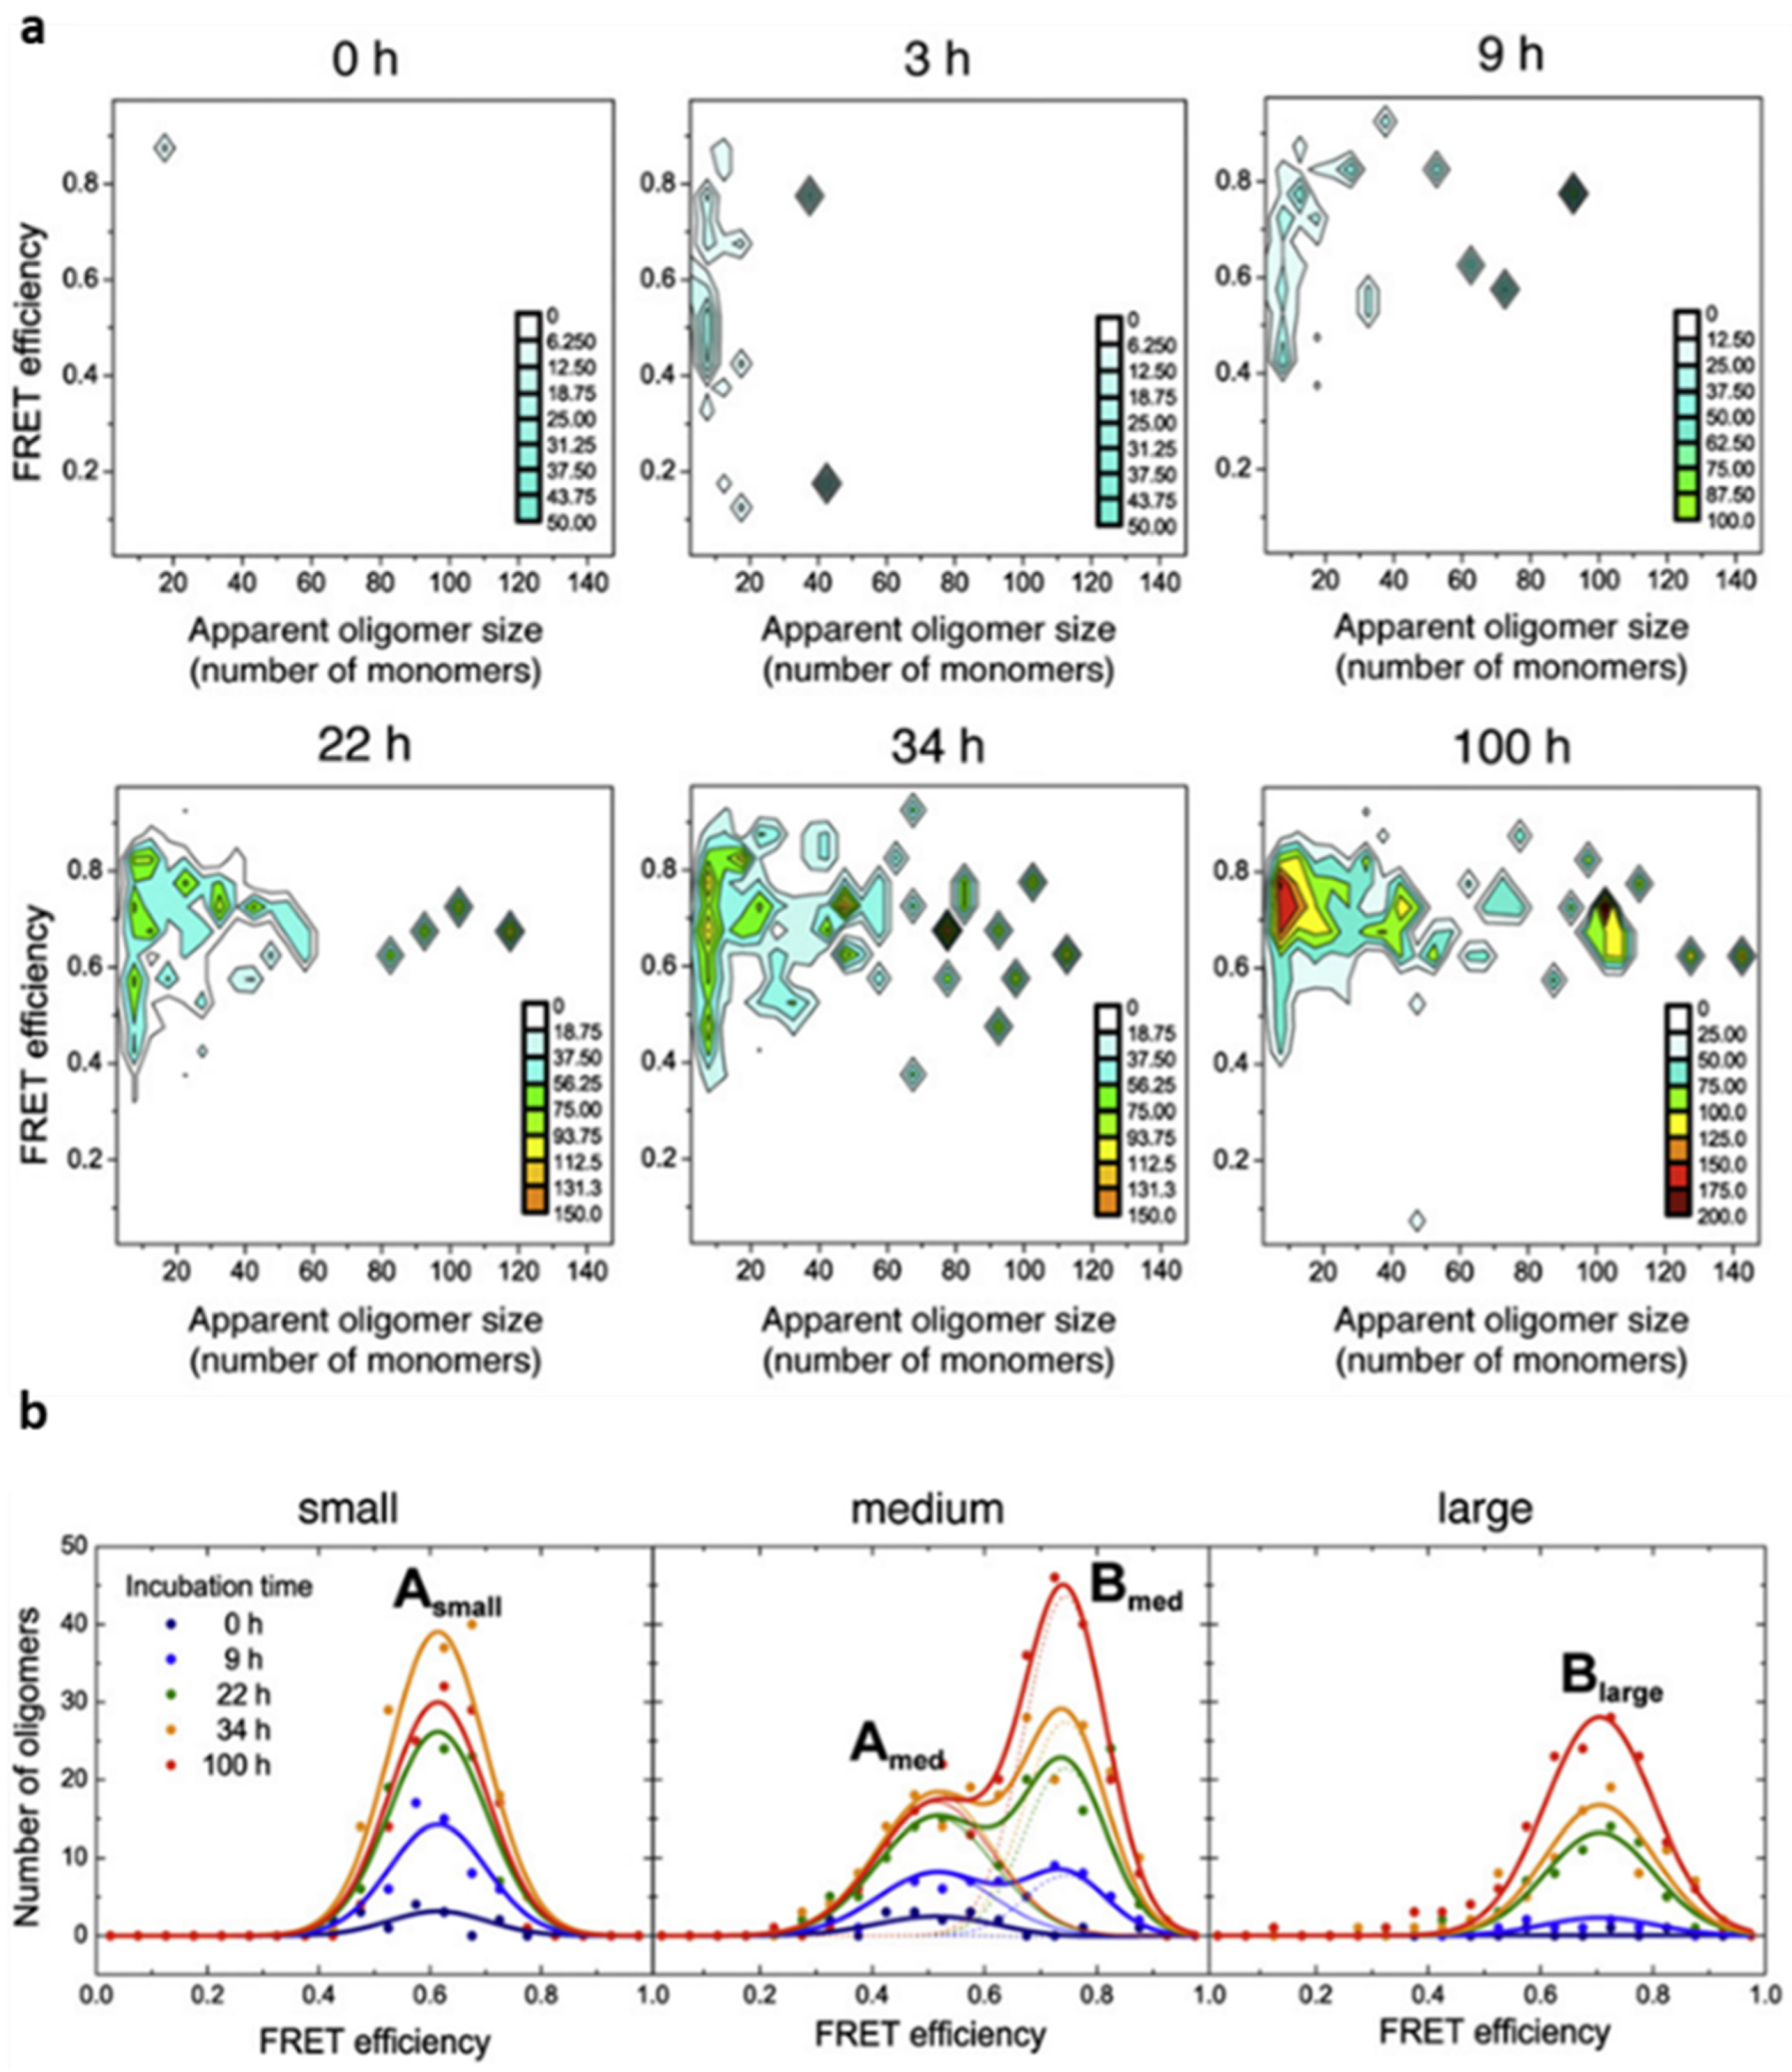
38]. At the same time, for each coincident burst event detected, i.e., each oligomeric particle, the size and average FRET efficiency value was determined. For this, the sample was irradiated by the blue laser alone, that is, only AF488-labelled molecules were excited directly. We observed, however, that the AF647 fluorophores were indirectly excited by FRET from adjacent AF488 fluorophores within the aggregated species. In this way, we were able to estimate the fraction of oligomeric species along the αS aggregation process, as well as to track the time evolution of their size and FRET distributions. For each time point during the aggregation reaction, two-dimensional plots with the size and FRET efficiency histograms of the oligomer populations were obtained, which provided information about the appearance of oligomers during the lag phase of fibril formation (
Figure 3). A couple of hours after incubating monomeric αS under aggregation-promoting conditions, some small oligomers are identified, with apparent sizes smaller than 10 mers, which were observed to increase in number and size with time. Despite the highly heterogeneous size distribution of the oligomeric species, a relatively small range of FRET efficiency values was observed. From a visual inspection of the data (
Figure 3a), the distribution of FRET values was observed to vary with the size of the oligomers, revealing two dominant FRET populations: one corresponding to those of small size with medium FRET values (0.4–0.7) and the other to larger species with higher FRET values (0.6–0.9). To analyse these populations in more detail, we classified the oligomers into three broad size groups, small (2–5 mers), medium (5–15 mers), and large (15–150 mers), and fitted the FRET histograms for each group as Gaussian distributions (
Figure 3b). The FRET distributions for each oligomer group remained unchanged during the incubation time, allowing the data sets at the different times to be fitted globally. Using this analysis, we were able to obtain, for the first time, the kinetics of formation and interconversion of different oligomeric forms generated during the early stages of fibril primary nucleation.
The data obtained indicated that the αS monomeric molecules initially assemble into small oligomeric forms that retain a disordered, labile structure which suffer a remarkably slow structural conversion into more stable, compact oligomers which further grow and acquire the fully formed cross-β structure in the fibrillar form. The more compact and structured oligomers also showed high toxicity to neuronal cells and high resistance to protease degradation, indicating that the conformational change at the oligomeric level that we identified was the rate limiting step not only for fibril formation but also for the acquisition of toxic properties for the cells [
23]. The intrinsic rate for the oligomer structural conversion, and thus acquisition of toxic function in αS, that we determined by single-particle fluorescence experiments, is on the same time scale of the reported half-life for αS turnover in vivo, which suggests that under healthy, physiological conditions the cellular degradation machinery is able to degrade easily any possible initially formed αS oligomeric species before their conversion to protease-resistant toxic oligomers. In line with this, this discovery shows the potential for possible therapeutic interventions prior to the onset of cellular damage if we were able to detect the formation of the early, initially formed oligomers.
Additionally, by diluting mature fibrils into single-molecule conditions, we directly observed the release of toxic oligomers during the disaggregation of mature αS fibrils, suggesting that the disaggregation of fibrils can also be a source of toxic species in vivo. Indeed, the release of toxic oligomers from the fibrillar species seems to be particularly relevant in the cellular context [
26], a finding that needs to be considered when designing therapeutic strategies based on fibril disaggregation approaches.
The single-particle methodology that we developed in these seminal studies has been further used to compare the kinetics and structural types of oligomer formation in αS pathological mutants, as compared to the WT protein [
40], as well as for the study of the early self-assembly process in other amyloidogenic systems [
49]. More recently, it has been adapted to follow αS oligomer formation in living cells, where the two structural types of oligomers that we identified in in vitro studies were also observed to form inside neuronal cells [
63].
4. Characterisation of the Interaction between Small Molecules and Protein Aggregates
For a detailed analysis of the interaction of a given molecule to a multivalent receptor in general, and a protein aggregate with multiple binding sites in particular, it is essential that not only the apparent affinity of the interaction is determined, but also the stoichiometries of binding. Owing to the complex and heterogeneous nature of the aggregated species, a detailed characterisation of the interaction of molecules of interest with the amyloid aggregates is a challenging endeavour. Single-particle techniques, in particular dual-colour fluorescence intensity fluctuation techniques (dcFCCS), which can monitor and analyse the diffusional behaviour of each binding partner individually, are especially useful in the pursuit of a meticulous description of molecular interactions. When combined with TCCD-smFRET in the same setup, we can obtain multiparametric information of the binding process using the same protein samples, allowing for a powerful, self-verified, analytical approach that is particularly useful for the characterisation of multivalent complexes.
On the one hand, we exploited the ability of fluorescence auto- and cross-correlation spectroscopy to quantify the co-diffusion and, thereby, the degree of binding of the interacting species. On the other hand, we took advantage of single-particle fluorescence spectroscopy to look at single aggregates in solution and determine the number of bound molecules during a titration experiment. We used the approach of combining these two dual-colour time-resolved single-particle fluorescence techniques to directly access the key information that defines the interaction between a small potential therapeutic molecule and particular types of αS aggregated species.
Interfering with αS amyloid formation and inhibiting its associated toxicity is considered as a promising therapeutic strategy for Parkinson’s disease and other neurodegenerative disorders associated with αS amyloid deposition [
69]. A number of molecules has been found to inhibit αS amyloid formation, but the molecular basis of its inhibition is known for very few due to the challenges of identifying the interacting protein species and determining their overall effect on the self-assembly reaction. Recently, we helped to identify a natural peptide molecule with a high αS anti-aggregation potency. Using our combined single-molecule approach, we were able to associate its strong inhibition effect with its ability to bind with remarkably high affinity and specificity exclusively to the toxic αS species, abrogating the oligomer-induced damage in neuronal cells and blocking the elongation and propagation of such species [
66].
For this study, we used samples of relatively homogeneous types of aggregated species, concretely the monomeric form, the amyloid fibrillar form, and two types of oligomeric species with different structural and toxic properties (BO and TO), and distinct from the monomeric and fibrillar forms. These four protein species are representatives of the four major groups of species generated during αS fibril formation [
23,
63] (see
Figure 1b). Growing experimental evidence supports the idea that TOs are the main toxic αS species accounting for the gain-of-toxicity associated with the αS aggregation process, whereas fibrils would be responsible for pathology dissemination and propagation [
15,
16,
17,
18,
19,
20,
21,
22]. Thanks to the effort of our lab and that of the others, isolated samples of either BO and TO can be obtained, which have allowed a detailed structural and biophysical analysis of these two groups of intermediate aggregated species [
25,
70].
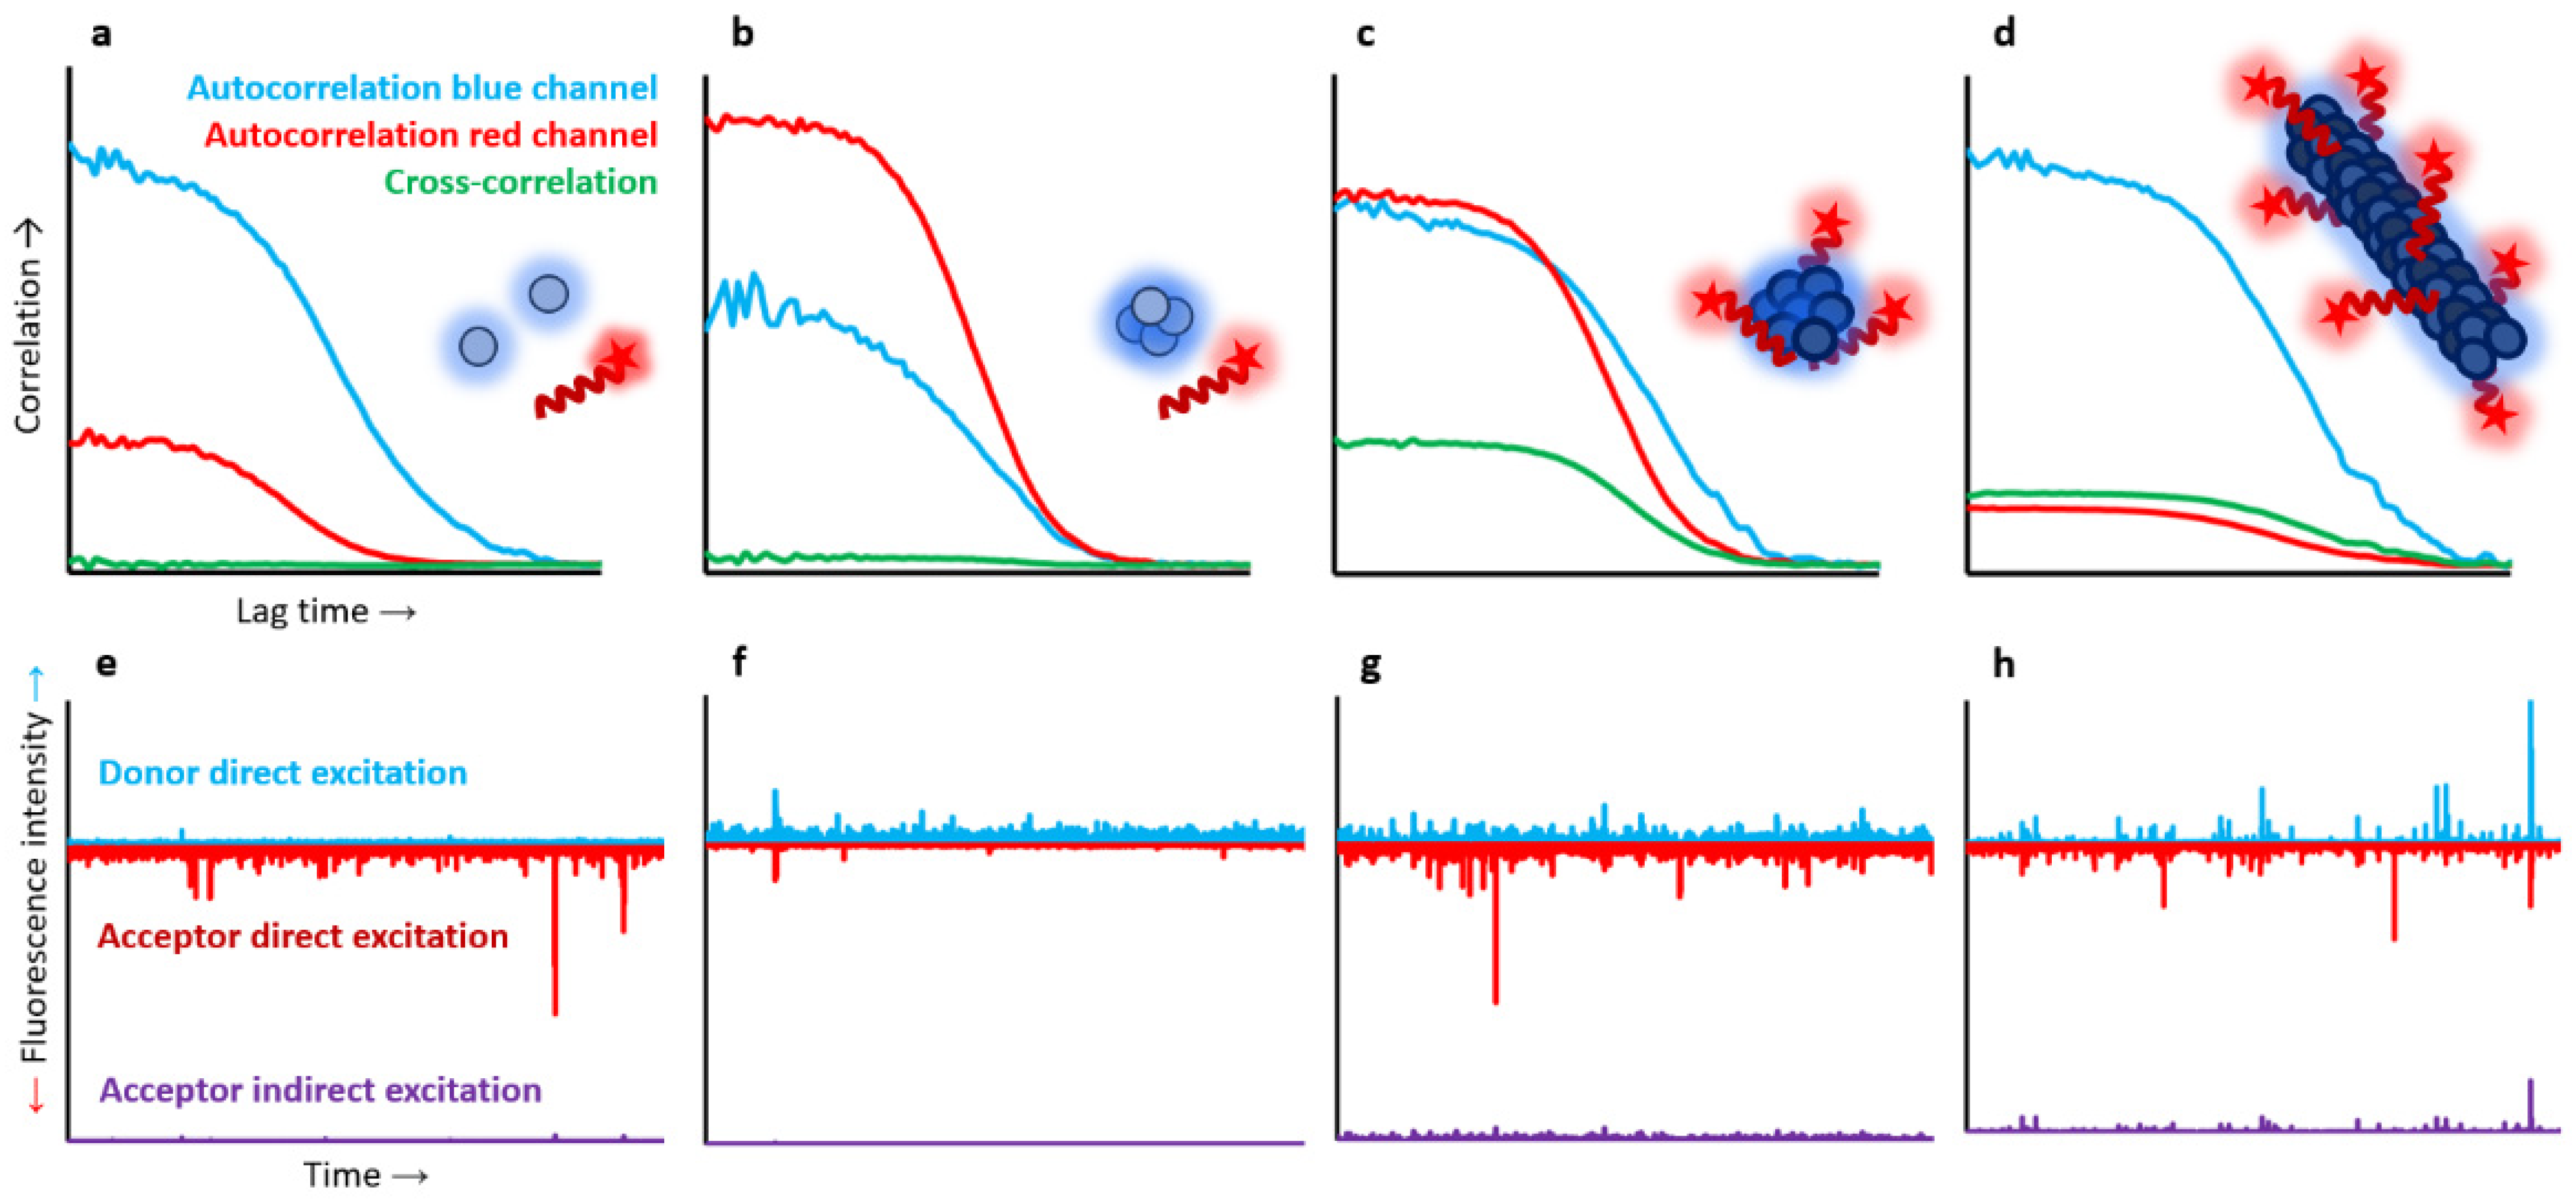
As multiple peptide ligand molecules could bind multiple αS molecules in the aggregated states, and for a particular concentration of αS aggregates and peptide ligand, a wide range of stoichiometries would be possible, we used two-colour single-particle fluorescence techniques to fully describe the binding process. For this, 100% fluorescently labelled molecules were used. αS was labelled with AF488 at the C-terminal region of the protein, a region that remains highly flexible and disordered in all protein species, while the peptide was N-terminally labelled with Atto647N. We first assessed the binding of the peptide with monomeric αS and found no interaction at the nanomolar range (1–500 nM), as reflected by a flat cross-correlation curve and the absence of coincidence fluorescence burst events in both detection channels. However, the peptide was able to interact with the different αS aggregated states, although for the case of the disordered, benign oligomers (BO) this interaction was minimal, with only a maximum of three peptide molecules interacting per oligomer (containing on average 19 αS molecules) at saturating conditions, with no signs of FRET. In contrast, for both toxic oligomers (TO) and fibrils, a clear cross-correlation curve was obtained at stoichiometric concentrations (in terms of mass concentration). Consistently, single-particle burst-wise analysis revealed a high fraction of coincident events, which also showed significant FRET in the samples containing peptide and either TO or fibrils at nanomolar concentrations (as low as 1 nM) (
Figure 4).
In order to obtain accurate estimations of the affinity and maximum stoichiometry for the binding of the peptide ligand with either αS TO and fibrils, we performed a titration experiment using both dcFCCS and TCCD analysis. In these analyses, we obtained the average number of peptide molecules bound per αS aggregate as a function of free ligand concentration for each titration sample and used a model of multiple identical and independent binding sites to fit the experimental data. We obtained identical binding affinities per single binding site for both TO and fibrils, concretely 0.13–0.14 nM−1 (i.e., dissociation constants of 7–8 nM), although different numbers of maximum peptide molecules bound per aggregate: 30 peptide molecules for TO and 120 for fibrils, which closely matched the average number of αS molecules present in each type of aggregate form. This analysis indicated that the peptide binding sites are only formed in the toxic αS aggregated states, being virtually identical in both TO and fibrillar forms, and that the only difference between the two aggregate forms in terms of peptide interaction is the number of binding sites per aggregate. It is also relevant to highlight the tight affinity that we found for this peptide molecule, which is well within the affinity values of antibodies, and its specificity for the toxic forms of αS, properties that can be exploited for therapeutic and diagnostic purposes.
5. Characterisation of the Formation of Heterotypic Aggregates Composed of Different Proteins
The classical view of amyloid diseases where the aggregation of a particular protein or peptide is associated with the development and progression of a distinct type of disease is challenged by the co-occurrence of aggregates of other types of proteins whose aggregation is linked to other diseases. This is particularly frequent in amyloid-related neurodegenerative diseases. Aggregates of αS are observed in more than half of the patients suffering from Alzheimer’s disease along with the more-characteristic deposits of the amyloid-beta peptide and the protein Tau [
71]. In addition, different disease-associated amyloidogenic proteins have been found to co-aggregate and co-localise in inclusions of individuals suffering from particular diseases. For example, αS and Tau have been found to co-localise in the disease hallmark inclusions of individuals with Parkinson’s disease and other synucleinopathies [
72], and co-aggregates (hetero-aggregates) composed of the two proteins have been observed in the brains of these patients [
73]. However, the molecular basis for the interaction of these proteins inside the cell that drive their co-assembly into amyloid-like aggregates and the nature of the co-aggregates formed are largely unknown.
We recently showed that αS and Tau can undergo liquid–liquid phase separation (LLPS) under physiologically relevant conditions by a process of electrostatic complex coacervation, resulting in the formation of large liquid-like coacervates [
64]. Similar types of protein-driven LLPS processes serve a myriad of functions in essentially all living systems [
64], but they have been also associated with aberrant protein–protein interactions and the ideal cellular niche for the nucleation of toxic amyloid aggregation [
74]. Indeed, we demonstrated that the highly crowded but dynamic and conformationally flexible nature of the protein liquid coacervates increase the rate of αS amyloid primary nucleation orders of magnitude with respect to more diluted cytosolic-like conditions [
75]. In agreement with this idea, we observed that αS and Tau were able to readily co-aggregate inside the αS-Tau liquid coacervates and we characterised the aggregates formed by single-particle fluorescence techniques (
Figure 5a) [
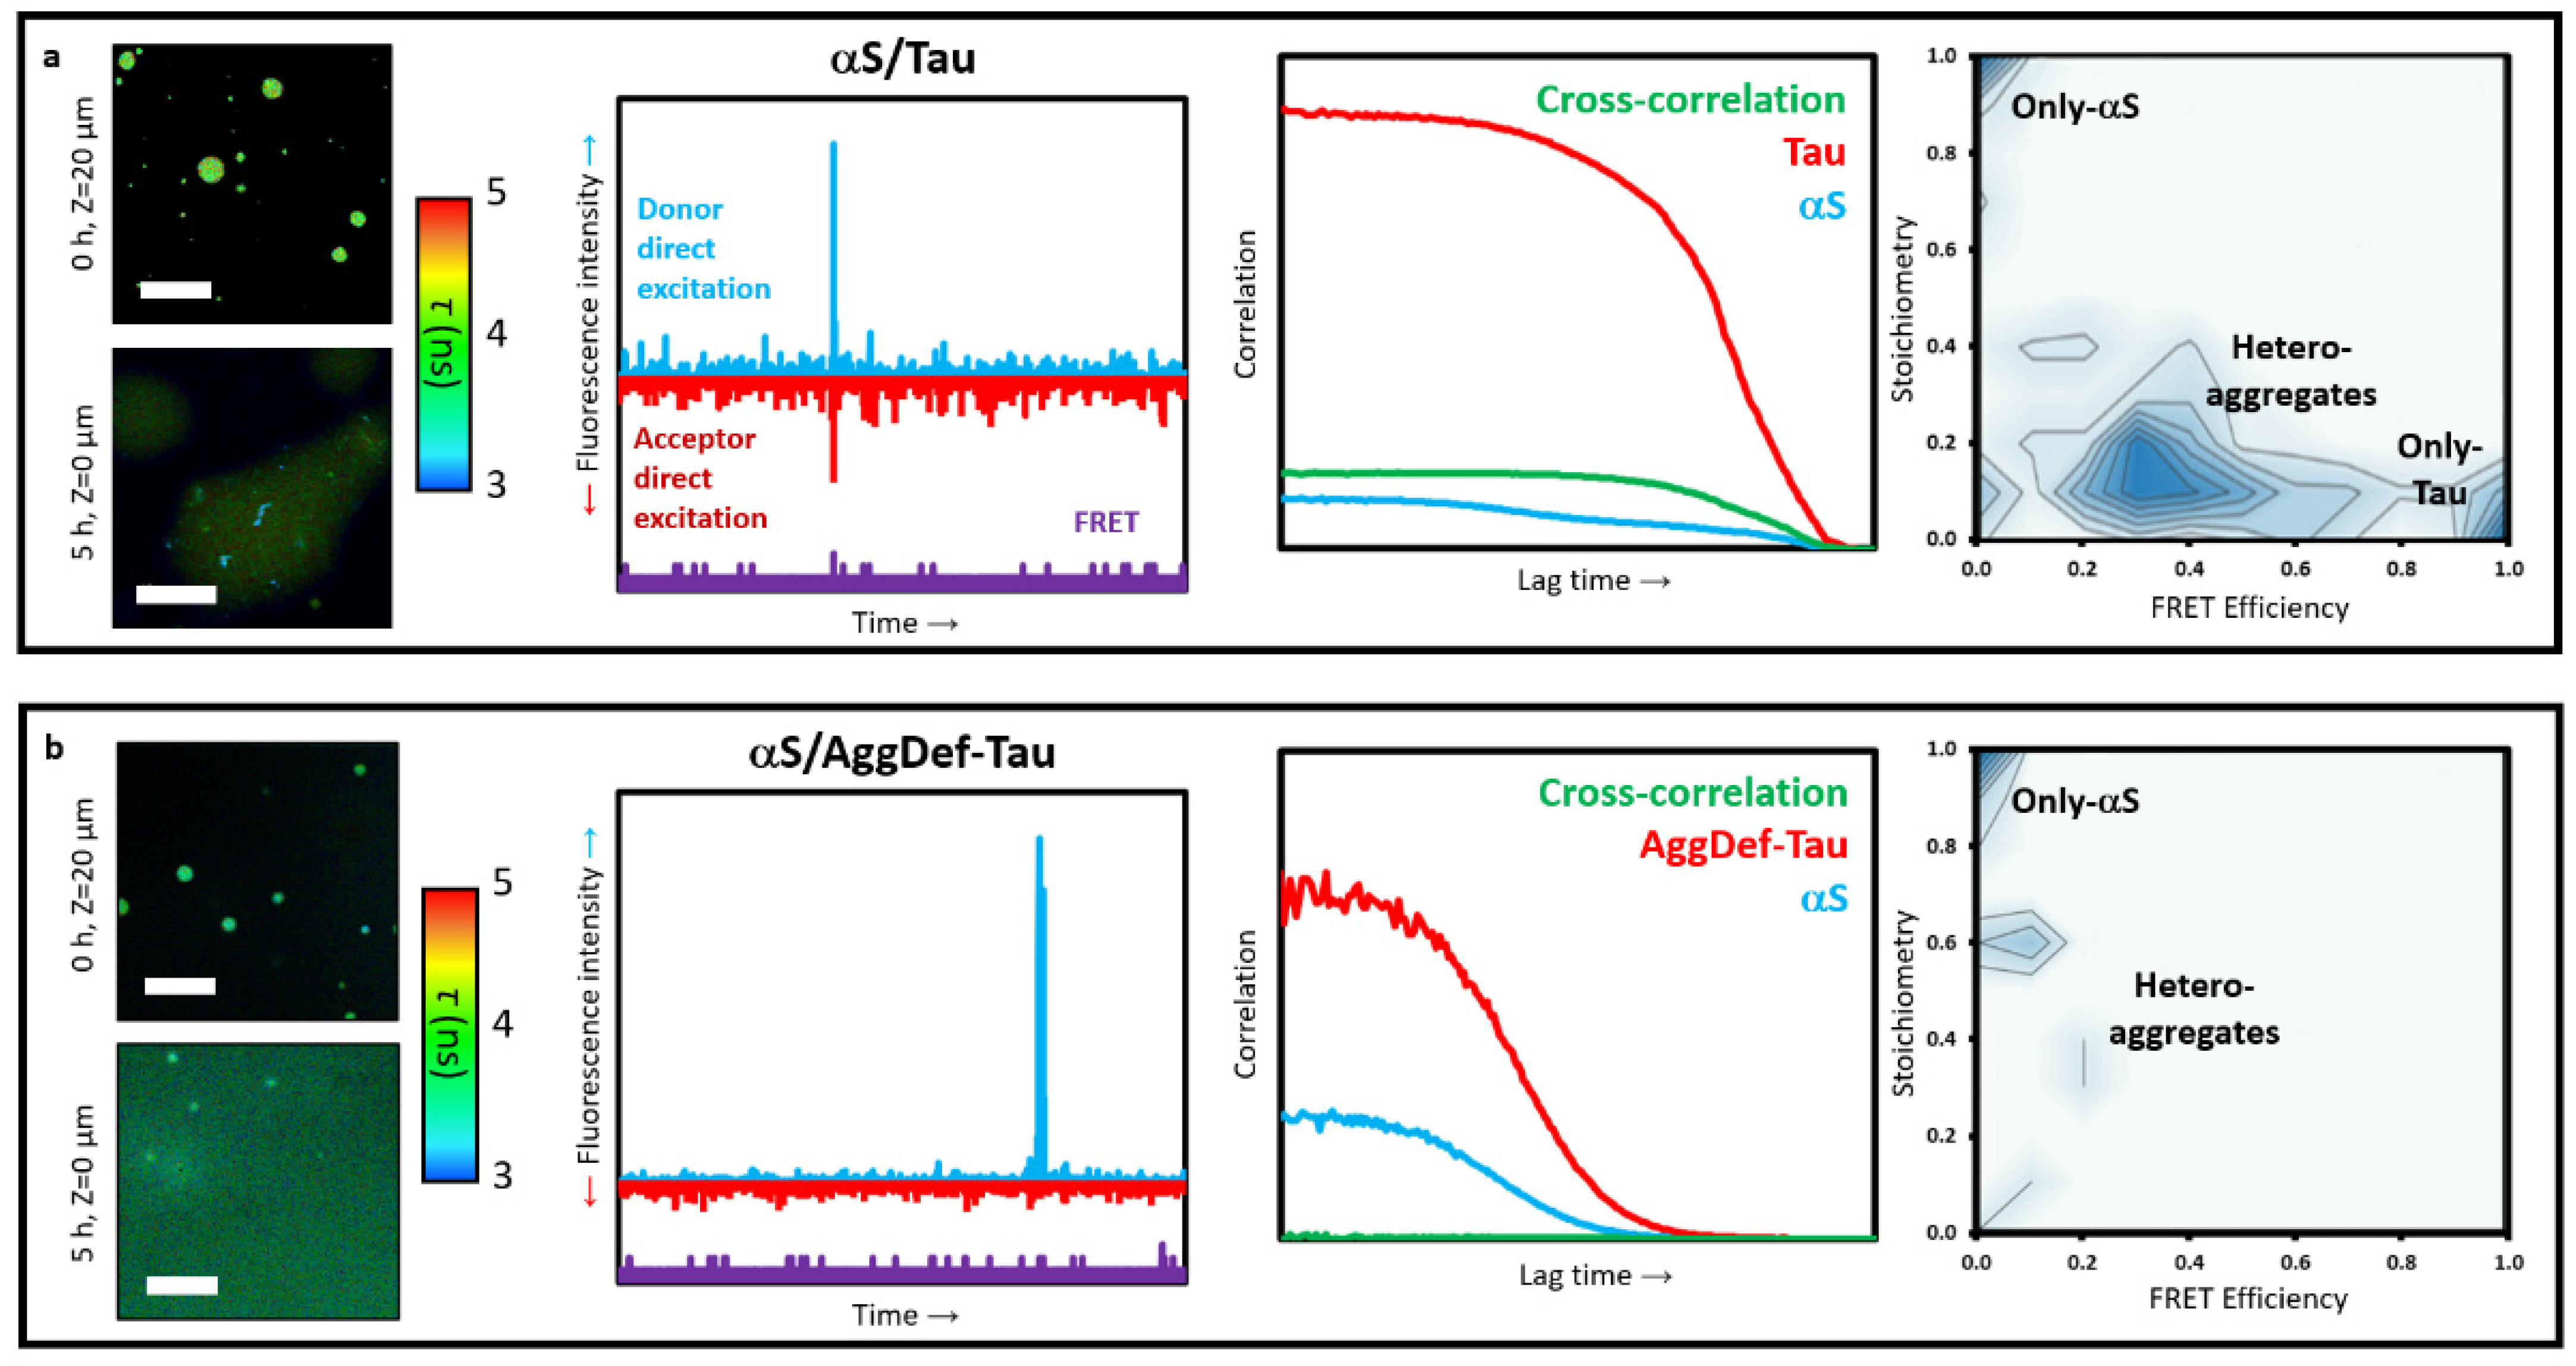
64]. We incubated the proteins at 25 μM with 1 μM of fluorescently labelled variants (Atto647N-Tau and AF488-αS) under LLPS-favourable conditions, and then isolated the aggregates generated inside the αS-Tau coacervates after 24 h incubation. The aggregates were isolated under conditions that prevented LLPS-associated interactions between both proteins: HEPES buffer at physiological pH without crowding agents, to prevent coacervate formation, and with 1 M NaCl, to prevent any possible electrostatically driven interactions between the proteins. Under these conditions, we obtained dispersed solutions of aggregates generated in the interior of αS-Tau liquid coacervates in the presence of free monomeric proteins. These aggregates show a strong ability to bind ThT, consistent with their amyloid-like nature, which was further corroborated with an amyloid deficient variant of Tau. When this Tau variant was used, referred to as AggDef-Tau, a drastic reduction in aggregate formation inside the liquid coacervates was observed (
Figure 5b).
We first assessed the amount of aggregates, and amongst them hetero-aggregates, formed by FCCS. For this, the dispersed aggregate solutions were diluted 1/500 to single-particle concentrations with aggregate isolating buffer. Under such conditions, a control sample of monomeric αS and Tau did not show signs of interaction and assembly. When we analysed the diluted samples of dispersed aggregates formed inside the coacervates, we obtained auto-correlation curves for the Atto647N-Tau and AF488-αS that indicated that a significant fraction of both proteins were in the form of aggregates, with estimated diffusion coefficients below 1 μm
2/s (
Figure 5a). In contrast, the auto-correlation curves for the samples generated in the presence of the amyloid deficient Tau variant, showed a marked reduction of aggregates, with the vast majority of the protein displaying diffusion coefficient values of those of the monomeric forms (ca. 50 μm
2/s for Tau and 100 μm
2/s for αS) (
Figure 5b). Consequently, a very faint cross-correlation curve was observed in this latter case, in contrast to the clear cross-correlation curve detected for the wild-type Tau variant. This cross-correlation curve indicated that the hetero-aggregates had diffusion coefficients in the same order of magnitude as typical sonicated fibrils (ca. 20–50 nm in length) [
21].
In order to characterise the composition of these LLPS-derived aggregates, the dispersed aggregate solutions were analysed by TCCD/smFRET burst analysis. For each fluorescence burst detected above the established thresholds for oligomer detection (three-to-five-times the mean intensity of monomeric protein, depending on the excess of monomeric protein in the sample), the size, stoichiometry (
S), and average FRET efficiency (
EFRET) was calculated. According to their stoichiometry and FRET values, three types of aggregates can be distinguished: only-αS aggregates, with
S ~ 1 and
EFRET ~ 0, only-Tau aggregates, with
S ~ 0 and
EFRET ~ 1, and αS/Tau hetero-aggregates, with intermediate
S and
EFRET values. For the samples containing both wild-type proteins, the TCCD/smFRET analysis showed that ca. 60% of the aggregates were hetero-aggregates, ca. 30% were Tau-only aggregates and only ca. 10% were αS-only aggregates. When analysing the composition of the hetero-aggregates, we found that they were typically enriched in Tau protein, with an average of four-times more Tau protein molecules per aggregate. In sharp contrast, the analysis of the samples containing the amyloid deficient Tau variant showed only one-tenth as many aggregates as with the wild-type Tau variant, and these aggregates were now enriched in αS, with ca. 50% of the aggregates presenting only αS molecules and the other 50% being hetero-aggregates with an excess of αS molecules (
Figure 5).
The analysis of the aggregates by fluorescence single-particle analysis allowed us to characterise the heterogeneity of the aggregate samples and determine the composition of those aggregates with a resolution unable to be achieved by bulk biophysical techniques. The results of these experiments demonstrated that while αS is capable of aggregating per se inside the coacervates with Tau, Tau nucleation is more favourable under these conditions, generating amyloid-like aggregates able to act as nuclei for the formation of hetero-aggregates of αS and Tau. However, once the Tau-rich nuclei are formed, the heterotypic interactions between αS and Tau are favoured in the aggregates over the homotypic interactions between Tau molecules, a feature that might be related to the heterotypic nature of the liquid coacervates in which these aggregates are generated.
6. Summary and Outlook
In the past decades, the development of single-particle techniques has expanded our ability to monitor one molecule/particle at a time, transforming our understanding of complex biological processes. Fluorescence-based approaches are not only able to provide high sensitivity, but also high spatial and temporal resolution, allowing for the study of conformational dynamics and diversity of biological macromolecules. These techniques have been of paramount importance for the identification and characterisation of low-populated protein species in complex, heterogeneous samples, as the case of oligomeric species generated during the self-assembly process of proteins into toxic amyloid aggregates. At the same time, they are able to draw the complex landscape of the binding process of multivalent complexes or multi-receptor, multi-ligand systems and the co-assembly of multiple macromolecules. We presented three examples of the use of these techniques in the context of protein amyloid aggregation. One example was a seminal study on the early self-assembly of amyloid aggregates which has greatly contributed to the understanding of the mechanistic details of the oligomerisation process and the acquisition of toxic function in such species. In the second example, we showed the power of using a multiparametric approach by combining dual-colour fluorescence correlation spectroscopy and single-particle fluorescence burst analysis to fully characterise the binding process of a small molecule with potential therapeutic properties to amyloid aggregates bearing multiple binding sites. Lastly, we demonstrated the utility of this combined approach for the study of the co-assembly of hetero-complexes under conditions in which both homotypic and heterotypic assemblies can be formed, as in Alzheimer’s and Parkinson’s disease. The studies presented exemplify the progress that single-particle techniques have provided to improve our understanding of the mechanisms of amyloid aggregation, their relationship with neurodegenerative diseases, and the nature of interactions that can interfere with this process, an important step towards the development and improvement of novel drugs to treat or prevent these diseases. While these and the majority of single-particle studies of amyloid aggregation have been performed in vitro, important steps have been taken towards their use in living cells. Such type of experiments requires the labelling of the proteins and molecules of interest with small, optimal fluorophores. This has been one of the limitations, although recent improvements in microinjection and electroporation techniques have allowed for the internalisation of appropriate fluorescently labelled proteins in the cytosol of living cells and thus monitor physiological and disease relevant processes in which those proteins are involved. In addition, recent developments in illumination techniques that guarantee three-dimensional sectioning and sufficiently reduced background with minimal phototoxicity provide more opportunities for in vivo single-particle fluorescence measurements that can provide essential insights into the mechanisms of amyloid aggregation inside the cells and the molecular basis of potential therapeutic strategies for neurodegenerative diseases. Lastly, single-particle techniques have great potential to characterise amyloid-binding molecules intended for diagnosis or therapeutic applications, as it works at physiologically relevant macromolecule concentrations and can deal with heterogeneous mixtures such as human biofluids.


