1. Introduction
The arrangement and displacement of water molecules at the protein-ligand interface is a well-recognized but incompletely understood phenomenon that can affect characteristics of ligand binding to proteins in aqueous solution [
1,
2,
3]. Water is commonly seen on protein binding surfaces through crystallography and is shown to modulate protein-ligand interactions [
4]. Water can alter the structure and rigidity of protein binding sites and can affect macromolecular function through the relative entropic/enthalpic favorability of water displacement [
2,
5,
6]. When water molecules leave a binding site, the site may become more flexible and conformationally favorable for ligand interactions. Baron, Setny, and Mccammon, developed a simple protein-ligand binding model [
5,
6], with the largest contributor to change in free energy attributed to the contribution of water, rather than the isolated protein-ligand molecular energetics.
Pharmacodynamic models emphasize the relationship between a drug molecule and its protein binding site, and modern drug design relies on the ability to manufacture compounds that effectively bind to their target. Human serum albumin (HSA) is the predominant blood plasma protein, with a physiological concentration of about 40 mg/mL [
7,
8]. It is also the primary vehicle for drug transport throughout the body [
9,
10,
11]. The properties of HSA drug binding sites are of particular interest, and an advanced understanding of their function has the promise to improve the customized nature and precision of drug delivery [
12]. Previous work using the quartz crystal microbalance with dissipation monitoring (QCM-D) showed a noteworthy positive correlation between drug molecule hydrophobicity (ClogP values), and the strength of binding to bovine serum albumin [
13]. Compounds with increased hydrophobicity bound more strongly to BSA, with strength of binding attributable to increased water displacement, and correspondingly facilitated exposure of the protein binding site [
13].
The structures of BSA and HSA are similar, while noted discrepancies of protein architecture between the two have been described [
14]. One primary structural difference is the presence of two tryptophan residues on BSA, compared to a single tryptophan residue on HSA [
6]. Specifically, HSA and BSA contain a Trp 214 residue within subdomain IIA, and BSA possesses an additional Trp 135 residue within subdomain IA [
14]. The tryptophan sites are important for recognition and binding of hydrophobic ligands. HSA is also 585 amino acids long while BSA is only 583 [
15]. Furthermore, they only share 75.8% sequence identity [
7]. Additionally, there are many key differences in binding pocket configurations and in each protein’s surface structure and local charge distributions [
7]. These significant differences merit a separate study based on HSA. As BSA is often used as a replacement for HSA in pharmaceutical studies, it is necessary to confirm that they share similar ligand binding characteristics when examined at the 2-dimensional surface interface.
In this work, QCM-D was used to investigate the binding profile for 11 compounds during their interaction with HSA. QCM-D is an analytical tool that facilitates determination of areal mass at the surface interface. It employs a charged, piezoelectric quartz crystal that operates at fixed interval, fundamental frequencies. Frequency changes upon deposition can be interpreted as a change in mass (Δ
m) via the Sauerbrey relation. For the relation to be accurate, the mass of adsorbed protein must be relatively small in comparison to the crystal, sufficiently rigid, and evenly distributed across the crystal surface. Given that these conditions are met, accurate mass values can be calculated and used to produce binding constants of different drugs on the protein film (
kon,
koff). QCM-D has been used in numerous studies to study ligand interactions with target substrates [
16,
17]. QCM-D is of particular interest to the field of cellular biology due to its ability to track cell to surface interactions, such as the interaction of mammalian cellular membranes to various adhesion proteins [
16]. While there have been studies that have assessed the rate of protein adsorption onto a monolayered surface using QCM-D, there have been limited inquiries into the binding kinetics of clinical drugs on a protein using QCM-D [
17]. Using QCM-D to analyze the behavior of drugs on specific drug transport proteins such as HSA can provide an avenue into developing more precise drug targeting. Thus, using QCM-D for the study of HSA-ligand interactions, we were able to quantitatively assess the change in mass of the adsorbed protein film for a set of 10 drugs with varying hydrophobicities. We were then able to construct a quantitative structure-activity relationship (QSAR) between the binding affinity of each ligand with their level of hydrophobicity. We then compared our findings with a previously constructed QSAR on a set of similar drugs on BSA, showing not only that there is a relationship between binding affinity and drug hydrophobicity with regards to HSA, but that it bears remarkable similarity to BSA.
2. Materials
To gather analytical data, a quartz crystal microbalance with dissipation (QCM-D) was used. SiO2 coated quartz sensors (15 mm × 0.3 mm) were the primary substrate for this experiment. Sensors were put in a solution of 2% Hellmanex and put in a sonicator for 20 min. Then, each sensor was rinsed with Milli-q and 50% ethanol and dried off with N2 gas. Finally, the working surface of the sensors was decontaminated by a 10 min UV/ozone treatment. The sensors operate at a fundamental frequency of 4.95 MHz ± 50 kHz at a temperature of 20 ± 0.1 °C. In each experimental run, sensors were placed in 4 QCM-D flow cells and rinsed with Dulbecco’s phosphate-buffered saline (DPBS) until a baseline was reached (all of the solutions were deposited at a rate of 300 µL/min). Then, HSA was injected into the flow cells and the deposited mass measured until no further mass deposited. DPBS was used again to rinse off loosely bound HSA and when a baseline was reached once more, a drug solution was then introduced into the flow cells. When a baseline was reached with the drug, DPBS was used once more to rinse it off. The experiment was considered complete when the DPBS rinse reached a baseline. Data corresponding to each drug solution was reproduced thrice.
The following drugs and proteins were ordered from Sigma-Aldrich (St. Louis, MO, USA). Acetaminophen (CAS 103-90-2), caffeine (CAS 58-08-2), cimetidine (CAS 51481-61-9), metronidazole (CAS 443-48-1), guaifenesin (CAS 93-14-1), procaine hydrochloride (>98% pure, CAS 32780-64-6), theophylline (>99% pure, anhydrous, CAS 58-55-9), scopolamine hydrobromide (CAS 6533-68-2), desipramine (CAS 58-28-6), metoprolol tartrate salt (>99% pure, CAS 56392-17-7), propranolol hydrochloride (>98% pure, CAS 13071- 148 11-9), and human serum albumin (lyophilized, essentially fatty acid free, CAS 70024-90-7). Dulbecco’s phosphate buffered saline (DPBS) diluted ×10 was used to dissolve all of the drugs at a concentration of 15 mM (pH 7.4). HSA was dissolved at 10 mg/mL with DPBS (pH 7.4).
The QCM-D data was analyzed using Prism 8 (Graphpad Software Inc., La Jolla, CA, USA) and verified using Maple 2020 (MapleSoft) in order to determine the rate constants due to association (kon) and dissociation (koff), and these values were used to determine the binding constant (koff/kon) for each drug tested. Partition coefficient (ClogP) values for each drug were calculated with the well-documented log(coctanol/cwater) formula.
3. Results and Discussion
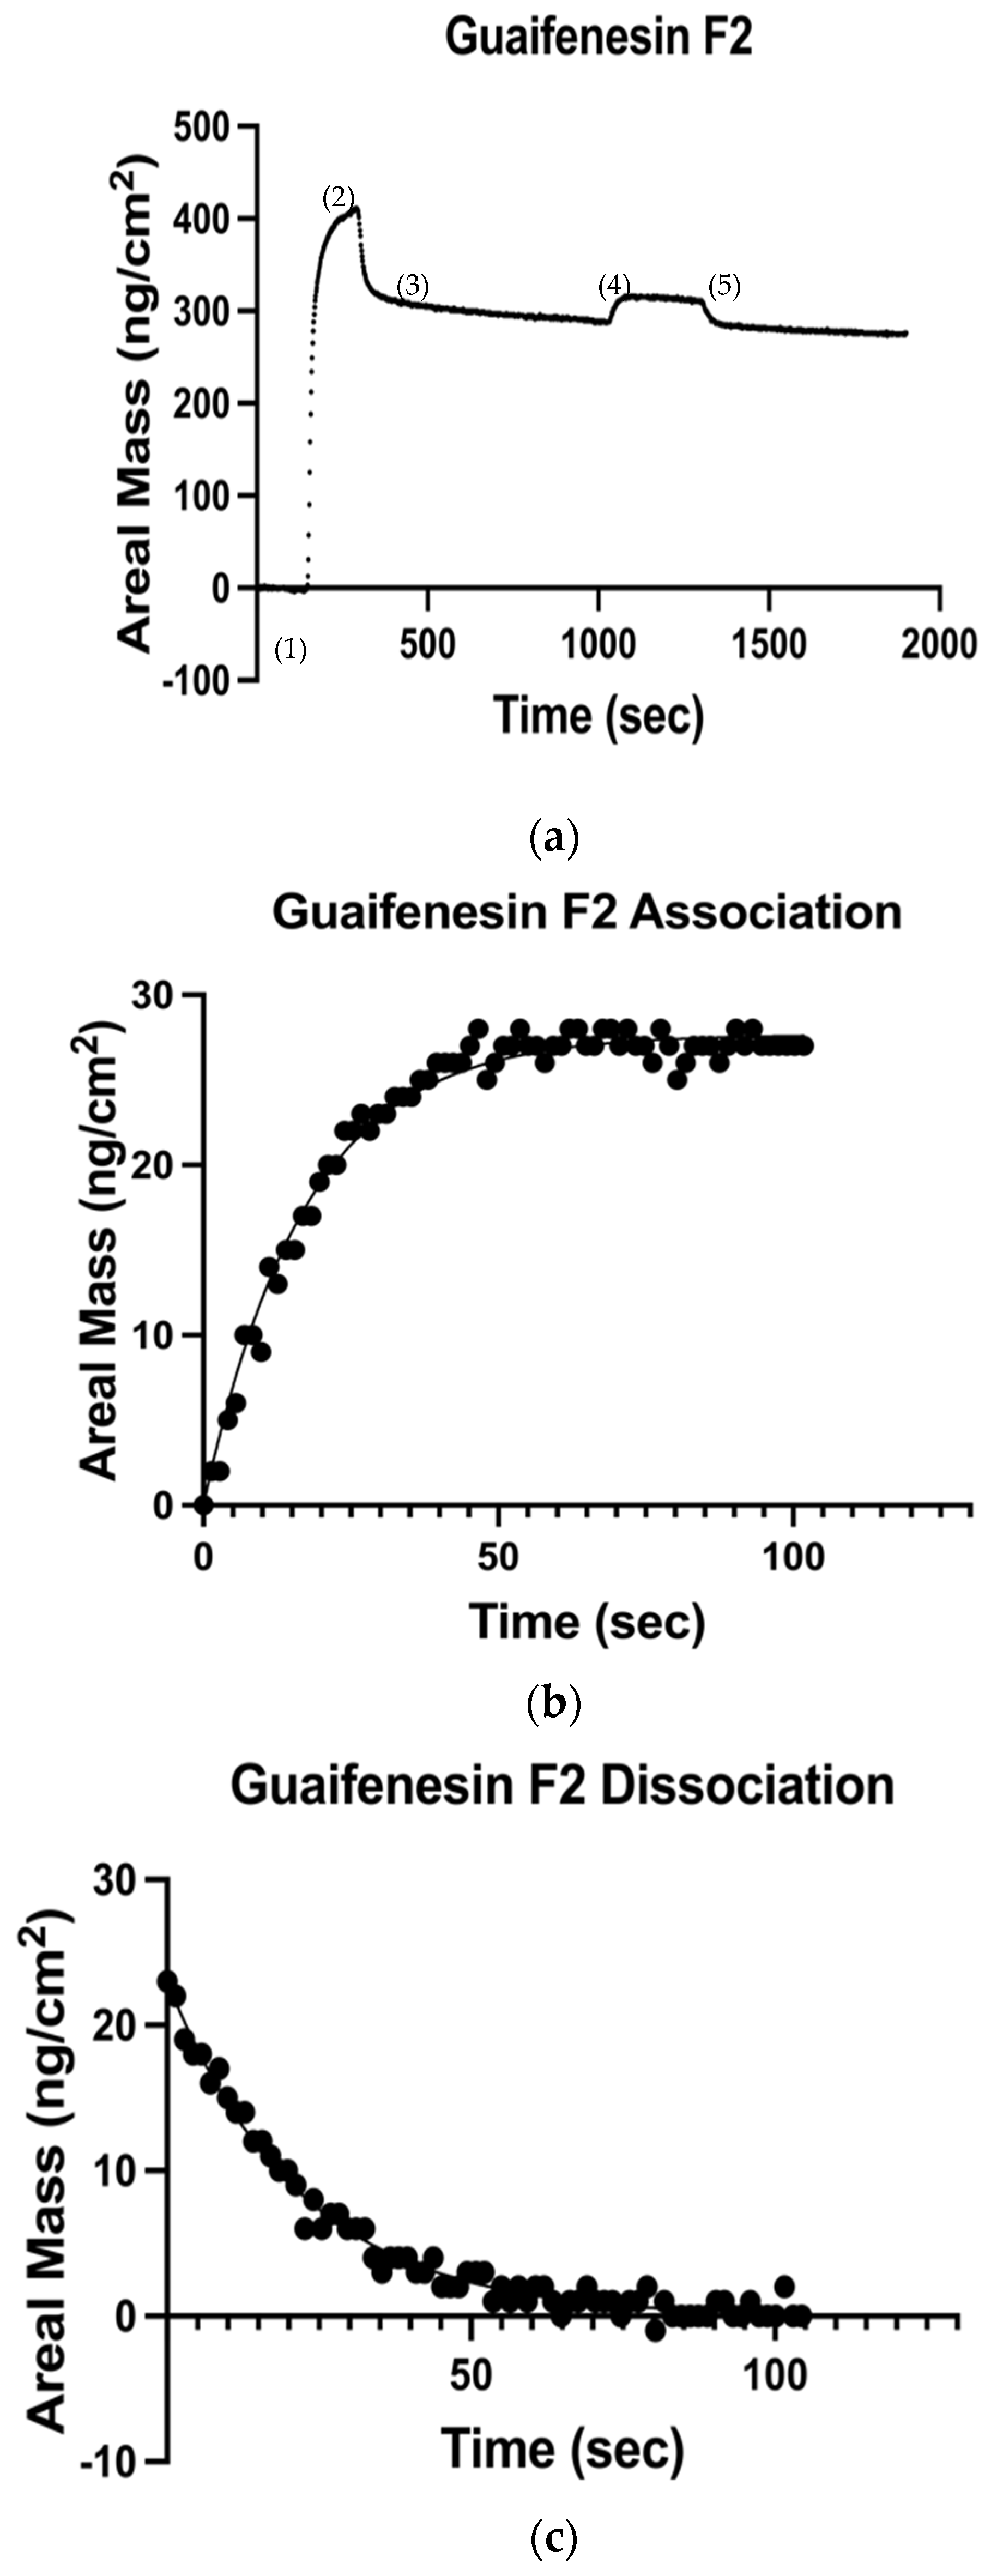
Figure 1a displays representative data from the adsorption of guaifenesin (3-(2-methoxyphenoxy)-1,2-propanediol) to a deposited HSA surface, and illustrates the temporal scheme for all QCM experiments: (1) represents the pure buffer rinse over the quartz sensor, followed by (2), which is the HSA deposition over the bare sensor. At timepoint (3), a subsequent buffer rinse was utilized to wash off incompletely adsorbed protein. Timepoint (4) depicts bound HSA surface exposed to guafinesin at a flow rate of 300 µL/min. Lastly, (5) represents an additional washing step with DPBS to rinse guaifenesin off the HSA film. Separate kinetic models were applied to fit data from the experimental association and dissociation phases of each candidate ligand from the underlying HSA film as follows: (i) the value of
kon was calculated by fitting the pseudo first-order model to the association curve, where
kobs =
kon/[
Drug], [
HSA-
Drug] is the Sauerbrey mass of the surface bound protein-drug complex, and [
HSA] is the mass of the total surface-immobilized protein (
Figure 1b); (ii) the value of
koff was determined by applying the first-order dissociation model (
Figure 1c). The ratio of
koff/
kon yielded a measure of the dissociation constant, K
D, and the logarithmic reciprocal of K
D was interrogated with respect to corresponding drug ClogP values—the calculated logarithmic comparison of partition coefficients between n-octanol and water—in keeping with standard QSAR technique [
13].
Table 1 provides a summary of the ligand compounds, with positive changes in total deposited mass observed for all of the drugs exposed to the HSA film. Values of experimentally measured K
D and calculated ClogP are included for each compound.
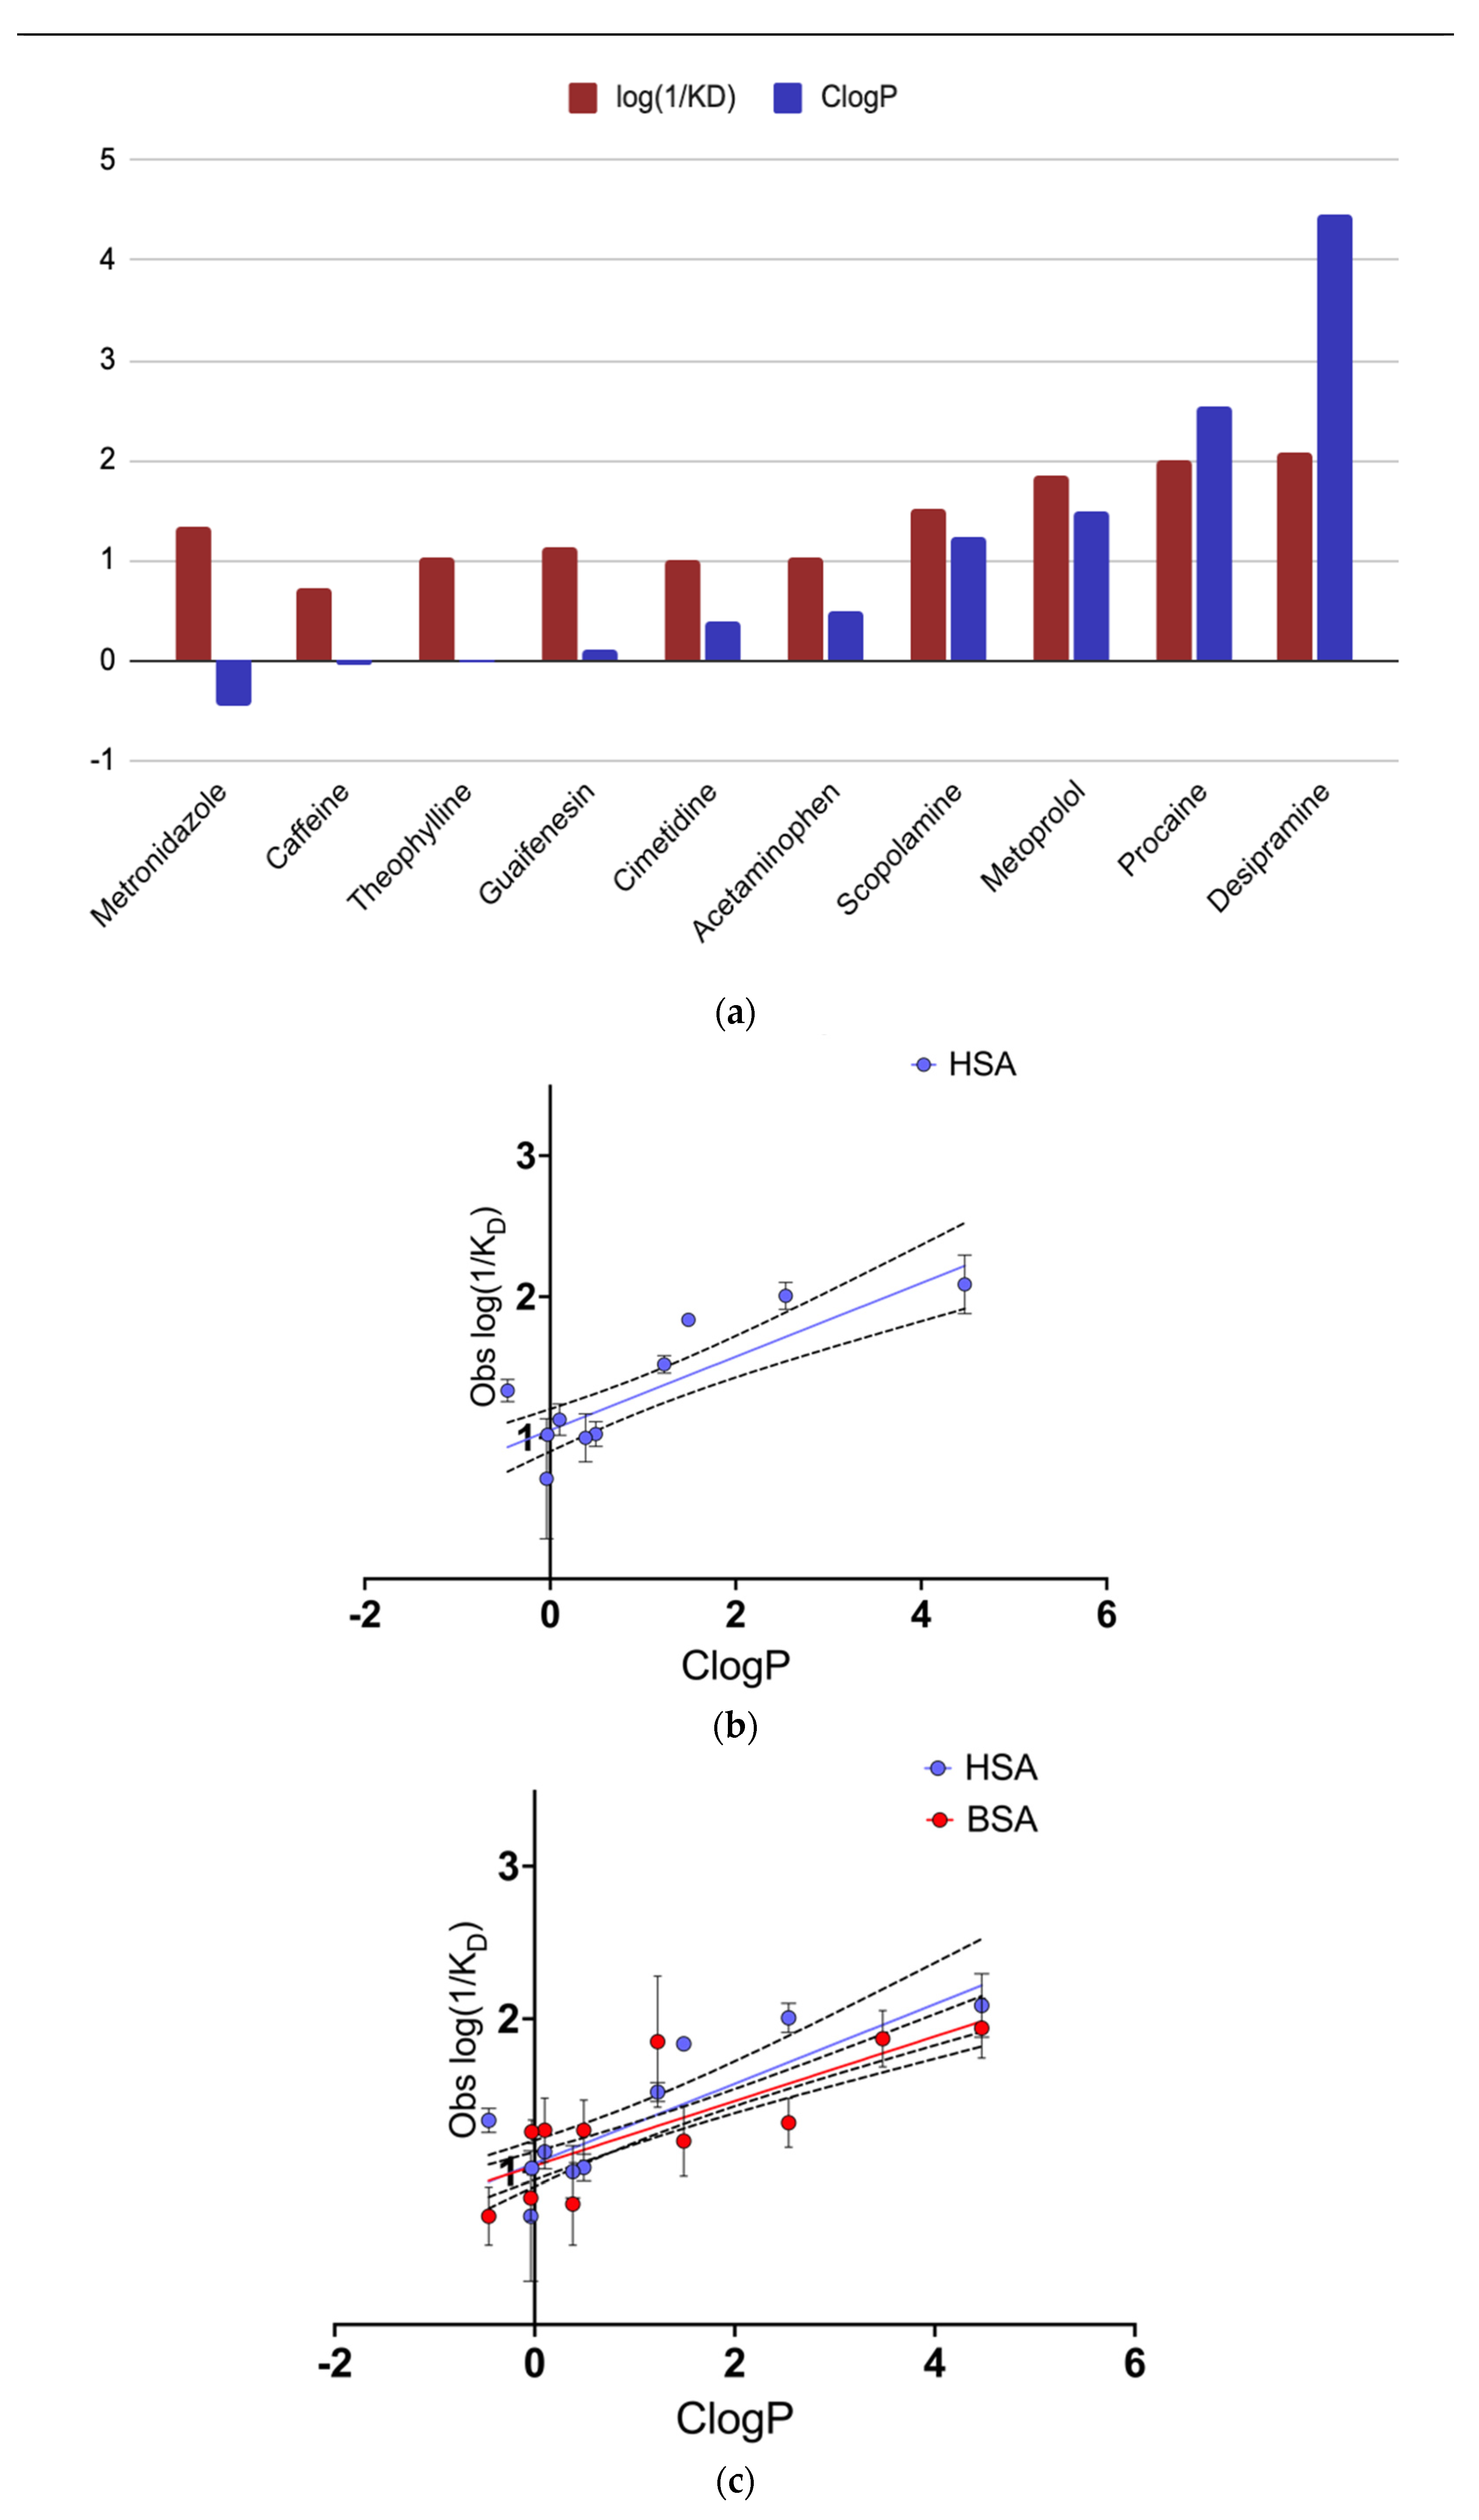
Figure 2a shows a positive correlation between hydrophobicity and binding strength, with the 10 compounds arranged in order of increasing hydrophobicity, as determined from ClogP values. A significant positive correlation is observed between binding strength to HSA and drug hydrophobicity (r
2 = 0.717) indicating that over 70% of the variance in drug binding (log 1/K
D) can be explained by hydrophobicity alone. Other factors, such as the specific structure of each drug, may also affect the binding strength observed in QCM-D. Among the drugs tested, those with a more localized hydrophobic structure displayed stronger binding despite lower overall hydrophobicity (such as metronidazole in comparison to caffeine). In comparing acetaminophen and procaine, we can see that they have similar general structures (single aromatic ring with a long chain and either an amino or hydroxyl group positioned para to the long chain). Our findings show that procaine, the ligand with the amino group, and subsequent higher hydrophobicity, had a stronger binding affinity to HSA. More research into the role of specific structural groups within the tested drugs is necessary to make further conclusions. Regardless, the data supports the idea that the overall level of hydrophobicity accounts for the most significant portion of binding strength within the tested ligands. Despite the fact that QCM-D is not able to directly measure water displacement, the data in
Figure 2b shows convincingly that hydrophobic ligands bind more strongly to HSA. Background sensor-ligand interactions were assessed by running our drugs on the bare crystal sensor. We noted that the change in mass by this interaction was off from our HSA-ligand interactions by a factor of 7 and our kinetic calculations were off by a factor of 10, indicating no significant role of background activity in acquiring this data.
Similarly to the previous study conducted on BSA-ligand interactions, desipramine displayed an overall negative mass change on QCM-D (−97 ng/cm
2). However, we found that distinct from the BSA study, propranolol also displayed a negative mass change on QCM-D when interacting with HSA (−90.6 ng/cm
2). Due to the discrepancy between the two studies regarding propranolol, we excused it from further analysis. Raw QCM-D mass data of all of the drugs can be found in the
Supplementary Materials. The initial speculation regarding desipramine’s inverted mass profile was interference with the sensor substrate due to desipramine’s structure [
13]. However, that postulation may not be able to explain propranolol causing this negative mass anomaly only on HSA. Perhaps the way that HSA is oriented on the crystal surface has lent itself to a similar interaction with propranolol as desipramine. It may also be speculated that there is an unassessed hydrophobic interaction between HSA and the 2 ligands that has managed to invert their mass profiles, noting that desipramine and propranolol have the highest ClogP values of all of the drugs included in this study (4.47 and 3.48, respectively). Additional studies are needed to explain the inverted behavior of desipramine on HSA/BSA and propranolol’s behavior on HSA. Specifically, it would be interesting to investigate what structural difference between HSA and BSA would account for propranolol’s inverted mass reading only showing up on HSA. Key structural differences between the two proteins, such as BSA’s increased rigidity or HSA’s higher overall hydrophobicity may be valuable objects of inquiry [
7,
8].
Experimentally measured binding coefficients are seen to differ among our group of ligands when interacting with either BSA or HSA, although the general strength of binding is similar between the two forms of albumin, and the QSAR slopes are comparable (
Figure 2c). The reported QSAR slopes are 0.2607 ± 0.03888 and 0.2116 ± 0.02324 for HSA and BSA, respectively (
Figure 2b,c), values that are not statistically significant from one another. The comparability of these relationships, as obtained from interspecies-derived forms of albumin, and investigated through their 2-dimensional surface interactions via QCM provides additional data supporting the use of BSA as a reasonable surrogate for human albumin. It is interesting to note in passing that the similarity of QSAR slope occurs despite the difference in K
D values from individual candidate ligands. Additionally, among the drugs with low ClogP values, the compounds exhibited relatively similar binding strength for both HSA and BSA (
Figure 2a). It may be postulated through the QSAR that the deciding factor of protein-ligand binding strength is the hydrophobicity of the ligand and how much water it can displace, alluding to the hydration thermodynamic model of ligand association given by Baron, Setny, and Mcammon [
5,
6] and the integral role of water in HSA-ligand interactions. These observations point to the need for testing a range of ligands in this manner, over a spectrum of ClogP values, to achieve an appropriate understanding of the true relationship.
Lastly, it is important to keep in mind that the conformation of HSA and its behavior in interacting with the ligands studied in this work is not fully representative of HSA’s behavior in vivo. In normal physiological conditions, between 0.1 and 2 moles of fatty acids are complexed with HSA, constantly interacting with the protein’s hydrophobic binding sites and the body’s aqueous environment [
8]. While this factor does not cloud the direct comparisons drawn between HSA and BSA as they were analyzed under identical conditions, it does call into question the true kinetic behavior of HSA with regards to ligand interactions.


