
A Limited-Scope Probabilistic Risk Assessment Study to Risk-Inform the Design of a Fuel Storage System for Spent Pebble-Filled Dry Casks


Abstract
:1. Introduction
1.1. Background of the Dry Cask Storage System and Very High-Temperature Gas Reactor
1.2. Research Objective
2. Methodology
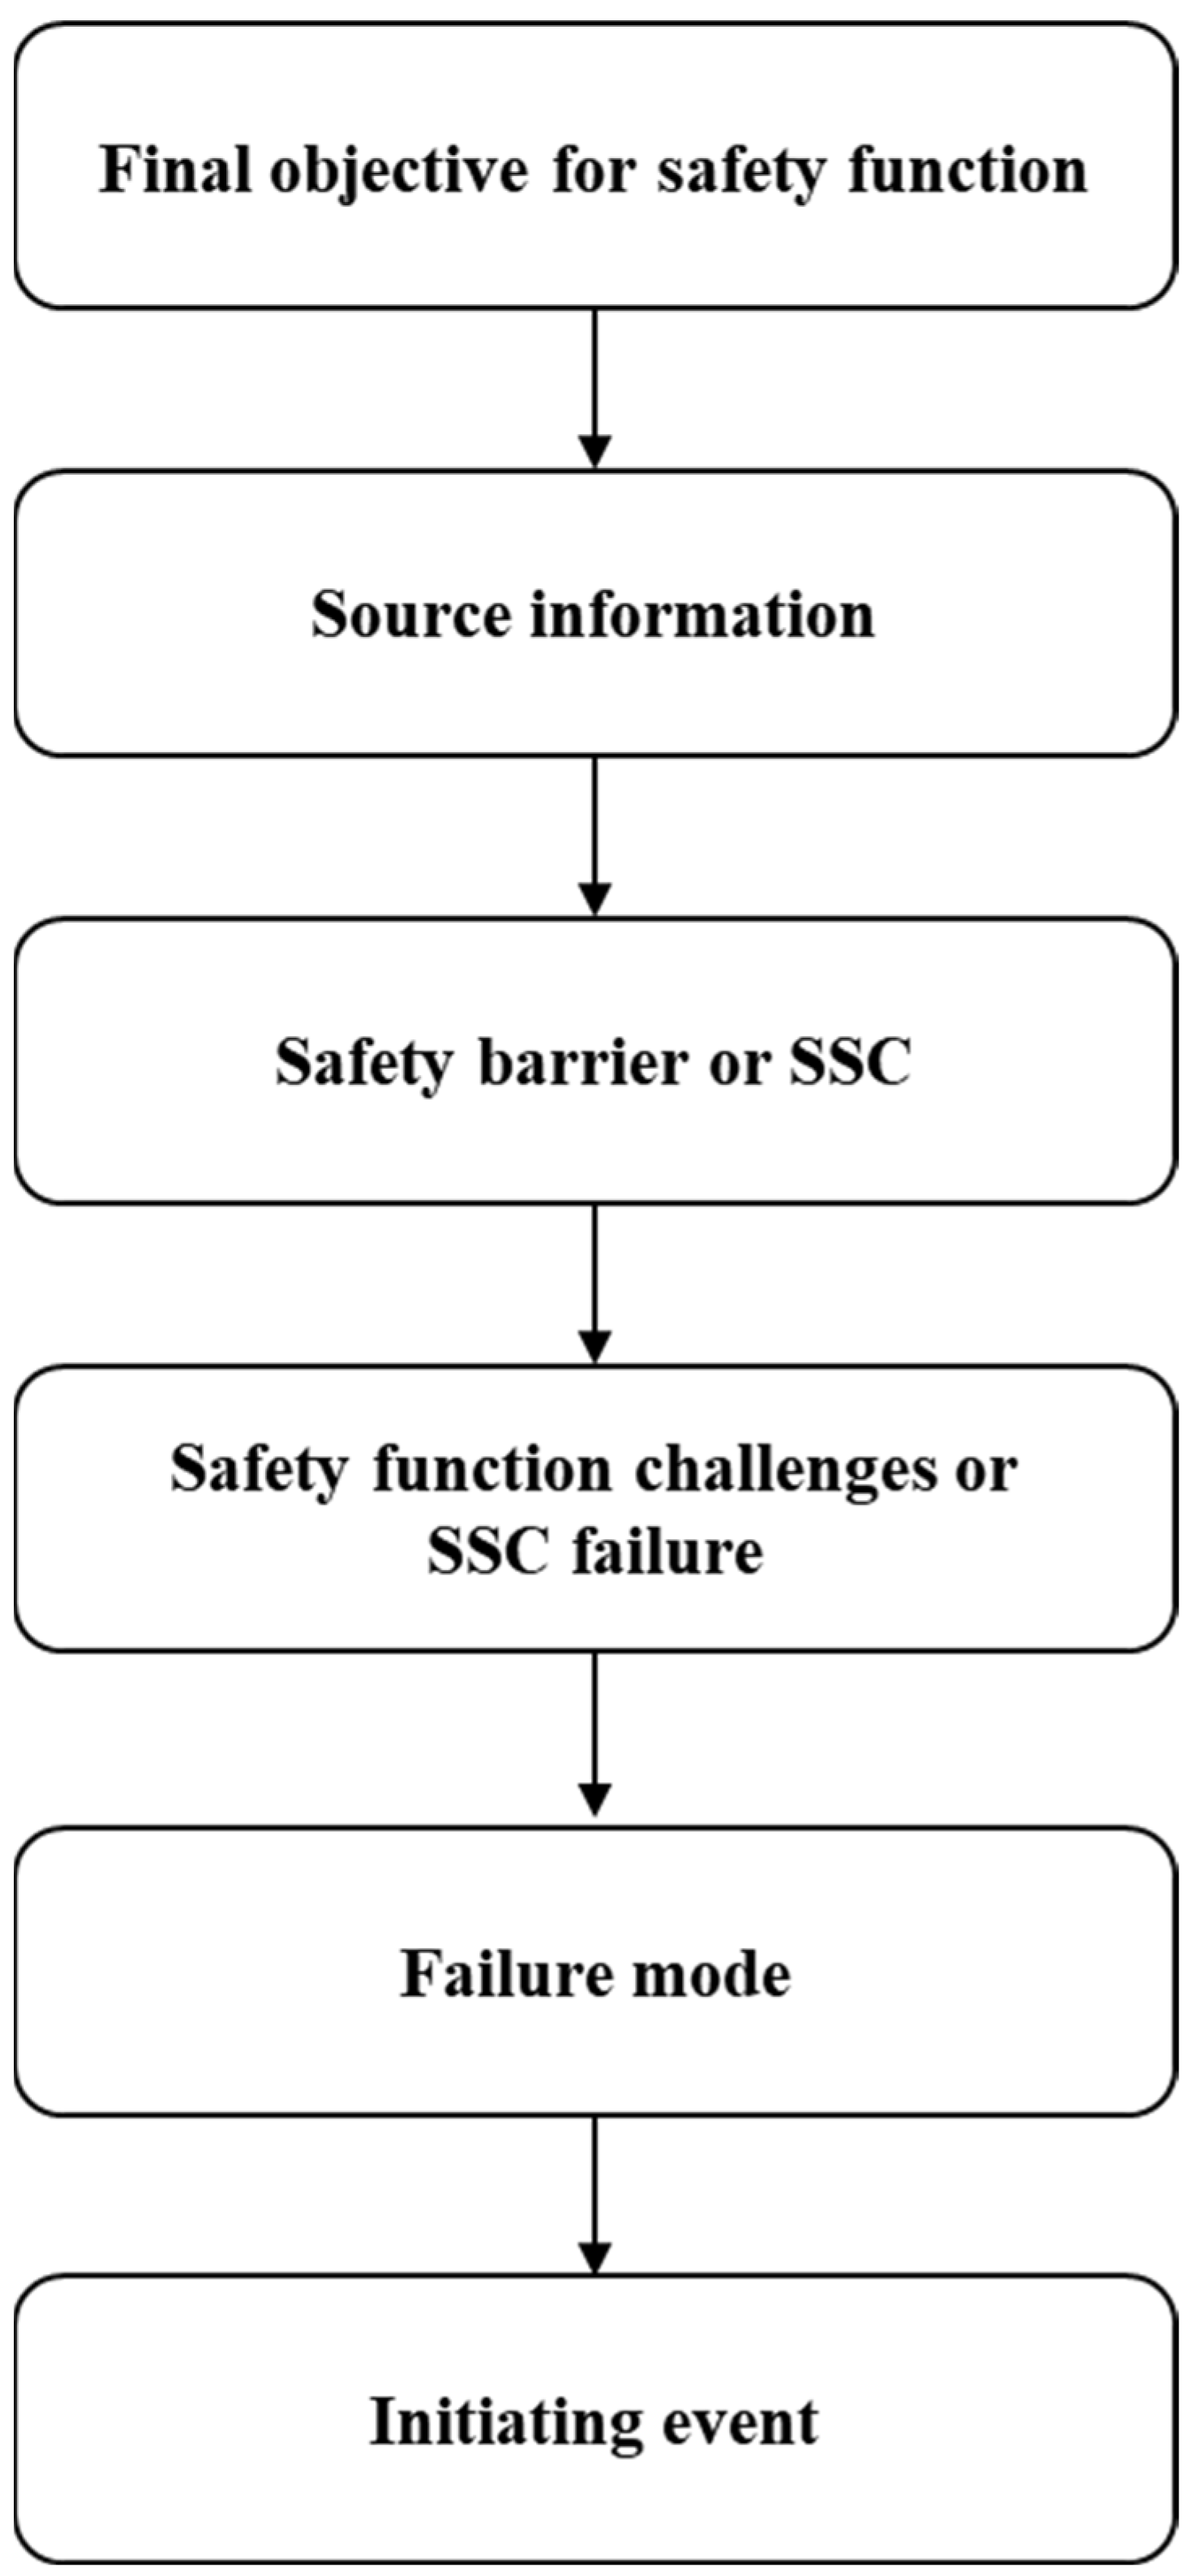
2.1. Initiating Event Identification
- Master Logic Diagram
- Heat Balance Fault Tree
- Failure Mode and Effects Analysis
- Hazard and Operability Analysis
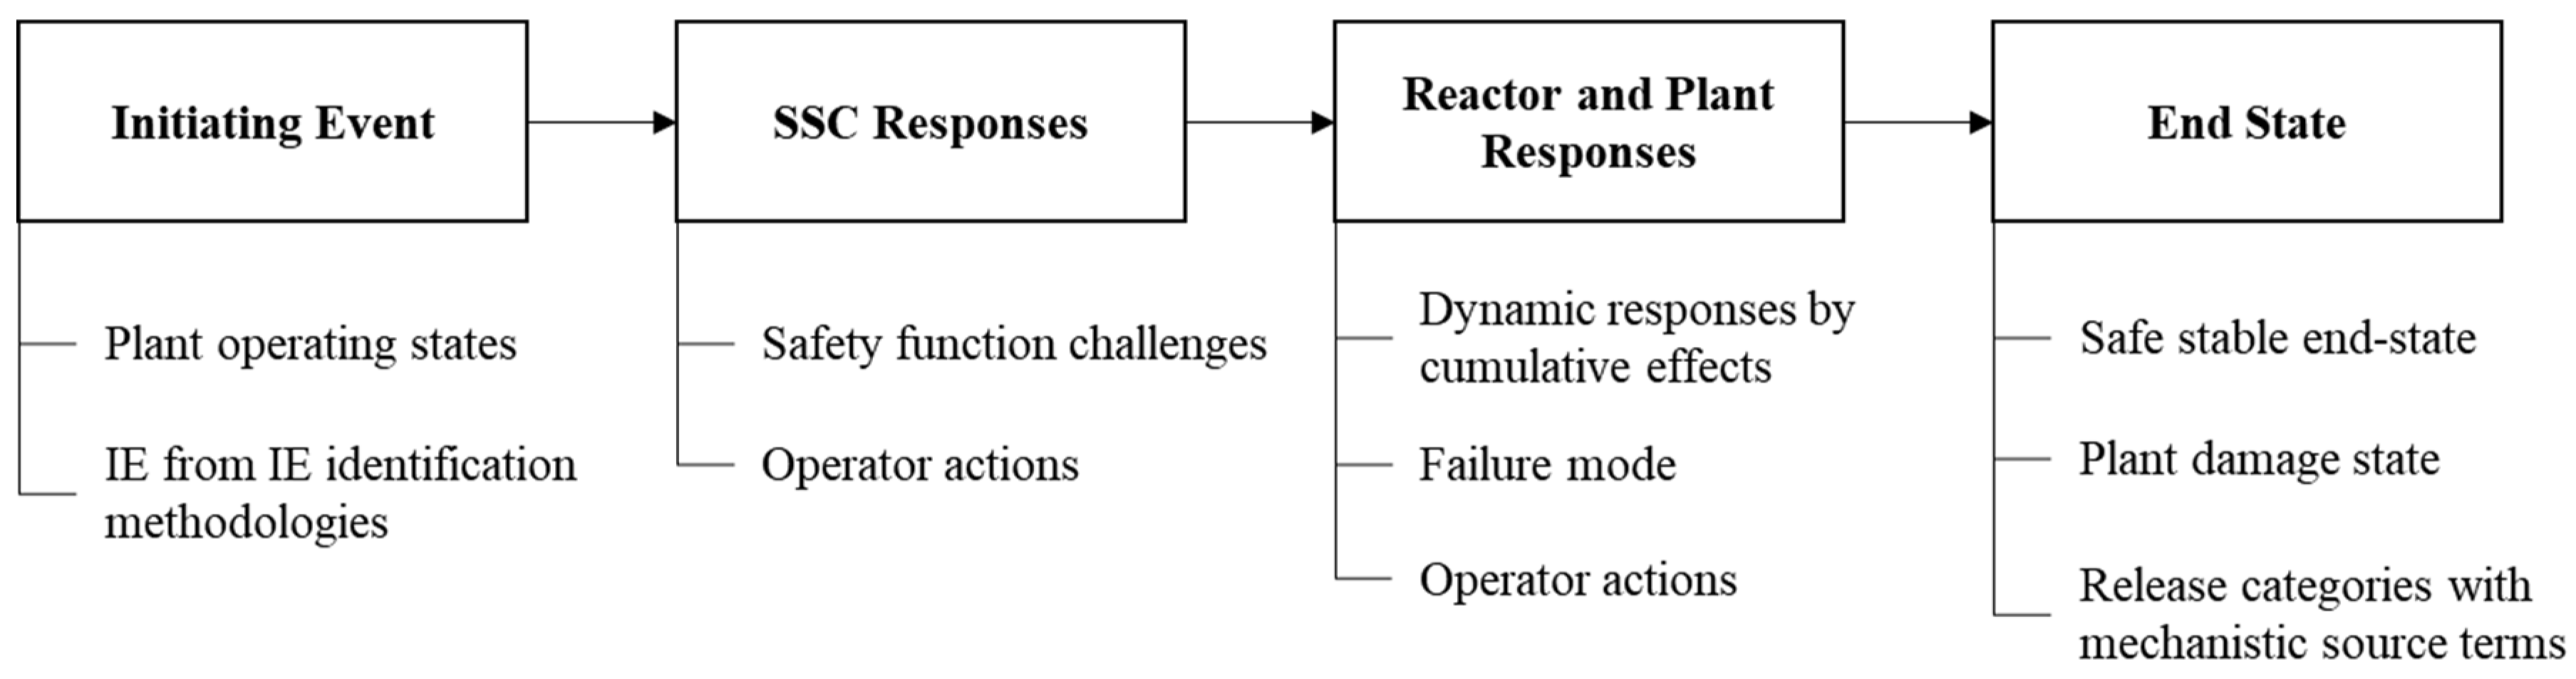
2.2. Event Sequence Analysis
2.3. Data Analysis
2.4. Event Sequence Quantification
2.5. Mechanistic Source Term Analysis
2.6. Radiological Consequence Analysis
2.7. Risk Integration
3. Pebble Fuel-Filled Dry Cask PRA
3.1. Workflow
- (1)
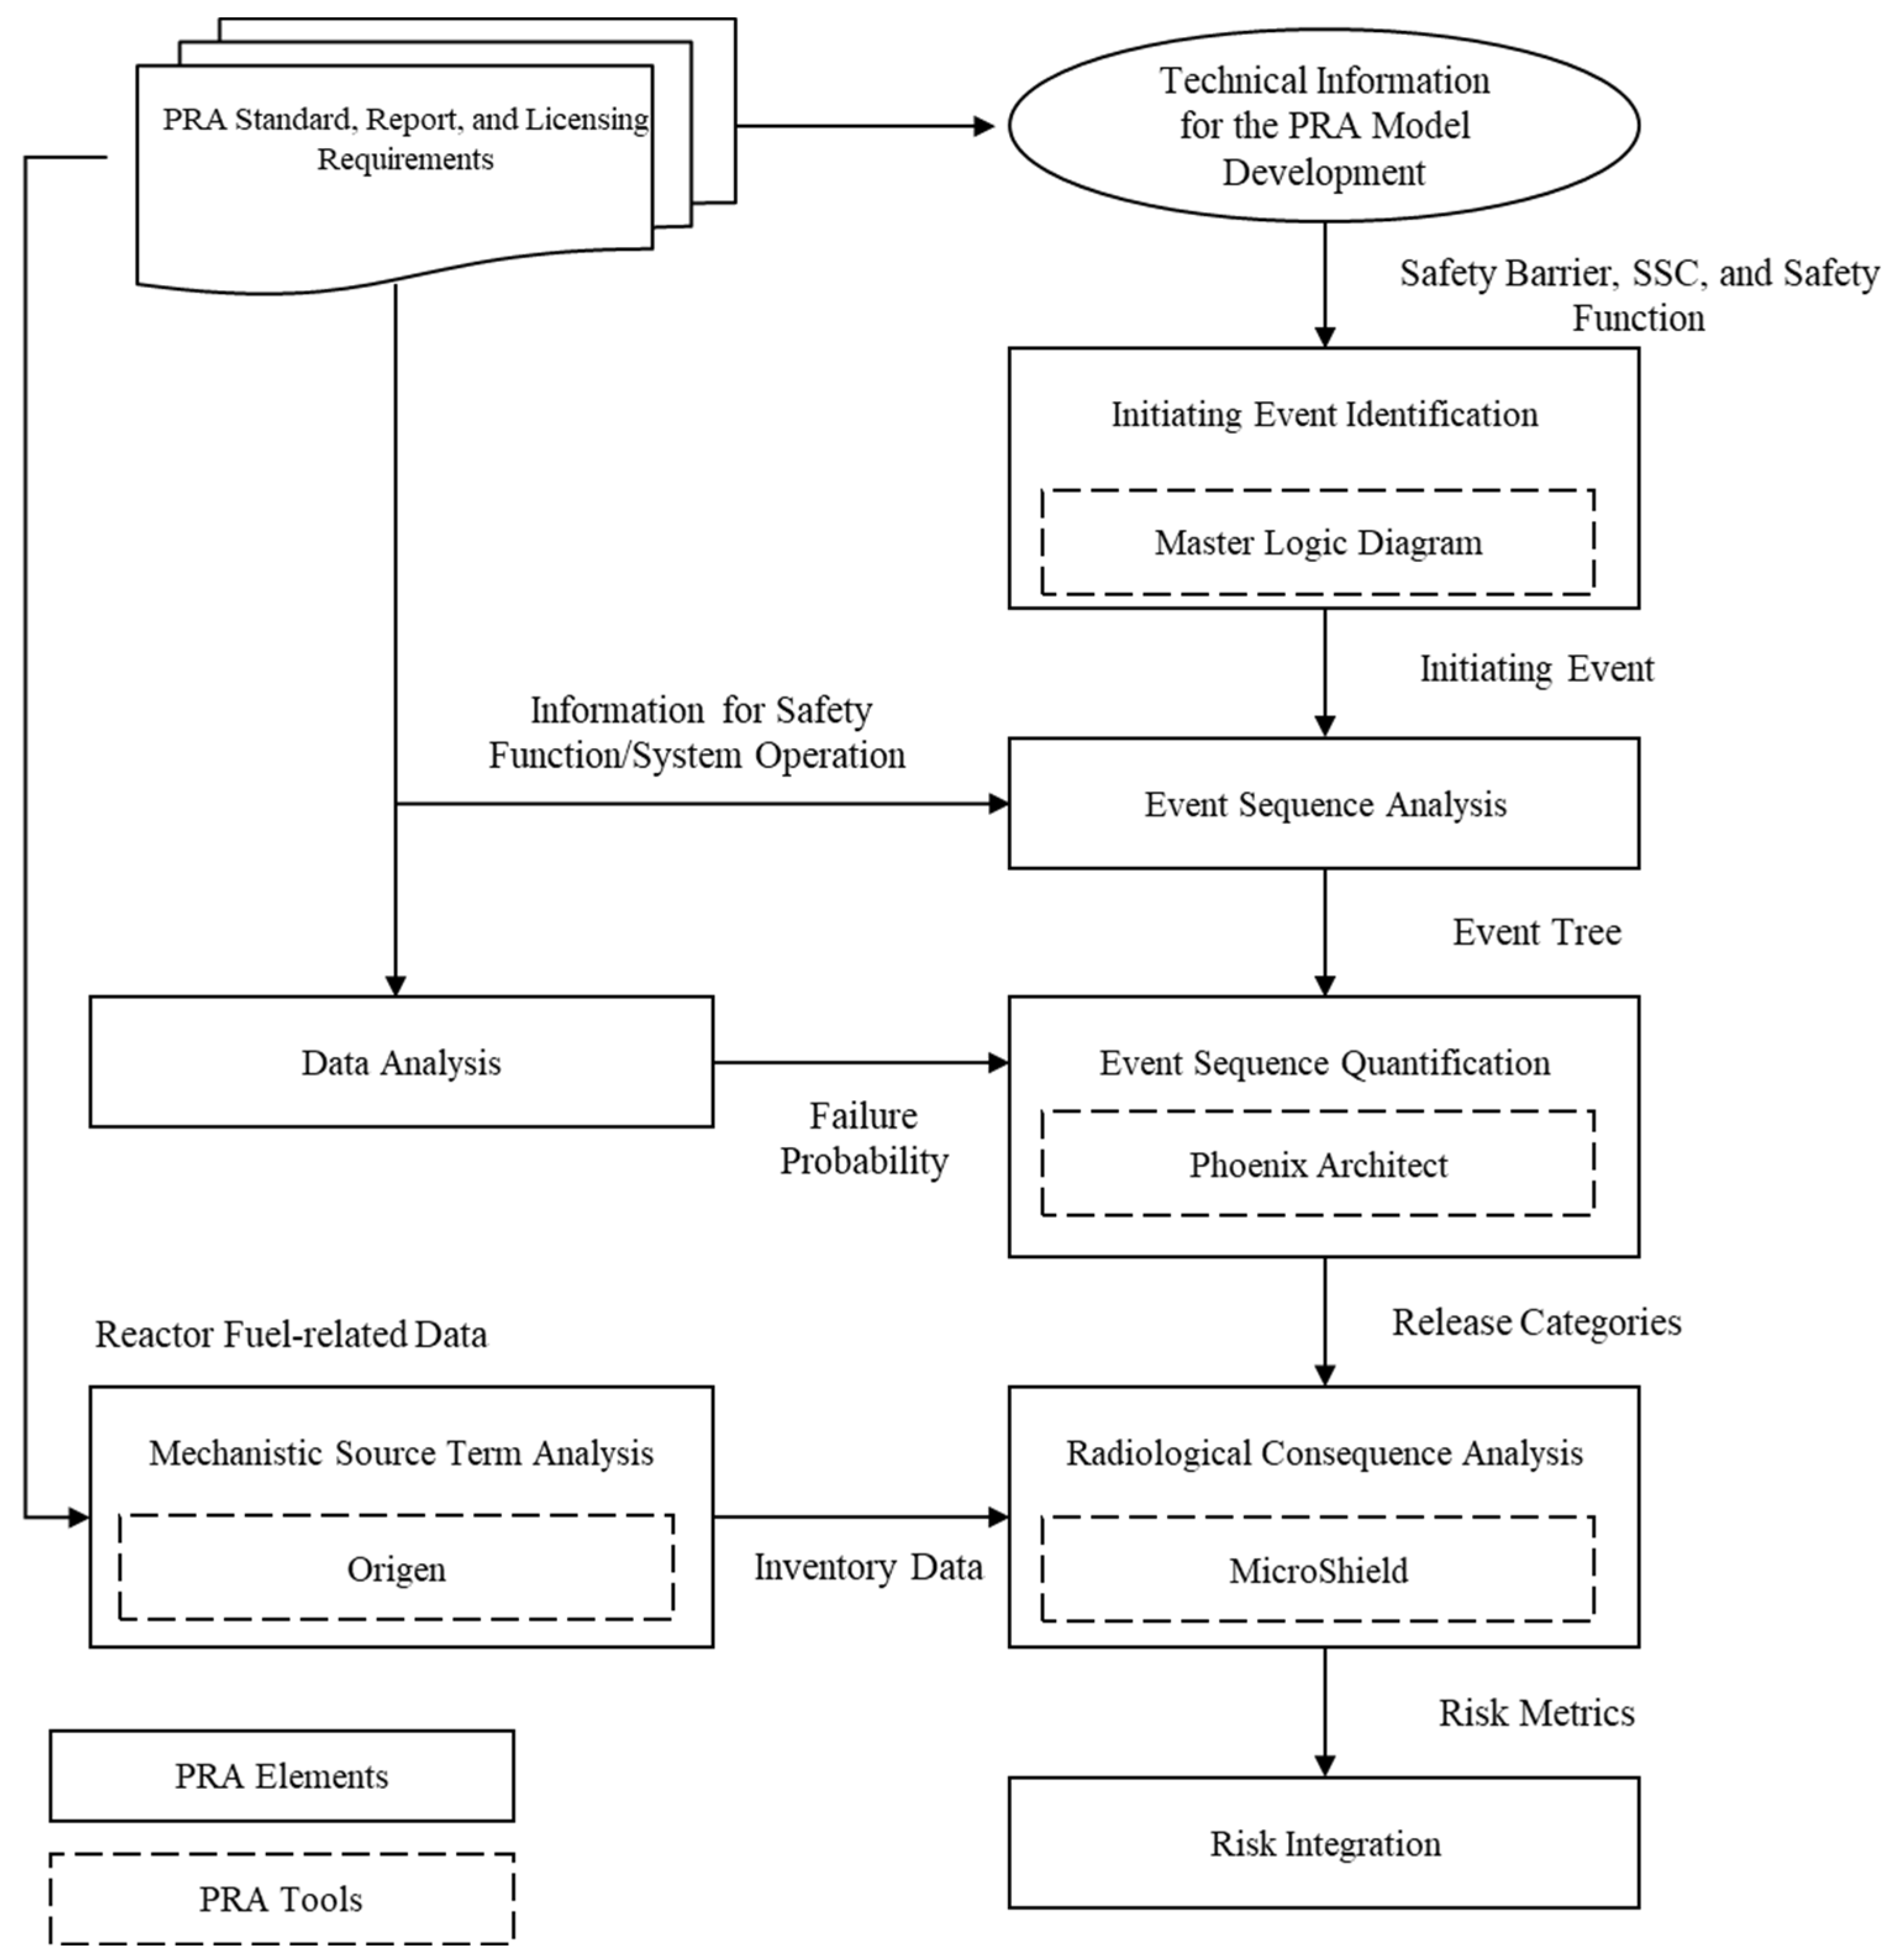
- Based on the PRA documents including PRA standard, PRA-related reports, and licensing requirements, various data and information are collected and refined to be used as materials for each PRA element or PRA analysis tool. For example, technical information from the pilot PRA study for a dry cask storage system [5] provides safety function-related information to establish the MLD for IE identification.
- (2)
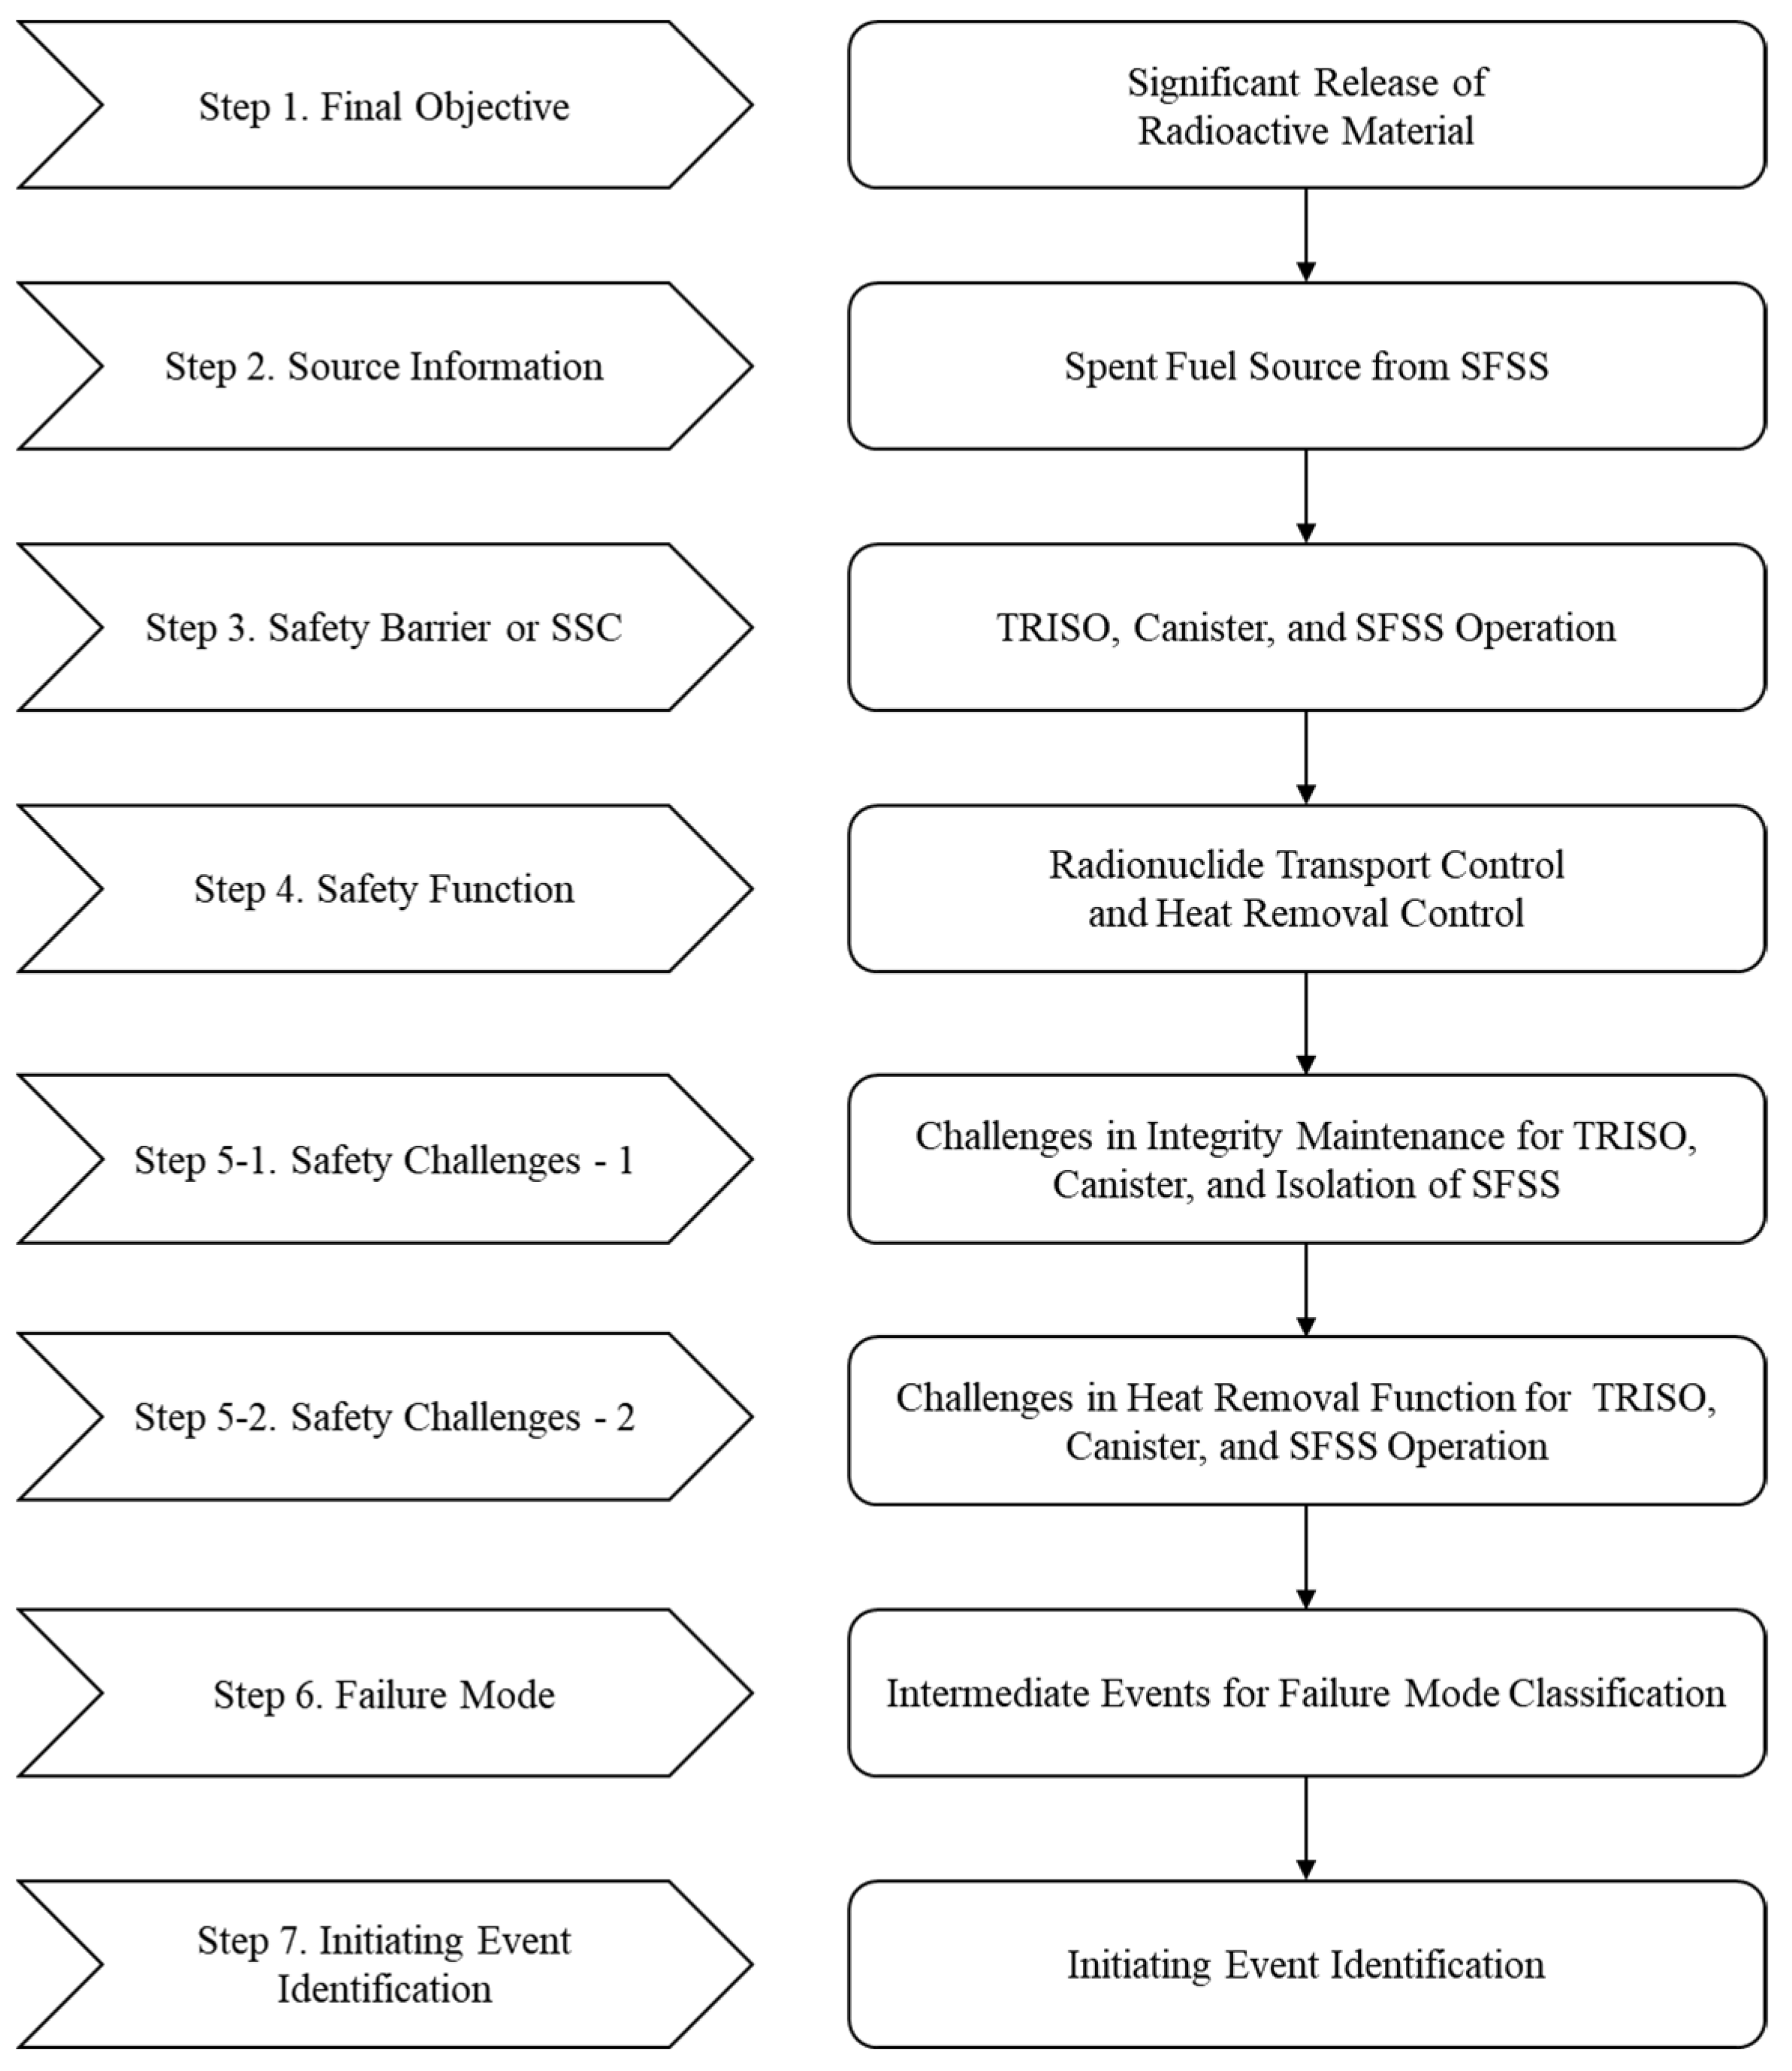
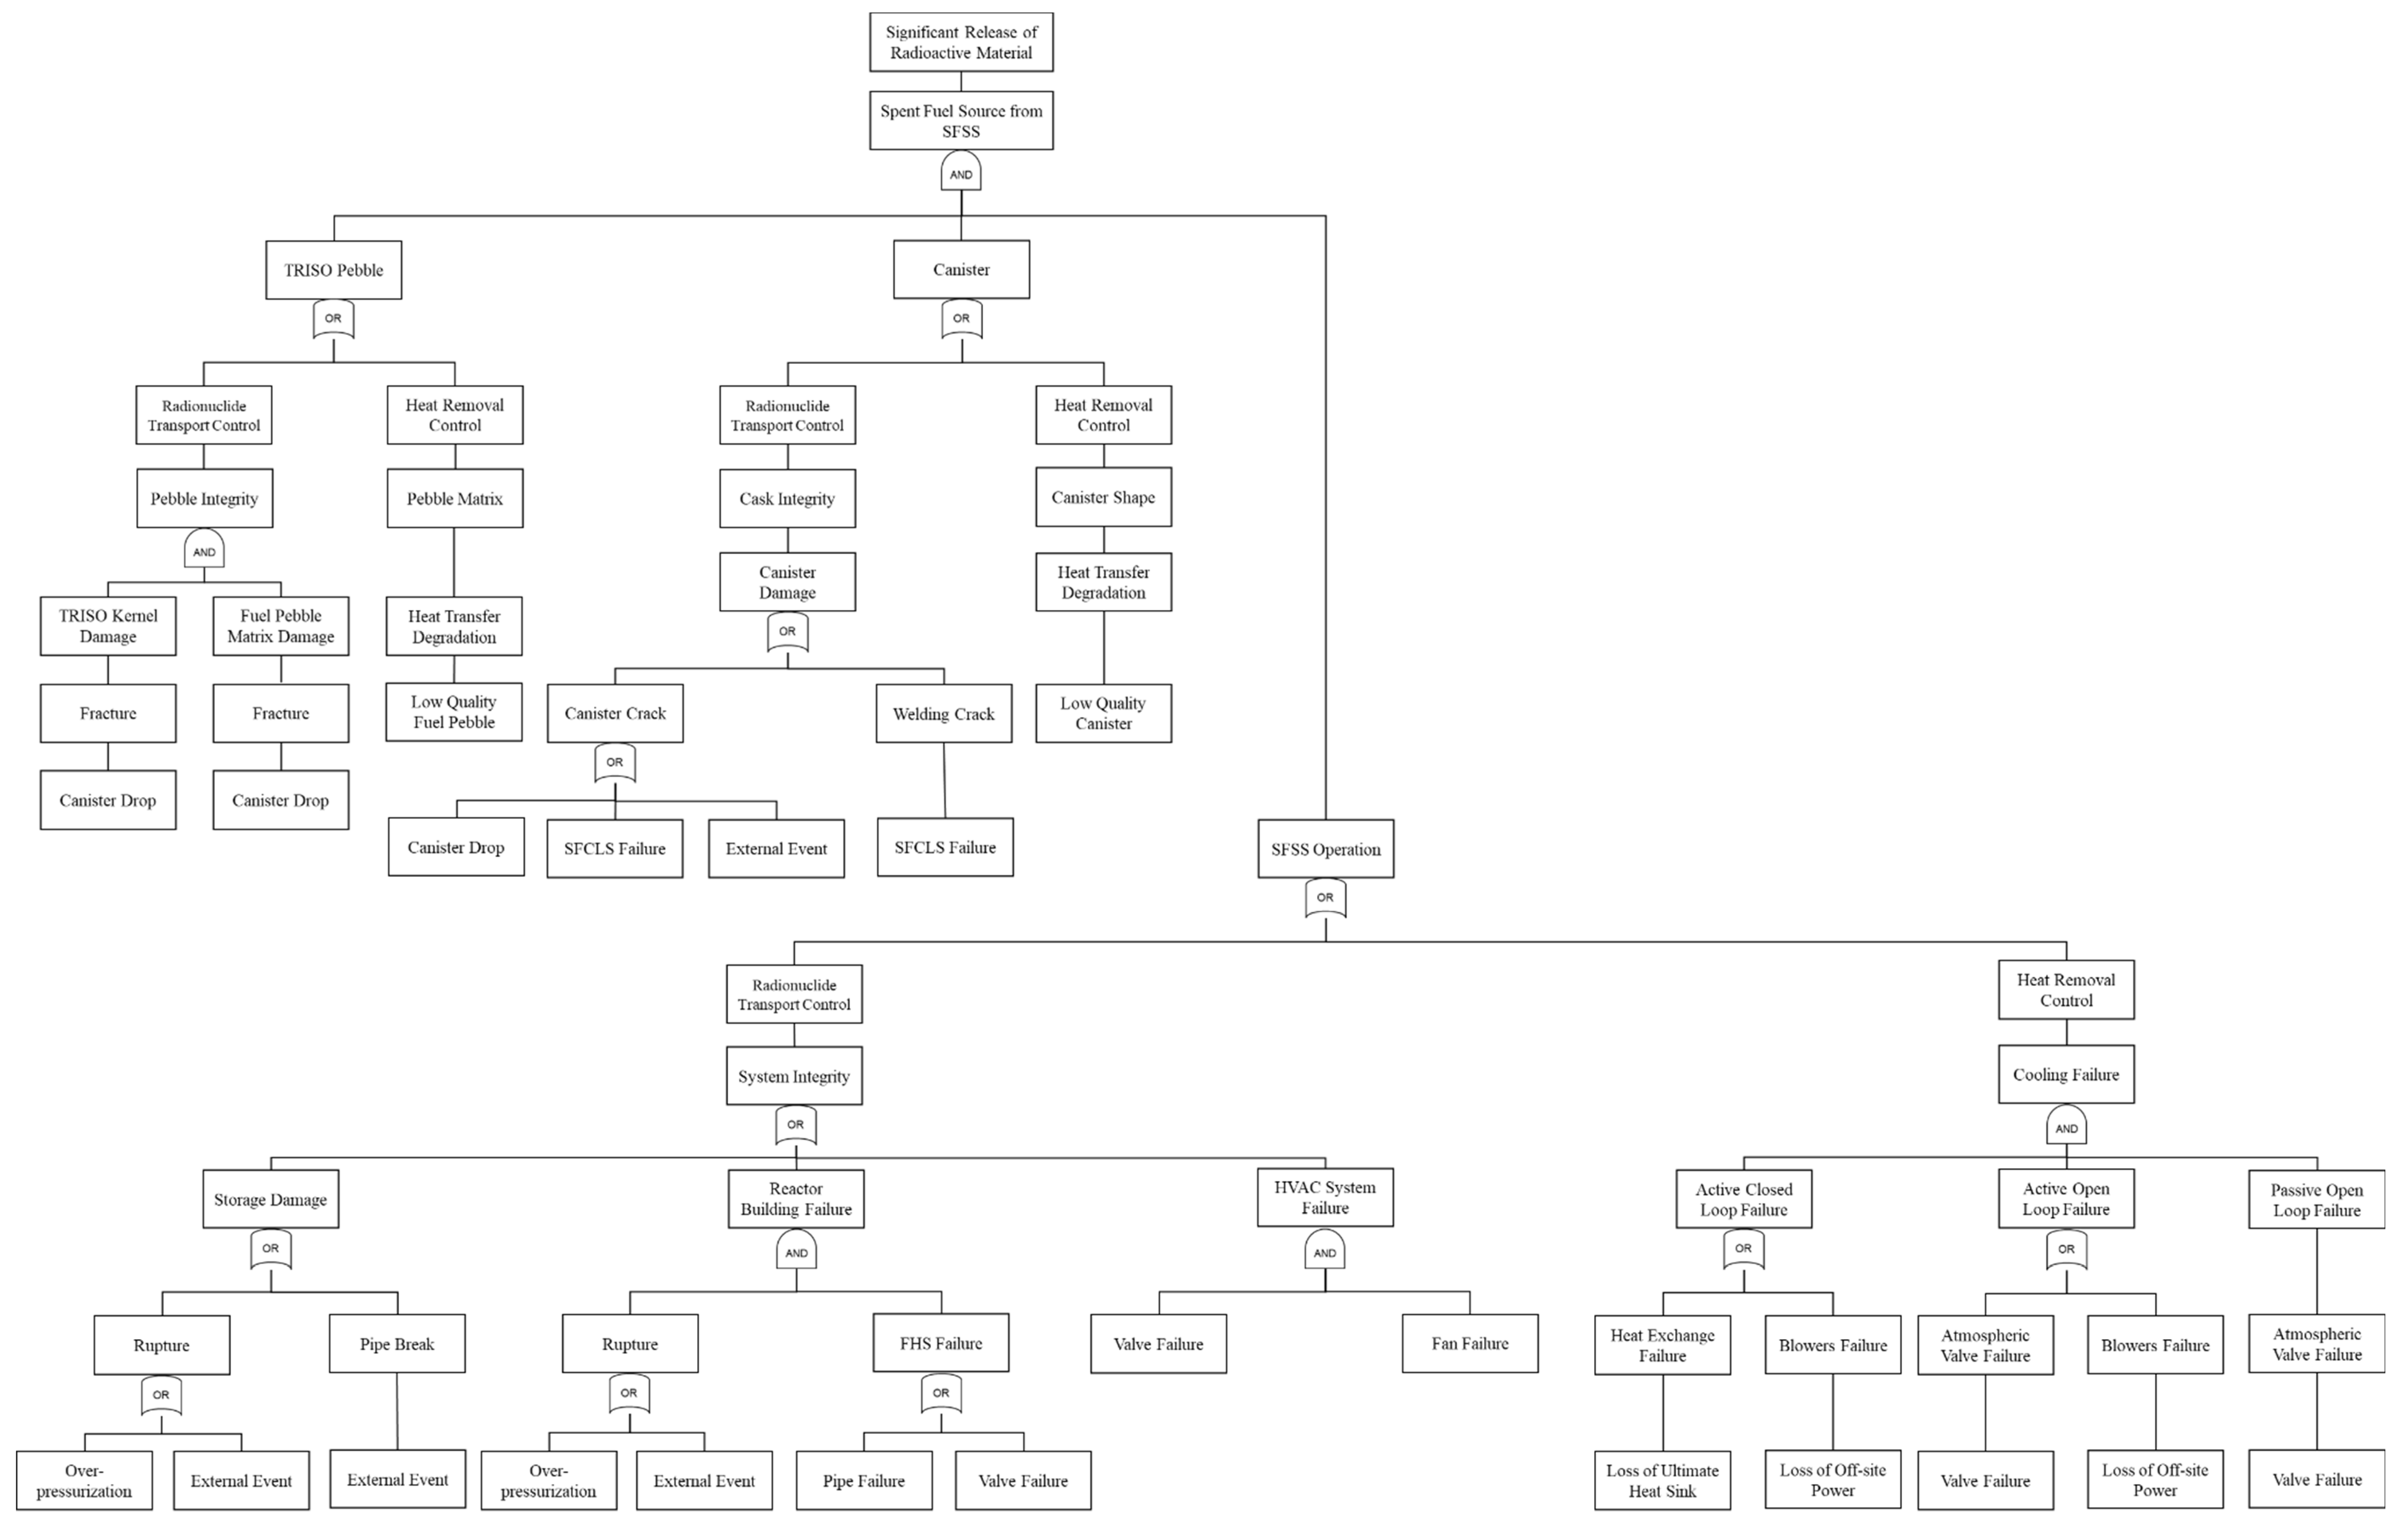
- From the technical information, the MLD enables to identify the IEs by presenting the causes and effects of the influential failure factors from the final consequences.
- (3)
- Safety function/system information is utilized from the PRA documents to determine the event sequence that maneuvers the event scenario from the IE onto the end states.
- (4)
- Same as in the previous steps, the PRA documents are referred to extract and estimate the failure probability of the determined event sequences.
- (5)
- ESQ is implemented by the Phoenix Architect with the event tree from the ESA and the assumed probability from the DA processes. In this study, CAFTA, PRAQuant, and UNCERT modules are used to develop the fault tree/event tree, quantify the event tree sequences, and perform the uncertainty analysis, respectively.
- (6)
- For MST analysis, pebble fuel data and release fraction information from the PRA documents are used to tabulate the fuel inventory data for the consequence analysis. ORGIEN 2.2. is used to calculate the nuclide composition and activity of fuel.
- (7)
- The RCA is performed to simulate the transport of the radioactive nuclides from the source established in the MST analysis according to the release categories by deploying the MicroShield.
- (8)
- Finally, the risk is evaluated with consideration of frequency and consequence in accordance with the release categories.
3.2. System Description
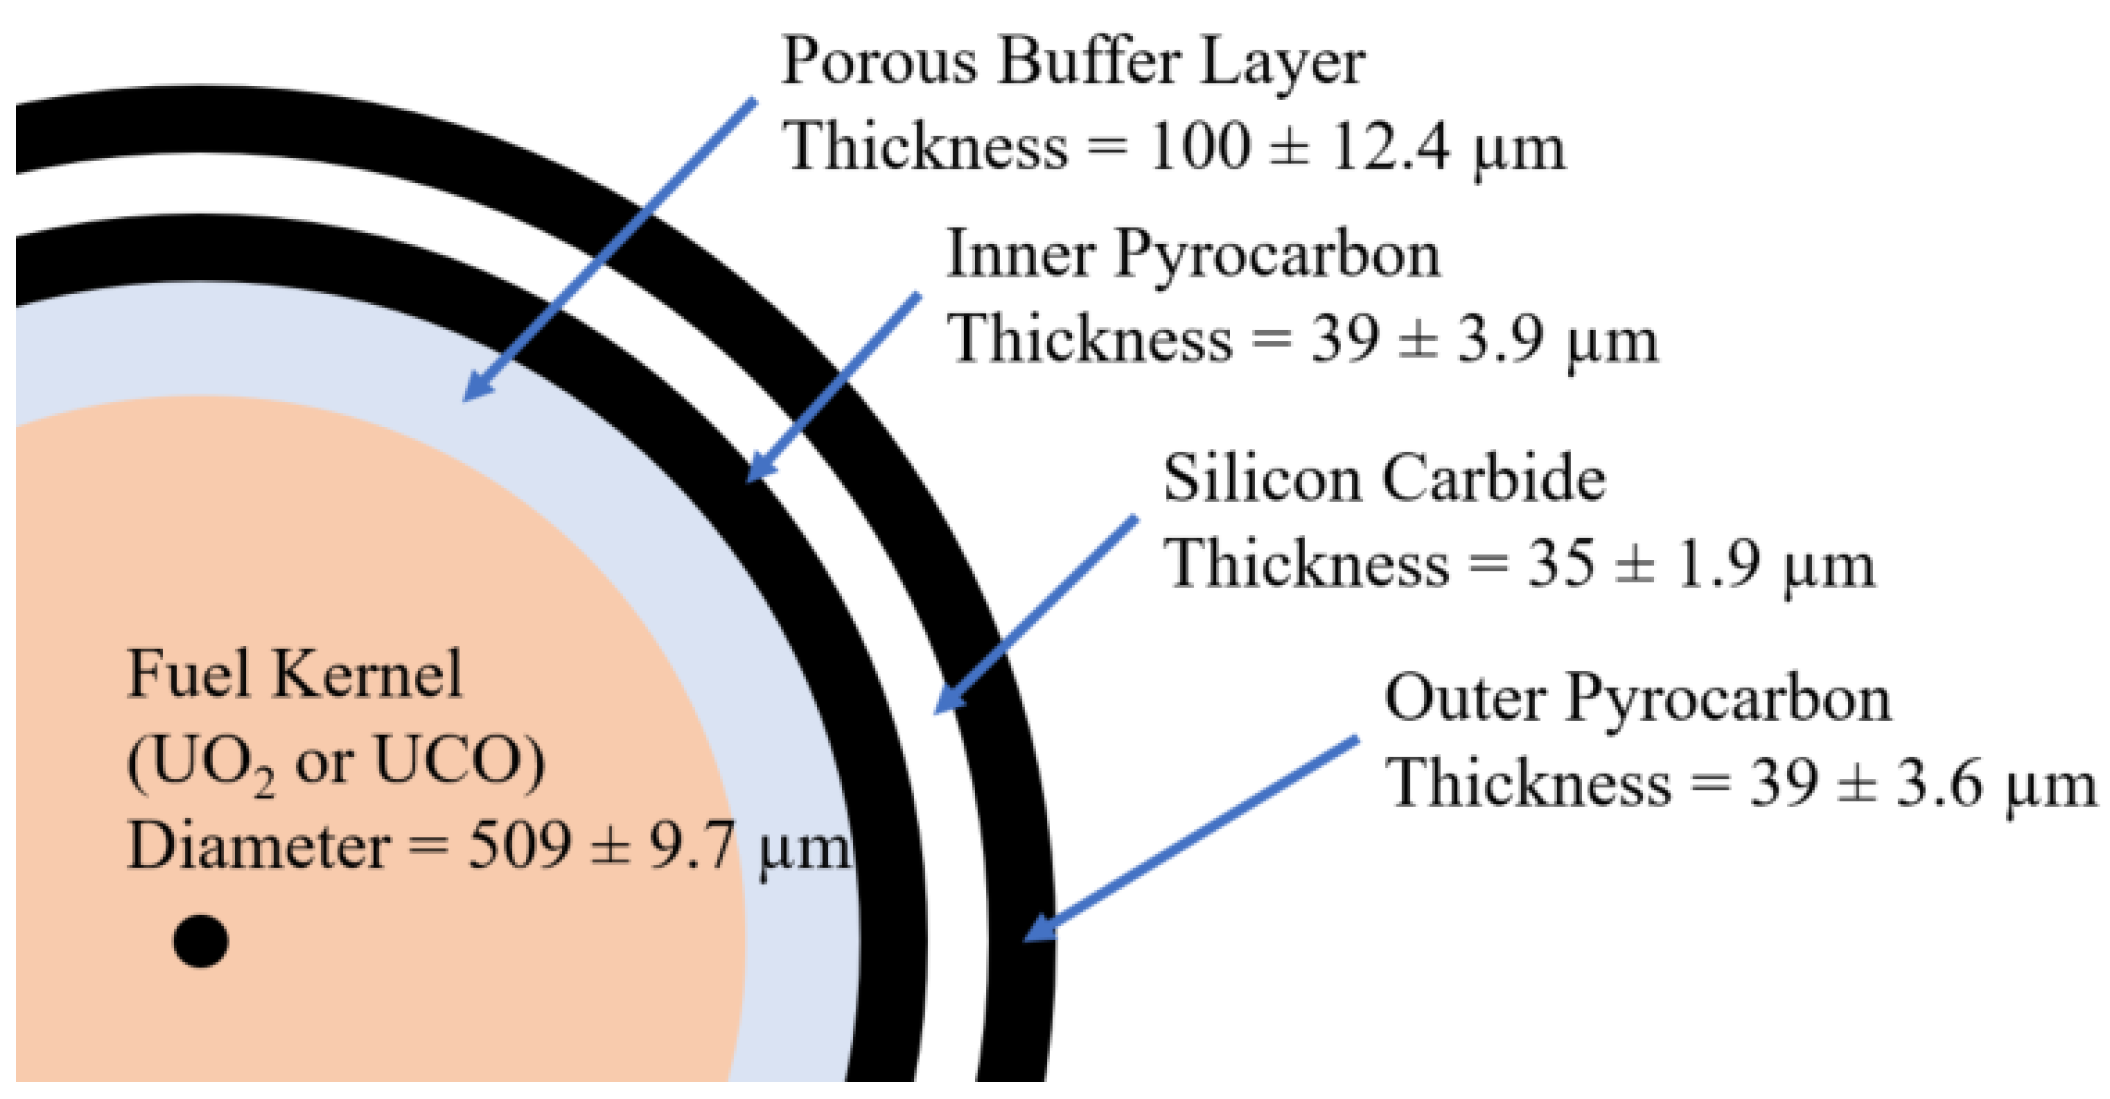
3.2.1. TRISO Particle and Canister
3.2.2. Dry Cask Storage System
- classifying fuel elements into the serviceable fuel element, the spent fuel element, and the graphite element by the direction converter with a burn-up device and retriever device,
- loading the classified elements into the cask or returning them back to the reactor core through the FHS,
- welding the full-filled canister by automatic machine,
- safely stacking the canisters (up to five) into a silo in the storage well by the crane and the hoister,
- and self-cleaning the pipelines by using blowers and iodine/dust filters.
- Safe stacking: A buffer seat at the bottom of the well protects the canister from dropping accident by structure or mechanistic failure. There are guiding rails and rail seats to load the canisters smoothly.
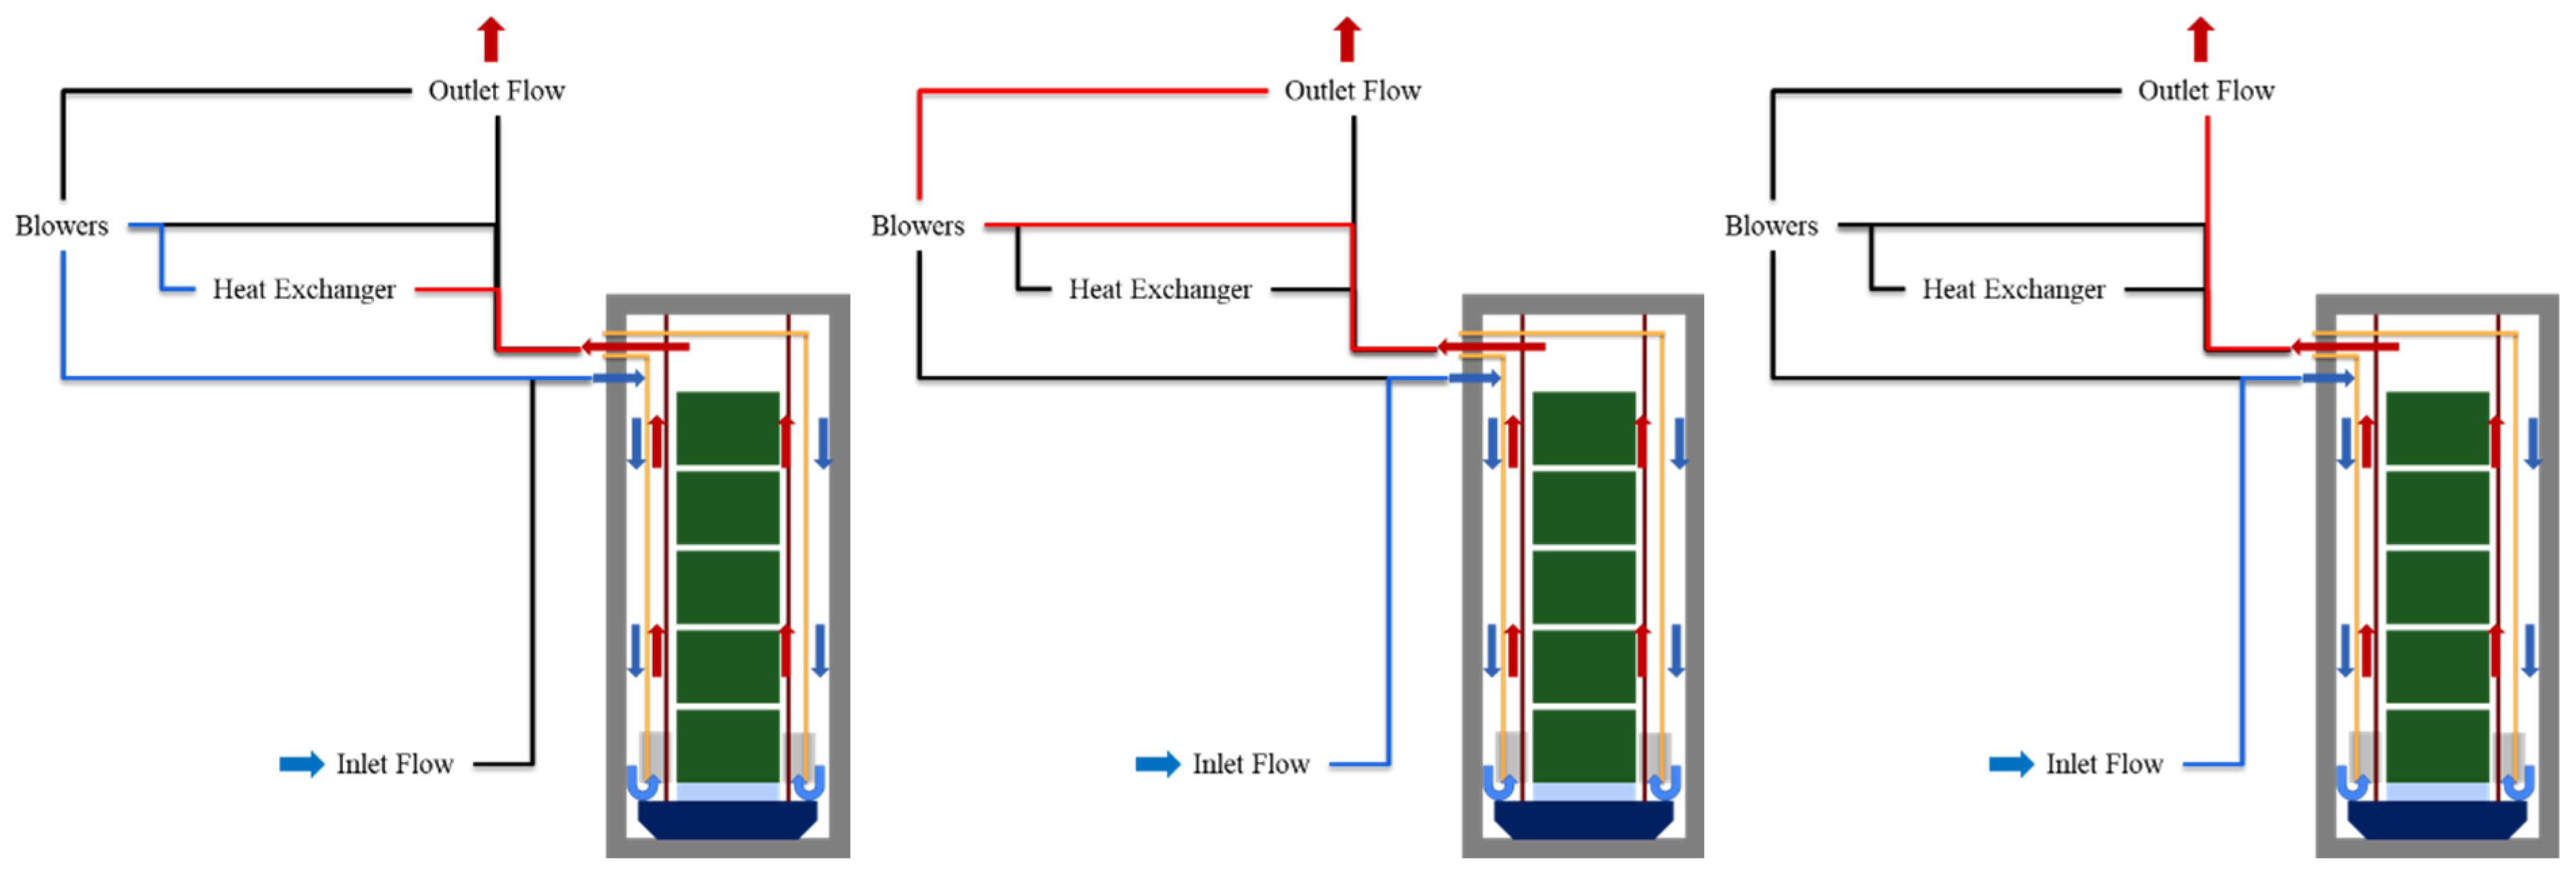
- Residual heat removal: Three cooling modes are operated in the SFSS to remove decay heat from the pebbles: closed loop active mode, open loop active mode, and open loop passive mode. Table 2 and Figure 5 demonstrate the details of the cooling modes. As Figure 5 shows below, the cold inlet air flows between the wall and barrel, then the air flows upward between the barrel and canister to the outlet pipe.
- Radiation shielding: Besides graphite mix within a fuel pebble, a 304 L stainless steel canister and concrete wall ensure the prevention of radioactive release to the environment.
4. Case Study
4.1. Event Description and Case Study Assumptions
- ✓
- Assumptions for IE identification and ESA
- (1)
- There is no SFCLS operation failure or storage building damage during conveying the spent fuels from the FHS to the canister.
- (2)
- There is no residual heat transfer failure caused by low-quality pebble geometry, canister defect, or SFSS cooling mode failure.
- (3)
- There is no concrete wall (silo well) damage while the canister drops.
- (4)
- The fuel particle coating and the graphite mixture in the pebble are not considered as the separated safety barrier for TRISO fuel failure. As mentioned above, the fuel kernel is protected by pyro-carbon layers with silicon carbide and core graphite in the pebble, however, radionuclide release happens when the TRISO is damaged.
- (5)
- Due to improper crane movement, a canister vertically falls onto the concrete floor in the silo. The drop height is varied: 30 m, 25 m, 20 m, 15 m, and 10 m drop height.
- (6)
- It is assumed that the HVAC system is identical to the HVAC system of the secondary containment isolation system for a dry cask storage system from the NUREG-1864 [5]. Therefore, HVAC failure leads to radioactive release directly into the environment bypassing the containment or building.
- ✓
- Assumptions for DA and ESQ
- (1)
- It is assumed that the HVAC system is identical with the HVAC system of the secondary containment isolation system for a dry cask storage system from the NUREG-1864 [5].
- (2)
- Failure probability due to the impact of the canister drop is assumed by linear interpolation based on given data from [5,69]. Since the failure probability is assumed because of a lack of information, its distribution is induced by the Jeffreys noninformative prior to minimize the influence of the prior input and maximize the influence of the likelihood function [70].
- ✓
- Assumptions for MST
- (1)
- The reactor operates in a steady-state mode, where the neutron flux and power level are constant over time. This assumption simplifies the calculations by allowing the use of averaged parameters and eliminates the need for time-dependent calculations.
- (2)
- The fuel is homogeneous and well-mixed, and the temperature distribution is uniform throughout the fuel. This assumption simplifies the modeling of fuel behavior and allows for a more direct calculation of the isotopic composition of the fuel.
- (3)
- Each pebble does not move during operation, so the geometry of the fuel at the beginning of the cycle remains constant over time. This assumption simplifies the modeling of fuel behavior and allows for a more efficient calculation of the isotopic composition of the fuel.
- (4)
- The fuel resident time in the reactor is assumed to be 3 years at full power.
- ✓
- Assumptions for RCA and RI
- (1)
- The 1 MeV energy level is used as the representative energy level for the modeling and analysis of fission product behavior. The behavior of fission products during undesired release to the environment can be complex and is influenced by several factors such as their physical and chemical properties, release characteristics, atmospheric and meteorological conditions, and energy levels. However, to simplify modeling and analysis of dry cask storage system failure, a single energy level is assumed for all fission products. This assumption allows for a more efficient analysis of fission product transport, retention, and release in the event of dry cask storage system accidents. Therefore, selecting 1 MeV allows for the modeling and analysis of fission product behavior to be simplified, as it provides a suitable approximation for many fission products. However, it should be noted that this assumption may not accurately represent the behavior of all fission products in all scenarios, and more detailed modeling might be necessary to investigate in future work. The use of a 1 MeV energy is discussed in relation to fission product transport and deposition, as well as radiological consequences [71,72,73].
- (2)
- (3)
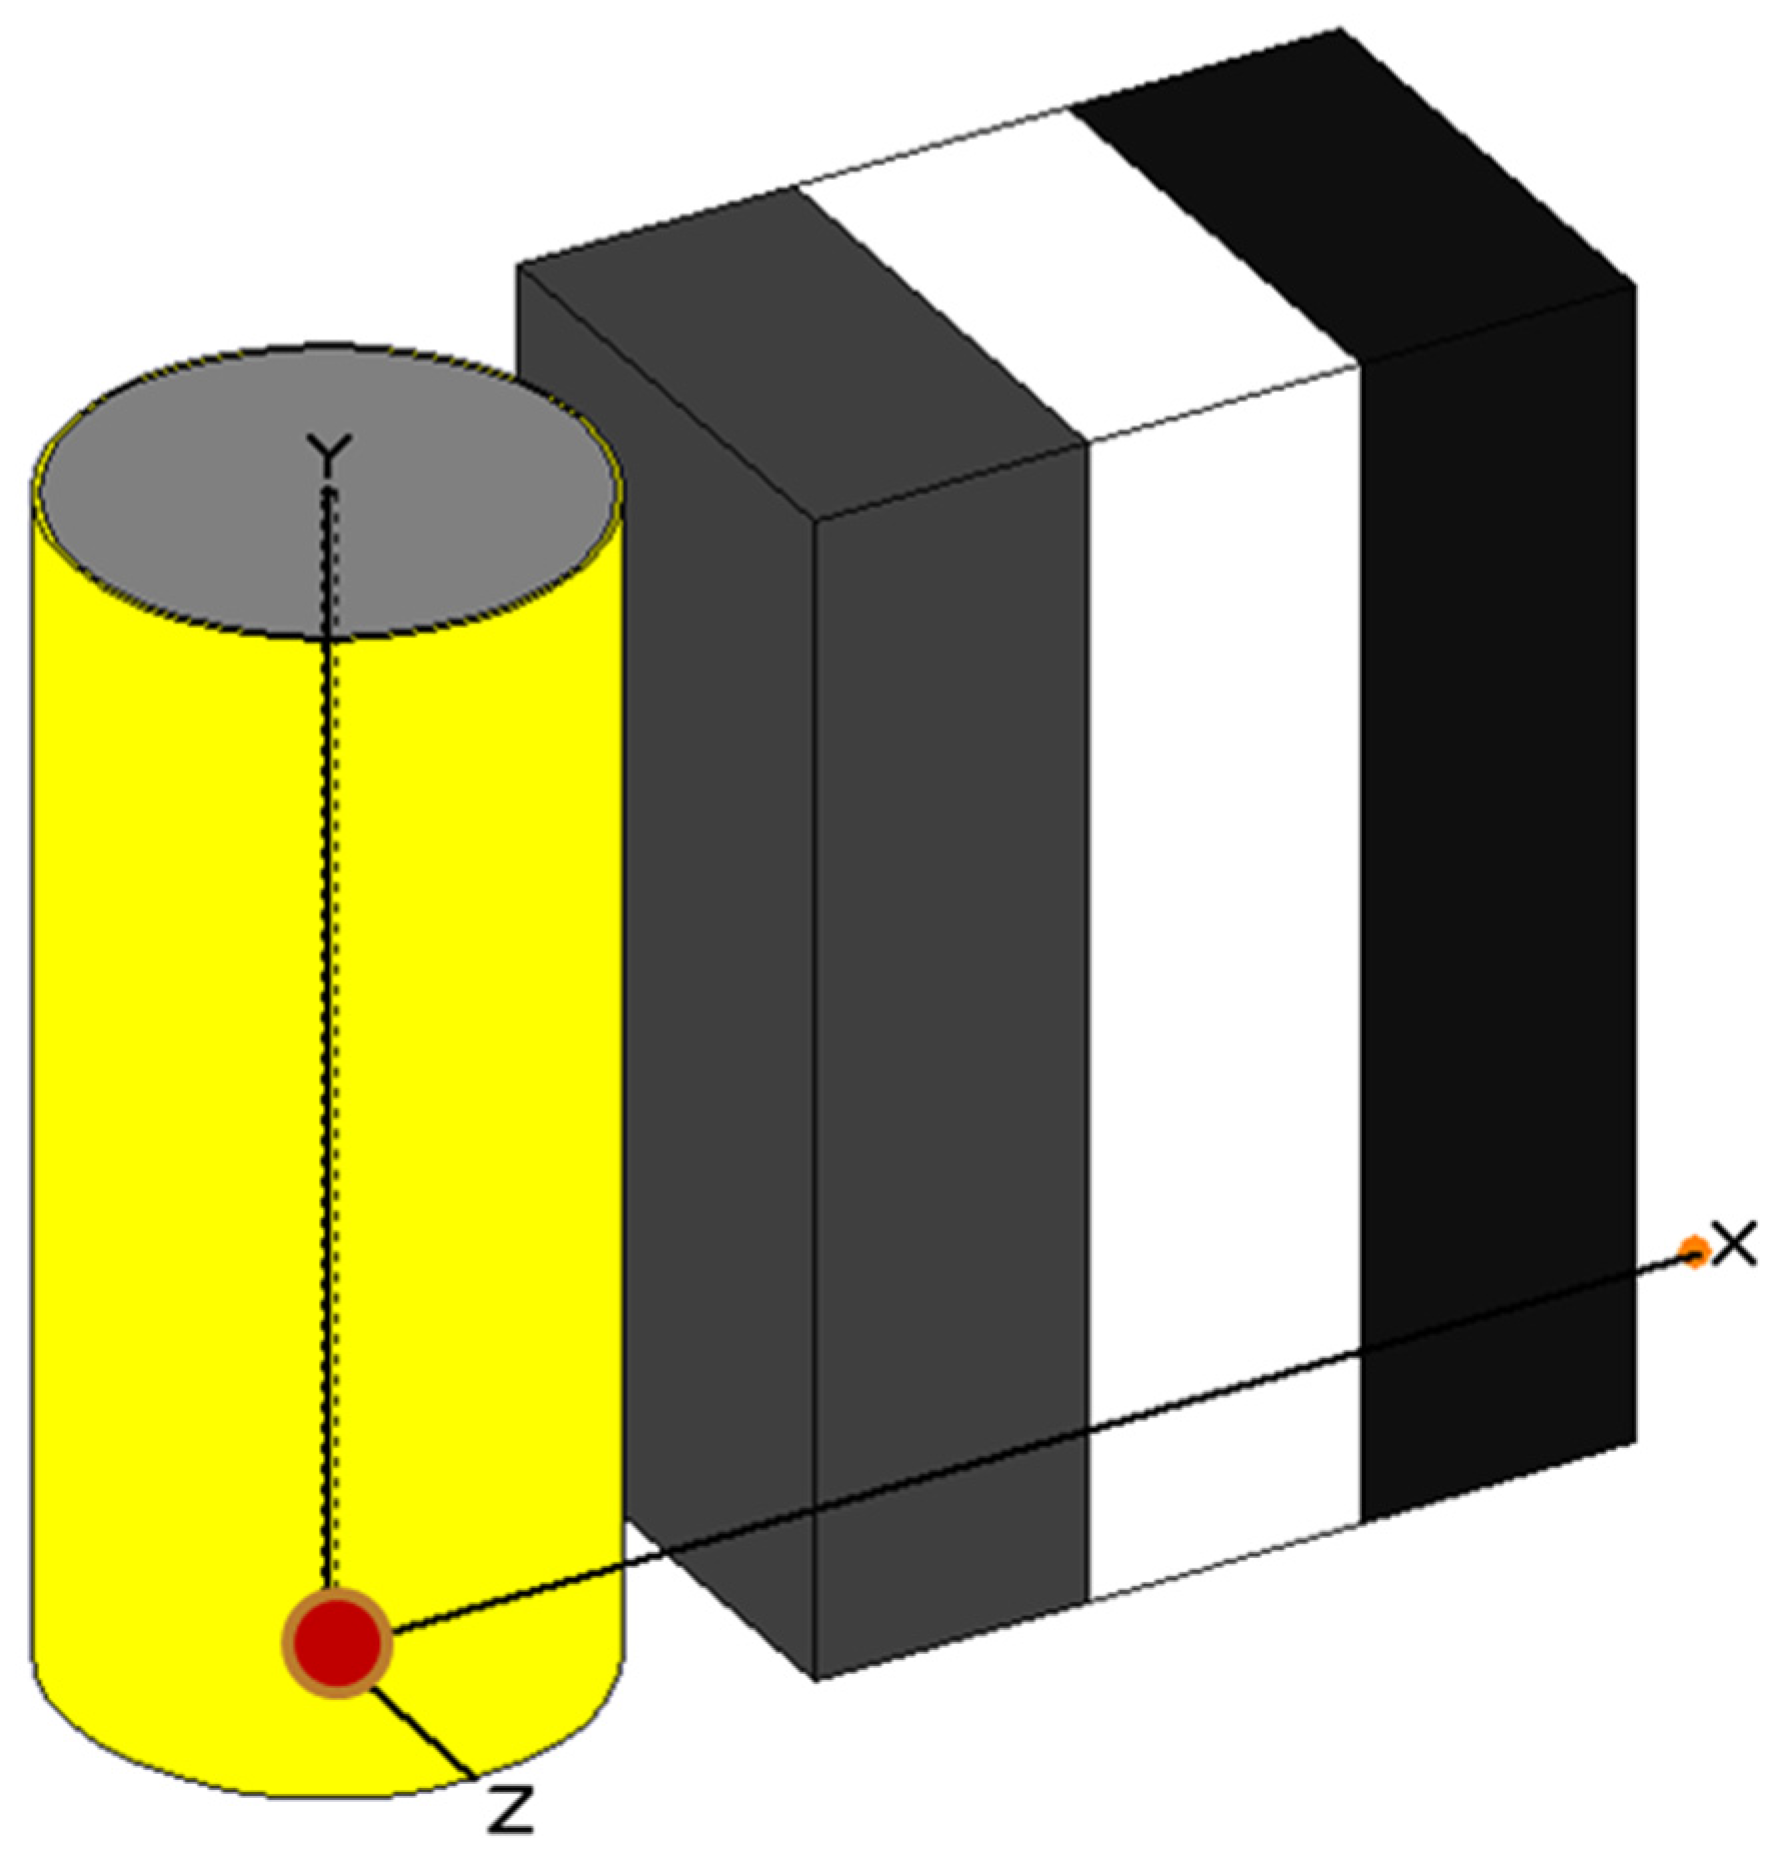
- There are two concrete walls as the external safety barriers: an inside wall and an outside wall. The inside wall indicates the wall of a silo well and the outside wall is the storage building wall.
- (4)
- The failed pebble is located at the bottom-center of the canister. For the sensitivity analysis, the pebble number and the failed pebbles’ locations are varied.
- (5)
- The dose point, which is equivalent to the location of the detector, for the absorbed dose rate or exposure rate, is located at 5 km from the source. The 5 km distance is assumed as the exclusion area boundary (EAB) for an advanced reactor [76]. Additionally, for the sensitivity study, another dose point is 10 m from the source which is the vicinity of the storage building.
4.2. Initiating Event Identification by Using MLD
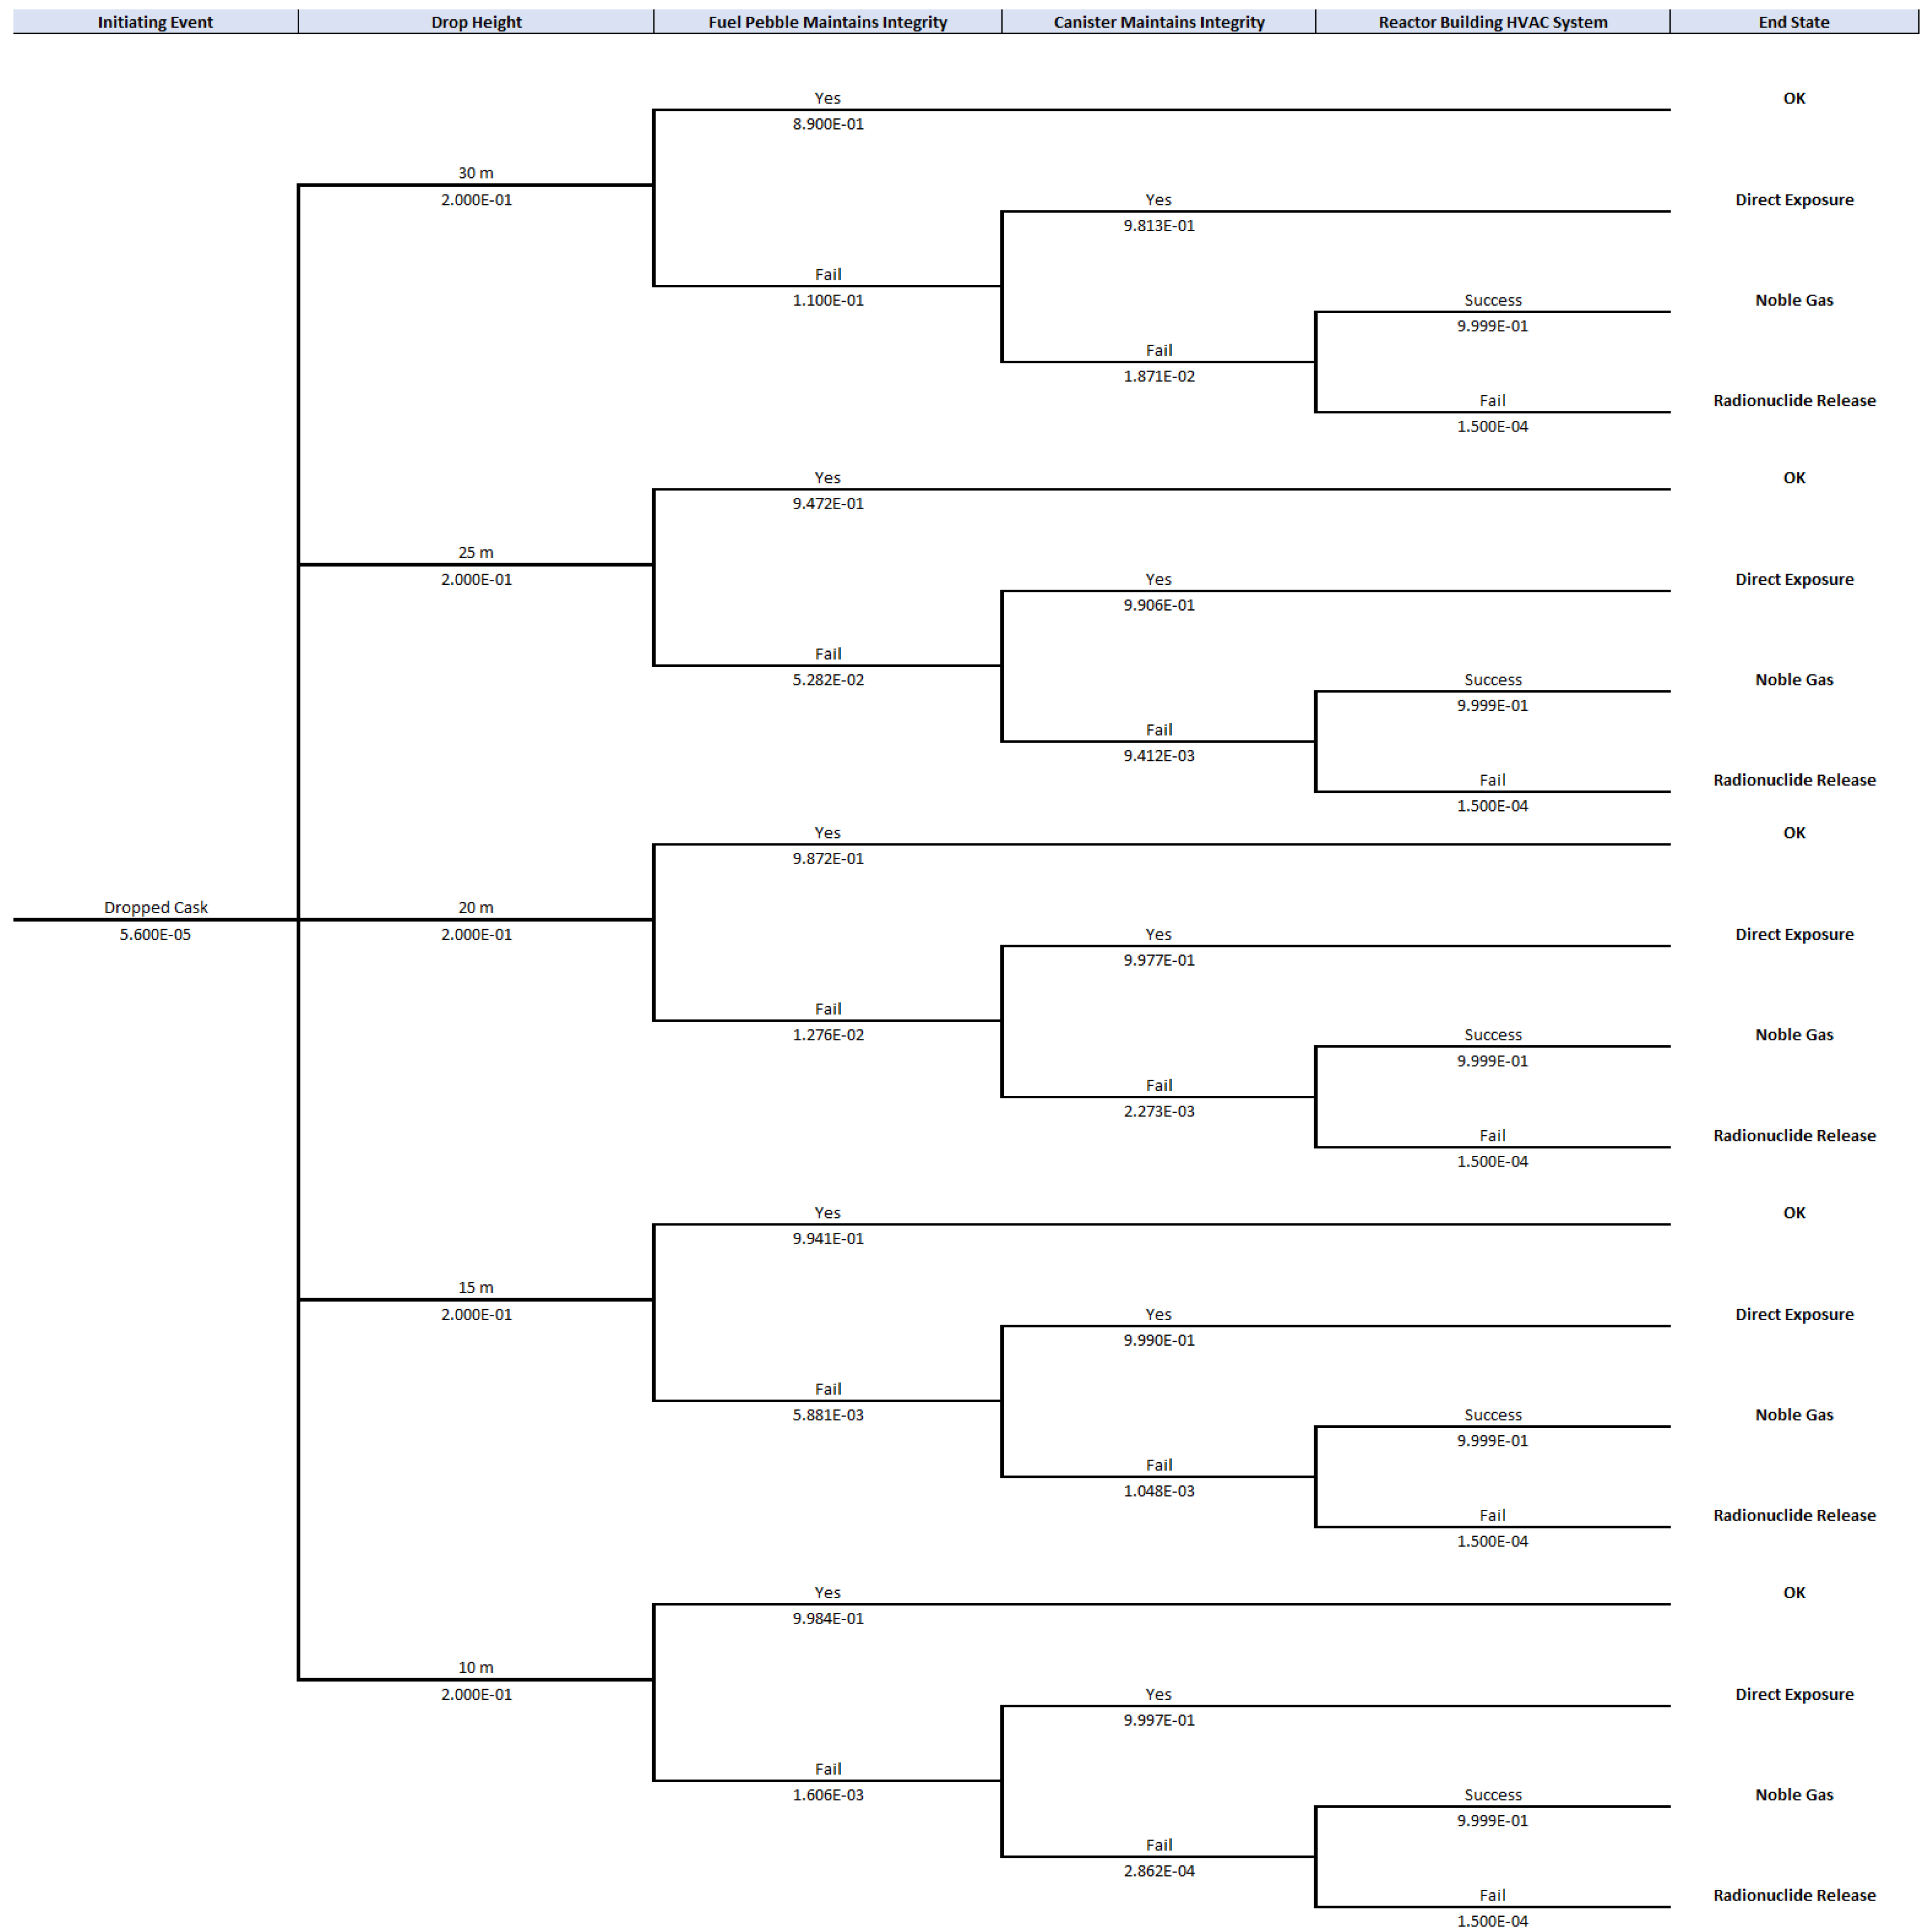
- “OK” refers to the no potential risk of release from the SFSS.
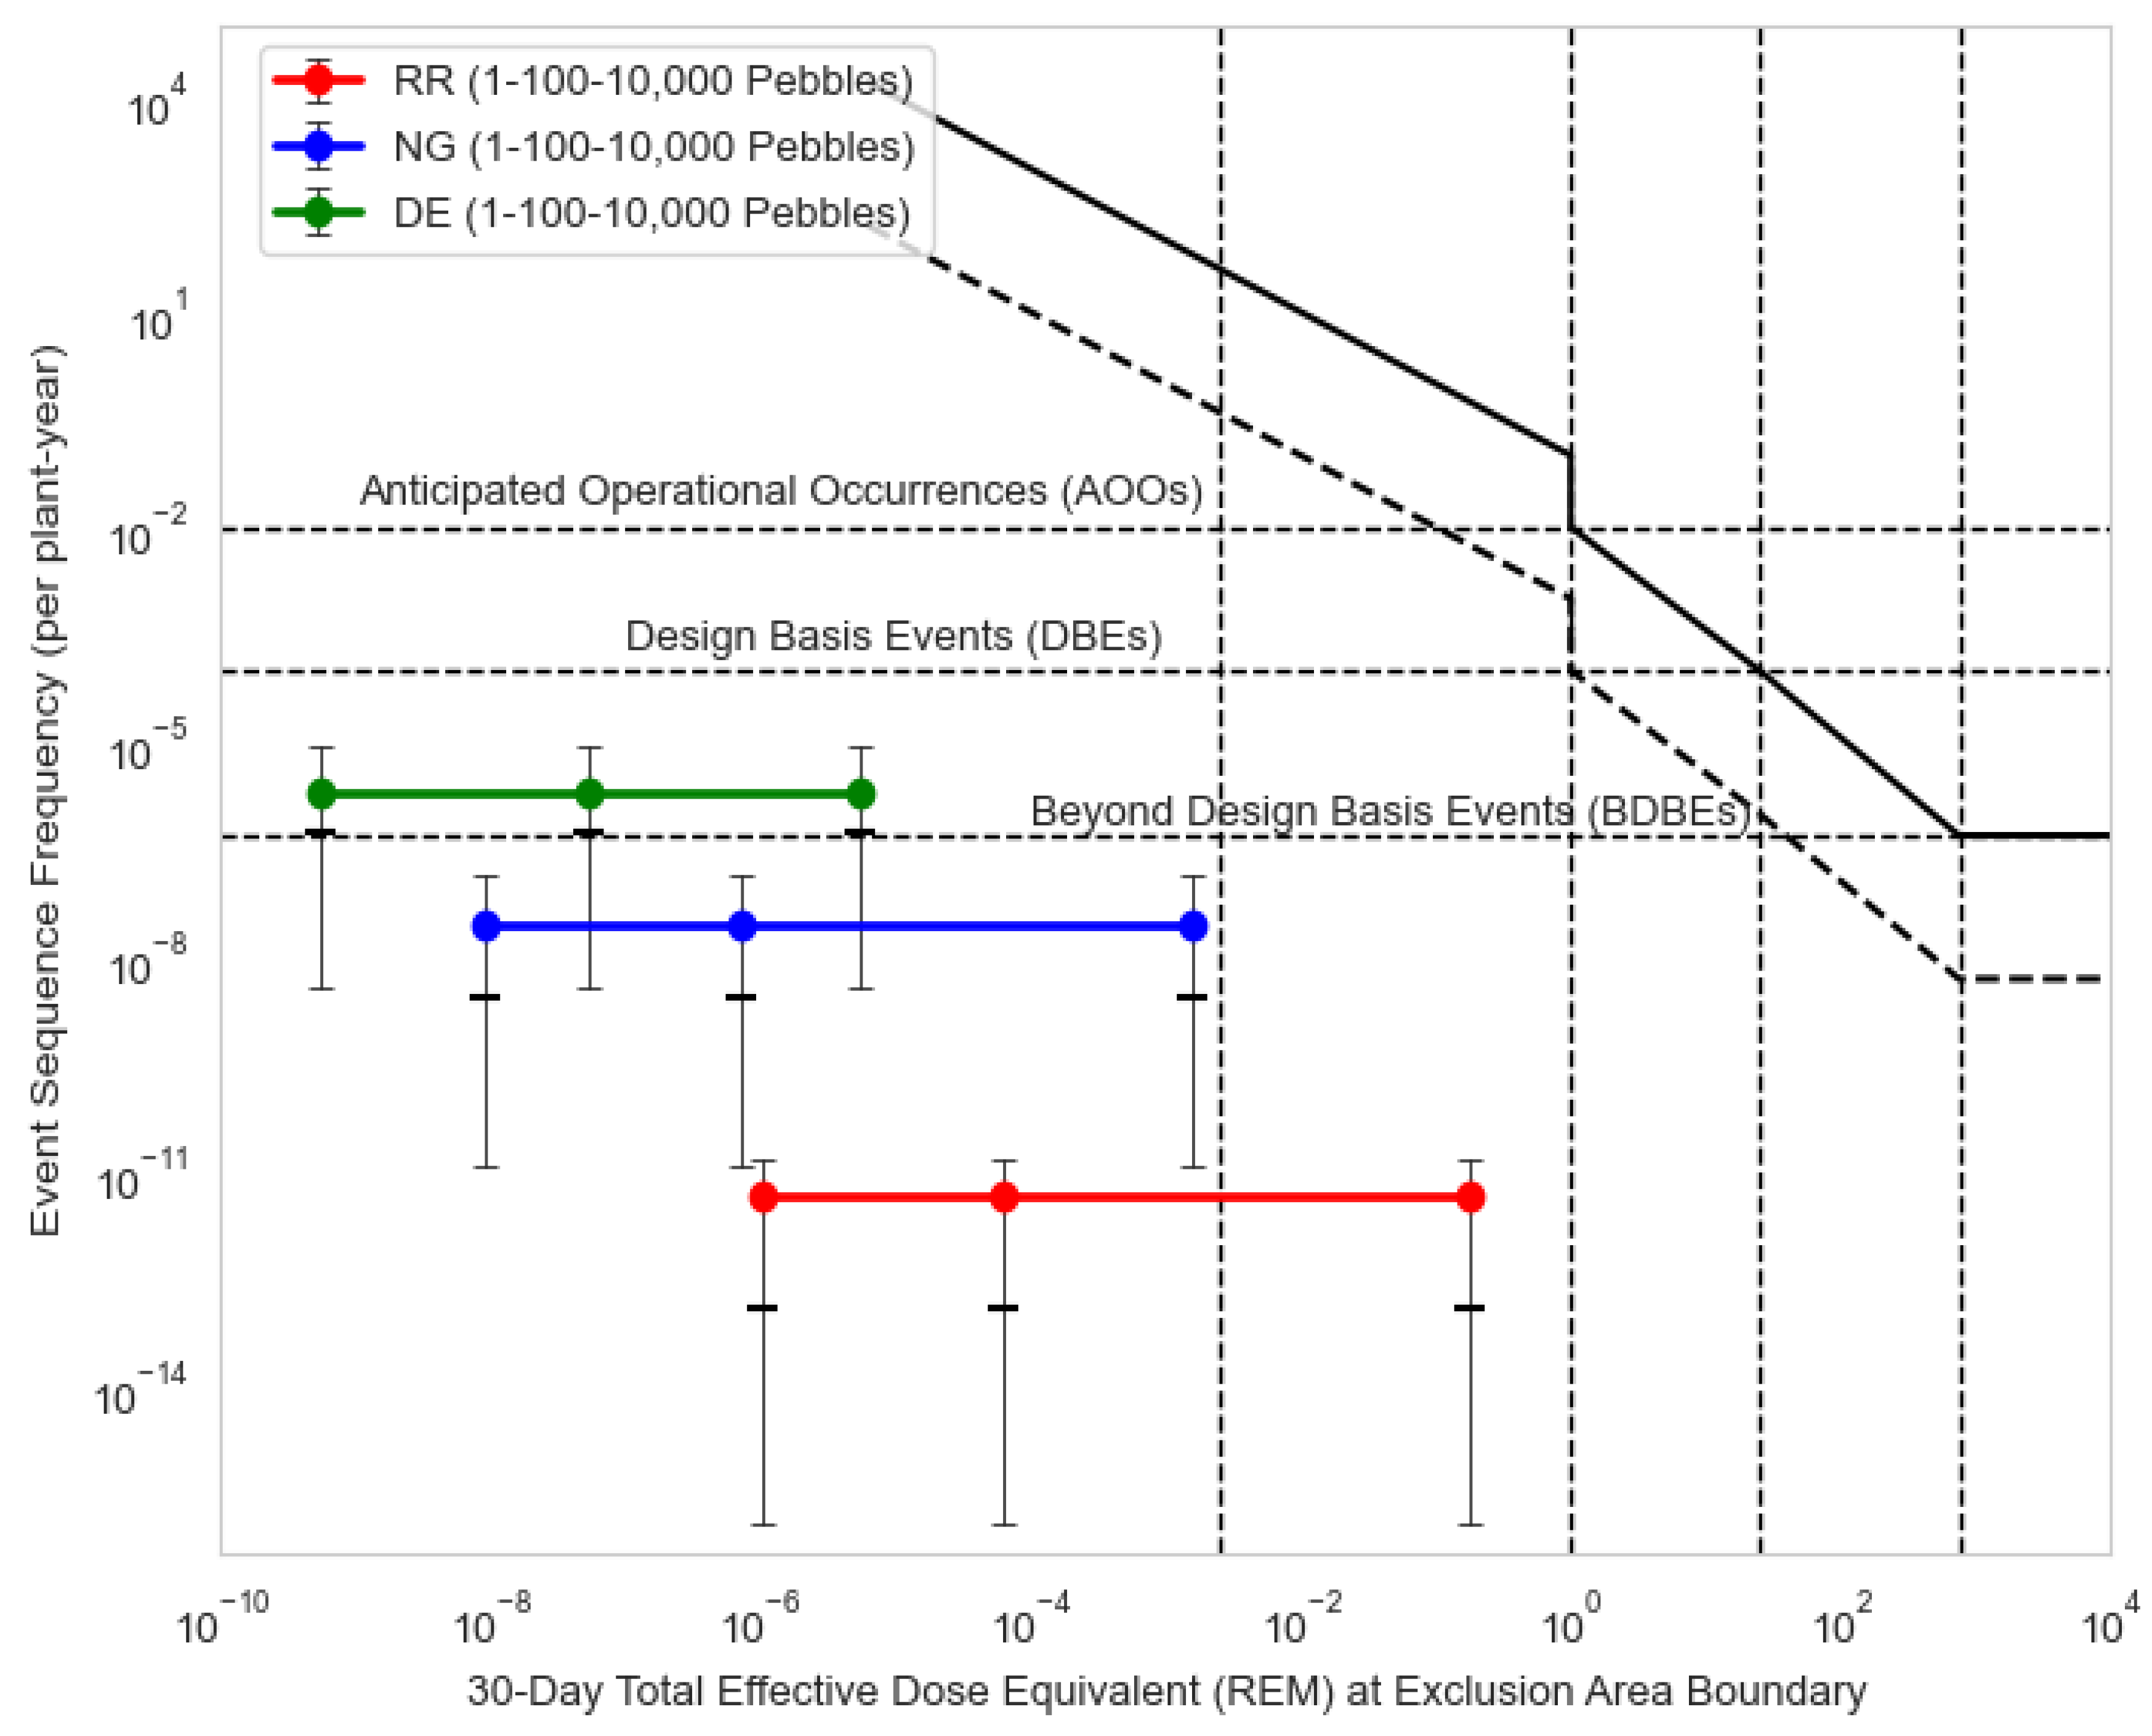
- “Direct Exposure” (DE) indicates the event progression that some spent pebbles have failed, but the dry cask is intact. Additionally, the HVAC system operation failure is not considered which means the isolation of the storage is successful.
- “Noble Gas” (NG) is an end state where the release of radionuclide passes through the filtration path of the HVAC system. Since successful HVAC operation enables the filter to retain the radionuclides except the noble gas, only the noble gases, such as Kr and Xe, are released into the environment.
- “Radionuclide Release” (RR) indicates the end state that radioactive material is released to the environment directly without filtration due to HVAC operation failure.
4.3. Data Analysis for Failure Probability
- IE frequency is a heuristic frequency given from the dropped transfer cask investigation in the United States [5].
- Canister failure probability is given and estimated by linear interpolation from [5].
- Pebble failure probability at 30 m is given from the dynamic analysis and validation experiment [34]. The failure probabilities with dropping height are assumed with the same proportion of canister failure probabilities.
- HVAC failure probability is given from [5].
- To maintain the uncertainty magnitude of event sequences, the error factors are consistent from the IE to HVAC failure probability. The error factor is defined as the 95th percentile divided by the median (50th percentile).
- Based on the same error factors, alpha and beta are determined by the equations:where refers to the frequency of IE. and indicate alpha and beta parameters for gamma distribution, respectively. For determining alpha () and beta () parameters for beta distribution, the linearly interpolated failure probability () is used:
- To quantify the uncertainties along the event sequences, variances for gamma distribution () and beta distribution () are calculated:
4.4. Event Sequence Quantification by Using Phoenix Architect
4.5. Mechanistic Source Term Analysis by Using ORIGEN
4.6. Radiological Consequence Analysis by Using MicroShield
4.6.1. Case Study 1
4.6.2. Case Study 2—Sensitivity Study
- R-squared is low in the case of A, whereas, case B has a very high R-squared value (=1).
- The p-values are very low in both cases (p-value < 0.05).
- For case A, both the R-squared and the p-value are low. It indicates that the regression model discloses a significant statistical effect of input variables on response but is not good at predicting the responses from the input variables accurately because of unexplained variance. In other words, the data points are distributed further from the regression line. Whereas, the regression model for case B not only explains the responses well but also is able to predict the output accurately.
4.6.3. Discussion for Sensitivity Study
- Findings for case A are:
- ○
- The order of the impact of the input variables is as follows: the inside wall thickness, the outside wall thickness, the number of pebbles, and the distance between the source and the canister surface. However, the difference between the coefficients of the inside wall thickness and the outside wall thickness is small.
- ○
- Therefore, the wall thickness is the most significant variable to determine the exposure rate at the outside of the storage regardless of whether it is the inside wall or the outside wall.
- ○
- Only the number of failed pebbles is positively sensitive to the exposure rate which means more failed pebble numbers and a larger exposure rate. Otherwise, the exposure rate decreases when the variables increase.
- Findings for case B are:
- ○
- The coefficient of the number of pebbles is very high (=1) and the others’ coefficients are extremely low. In other words, the number of pebbles is a dominant input variable for case B. The exposure rate at 5 km from the source does not depend on the distance and wall thickness because they are negligible compared to the EAB.
4.7. Risk Integration for F-C Curve
5. Conclusions
Author Contributions
Funding
Data Availability Statement
Conflicts of Interest
Abbreviation
| ANL | Argonne National Laboratory |
| AOO | Anticipated Operational Occurrence |
| BDBA | Beyond Design Basis Accident |
| CCF | Common Cause Failure |
| CDF | Core Damage Frequency |
| CNID | Constrained Noninformative Distribution |
| DA | Data Analysis |
| DBA | Design Basis Accident |
| DE | Direct Exposure |
| EAB | Exclusion Area Boundary |
| ESA | Event Sequence Analysis |
| ESQ | Event Sequence Quantification |
| ET | Event Tree |
| F-C | Frequency-Consequence |
| FEM | Finite Element Model |
| FHS | Fuel Handling System |
| FMEA | Failure Modes and Effort Analysis |
| FP | Fission Product |
| HAZOP | Hazard and Operability Analysis |
| HBFT | Heat Balance Fault Tree |
| HTR-PM | High-Temperature Gas-Cooled Reactor-Pebble Bed Module |
| HVAC | Heating, Ventilation, and Air Conditioning |
| IE | Initiating Event |
| INL | Idaho National Laboratory |
| IPyC | Inner Pyro-Carbon |
| LAR | License Amendment Requests |
| LBE | Licensing Basis Event |
| LERF | Large Early Release Frequency |
| LMP | Licensing Modernization Project |
| LWR | Light Water Reactor |
| MLD | Master Logic Diagram |
| MST | Mechanistic Source Term |
| NG | Noble Gas |
| NPP | Nuclear Power Plant |
| NRC | Nuclear Regulatory Commission |
| OLS | Ordinary Least Square |
| OPyC | Pyro-Carbon |
| ORNL | Oak Ridge National Laboratory |
| PBR | Pebble Bed Reactors |
| PHA | Process Hazards Analysis |
| PRA | Probabilistic Risk Assessment |
| RCA | Radiological Consequence Analysis |
| RI | Risk Integration |
| RR | Radionuclide Release |
| SFCLS | Spent Fuel Conveying and Loading System |
| SiC | Silicon Carbide |
| SNF | Spent Nuclear Fuel |
| SSC | Structures, Systems, and Components |
| TRISO | Tri-Structural Isotropic |
| VHTR | Very High-Temperature Gas Reactor |
References
- Bunn, M.; Holdren, J.P.; Macfarlane, A.; Pickett, S.E.; Suzuki, A.; Suzuki, T.; Weeks, J. Project on Managing the Atom; Belfer Center for Science and International Affairs: Cambridge, MA, USA, 2012; p. 146. [Google Scholar]
- Romanato, L.S. Advantages of dry hardened cask storage over wet storage for spent nuclear fuel. In Proceedings of the 2011 International Nuclear Atlantic Conference—INAC 2011, Belo Horizonte, Brazil, 24–28 October 2011; p. 9. [Google Scholar]
- Werner, J.D. U.S. Spent Nuclear Fuel Storage; R42513; Congressional Research Service Report for Congress: Washington, DC, USA, 2012; p. 57. [Google Scholar]
- Sekiguchi, Y. Mitigating the Risks of Spent Nuclear Fuel in Japan; Center for Strategic and International Studies: Washington, DC, USA, 2017; p. 9. [Google Scholar]
- Malliakos, A. A Pilot Probabilistic Risk Assessment of a Dry Cask Storage System at a Nuclear Power Plant (NUREG-1864); US NRC: Washington, DC, USA, 2007. [Google Scholar]
- JBiersdorf, M.; Eidelpes, E.F. Development of Dry Cask Risk Tools; INL/EXT-20-57570-Rev000, 1603757; U.S. Department of Energy: Oak Ridge, TN, USA, 2020. [CrossRef]
- Fort, J.; Richmond, D.; Cuta, J.; Suffield, S. Thermal Modeling of the TN-32B Cask for the High Burnup Spent Fuel Data Project; PNNL-28915, 1566774; U.S. Department of Energy: Oak Ridge, TN, USA, 2019. [CrossRef]
- Koskenranta, J.; Paavola, I.; Hotakainen, R.; Laato, T. Loviisa Nuclear Power Plant Spent Fuel Storage Risk Analysis. In Proceedings of the Probabilistic Safety Assessment and Management, PSAM 16, Honolulu, HI, USA, 26 June–1 July 2022; p. 12. [Google Scholar]
- Olofsson, F.; Olsson, A. Challenges and Lessons Learned from a PSA on a Spent Fuel Pool Facility. In Proceedings of the Probabilistic Safety Assessment and Management, PSAM16, Honolulu, HI, USA, 26 June–1 July 2022; p. 7. [Google Scholar]
- Kadak, A.C. A future for nuclear energy: Pebble bed reactors. IJCIS 2005, 1, 330. [Google Scholar] [CrossRef] [Green Version]
- Brey, H.L. Current Status and Future Development of Modular High Temperature Gas Cooled Reactor Technology; IAEA-TECDOC-1198; IAEA, Nuclear Power Technology Development Section: Vienna, Austria, 2001. [Google Scholar]
- INL. Modular HTGR Safety Basis and Approach; INL/EXT-11-22708; Idaho National Laboratory (INL): Idaho Falls, ID, USA, 2011. [Google Scholar]
- Del Cul, G.D. TRISO-Coated Fuel Processing to Support High Temperature Gas-Cooled Reactors; ORNL/TM-2002/156, 814326; ORNL: Oak Ridge, TN, USA, 2002. [Google Scholar] [CrossRef]
- Gen IV International Forum. GIF Annual Report 2021; Gen IV International Forum: Brussels, Belgium, 2021. [Google Scholar]
- Moses, D.L. Very High-Temperature Reactor (VHTR) Proliferation Resistance and Physical Protection (PR&PP); ORNL/TM-2010/163, 1027406; ORNL: Oak Ridge, TN, USA, 2011. [Google Scholar] [CrossRef] [Green Version]
- Kovacic, D.; Gibbs, P.; Worrall, L.; Hunneke, R.; Harp, J.; Hu, J. Advanced Reactor Safeguards: Nuclear Material Control and Accounting for Pebble Bed Reactors; Oak Ridge National Laboratory: Oak Ridge, TN, USA, 2021. [Google Scholar]
- Kovacic, D.; Gibbs, P.; Scott, L. Model MC&A Plan for Pebble Bed Reactors; Oak Ridge National Laboratory: Oak Ridge, TN, USA, 2020. [Google Scholar]
- Hu, R.; Hu, G.; Zou, L.; Klingberg, A.; Fei, T.; Nunez, D. FY20 SAM Code Developments and Validations for Transient Safety Analysis of Advanced Non-LWRs; ANL/NSE-20/50, 1716517, 162791; U.S. Department of Energy: Oak Ridge, TN, USA, 2020. [CrossRef]
- Novak, A.J.; Carlsen, R.W.; Schunert, S.; Balestra, P.; Reger, D.; Slaybaugh, R.N.; Martineau, R.C. Pronghorn: A Multidimensional Coarse-Mesh Application for Advanced Reactor Thermal Hydraulics. Nucl. Technol. 2021, 207, 1015–1046. [Google Scholar] [CrossRef]
- Laboure, V.; Ortensi, J.; Hermosillo, A.; Strydom, G.; Balestra, P. FY21 Status Report on the ART-GCR CMVB and CNWG International Collaborations, ART-M3AT-21IN0603011; Idaho National Laboratory (INL): Idaho Falls, ID, USA, 2021. [Google Scholar]
- IAEA. Evaluation of High Temperature Gas Cooled Reactor Performance: Benchmark Analysis Related to the PBMR-400, PBMM, GT-MHR, HTR-10 and the ASTRA Critical Facility; International Atomic Energy Agency: Vienna, Austria, 2013. [Google Scholar]
- Zhang, Z.-Y.; Dong, Y.-J.; Shi, Q.; Li, F.; Wang, H.-T. 600-MWe high-temperature gas-cooled reactor nuclear power plant HTR-PM600. Nucl. Sci. Tech. 2022, 33, 101. [Google Scholar] [CrossRef]
- Joksimovic, V.; Houghton, W.J.; Emon, D.E. HTGR Risk Assessment Study. In Proceedings of the International Conference on Nuclear Systems Reliability Engineering and Risk Assessment, Gatlinburg, TN, USA, 20 June 1977; General Atomics: San Diego, CA, USA, 1977. Available online: https://www.osti.gov/biblio/5450842-htgr-risk-assessment-study (accessed on 26 September 2021).
- Herczeg, J. Probabilistic Risk Assessment for The Standard Modular High Temperature Gas-Cooled Reactor, DOE-HTGR-86-011; Civilian Reactor Development, Office of Nuclear Energy: Washington, DC, USA, 1987. [Google Scholar]
- Savkina, M.D. Probabilistic Accident Analysis of the Pebble Bed Modular Reactor for Use with Risk Informed Regulation; MIT: Cambridge, MA, USA, 2004; Available online: https://dspace.mit.edu/bitstream/handle/1721.1/17748/56504086-MIT.pdf?sequence=2&isAllowed=y (accessed on 29 September 2021).
- Demkowicz, P.A.; Liu, B.; Hunn, J.D. Coated particle fuel: Historical perspectives and current progress. J. Nucl. Mater. 2019, 515, 434–450. [Google Scholar] [CrossRef]
- Moe, W.L.; Afzali, A. Modernization of Technical Requirements for Licensing of Advanced Non-Light Water Reactors Selection and Evaluation of Licensing Basis Events; INL/EXT-19-55513-Rev1; Idaho National Lab. (INL): Idaho Falls, ID, USA, 2020. [Google Scholar] [CrossRef]
- Moe, W.L.; Afzali, A. Modernization of Technical Requirements for Licensing of Advanced Non-Light Water Reactors: Safety Classification and Performance Criteria for Structures, Systems, and Components; INL/EXT-19-55516-Rev000; SC-29980-102.Rev0; Idaho National Lab. (INL): Idaho Falls, ID, USA; Southern Company Services: Birmingham, AL, USA, 2019. [Google Scholar] [CrossRef]
- Fleming, K.; Wallace, E.; Afzali, A. Use of PRA to Select Licensing Basis Events. In PSAM14; UCLA: Los Angeles, CA, USA, 2018; p. 12. [Google Scholar]
- US NRC. NRC Non-Light Water Reactor (Non-LWR) Vision and Strategy, Volume 3—Computer Code Development Plans for Severe Accident Progression, Source Term, and Consequence Analysis; US NRC: Washington, DC, USA, 2020. [Google Scholar]
- ASME. Probabilistic Risk Assessment Standard for Advanced Non-LWR Nuclear Power Plants; ANS, ASME/ANS RA-S-1.4-2021; ASME: New York, NY, USA, 2021. [Google Scholar]
- Braverman, J.I.; Morante, R.J.; Xu, J.; Hofmayer, C.H.; Shaukat, S.K. Impact Analysis of Spent Fuel Dry Casks under Accidental Drop Scenarios; U.S. Department of Energy: Oak Ridge, TN, USA, 2003; Volume BNL-NUREG-71196-2003-CP, p. 8.
- Lin, M.; Li, Y. Analysis of the interactions between spent fuel pebble bed and storage canister under impact loading. Nucl. Eng. Des. 2020, 361, 110548. [Google Scholar] [CrossRef]
- Lin, M.; Wang, J.; Wu, B.; Li, Y. Dynamic analysis of dry storage canister and the spent fuels inside under vertical drop in HTR-PM. Ann. Nucl. Energy 2021, 154, 108030. [Google Scholar] [CrossRef]
- IAEA. Defining Initiating Events for Purposes of Probabilistic Safety Assessment; IAEA-TECDOC-719; IAEA: Vienna, Austria, 1993. [Google Scholar]
- Garrick, B.J.; Fleming, K.N. Seabrook Station Probabilistic Safety Assessment; PLG-0242; Pickard, Lowe and Garrick, Inc.: Newport Beach, CA, USA, 1982. [Google Scholar]
- Papazoglou, I.A.; Aneziris, O.N. Master Logic Diagram: Method for hazard and initiating event identification in process plants. J. Hazard. Mater. 2003, 97, 11–30. [Google Scholar] [CrossRef]
- Cho, N.-C.; Jae, M.; Joon-Eon, Y. Initiating Events Identification of the IS Process Using the Master Logic Diagram. In Proceedings of the Korean Nuclear Society Conference, Taejon, Republic of Korea, 11–13 April 2005; pp. 55–56. [Google Scholar]
- Purba, J.H. Master Logic Diagram: An Approach to Identify Initiating Events of HTGRs. J. Phys. Conf. Ser. 2018, 962, 012036. [Google Scholar] [CrossRef]
- Lee, H.; Park, J. Analysis of Initiating Events for SMART using Heat Balance Fault Tree Method. In Proceedings of the Korean Nuclear Society, Jeju, Republic of Korea, 14–20 April 2017; p. 4. [Google Scholar]
- Han, S.; Park, J.; Jang, S. Identification of Initiating Events Using the Master Logic Diagram in Low-Power and Shutdown PSA for Nuclear Power Plant; KAERI/TR-2497/2003; KAERI: Daejeon, Republic of Korea, 2003. [Google Scholar]
- Liu, H.-C.; Liu, L.; Liu, N. Risk evaluation approaches in failure mode and effects analysis: A literature review. Expert Syst. Appl. 2013, 40, 828–838. [Google Scholar] [CrossRef]
- Aldemir, T.; Stovsky, M.P.; Kirschenbaum, J.; Mandelli, D.; Bucci, P.; Mangan, L.A.; Miller, D.W.; Sun, X.; Ekici, E.; Guarro, S.; et al. Dynamic Reliability Modeling of Digital Instrumentation and Control Systems for Nuclear Reactor Probabilistic Risk Assessments; NUREG/CR-6942; Ohio State University: Columbus, OH, USA, 2007. [Google Scholar]
- Gaol, F.L.; Nguyen, Q.V. (Eds.) Proceedings of the 2011 2nd International Congress on Computer Applications and Computational Science; Springer: Berlin/Heidelberg, Germany, 2012; Volume 144. [Google Scholar] [CrossRef]
- Cadwallader, L.C. Preliminary Failure Modes and Effects Analysis of the US DCLL Test Blanket Module; U.S. Department of Energy: Oak Ridge, TN, USA, 2010; p. 158. [Google Scholar]
- Bright, M.; Foster, R.; Hampton, C.; Ruiz, J.; Moeller, B. Failure modes and effects analysis for surface-guided DIBH breast radiotherapy. J. Appl. Clin. Med. Phys. 2022, 23, e13541. [Google Scholar] [CrossRef] [PubMed]
- Huq, M.S.; Fraass, B.A.; Dunscombe, P.B.; Gibbons, J.P., Jr.; Ibbott, G.S.; Mundt, A.J.; Mutic, S.; Palta, J.R.; Rath, F.; Thomadsen, B.R.; et al. The report of Task Group 100 of the AAPM: Application of risk analysis methods to radiation therapy quality management: TG 100 report. Med. Phys. 2016, 43, 4209–4262. [Google Scholar] [CrossRef] [PubMed]
- Li, S.; Zeng, W. Risk analysis for the supplier selection problem using failure modes and effects analysis (FMEA). J. Intell. Manuf. 2016, 27, 1309–1321. [Google Scholar] [CrossRef]
- Chi, C.-F.; Sigmund, D.; Astardi, M.O. Classification Scheme for Root Cause and Failure Modes and Effects Analysis (FMEA) of Passenger Vehicle Recalls. Reliab. Eng. Syst. Saf. 2020, 200, 106929. [Google Scholar] [CrossRef]
- Sowder, A. Program on Technology Innovation: Early Integration of Safety Assessment into Advanced Reactor Design—Preliminary Body of Knowledge and Methodology; 2018 Technical Report 3002011801; Electric Power Research Institute: Palo Alto, CA, USA, 2018. [Google Scholar]
- Marciulescu, C. Program on Technology Innovation: Early Integration of Safety Assessment into Advanced Reactor Design—Project Capstone Report; 2019 Technical Report 3002015752; Electric Power Research Institute: Palo Alto, CA, USA, 2019. [Google Scholar]
- Rimkevičius, S.; Vaišnoras, M.; Babilas, E.; Ušpuras, E. HAZOP application for the nuclear power plants decommissioning projects. Ann. Nucl. Energy 2016, 94, 461–471. [Google Scholar] [CrossRef]
- Joubert, J.; Kohtz, N.; Coe, I. South African Safety Assessment Framework for the Pebble Bed Modular Reactor. In Fourth International Topical Meeting on High Temperature Reactor Technology, Volume 2; ASME: Washington, DC, USA, 2008; pp. 193–203. [Google Scholar] [CrossRef]
- Afzali, A. Molten Salt Reactor Experiment (MSRE) Case Study Using Risk-Informed, Performance—Based Technical Guidance to Inform Future Licensing for Advanced Non-Light Water Reactors; EPRI AR LR 2019-06; Southern Company: Atlanta, GA, USA, 2019. [Google Scholar]
- Taylor, J.M. Issues Pertaining to the Advanced Reactor (Prism, Mhtgr, And Pius) And Candu 3 Designs and Their Relationship to Current Regulatory Requirements; SECY-93-092; US NRC: Washington, DC, USA, 1993. [Google Scholar]
- Andrews, N.; Nenoff, T.; Luxat, D.; Clark, A.; Leute, J. Mechanistic Source Term Considerations for Advanced Non-LWRs; SAND--2020-6730, 1638572, 687170; U.S. Department of Energy: Oak Ridge, TN, USA, 2020. [CrossRef]
- Moe, W.L. Risk-Informed Performance-Based Technology Inclusive Guidance for Advanced Reactor Licensing Basis Development; INL/EXT-19-55375-Rev000; Idaho National Lab. (INL): Idaho Falls, ID, USA, 2019. [Google Scholar] [CrossRef]
- US NRC. White Paper on Options for Risk Metrics for New Reactors; US NRC: Washington, DC, USA, 2009. [Google Scholar]
- Boyer, R.L. Probabilistic Risk Assessment (PRA): Analytical Process for Recognizing Design and Operational Risks; Safety & Mission Assurance (S&MA), NASA Johnson Space Center: Houston, TX, USA, 2017.
- Phillips, J.A.; Nagley, S.G.; Shaber, E.L. Fabrication of uranium oxycarbide kernels and compacts for HTR fuel. Nucl. Eng. Des. 2012, 251, 261–281. [Google Scholar] [CrossRef]
- Seibert, R.L.; Jolly, B.C.; Balooch, M.; Schappel, D.P.; Terrani, K.A. Production and characterization of TRISO fuel particles with multilayered SiC. J. Nucl. Mater. 2019, 515, 215–226. [Google Scholar] [CrossRef]
- Bruna, G.B.; Bourgois, T.; Ivanov, E.; Monhardt, D. Overview of Generation IV (Gen IV) Reactor Designs; IRSN Report 2012/158; IRSN: Paris, France, 2012. [Google Scholar]
- Morris, R.N.; Petti, D.A.; Powers, D.A.; Boyack, B.E. TRISO-Coated Particle Fuel Phenomenon Identification and Ranking Tables (PIRTs) for Fission Product Transport Due to Manufacturing, Operations and Accidents; NUREG/CR-6844; US NRC: Washington, DC, USA, 2004; Volume 1. [Google Scholar]
- Kwapis, E.H.; Liu, H.; Hartig, K.C. Tracking of individual TRISO-fueled pebbles through the application of X-ray imaging with deep metric learning. Prog. Nucl. Energy 2021, 140, 103913. [Google Scholar] [CrossRef]
- Moormann, R.; Kemp, R.S.; Li, J. Caution Is Needed in Operating and Managing the Waste of New Pebble-Bed Nuclear Reactors. Joule 2018, 2, 1911–1914. [Google Scholar] [CrossRef] [Green Version]
- Wu, B.; Wang, J.; Li, Y.; Wang, H.; Ma, T. Design, Experiment, and Commissioning of the Spent Fuel Conveying and Loading System of HTR-PM. Sci. Technol. Nucl. Install. 2022, 2022, e1817191. [Google Scholar] [CrossRef]
- Wang, J.; Zhang, Z.; Wu, B.; Li, Y. Design of the HTR-PM Spent Fuel Storage Facility. In Proceedings of the 7th International Topical Meeting on High Temperature Reactor Technology: The Modular HTR Is Advancing towards Reality Papers and Presentations, Weihai, China, 27–31 October 2014; p. v. [Google Scholar]
- Wang, J.; Wang, B.; Wu, B.; Li, Y. Design of the Spent Fuel Storage Well of HTR-PM. In Proceedings of the 2016 24th International Conference on Nuclear Engineering, Charlotte, NC, USA, 26–30 June 2016. [Google Scholar] [CrossRef]
- Ma, Z.; Kvarfordt, K.; Wierman, T. Industry-Average Performance for Components and Initiating Events at U.S. Commercial Nuclear Power Plants: 2020 Update; INL/EXT-21-65055-Rev000, 1847110; Idaho National Lab. (INL): Idaho Falls, ID, USA, 2022. [Google Scholar] [CrossRef]
- Atwood, C.L.; LaChance, J.; Martz, H.F.; Anderson, D.J.; Englehardt, M.; Whitehead, D.; Wheeler, T. Handbook of Parameter Estimation for Probabilistic Risk Assessment; NUREG/CR-6823; Sandia National Lab.: Albuquerque, NM, USA, 2003. [Google Scholar]
- IAEA. Performance of Engineered Barrier Materials in Near Surface Disposal Facilities for Radioactive Waste. International Atomic Energy Agency, Text. 2001. Available online: https://www.iaea.org/publications/6297/performance-of-engineered-barrier-materials-in-near-surface-disposal-facilities-for-radioactive-waste (accessed on 10 March 2023).
- Severe Accident Risks: An Assessment for Five U.S. Nuclear Power Plants—Final Summary Report (NUR. NRC Web). Available online: https://www.nrc.gov/reading-rm/doc-collections/nuregs/staff/sr1150/v1/index.html (accessed on 6 January 2023).
- IAEA. Handbook of Parameter Values for the Prediction of Radionuclide Transfer in Terrestrial and Freshwater Environments. International Atomic Energy Agency, Text. 2010. Available online: https://www.iaea.org/publications/8201/handbook-of-parameter-values-for-the-prediction-of-radionuclide-transfer-in-terrestrial-and-freshwater-environments (accessed on 10 March 2023).
- Sailor, V.L.; Perkins, K.R.; Weeks, J.R.; Connell, H.R. Severe Accidents in Spent Fuel Pools in Support of Generic Safety, Issue 82; Div. of Reactor and Plant Systems, NUREG/CR-4982; BNL-NUREG-52093; Brookhaven National Lab. (BNL): Upton, NY, USA; Nuclear Regulatory Commission: Washington, DC, USA, 1987. [Google Scholar] [CrossRef] [Green Version]
- Travis, R.J.; Davis, R.E.; Grove, E.J.; Azarm, M.A. A Safety and Regulatory Assessment of Generic BWR and PWR Permanently Shutdown Nuclear Power Plants; Div. of Regulatory Applications; NUREG/CR-6451; BNL-NUREG-52498; US Nuclear Regulatory Commission (NRC): Washington, DC, USA; Brookhaven National Lab. (BNL): Upton, NY, USA, 1997. [Google Scholar] [CrossRef] [Green Version]
- U.S. Nuclear Regulatory Commission. Population-Related Siting Considerations for Advanced Reactors; NRC Staff Prepared White Paper; U.S. Nuclear Regulatory Commission: Rockville, MD, USA, 2019.
- Moore, R.L.; Oh, C.H.; Merrill, B.J.; Petti, D.A. Studies on Air Ingress for Pebble Bed Reactors; IAEA: Vienna, Austria, 2002. [Google Scholar]
- Hadad, Y.; Jafarpur, K. Modeling of Laminar Forced Convection Heat Transfer in Packed Beds with Pebbles of Arbitrary Geometry. J. Por. Media 2013, 16, 1049–1061. [Google Scholar] [CrossRef]
- Zheng, M.; Tian, W.; Wei, H.; Zhang, D.; Wu, Y.; Qiu, S.; Su, G. Development of a MCNP–ORIGEN burn-up calculation code system and its accuracy assessment. Ann. Nucl. Energy 2014, 63, 491–498. [Google Scholar] [CrossRef]
- Bowman, S.M. SCALE 6: Comprehensive Nuclear Safety Analysis Code System. Nucl. Technol. 2011, 174, 126–148. [Google Scholar] [CrossRef]
- Ismail, A.S.; Takip, K.M.; Mustafa, M.K.A.; Anwar, A. RTP: Radionuclides Inventories Calculation Using Origen Code. In Proceedings of the R and D Seminar 2012: Research and Development Seminar 2012, Bangi, Malaysia, 26–28 September 2012. [Google Scholar]
- Mohantyl, S. Sensitivity analysis methods for identifying influential parameters in a problem with a large number of random variables. In Risk Analysis III; WIT Press: Southampton, UK, 2002. [Google Scholar]


| Approach | Features | |
|---|---|---|
| Master Logic Diagram | Top-down |
|
| Heat Balance Fault Tree |
| |
| Failure Mode and Effects Analysis | Bottom-up |
|
| Hazard and Operability Analysis |
|
| Heat Exchanger | Blower | Feature | |
|---|---|---|---|
| Closed Loop Active Cooling Mode | Yes | Yes |
|
| Open Loop Active Cooling Mode | No | Yes |
|
| Open Loop Passive Cooling Mode | No | No |
|
| Frequency/ Probability | Distribution | Alpha | Beta | Error Factor | Variance | ||
|---|---|---|---|---|---|---|---|
| IE Frequency | 5.60 × 10⁻⁵ | gamma | 5.00 × 10⁻¹ | 8.93 × 10³ | 8.44 | 6.27 × 10⁻⁹ | |
| Canister Failure Probability with Dropping Height (m) | 30 | 1.87 × 10⁻² | beta | 4.87 × 10⁻¹ | 2.56 × 101 | 8.44 | 6.79 × 10⁻⁴ |
| 25 | 9.41 × 10⁻³ | beta | 4.94 × 10⁻¹ | 5.20 × 101 | 8.44 | 1.74 × 10⁻⁴ | |
| 20 | 2.27 × 10⁻³ | beta | 4.99 × 10⁻¹ | 2.19 × 10² | 8.44 | 1.03 × 10⁻⁵ | |
| 15 | 1.05 × 10⁻³ | beta | 5.00 × 10⁻¹ | 4.76 × 10² | 8.44 | 2.19 × 10⁻⁶ | |
| 10 | 2.86 × 10⁻⁴ | beta | 5.00 × 10⁻¹ | 1.75 × 10³ | 8.44 | 1.64 × 10⁻⁷ | |
| Pebble Failure Probability with Dropping Height (m) | 30 | 1.10 × 10⁻¹ | beta | 4.18 × 10⁻¹ | 3.38 | 8.44 | 2.04 × 10⁻² |
| 25 | 5.28 × 10⁻² | beta | 4.63 × 10⁻¹ | 8.30 | 8.44 | 5.13 × 10⁻³ | |
| 20 | 1.28 × 10⁻² | beta | 4.92 × 10⁻¹ | 3.80 × 101 | 8.44 | 3.18 × 10⁻⁴ | |
| 15 | 5.88 × 10⁻³ | beta | 4.96 × 10⁻¹ | 8.38 × 101 | 8.44 | 6.85 × 10⁻⁵ | |
| 10 | 1.61 × 10⁻³ | beta | 4.99 × 10⁻¹ | 3.10 × 10² | 8.44 | 5.15 × 10⁻⁶ | |
| HVAC Failure Probability | 1.50 × 10⁻⁴ | beta | 5.00 × 10⁻¹ | 3.33 × 10³ | 8.44 | 4.50 × 10⁻⁸ | |
| Sequence Number | Frequency | Sequence Number/Group | Frequency |
|---|---|---|---|
| 1 | 9.968 × 10⁻⁶ | 13 | 1.113 × 10⁻⁵ |
| 2 | 1.209 × 10⁻⁶ | 14 | 6.580 × 10⁻⁸ |
| 3 | 2.304 × 10⁻⁸ | 15 | 6.901 × 10⁻¹¹ |
| 4 | 3.457 × 10⁻¹² | 16 | 1.035 × 10⁻¹⁴ |
| 5 | 1.061 × 10⁻⁵ | 17 | 1.118 × 10⁻⁵ |
| 6 | 5.860 × 10⁻⁷ | 18 | 1.799 × 10⁻⁸ |
| 7 | 5.567 × 10⁻⁹ | 19 | 5.149 × 10⁻¹² |
| 8 | 8.352 × 10⁻¹³ | 20 | 7.725 × 10⁻¹⁶ |
| 9 | 1.106 × 10⁻⁵ | OK | 5.395 × 10⁻⁵ |
| 10 | 1.425 × 10⁻⁷ | Direct Exposure | 2.021 × 10⁻⁶ |
| 11 | 3.246 × 10⁻¹⁰ | Noble Gas | 2.901 × 10⁻⁸ |
| 12 | 4.870 × 10⁻¹⁴ | Radionuclide Release | 4.352 × 10⁻¹² |
| Sequence Number or Sequence Group | Mean Frequency | Uncertainty (10,000 Monte Carlo Samples) | ||
|---|---|---|---|---|
| 5th Percentile | Median | 95th Percentile | ||
| 1 | 9.904 × 10⁻⁶ | 4.230 × 10⁻⁸ | 4.608 × 10⁻⁶ | 3.776 × 10⁻⁵ |
| 2 | 1.227 × 10⁻⁶ | 1.283 × 10⁻¹⁰ | 1.475 × 10⁻⁷ | 6.134 × 10⁻⁶ |
| 3 | 2.269 × 10⁻⁸ | 2.138 × 10⁻¹³ | 7.440 × 10⁻¹⁰ | 9.862 × 10⁻⁸ |
| 4 | 3.486 × 10⁻¹² | 3.697 × 10⁻¹⁸ | 3.472 × 10⁻¹⁴ | 1.087 × 10⁻¹¹ |
| 5 | 1.108 × 10⁻⁵ | 4.173 × 10⁻⁸ | 5.074 × 10⁻⁶ | 4.180 × 10⁻⁵ |
| 6 | 6.071 × 10⁻⁷ | 9.754 × 10⁻¹¹ | 7.292 × 10⁻⁸ | 2.838 × 10⁻⁶ |
| 7 | 6.037 × 10⁻⁹ | 7.098 × 10⁻¹⁴ | 2.110 × 10⁻¹⁰ | 2.657 × 10⁻⁸ |
| 8 | 8.259 × 10⁻¹³ | 1.311 × 10⁻¹⁸ | 8.864 × 10⁻¹⁵ | 2.666 × 10⁻¹² |
| 9 | 1.119 × 10⁻⁵ | 4.519 × 10⁻⁸ | 4.954 × 10⁻⁶ | 4.249 × 10⁻⁵ |
| 10 | 1.441 × 10⁻⁷ | 2.748 × 10⁻¹¹ | 1.764 × 10⁻⁸ | 6.921 × 10⁻⁷ |
| 11 | 3.074 × 10⁻¹⁰ | 5.343 × 10⁻¹⁵ | 1.222 × 10⁻¹¹ | 1.356 × 10⁻⁹ |
| 12 | 4.458 × 10⁻¹⁴ | 9.377 × 10⁻²⁰ | 4.992 × 10⁻¹⁶ | 1.424 × 10⁻¹³ |
| 13 | 1.117 × 10⁻⁵ | 4.078 × 10⁻⁸ | 5.151 × 10⁻⁶ | 4.250 × 10⁻⁵ |
| 14 | 6.481 × 10⁻⁸ | 1.403 × 10⁻¹¹ | 8.575 × 10⁻⁹ | 3.100 × 10⁻⁷ |
| 15 | 6.506 × 10⁻¹¹ | 1.360 × 10⁻¹⁵ | 8.479 × 10⁻¹² | 2.865 × 10⁻¹⁰ |
| 16 | 1.089 × 10⁻¹⁴ | 1.958 × 10⁻²⁰ | 1.190 × 10⁻¹⁶ | 3.271 × 10⁻¹⁴ |
| 17 | 1.102 × 10⁻⁵ | 4.290 × 10⁻⁸ | 4.959 × 10⁻⁶ | 4.292 × 10⁻⁵ |
| 18 | 1.849 × 10⁻⁸ | 3.831 × 10⁻¹² | 2.364 × 10⁻⁹ | 8.844 × 10⁻⁸ |
| 19 | 5.273 × 10⁻¹² | 9.506 × 10⁻¹⁷ | 1.828 × 10⁻¹³ | 2.117 × 10⁻¹¹ |
| 20 | 7.591 × 10⁻¹⁶ | 1.440 × 10⁻²¹ | 7.601 × 10⁻¹⁸ | 2.362 × 10⁻¹⁵ |
| Ok | 3.748 × 10⁻⁵ | 1.608 × 10⁻⁷ | 1.721 × 10⁻⁵ | 1.398 × 10⁻⁴ |
| Direct Exposure | 1.971 × 10⁻⁶ | 3.977 × 10⁻⁹ | 5.705 × 10⁻⁷ | 8.682 × 10⁻⁶ |
| Noble Gas | 2.928 × 10⁻⁸ | 1.248 × 10⁻¹¹ | 2.781 × 10⁻⁹ | 1.350 × 10⁻⁷ |
| Radionuclide Release | 4.864 × 10⁻¹² | 1.290 × 10⁻¹⁶ | 1.229 × 10⁻¹³ | 1.469 × 10⁻¹¹ |
| Parameter | Value | Unit |
|---|---|---|
| Thermal power | 250 | MWth |
| Number of fuel elements | 420,000 | - |
| Number of TRISO per fuel | 12,000 | - |
| Fuel type | U02 TRISO | - |
| Enrichment | 8.9 | % |
| Heavy metal per fuel elements | 7 | g |
| Average burn-up | 90 | GWd/tU |
| Fuel residence time | 1057 | Days |
| Diameter of pebble | 60 | mm |
| Fuel zone | 50 | mm |
| Chemical Group | Element or Isotope | Per Pebble Radioactivity (Ci) | 10 Pebble Radioactivity (Ci) | 100 Pebble Radioactivity (Ci) | Release Fraction |
|---|---|---|---|---|---|
| Noble Gas | Kr85 | 2.207 × 10⁻¹ | 2.207 | 2.207 × 101 | 1.00 |
| Kr87 | 1.939 × 10¹⁸ | 1.939 × 10¹⁹ | 1.939 × 10²⁰ | 1.00 | |
| Kr88 | 1.266 × 10¹⁸ | 1.266 × 10¹⁹ | 1.266 × 10²⁰ | 1.00 | |
| Xe133 | 4.797 × 10¹⁶ | 4.797 × 10¹⁷ | 4.797 × 10¹⁸ | 1.00 | |
| Xe135 | 1.335 × 10¹⁷ | 1.335 × 10¹⁸ | 1.335 × 10¹⁹ | 1.00 | |
| Halogens | I131 | 1.553 × 10¹⁶ | 1.553 × 10¹⁷ | 1.553 × 10¹⁸ | 1.00 |
| I132 | 7.164 × 10¹⁸ | 7.164 × 10¹⁹ | 7.164 × 10²⁰ | 2.00 × 10⁻² | |
| I133 | 3.161 × 10¹⁷ | 3.161 × 10¹⁸ | 3.161 × 10¹⁹ | 1.00 | |
| I134 | 3.550 × 10¹⁹ | 3.550 × 10²⁰ | 3.550 × 10²¹ | 1.00 | |
| I135 | 1.099 × 10¹⁸ | 1.099 × 10¹⁹ | 1.099 × 10²⁰ | 1.00 | |
| Alkali Metals | Cs134 | 1.517 × 10¹⁴ | 1.517 × 10¹⁵ | 1.517 × 10¹⁶ | 1.00 |
| Cs136 | 2.650 × 10⁻¹ | 2.650 | 2.650 × 101 | 1.00 | |
| Cs137 | 2.063 | 2.063 × 101 | 2.063 × 10² | 1.00 | |
| Rb86 | 1.014 × 10⁻² | 1.014 × 10⁻¹ | 1.014 | 1.00 | |
| Chalcogens | Te127 | 3.541 × 10⁻¹ | 3.541 | 3.541 × 101 | 2.00 × 10⁻² |
| Te129 | 1.246 | 1.246 × 101 | 1.246 × 10² | 2.00 × 10⁻² | |
| Te132 | 1.241 × 10¹⁷ | 1.241 × 10¹⁸ | 1.241 × 10¹⁹ | 2.00 × 10⁻² | |
| Alkali Earths | Sr89 | 4.614 | 4.614 × 101 | 4.614 × 10² | 2.00 × 10⁻³ |
| Sr90 | 1.821 | 1.821 × 101 | 1.821 × 10² | 2.00 × 10⁻³ | |
| Sr91 | 4.531 × 10¹⁷ | 4.531 × 10¹⁸ | 4.531 × 10¹⁹ | 2.00 × 10⁻³ | |
| Ba140 | 8.507 × 10¹⁵ | 8.507 × 10¹⁶ | 8.507 × 10¹⁷ | 2.00 × 10⁻³ | |
| Y90 | 2.010 | 2.010 × 101 | 2.010 × 10² | 2.00 × 10⁻³ | |
| Y91 | 6.083 | 6.083 × 101 | 6.083 × 10² | 1.00 × 10⁻¹ | |
| Transition Elements | Zr95 | 5.271 × 10¹⁵ | 5.271 × 10¹⁶ | 5.271 × 10¹⁷ | 1.00 × 10⁻² |
| Zr97 | 2.666 × 10¹⁷ | 2.666 × 10¹⁸ | 2.666 × 10¹⁹ | 1.00 × 10⁻² | |
| Nb95 | 1.017 × 10¹⁶ | 1.017 × 10¹⁷ | 1.017 × 10¹⁸ | 1.00 × 10⁻² | |
| Miscellaneous | Sb127 | 3.533 × 10⁻¹ | 3.533 | 3.533 × 101 | 1.00 |
| Sb129 | 1.260 | 1.260 × 101 | 1.260 × 10² | 1.00 | |
| Mo99 | 1.004 × 10¹⁶ | 1.004 × 10¹⁷ | 1.004 × 10¹⁸ | 1.00 × 10⁻⁶ | |
| Ru103 | 6.429 × 10¹⁵ | 6.429 × 10¹⁶ | 6.429 × 10¹⁷ | 2.00 × 10⁻⁵ | |
| Ru105 | 1.093 × 10¹⁸ | 1.093 × 10¹⁹ | 1.093 × 10²⁰ | 2.00 × 10⁻⁵ | |
| Ru106 | 2.819 | 2.819 × 101 | 2.819 × 10² | 2.00 × 10⁻⁵ | |
| Lanthanides | La140 | 4.263 × 10¹⁷ | 4.263 × 10¹⁸ | 4.263 × 10¹⁹ | 1.00 × 10⁻⁶ |
| Ce141 | 6.260 × 10¹⁵ | 6.260 × 10¹⁶ | 6.260 × 10¹⁷ | 1.00 × 10⁻⁶ | |
| Ce143 | 2.527 × 10¹⁷ | 2.527 × 10¹⁸ | 2.527 × 10¹⁹ | 1.00 × 10⁻⁶ | |
| Ce144 | 3.881 × 10¹⁴ | 3.881 × 10¹⁵ | 3.881 × 10¹⁶ | 1.00 × 10⁻⁶ | |
| Pr143 | 7.236 | 7.236 × 101 | 7.236 × 10² | 1.00 × 10⁻⁶ | |
| Nd147 | 7.265 × 10¹⁵ | 7.265 × 10¹⁶ | 7.265 × 10¹⁷ | 1.00 × 10⁻⁶ | |
| Np239 | 1.122 × 10¹⁸ | 1.122 × 10¹⁹ | 1.122 × 10²⁰ | 1.00 × 10⁻⁶ | |
| Transuranic | Pu238 | 7.329 × 101 | 7.329 × 10² | 7.329 × 10³ | 1.00 × 10⁻⁶ |
| Pu239 | 6.029 × 10⁻² | 6.029 × 10⁻¹ | 6.029 | 1.00 × 10⁻⁶ | |
| Pu240 | 4.425 | 4.425 × 101 | 4.425 × 10² | 1.00 × 10⁻⁶ | |
| Pu241 | 2.105 × 10⁻¹ | 2.105 | 2.105 × 101 | 1.00 × 10⁻⁶ | |
| Am241 | 6.758 × 10⁻¹ | 6.758 | 6.758 × 101 | 1.00 × 10⁻⁶ |
| Material | Height (cm) | Thickness (cm) | |
|---|---|---|---|
| Pebbles in the canister | Graphite | 418 | 89 |
| Canister | 304 SL | 2.5 | |
| Air-gap between the canister and the inside wall | Air | 30 | |
| Inside wall (silo well) | Barite concrete | 100 | |
| Air-gap between the inside wall and outside wall | Air | 100 | |
| Outside wall (SFSS building) | NBS concrete | 100 |
| Release Categories | Exposure Rate (mR/h) | Absorbed Dose Rate (mrad/h) |
|---|---|---|
| Radionuclide Release | 1.63 × 10⁻⁶ | 1.42 × 10⁻⁶ |
| Noble Gas | 1.41 × 10⁻⁸ | 1.23 × 10⁻⁸ |
| Direct Exposure | 7.39 × 10⁻¹⁰ | 6.45 × 10⁻¹⁰ |
| Input Variables | Range | Numbers |
|---|---|---|
| Number of failed pebbles | 1 to 30,000 | 7 |
| Distance between canister surface and source | From the source to 0 | 3 |
| Inside wall thickness | [75, 100, 125] | 3 |
| Outside wall thickness | [75, 100, 125] | 3 |
| Total number of datasets | 189 | |
| Exposure Rate | At the Outside of the Storage (A) | At the EAB (B) |
|---|---|---|
| Distance from the source | 10 m | 5 km |
| R-squared | 0.108 | 1.00 |
| p-value for goodness-of-fit test | 2.89 × 10⁻⁴ | 0 |
| Impact Variables | At the Outside of the Storage (A) | At the EAB (B) |
|---|---|---|
| Number of pebbles | 1.438 × 10⁻¹ | 1 |
| Distance | −8.78 × 10⁻² | −3.557 × 10⁻⁵ |
| Inside wall thickness | −1.889 × 10⁻¹ | 1.388 × 10⁻¹⁷ |
| Outside wall thickness | −1.848 × 10⁻¹ | −1.735 × 10⁻¹⁷ |
| Sensitivity for case A | Sensitivity for case B | |
 |  |
| Release Categories | Consequence (mrad/h) | Consequence (30 Days-REM) | Frequency (/Year) | Risk (REM/Year) |
|---|---|---|---|---|
| Radionuclide Release | 1.42 × 10⁻⁶ | 1.022 × 10⁻⁶ | 4.352 × 10⁻¹² | 4.449 × 10⁻¹⁸ |
| Noble Gas | 1.23 × 10⁻⁸ | 8.856 × 10⁻⁹ | 2.901 × 10⁻⁸ | 2.569 × 10⁻¹⁶ |
| Direct Exposure | 7.39 × 10⁻¹⁰ | 5.321 × 10⁻¹⁰ | 2.021 × 10⁻⁶ | 1.075 × 10⁻¹⁵ |
Disclaimer/Publisher’s Note: The statements, opinions and data contained in all publications are solely those of the individual author(s) and contributor(s) and not of MDPI and/or the editor(s). MDPI and/or the editor(s) disclaim responsibility for any injury to people or property resulting from any ideas, methods, instructions or products referred to in the content. |
© 2023 by the authors. Licensee MDPI, Basel, Switzerland. This article is an open access article distributed under the terms and conditions of the Creative Commons Attribution (CC BY) license (https://creativecommons.org/licenses/by/4.0/).
Share and Cite
Lee, J.; Tayfur, H.; Hamza, M.M.; Alzahrani, Y.A.; Diaconeasa, M.A. A Limited-Scope Probabilistic Risk Assessment Study to Risk-Inform the Design of a Fuel Storage System for Spent Pebble-Filled Dry Casks. Eng 2023, 4, 1655-1683. https://doi.org/10.3390/eng4020094
Lee J, Tayfur H, Hamza MM, Alzahrani YA, Diaconeasa MA. A Limited-Scope Probabilistic Risk Assessment Study to Risk-Inform the Design of a Fuel Storage System for Spent Pebble-Filled Dry Casks. Eng. 2023; 4(2):1655-1683. https://doi.org/10.3390/eng4020094
Chicago/Turabian StyleLee, Joomyung, Havva Tayfur, Mostafa M. Hamza, Yahya A. Alzahrani, and Mihai A. Diaconeasa. 2023. "A Limited-Scope Probabilistic Risk Assessment Study to Risk-Inform the Design of a Fuel Storage System for Spent Pebble-Filled Dry Casks" Eng 4, no. 2: 1655-1683. https://doi.org/10.3390/eng4020094