1. Introduction
The situation of urban roadway asset management is complicated by the social, environmental, political, and budgetary constraints of transportation agencies, making sustainability the primary concern [
1]. Current research on life-cycle assessment of roadways has focused on either material type or pavement overlay (e.g., Hasan et al. [
2], Santero et al. [
3] and AzariJafari et al. [
4]). The policies and decisions involved with investments on transportation infrastructures interact with exogenous variables of urban density, traffic congestion due to specific roadway design (e.g., single vs. multiple carriageways, intersections and length, and public-transport lanes), and number of lanes [
5]; however, complimentary facilities of on-street parking and adjacent parking zones [
6] must also be considered. Shoup [
6] and Hawas et al. [
7] noted that the decision of commuters to choose between private vehicles and public transport is affected by these factors. The choice of travellers to lean towards any mode choice, regardless of its private or shared nature, is affected by the trip purpose, perceived service quality, and service attributes, which are sensitive to the individuals and are largely impacted by the transit options available in a region, social and cultural norms, and the trade-off between perceived service and quality [
8]. Mass-transit systems also open a window of opportunity for any urban area to reduce its transportation-related cost and environmental burdens [
9]. Yet, due to the high investment cost requirement and involvement of the public, administrative agencies demand that the perception of transportation system functionality and attributes is an integral part of planning.
A number of studies [
10,
11] have suggested that the attitudes of people towards transportation systems are increasingly becoming complex as their understanding of daily commute, safety, travel duration, and ride quality change. This is especially significant since transport authorities have to optimise the public system against multiple competing private, short-term rental, shared, and on-demand options. In a changing transit mode choice environment, micro-mobility integration can affect public-transport attraction compared to other modes, particularly in the wake of a return to normalcy after the lifting of COVID-19-related mobility restrictions, where increased mobility is expected [
12]. The importance of an accessibility-based approach in this context was recently explored in a study by Ali et al. [
13], which highlighted that focusing on accessibility to plan transport solutions is especially significant for resilient transport planning, and that transit solutions should be gauged through travel time.
Nonetheless, the association between public-transit accessibility and usage frequency is not a recent topic in transport policy research and has been addressed in multiple studies soliciting usage patterns and underlying contributory variables from questionnaire surveys. As one of the earliest explorations, an empirical study on the association between travel behaviour of urban travellers and scale of the urban neighbourhood was conducted by Krizek [
14]. They found that the reported vehicle miles travelled were reduced if the accessibility of the neighbourhood increased. Another study focusing on the effect of urban form on the variation of travel behaviour was conducted by Pan et al. [
15] in four selected Shanghai neighbourhoods. They proposed that, if neighbourhoods are designed with denser street networks, the increased reliance on private vehicle travel induced by higher incomes may be replaced by bicycle/pedestrian trips.
The reasons for a traveller to choose to drive to work in a small urban English area were investigated by Gardner and Abraham [
16] through 19 semi-structured interviews with private vehicle users. They found that the decision may be primarily driven by monetary costs, effort minimisation, origin destination, and time spent in journey as the public transport was perceived to be comparatively slower. Delays in the public-transport system and lack of reliance on its schedule, strikes, and perceived safety were noted as critical factors. Private vehicle commuters also highlighted the importance of the public-transport system in dealing with the problem of parking, which has been noted by researchers [
17,
18] as responsible for traffic congestion, as well as the cost and environmental burdens of a roadway system.
Another early qualitative study to identify the mode choice attitude of car and public-transport users was conducted by Beirão and Cabral [
8]. They found that the mode choice is affected by situational variables, perceived performance, journey type, and user lifestyle and characteristics. They proposed that the policy-making process should accommodate customer expectations so that the usage of public-transport systems can be increased. In the context of transitioning economies, Grdzelishvili and Sathre [
19] investigated the travel behaviour of Tbilisi residents. They identified perceived safety, comfort, frequency, and time as the most important factors that tended to skew the survey respondents towards private vehicle ownership and usage.
The service quality attributes of public transport and the social dynamics associated with car use and ownership factors were also found to influence the travellers’ mode choice in a study by Javid et al. [
20], where it was also observed that, in order for a public-transport authority to motivate more users towards public bus transport, survey responses and service quality attribute optimisation should be conducted. In a follow-up study [
21], the authors argued that, in a mixed-mode use environment where multiple competitive transport choices including private cars, public bus transport, shared bus transport and shared taxis, and car-rental services are present, it is absolutely imperative to analyse the user satisfaction according to service quality attributes. Data on bus transport service riders using flexible on-demand service options of two app-based bus services were collected using a questionnaire survey. The authors found that waiting time at the bus stop, income profile and profession of the travellers, vehicle ownership, and trip purpose were significant predictors of mode choices by applying factor analysis and structural Equation modelling techniques. The study also noted that a positive perception of the users affects their usage tendency for bus transport. Students and privately employed individuals were more inclined to use bus services, whereas increases in bus-stop waiting time and travel time, as well as low coverage/accessibility, negatively affected usage.
The City of Abu Dhabi has witnessed an increase in population, accompanied by an increasing dependence of commuters on private vehicle use, resulting in traffic congestion in urban Abu Dhabi localities [
22]. Most studies in the country have focused on road transport from the infrastructural [
23,
24], environmental [
25,
26], cost [
27,
28], or traffic safety [
29] perspectives, while some [
30] extended the research to operational and facility management issues for providing connected pathways from urban communities to city centres and central business hubs and districts. However, the above-referred studies hinted that the urban transportation network cannot be solely evaluated by conventional cost and environmental aspects; a social aspect should also be considered. However, very few studies have addressed the travel behaviour and perception of urban public-transport network in Abu Dhabi city.
The literature review conducted above highlights that, in order to promote public transport among urban travellers in a mixed-mode choice environment, the critical variables of service quality, accessibility, and travel time need to be optimised. However, the definition of the former two attributes is scattered in literature and regional-dependent, including aspects such as safety, onboard facilities, connection (waiting stops/stations) facilities, and cost for service quality and network coverage, service frequency, seating, and community inclusion for accessibility. Additionally, most studies were conducted in the European region, where the public-transport system is well-developed, and car-free precincts exist that regulatorily and culturally promote sustainable transit options (walking and public transport) over car use. Studies conducted in the developing world either focused on on-demand bus mobility options or did not include income- and employment-related variables, which affect the affordability and lack of choice parameters, potentially rendering travellers incapable of choosing costlier options over public-transport services. Abu Dhabi provides a unique opportunity to investigate the travel mode choice patterns of multicultural residents belonging to different income groups and sociodemographic categories in a highly developed infrastructural yet car-dependent urban setting, where enhanced public-transport planning informed by public preferences can trigger a positive shift. This study attempts to address this by soliciting public responses on a questionnaire survey to establish a clear definition of service quality, accessibility, and travel time attributes for Abu Dhabi (and, by extension, the multicultural countries in the Gulf Cooperation Council), which can result in public-transport uptake, as well as produce insights into the various sociodemographic classes that utilise this mode for their transit needs.
2. Method
This work was conducted to form the basis of a pilot study exploring the application of innovative mass transit over the lifecycle of a transportation infrastructure asset. The strategy of this study was intended to primarily focus on capturing the use of public transport, specifically bus transport, in the urban area of Abu Dhabi. Travel behaviour, user demographics, attitude towards travel, and trip distribution are emphasised.
2.1. Questionnaire Design, Bus Routes, and Sample Size Selection
The questionnaire used for data collection was designed for soliciting the travel information of bus users, perception of existing bus network, demographic profile of the service benefiters, and their respective attitude towards travelling attributes: network coverage, quality and satisfaction, perception of congestion, and potential improvement strategies. The questionnaire was limited to 11 multiple-choice questions designed to take less than 5 min. The detailed questionnaire including the sub-questions and options is provided in the
Supplementary Materials. The survey was administered using the CAPI-based surveying methodology for on-site data collection. Teams of multilingual surveyors administrated questionnaires in both Arabic and English, along with the capabilities to assist passengers from various ethnic and lingual backgrounds.
The purpose of study was to target the steady growth in urban Abu Dhabi; as such, according to the DoT observations, the area between Corniche and Hazaa Bin Zayed the First Street was selected. To increase the range of collected samples, interviews were conducted on both weekdays and weekends during two 8 h shifts. The collected data were collected and tabulated using MS Excel. A total of 769 interviews on the weekend and 751 interviews on weekdays were completed, and all responses with missing or incomplete responses were disregarded according to the exclusion criteria set by the local transport authority responsible for data collection, curation, and management.
2.2. Data Analysis
An analysis was performed of the survey data collected for the Public-Transport Usage Study of the Abu Dhabi Department of Transport, as part of the Abu Dhabi government’s initiatives to reduce travel dependency on cars and reduce the increasing traffic congestion problems currently being observed in the city.
Logical checking of data consistency was performed of the raw data MS Excel files to address data sparseness, outliers, and missing data. Interlinking of passenger demographics against travel attributes resulted in minor data revisions. The revised data were broken down into three different sections: distribution of generated trips for each mode (i.e., bus and car travel) and current level of network coverage. The literature review section highlighted that accessibility, service quality, and travel time affect the mode choice of travellers; however, the exact distribution and inclusion of variables within these attributes differed across studies. In order to investigate this further and estimate the effect of including service frequency, perceived congestion, onboard situation, trip purpose, and bus-stop and coverage facilities on public-transport uptake over competing modes (particularly private cars), four different regression models were tested with two primary objectives: if inclusion of the variables in TSC, TA, and SDV blocks improved model fit, and which parameter is a strong predictor.
Three different variable blocks were created for statistical analysis, with the variable description presented in
Table 1 and comparison method explained in the last three rows. The analysis was conducted in SPSS v22. Models were controlled for the reference category in ordinal regression analysis (i.e., very satisfied for NetCovSat, five or more times a week for FBT, and first time for FCT). Reference categories were selected to identify the comparative influence of independent variable blocks on decreasing the satisfaction level of the public-transport system and increasing reliance on travel by taxis and private cars.
3. Results and Discussion
The results of the analysis were tabulated in separate sheets according to respective occurrence on the weekdays and weekends. Statistical analysis suggests that the majority (57%) of the survey respondents were South Asians, regardless of weekday or weekend. Moreover, the younger (i.e., 25–34 years old; 48% for both weekdays and weekends) male population (weekdays: 86% and weekends: 89%) largely working in the full-time workforce formed the largest (83%) proportion of the respondents. According to the previously recorded statistical distribution of the Abu Dhabi city residents, these results are representative of the local population, which is predominantly (62%) male in the under 34 years old (66%) age group, with over 50% being of South Asian descent [
31,
32]. The income profile captured in the survey showed that the majority earned a gross monthly salary of AED 1000–5000, which is also in line with the findings of these previous statistical studies which found the majority to be full-time workers earning an average monthly salary of AED 3500.
Regarding the statistical response distribution of the qualitative data variables, the majority perceived bus travel as an uneasy transit mode, yet found them to not be very crowded; however, respondents were unsatisfied with the current distribution of the bus stops on the surveyed networks as they reported spending over 15 min to reach the nearest stop. Additionally, the majority had a neutral perception of current travel time while using public bus services and either had a good or neutral perception of the current conditions of bus stops.
To address the research question of travel behaviour patterns and what variables define service quality, accessibility, and the eventual mode choice, three multinomial dependent variables (MDVs) were identified: frequency of bus travel (FBT), frequency of car travel (FCT), and network coverage satisfaction (NetCovSat). NetCovSat was originally recorded on a Likert-type scale in the order of decreasing likeability of the DV, whereas FCT and FBT were arranged with “1” representing more frequent travel (i.e., five or more times a week) and “6” representing the least travel first time. The percentage distribution of respondents on each scale was used to reverse-recode FBT and NetCovSat so as to represent a higher occurrence with increasing numeral order.
The probability of mode choice for a traveller was affected by several parameters and factors of transportation system characteristics, travel attributes, and sociodemographic variables, as shown in the multistage multinomial logistic regression models summarised in
Table 2. Results from the weekday analysis are presented first, followed by the weekend analytical analysis results. Similarly, variables from each block were carried forwards to subsequent analysis except for SDV-independent variable block, which was separately performed, and the variables were then added in the logistic regression equations to perform the final analysis.
Odds ratios, i.e., the probability that a certain variable may influence the outcome of the model when all other variables are controlled, as well as model fit and significance level, of the regression models for recorded polychotomous variables are provided in
Table 2.
3.1. Factors in Traveller Satisfaction from Public-Transport Network Coverage
Analysis results showed strong correlation between the transportation system characteristics and satisfaction of public-transport system users, as also reported in the literature. Results were generally similar across weekdays and weekends. Distance to nearby bus stop was only negligibly identified as an obstacle across all four variable blocks, with the OR remaining in the range of 0.98–1.004, signifying a relatively unimportant association. Strong correlation of traveller satisfaction with frequency of buses and network coverage was also noticed, with odds ratios < 1 (
Table 2) for all variable blocks with high significance, implying that, as users perceived buses to be more frequent, the probability of respondents being satisfied with the network coverage also increased. These results are partially supported by findings from similar cultural contexts in literature, where service frequency [
33] and network coverage [
34] were found to define the accessibility parameter, yet the direct correlation between parameters was not estimated.
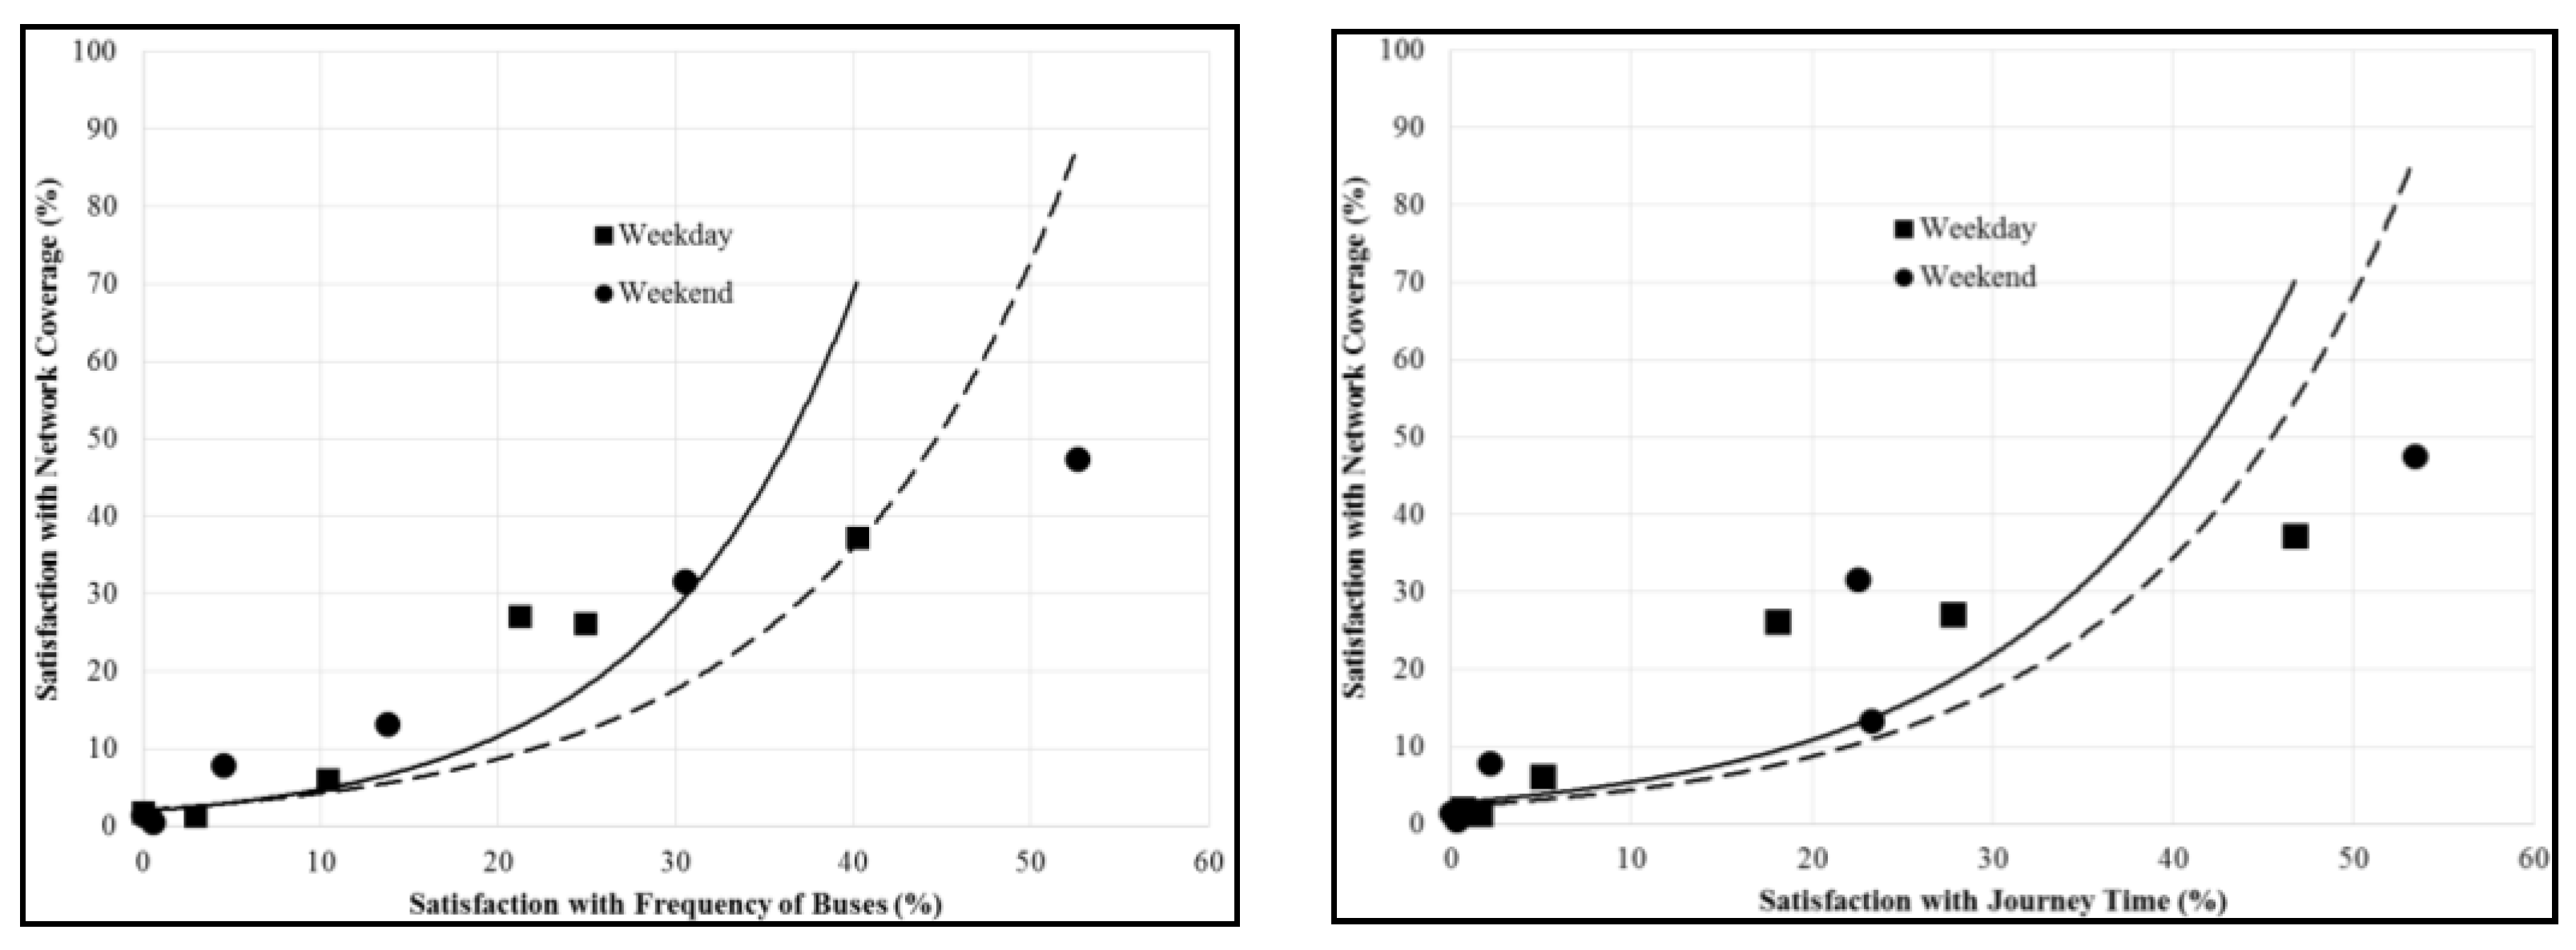
The second main concern of public-transport users was the journey time, where increasing satisfaction with time spent on a trip was associated with a higher rating of network coverage (OR ≈ 0.586–0.642 > 1).
Figure 1 also shows this strong association, whereby 37% of weekday users and 48% of weekend users were satisfied with the coverage of the public-transport network. Most respondents (40% weekday, 53% weekend) were satisfied with the frequency of buses and journey time (47% weekday, 53% weekend). In general, public-transport users were more satisfied with network as these two factors became more satisfactory. These results somewhat comply with the findings of Gibson et al. [
35] which compared rapid bus lanes against mixed traffic, finding that savings in the user time represented one of the most important benefits, and that its relation with network coverage was similar to service frequency following response curves that displayed an exponential or power model style trend.
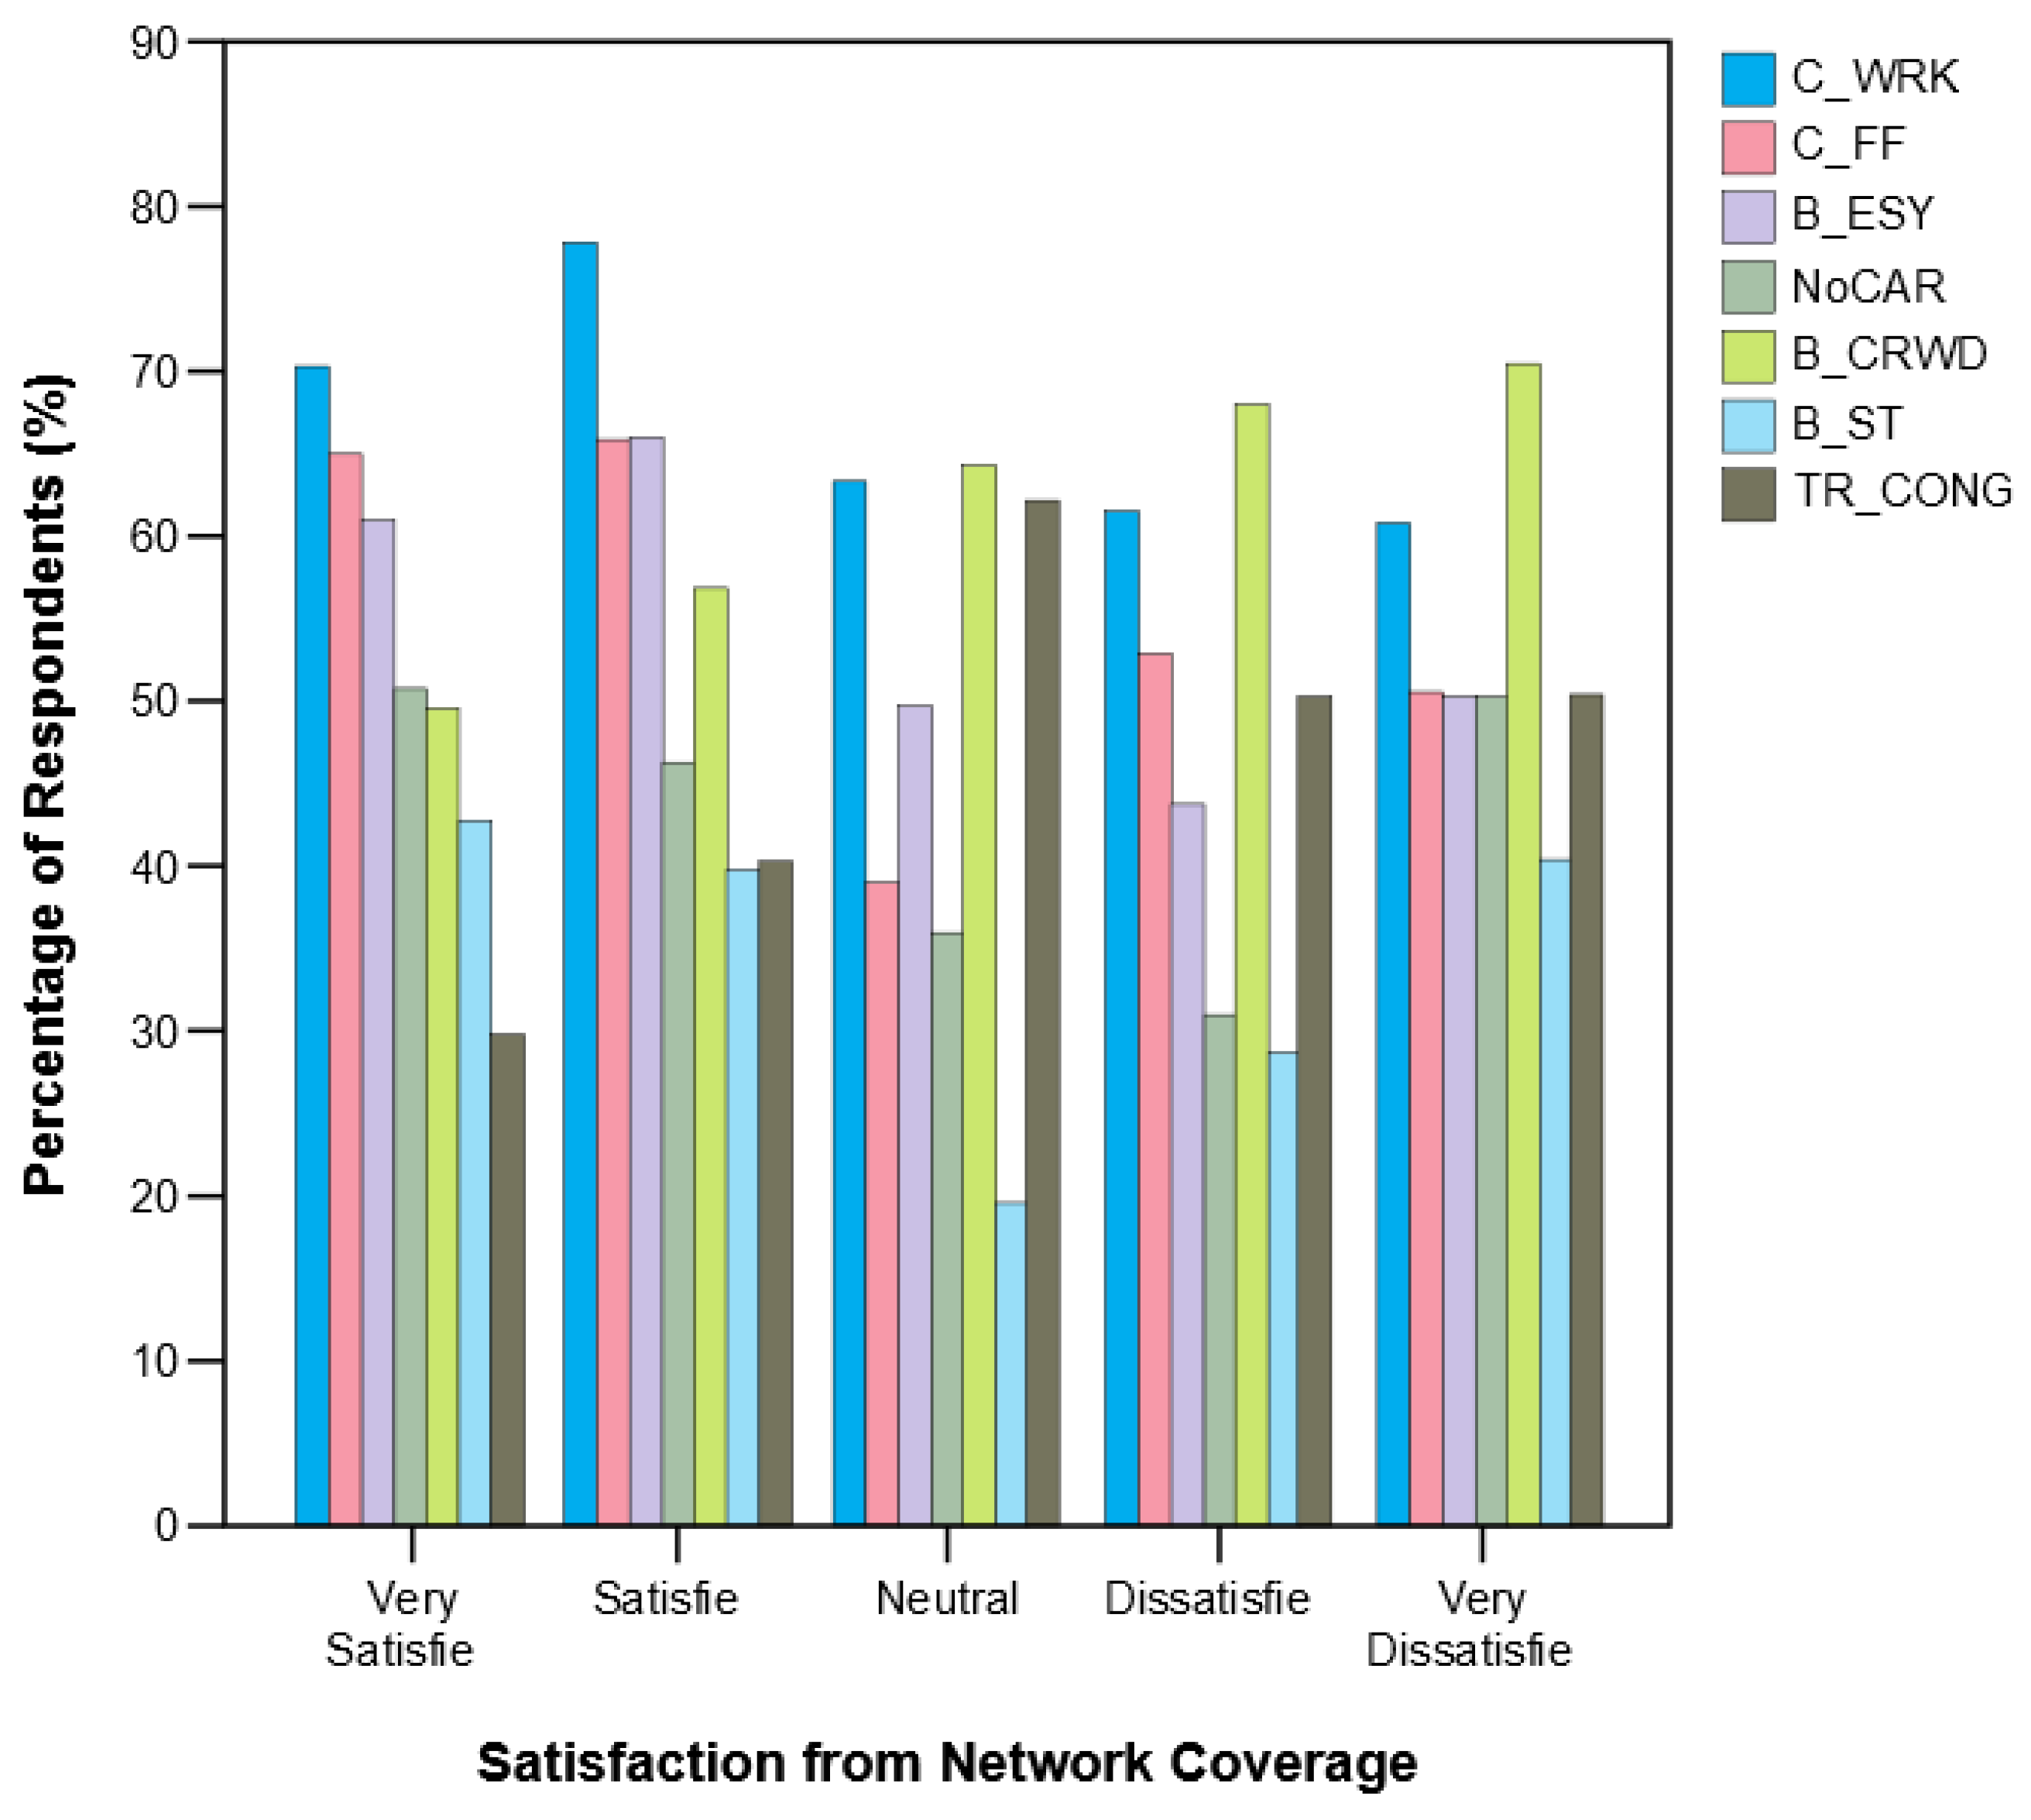
Sociodemographic variables of nationality and income showed little effect on the probability of a user to respond favourably with regard to network coverage (OR ≈ 1), and only a slight influence of age (OR ≈ 0.8, for SDV and third-stage models). Users were also asked if their mode choice was influenced by travel attributes and closeness to work, and family was reported by all users as most important. The main reasons stated for dissatisfaction with PT network coverage were crowded buses (67% and 70%) and traffic congestion (~50%). This suggests capacity distribution in public buses and traffic congestion on roads as critical issues, as also noted by Tyrinopoulos and Antoniou [
36]. Further illustrating this,
Figure 2 shows that, for the travellers that were largely dissatisfied with the current network coverage of the public-transport service in the studied region, onboard crowding and traffic congestion were noted as significant variables influencing their perception of the public transport. On the other hand,
Figure 2 also shows that the satisfied traveller groups largely considered bus travel as the easier transit mode for their work- and family-related trips.
3.2. Crosslink between Travel Mode Choice and IDV Blocks
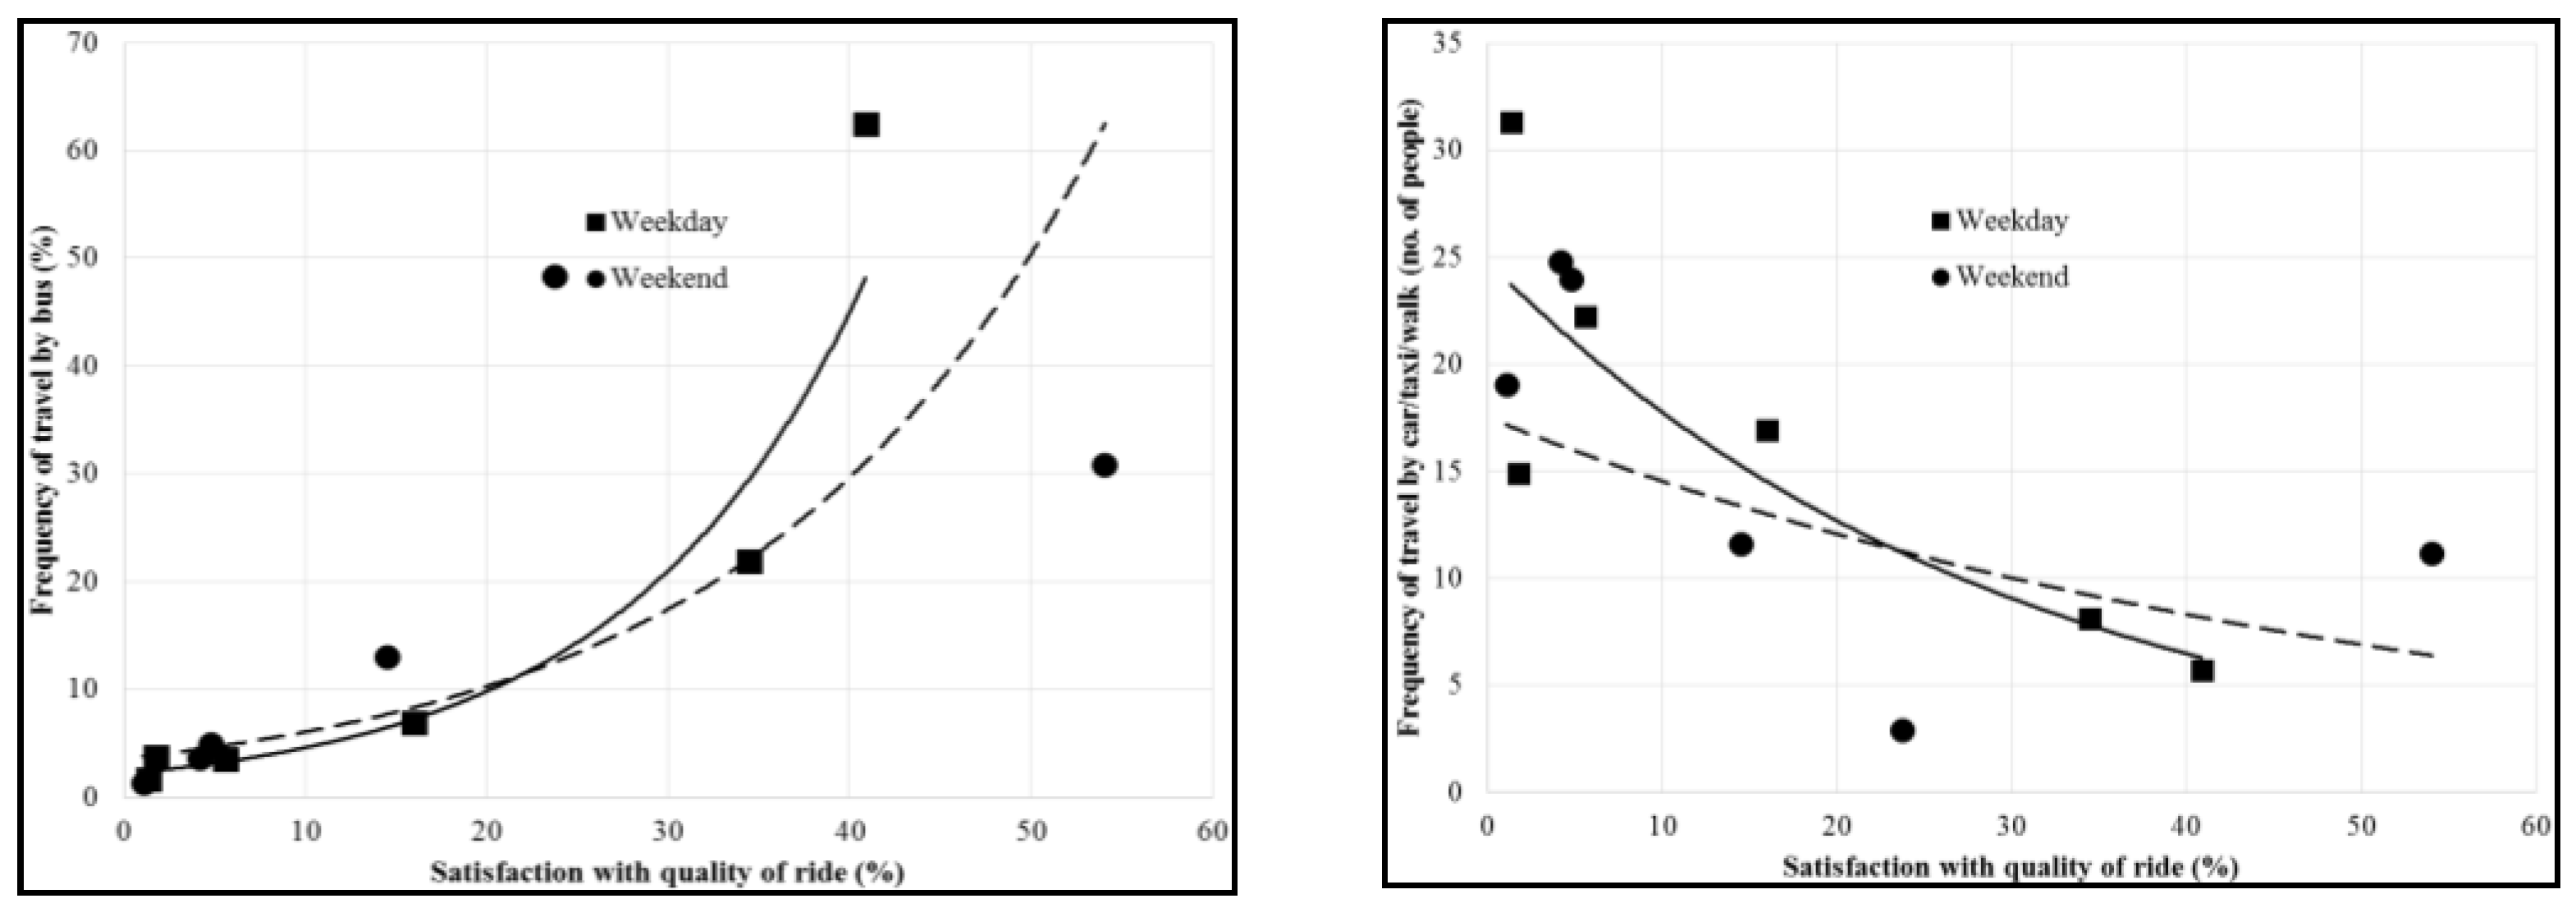
Anticipated yet contrasting results were obtained for the transportation system characteristics across all variable blocks of travel mode choice models. A user’s choice of mode was relatively unaffected by the distance from the bus station (OR ≈ 1), while journey time adversely influenced travel by both car and bus. Users reported that, in bus travel, the likelihood of trip frequency tended to decrease with increasing traffic (OR generally >1). On the other hand, increasing quality of ride positively affected the frequency of bus travels (OR generally <1) as also validated by the trendline shown in
Figure 3, despite the scattered nature of traveller percentage.
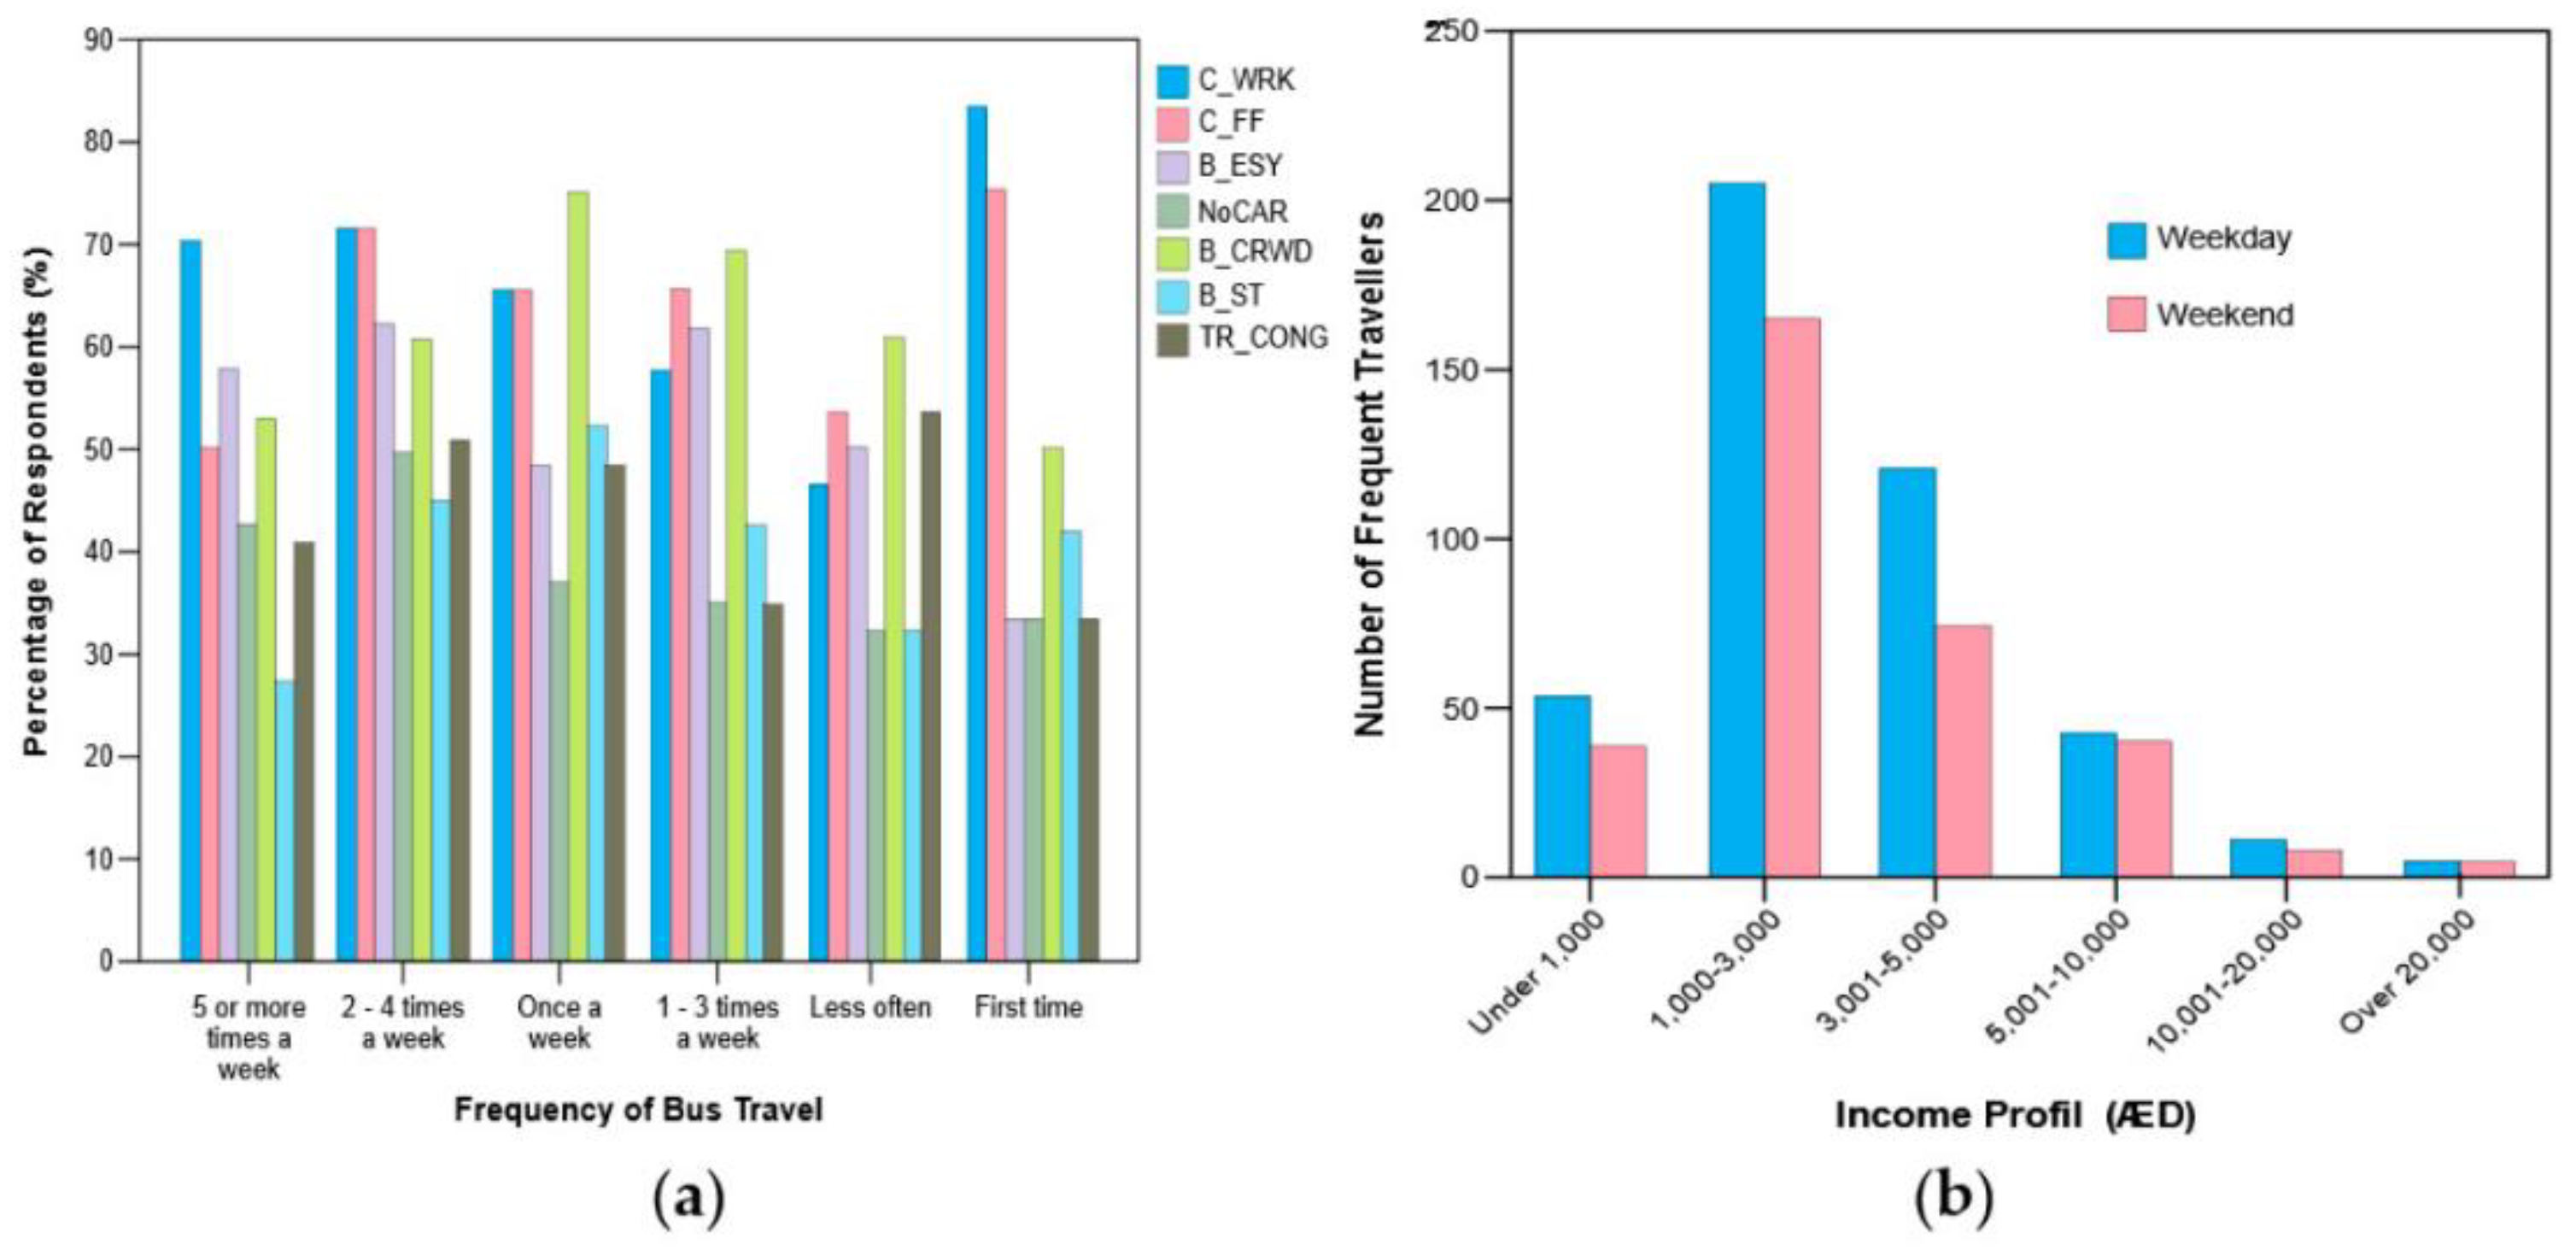
Urban populations tended to be unevenly distributed towards transport usage patterns as public-transport use tended to skew towards lower-income brackets. The Abu Dhabi population exhibited similar trends when analysed for sociodemographic variables, as shown in
Figure 4, with the majority of users from the lower–middle-income bracket (1000–3000 AED/month) for both weekdays (~28.3%) and weekends (~21.9%). The results were also characterised by the observance that most users (~42%) for both also reported that they either did not own a car or could not afford to travel by taxis. Results displayed in
Figure 4 also show that, regardless of bus travel frequency, respondents highlighted traffic congestion as the main obstacle. This finding may further extend the range of critical public-transport service attributes to include not only the quantitative travel time attribute, as also noted heavily in the literature [
34,
37], but also the qualitative perceived traffic congestion variable, which is comparatively less explored.
3.3. Hypothesis Model Improvement Tests across TSC, TA, and SDV Blocks
The previous sections exhibited that the inclusion of income profile, service frequency, and perceived traffic congestion were significant variables influencing public-transport uptake over competing modes (particularly private cars), in addition to the conventional accessibility, quality, and travel time attributes. This was further investigated in the regression modelling stage as four different models were tested with two primary objectives: if inclusion of variables improved model fit, and which parameter was a strong predictor. In the case of network coverage satisfaction, compared with the null hypothesis, adding transport service characteristics (TSC) variables (see
Table 1) improved the model, as the −2 log likelihood decreased (weekday: χ
2 = 253.74,
p < 0.0001; weekend: χ
2 = 259.79,
p < 0.0001), showing relatively good fit (weekday: ρ
2 = 0.132; weekend: ρ
2 = 0.142).
Further addition of travel attribute variables improved model fit as the −2LL further decreased (weekday: χ
2 = 333.801,
p < 0.0001; weekend: χ
2 = 288.979,
p < 0.0001), also improving the goodness of fit (weekday: ρ
2 = 0.173; weekend: ρ
2 = 0.158). When both variable blocks were removed from the regression model and only the effect of SDV block was tested, the parameterised model showed a small improvement (weekday: χ
2 = 4.94,
p < 0.0001; weekend: χ
2 = 3.56,
p < 0.0001) while the McFadden ρ
2 also decreased. As can be anticipated, adding all three variable blocks simultaneously in the regression equation produced adverse effects on model fit (
Table 2). The results show that, while both TSC and TA variable blocks were significant predictors of a respondent’s satisfaction with transport network coverage, and even though some SDVs may have also been successful in prediction, their effect may have been nullified once TSC and TA variables were present in the logistic regression equations, showing that postulating the perceived congestion and frequency for estimating accessibility and network coverage variables improved the prediction abilities of the model.
Mode choice models exhibited slightly different behaviour to the network coverage models, where similar effects of the SDV model and expansion of the “TSC and TA model” to include SDV block were found for the weekend data. On the other hand, models based on weekday data tended to display optimum fitness for the final models that included all three variable blocks. For example, models investigating the frequency of bus travel found that the −2LL of the parametrised model containing all three variables was lower than the null hypothesis (weekday: χ2 = 76.14, p < 0.0001; weekend: χ2 = 89.509, p < 0.0001), supported by a higher goodness of fit (weekday: ρ2 = 0.052; weekend: ρ2 = 0.053). Although the McFadden ρ2 was comparatively lower for mode choice models, the values were higher for parameterised model with three variable blocks.
4. Conclusions
The analysis results of the collected urban travel survey exhibited that travel attributes, especially service frequency, closeness to trip origin/destination, and traffic congestion, as well as characteristics of the transportation system, are predictors of the accessibility, network coverage, service quality, and by extension, the mode choice. This shows that, while optimising public-transport services, particularly in the multicultural, developed infrastructure yet car-centric context of the rapidly developing countries in the Gulf Cooperation Council, it may not be sufficient to limit the definition of accessibility to extending network coverage or service quality to onboard seating or bus-stop quality, as the perception of a more comprehensive network itself may be affected by underlying variables of trip purpose, sociodemographic characteristics, traffic congestion while travelling on public transport, and service frequency, in addition to the more convention ride quality, onboard crowding, and travel time variables.
The regression results for the CAPI-based questionnaire survey data responses of urban Abu Dhabi residents showed that, within the TSC block, distance of a traveller from the bus station was comparatively unimportant, although past research covered in
Section 1 noted it as a significant factor. Comparisons of different variable blocks in regression models supported by objective responses of travellers showed that, across all datasets, network coverage satisfaction was reported to be only influenced by the TA and TSC blocks, where increasing congestion and frequency of buses correlated with traveller satisfaction. When mode choice behaviour was evaluated, expanded models containing all three variable blocks were more suited to explain the survey responses.
The findings of this study are important for gaining useful information about the perceived importance of several factors in the functionality of a public-transport system as postulated by the system users. This Abu Dhabi-based study suggests that there may be a hypothesised relationship between the ultimate decision of a user to travel via urban public-transport network instead of private vehicles and its attributes. Further research conducted in the field may be more supportive of this association between variables. At this stage, it should be noted that, although this study is one of the few studies analysing the sociodemographic trends and public-transport usage situation in the car-centric traveller mode choice situation of the Gulf Cooperation Countries, the United Arab Emirates, and particularly the City of Abu Dhabi, there are several shortcomings and limitations of the study that can be addressed in future work. Firstly, this study only collected responses about public bus transport usage compared to car use and did not consider a mixed-mode transit option where multiple competing public-transport modes can be compared to cars as the preferred mode choice. Secondly, it did not consider first- and last-mile choices, and responses captured relative to the provision of micro-mobility options supporting a large-scale public-transport network were not considered. This might greatly affect the tendency of respondents to lean towards private or public transport regardless of frequency or network coverage, as micro-mobility integration might bridge gaps in the current system.
It may also be noteworthy that some interaction between different variables and curvilinearity may also exist, which this study did not address. These shortcomings are acknowledged by the authors, and we aim to address them in future research. Nonetheless, this study showed that a future public-transport system needs to target the adverse effects of traffic congestion and crowded buses, as well as improve the quality of ride and increase the frequency of buses on the investigated travel routes. As such, investment decisions taken by stakeholders in public-transport agencies should consider the attributes of the trip, as well as the characteristics of the transportation system itself.


