Article

Fatigue Assessment of Carbon Fiber-Reinforced Polyurethane with Regard to Crack Initiation and Propagation

1
Chair of Materials Test Engineering (WPT), TU Dortmund University, Baroper Str. 303, 44227 Dortmund, Germany
2
Institute for Materials Technology and Plastics Processing (IWK), Eastern Switzerland University of Applied Sciences, Eichwiesstr. 18b, 8645 Rapperswil-Jona, Switzerland
*
Author to whom correspondence should be addressed.
Eng 2023, 4(2), 1009-1022; https://doi.org/10.3390/eng4020060
Submission received: 30 January 2023 / Revised: 21 February 2023 / Accepted: 22 March 2023 / Published: 24 March 2023
(This article belongs to the Section Materials Engineering)

Abstract

:
Due to their lightweight potential, the use of fiber-reinforced polymers is the current standard for many technical fields of application. Especially, the automotive and aerospace sectors are to be emphasized. This entails a sophisticated knowledge regarding the material properties, since the safety standards applied in these fields are of high importance. To ensure the safety of the components, a detailed mechanical material characterization is indispensable. The aim of this work was to investigate different influencing factors on the fatigue behavior of carbon fiber-reinforced polyurethane, which is to be certified for aviation applications. Tensile tests provided a basic understanding of the material properties, which appeared to be affected by the specimen width, varied from 3 to 25 mm, by up to 30%. Subsequently, the influence of the cutting direction was investigated in the course of the fatigue tests. Thus, the fatigue strength of longitudinally cut specimens was found to be higher than that of transversely cut specimens by 6%. By means of specific measurement technologies, the material responses were associated with crack initiation and propagation during the fatigue lifetime. The material properties, such as the thermoelastic effect, could be examined during the fatigue tests. Furthermore, turning points in the courses of the characteristic values of the material and correlations with local phenomena were identified.

1. Introduction

The usage of fiber-reinforced polymers (FRP) is widespread nowadays, due to their potential in lightweight constructions resulting from the very high specific strength they provide. They are mainly used in the automotive, aerospace and astronautics sectors, in which the previously mentioned characteristics are of high importance. FRPs are manufactured from two components, a polymer matrix material and fibers, which can be arranged in layers to create a laminate structure. Due to the specific alignments of the fibers, some FRPs can be considered quasi-isotropic, which leads to a differing mechanical behavior in comparison to, e.g., metals [1]. Therefore, and by means of the very high safety standards in the mentioned applications, it is inevitable to have an extensive understanding of the behavior of FRPs under mechanical loading.
This study deals with the fatigue behavior of a quasi-isotropic carbon fiber-reinforced polyurethane (CF-PU), which is manufactured by means of resin transfer molding (RTM). The testing strategy implemented computed thermography (CT), which was used for defect detection in order to characterize voids and cracks inside the specimens as well as their direction. Following non-destructive investigations, the influence of specimens’ dimensions and defects on the quasi-static strength was examined. The main focus iwas fatigue testing in the low-cycle fatigue (LCF) and high-cycle fatigue (HCF) regimes, due to the occurrence of failure significantly below the quasi-static determined strengths. Considering that the failure of FRPs depends on a combination of damage mechanisms occurring simultaneously or summing up, the advancing damage does not exclusively depend on the growth of a single crack, as it can be observed in other materials. There are mechanisms such as delamination, fiber failure and matrix failure appearing at the same time during the fatigue lifetime of FRPs [1,2,3,4]. In order to detect material responses, there are different strategies for monitoring a specimen’s condition during fatigue testing. Previous investigations have shown that testing methods such as digital image correlation (DIC) [5,6,7,8], resistance measurement [9], infrared thermography [6,10,11,12,13], high-frequency impulse measurement [14] provide good results regarding FRP testing. Regarding the fatigue testing of carbon fiber-reinforced polymers, the optimal parameters for a DIC analysis were already investigated [7]. Giorgi et al. showed that there is a direct correlation between damage during fatigue life and temperature variation [13].
A high-speed camera system with subsequent DIC was used to observe the deformation of the specimens. This method can be utilized to determine local areas with high strains which are often an indicator for crack initiation [9]. Furthermore, the recording of the strain on a specimen’s surface can be used to analyze hysteresis loops to showcase the advancing damage appearing in the specimen [10,15]. The testing setup is completed by a high-speed infrared thermography system (IR-system) for the determination of local hotspots as well as of global changed in a specimen’s temperature. There are previous investigations describing the thermoelastic effect in FRPs [16,17]. Previous results have shown that isotropic materials with a positive thermal expansion coefficient tend to cool down when elastic stresses occur. As a result, the courses of the measured temperature and other mentioned material properties run phase-shifted in the beginning of the fatigue tests [17]. After the stress leads to a plastic material deformation, a dissipation of energy begins, and the material heating increases. With further number of cycles, the heating prevails, and the temperature recorded by means of the IR system begins to run in sync with the stress and strain properties [18].
The combination of the mentioned testing strategy with the presented innovative measurement technologies allowed the correlation of stress, strain, temperature and crack characteristics on a global and local scale, which led to a substantial progress in knowledge about the present material. With regard to previous investigations, this work enables the possibility to simultaneously detect strain, temperature and cracks on a highly local state geometry- and timewise. This will allow a substantial progress in test methods and measurement techniques, since this approach can be utilized for further material groups.

2. Materials and Methods

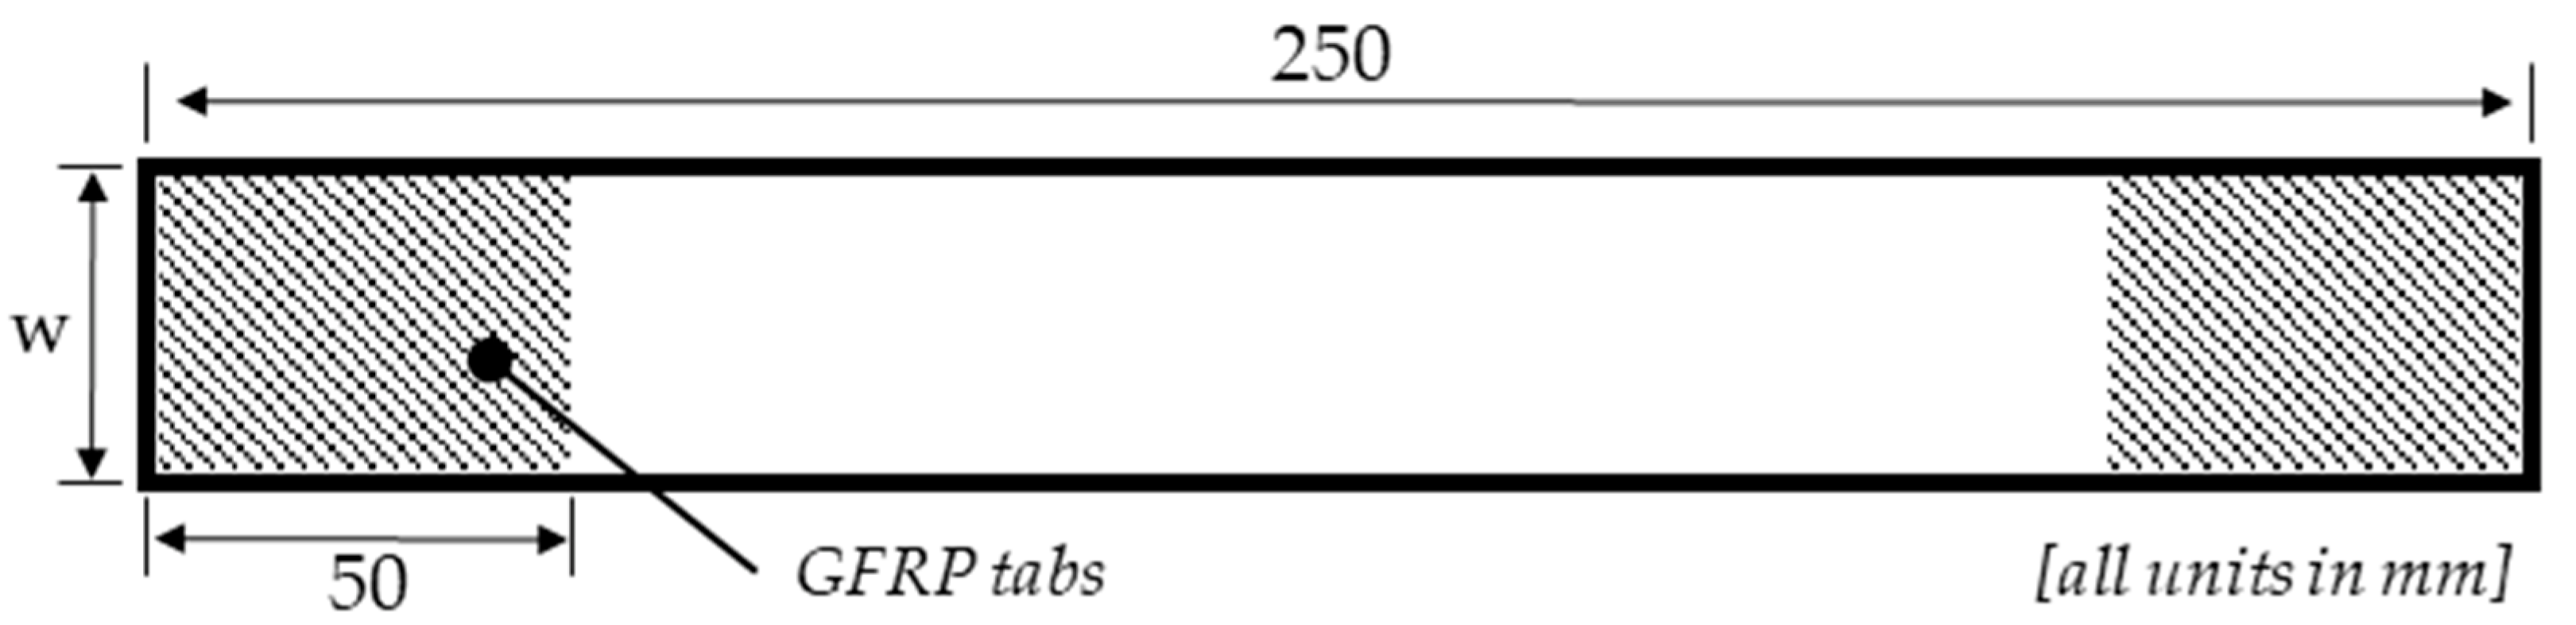
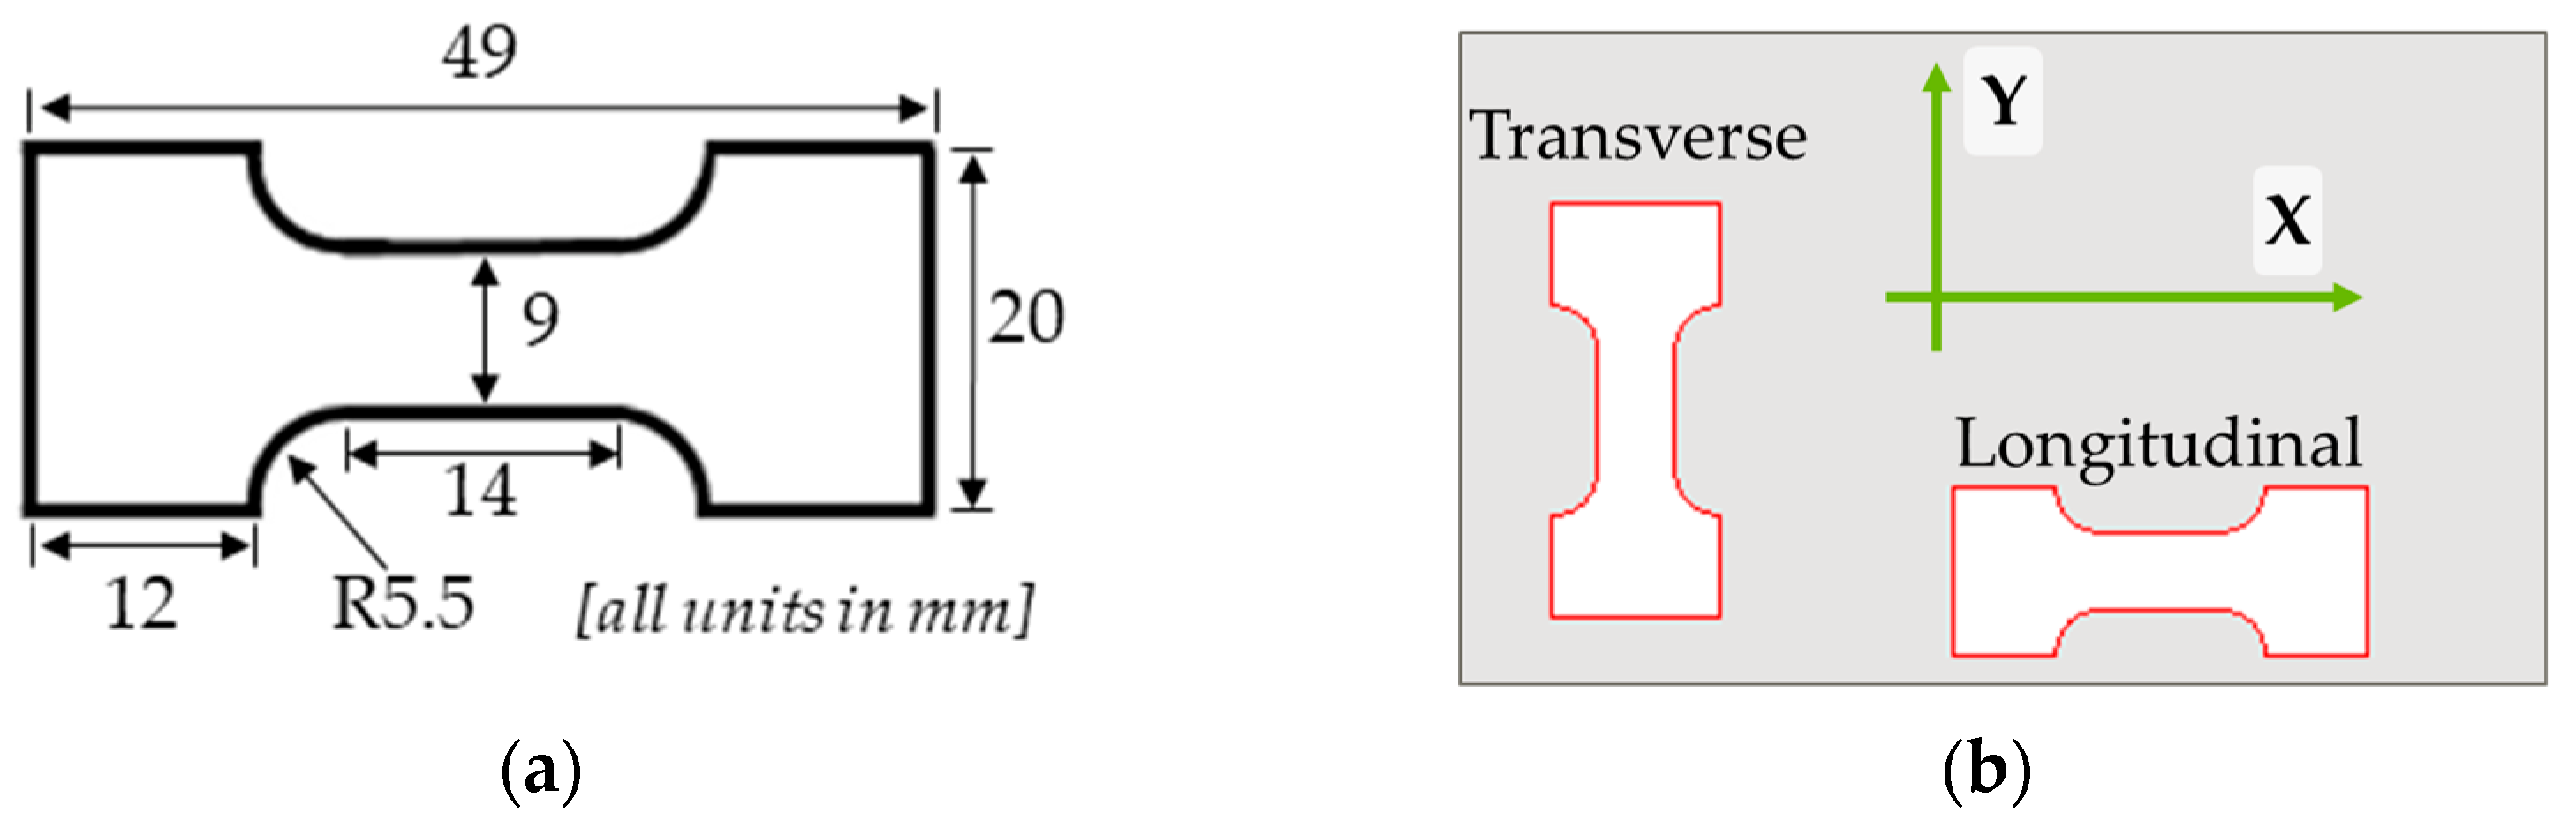
2.1. Material and Specimen Manufacturing

A quasi-isotropic CF-PU was used for all investigations shown in this work. This type of laminate has a symmetrical structure of 16 layers with the setup [+45/−45, 0/90, +45/−45, 0/90] s, which results in a laminate thickness of 3.9 mm. The carbon fabric is a HexForce HS06K with weave style 5H SATIN and a basis weight of 375 g/m2. The matrix material was made of polyol (puropreg 185/8 L) and isocyanate (puronate 900) by Rühl Puromer GmbH (Friedrichsdorf, Germany) and was chosen because of the low reactivity of this combination during processing.
The resin transfer molding (RTM) process was conducted at the Institute for Materials Technology and Plastics Processing (Eastern Switzerland University of Applied Sciences). The carbon fabric was cut to size using a cutting table. The geometry could directly be transferred from a CAD system to the cutting table via the data format DXF. The cut-outs were then manufactured to a preform. Since the fabrics were provided with a binder, preforming was performed using a thermoforming process. In order to activate the binder, the layer structure must be tempered beforehand at 110 °C for 1 h. The finished preforms with the dimensions of 310 mm × 219.3 mm × 4 mm were then placed in the RTM mold, which was heated to 85 °C. After closing the mold, the premixed PU (Isotherm PSM90) was injected out of plane. The mixing ratio between polyol and isocyanate was 100/120 g. During the injection, the mass flow was set to 6.97 g/s, which caused a pressure increase between 3 and 5 bar close to the sprue. The vent was combined with a resin trap, which was operated with a vacuum of −0.7 bar gauge pressure. For an optimal result, a post-pressure time of 4 s was used. During the post-pressure period, significantly higher pressures up to 40 bar could be achieved. After 650 s, the finished plate was demolded. The previously described parameters were proven to be effective for processing polyurethane [19]. The resulting average fiber volume content was determined to be 52.1%. All specimens were manufactured by waterjet cutting from the previously mentioned plates (310 mm × 219.3 mm) with a tolerance of ±0.05 mm and a roughness Rz = 15 μm in order to avoid the influence of heat development during material processing.

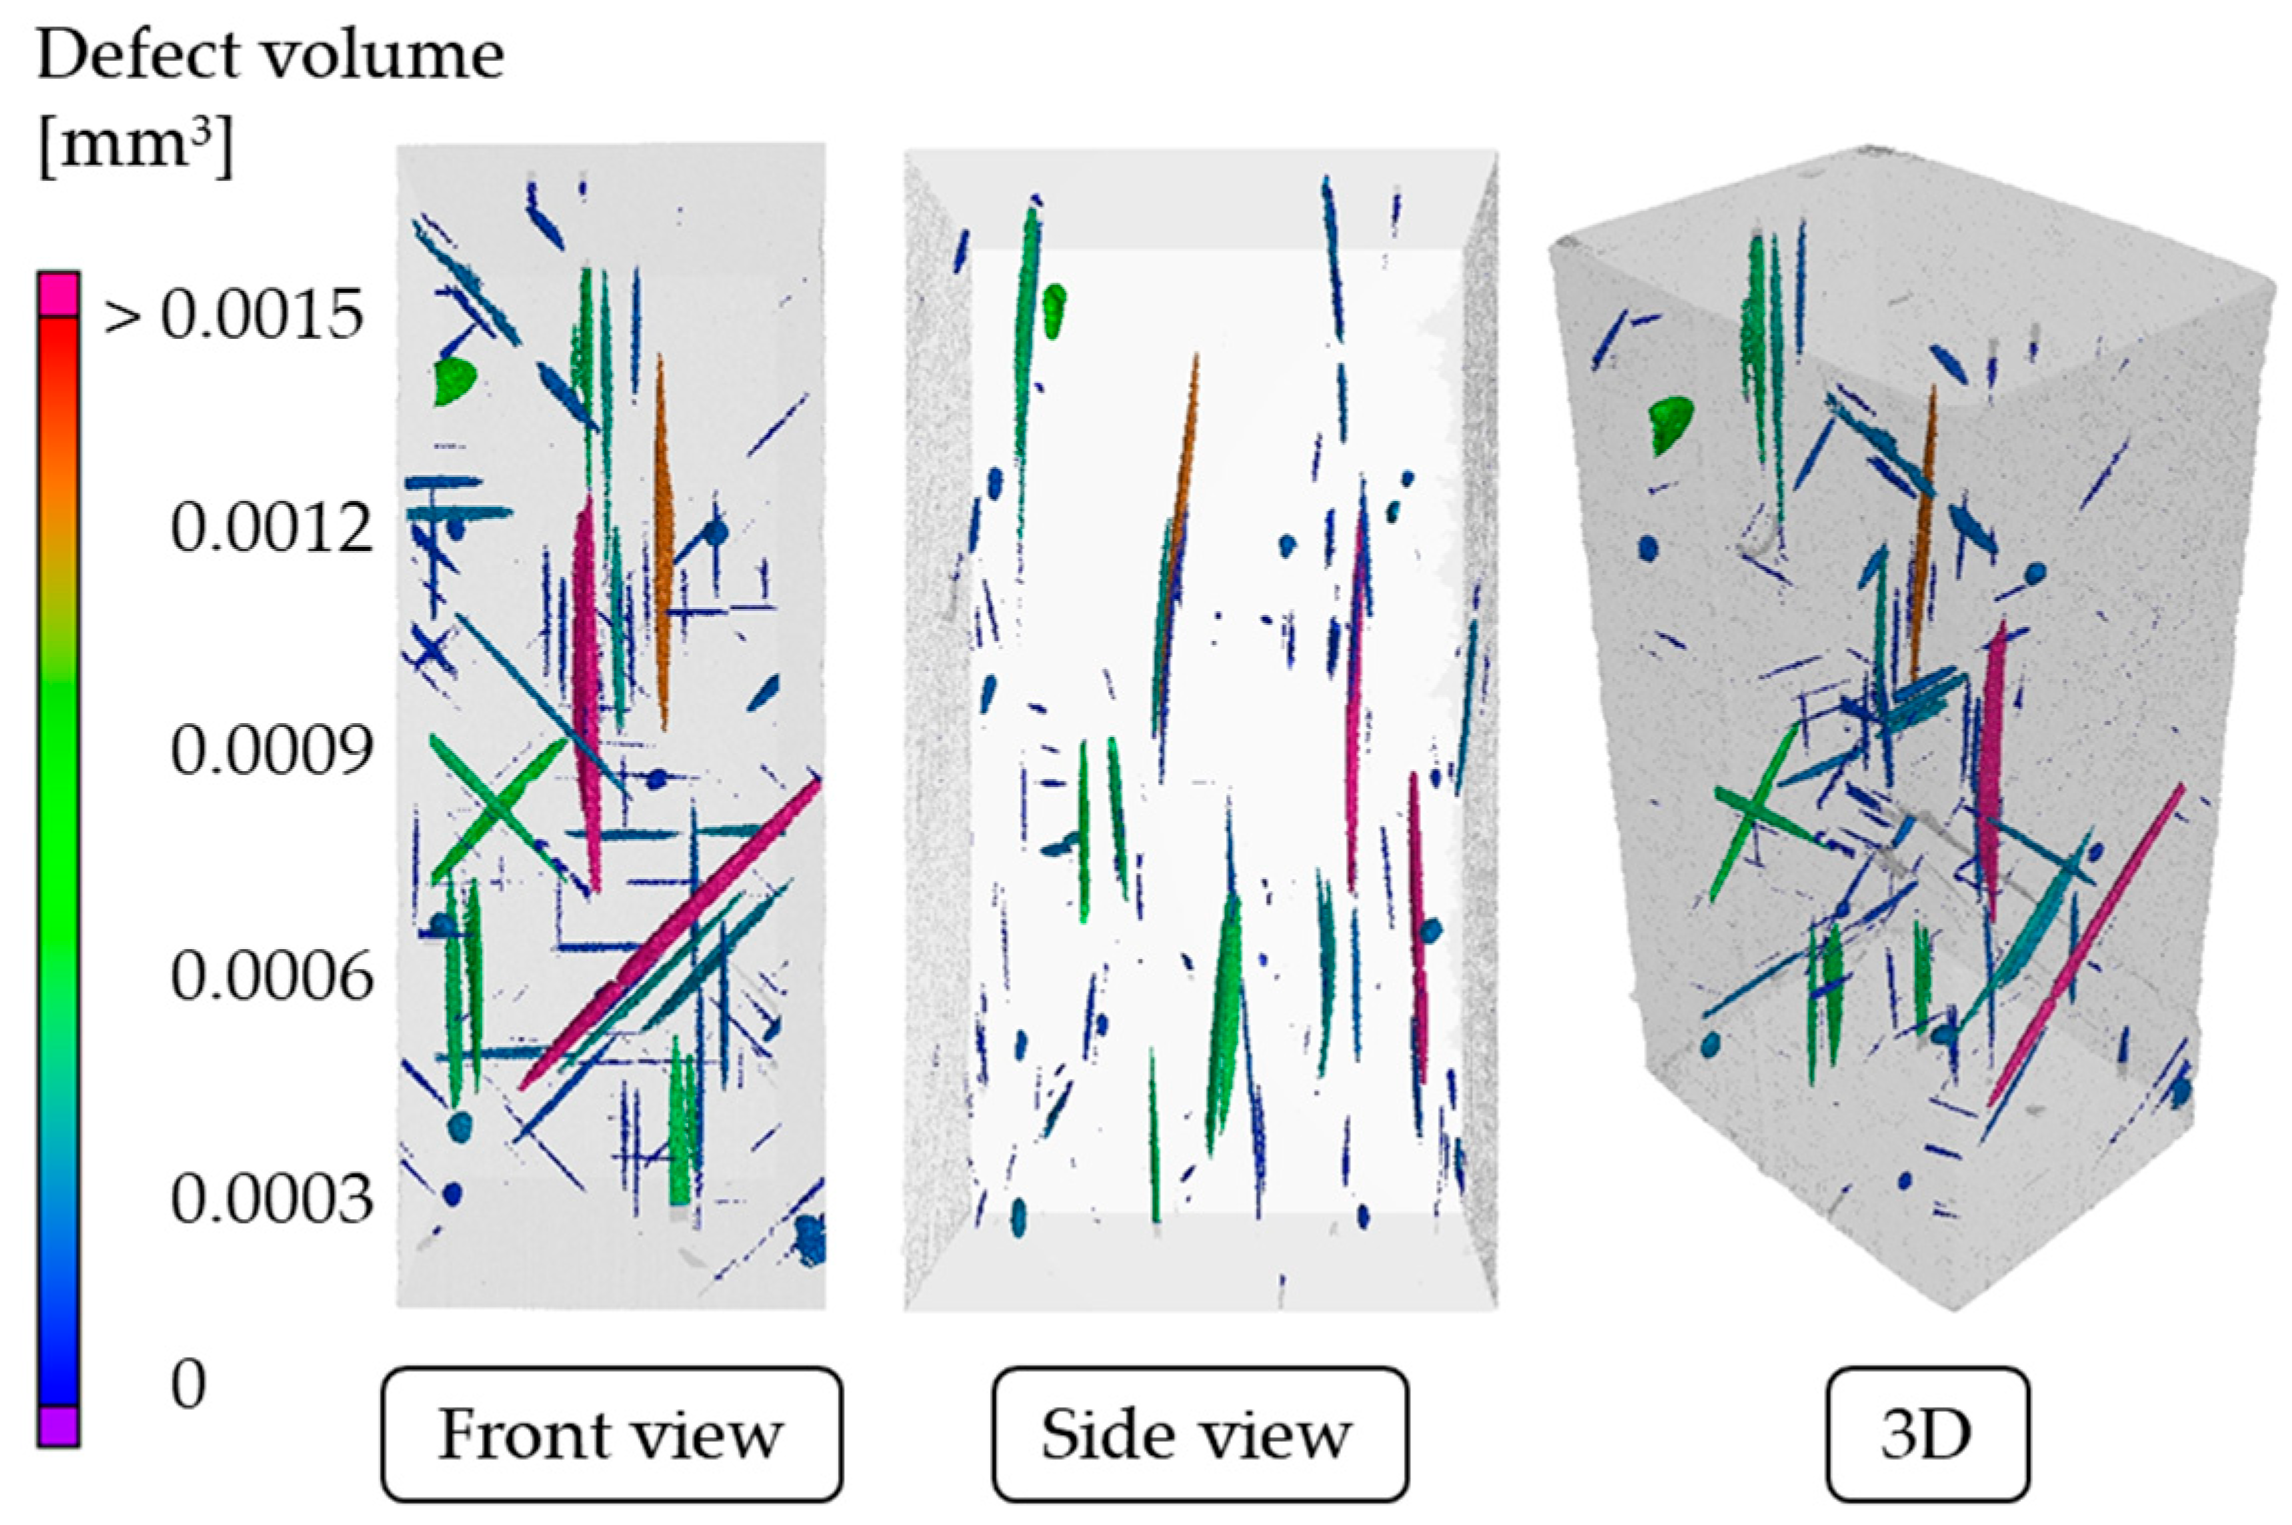
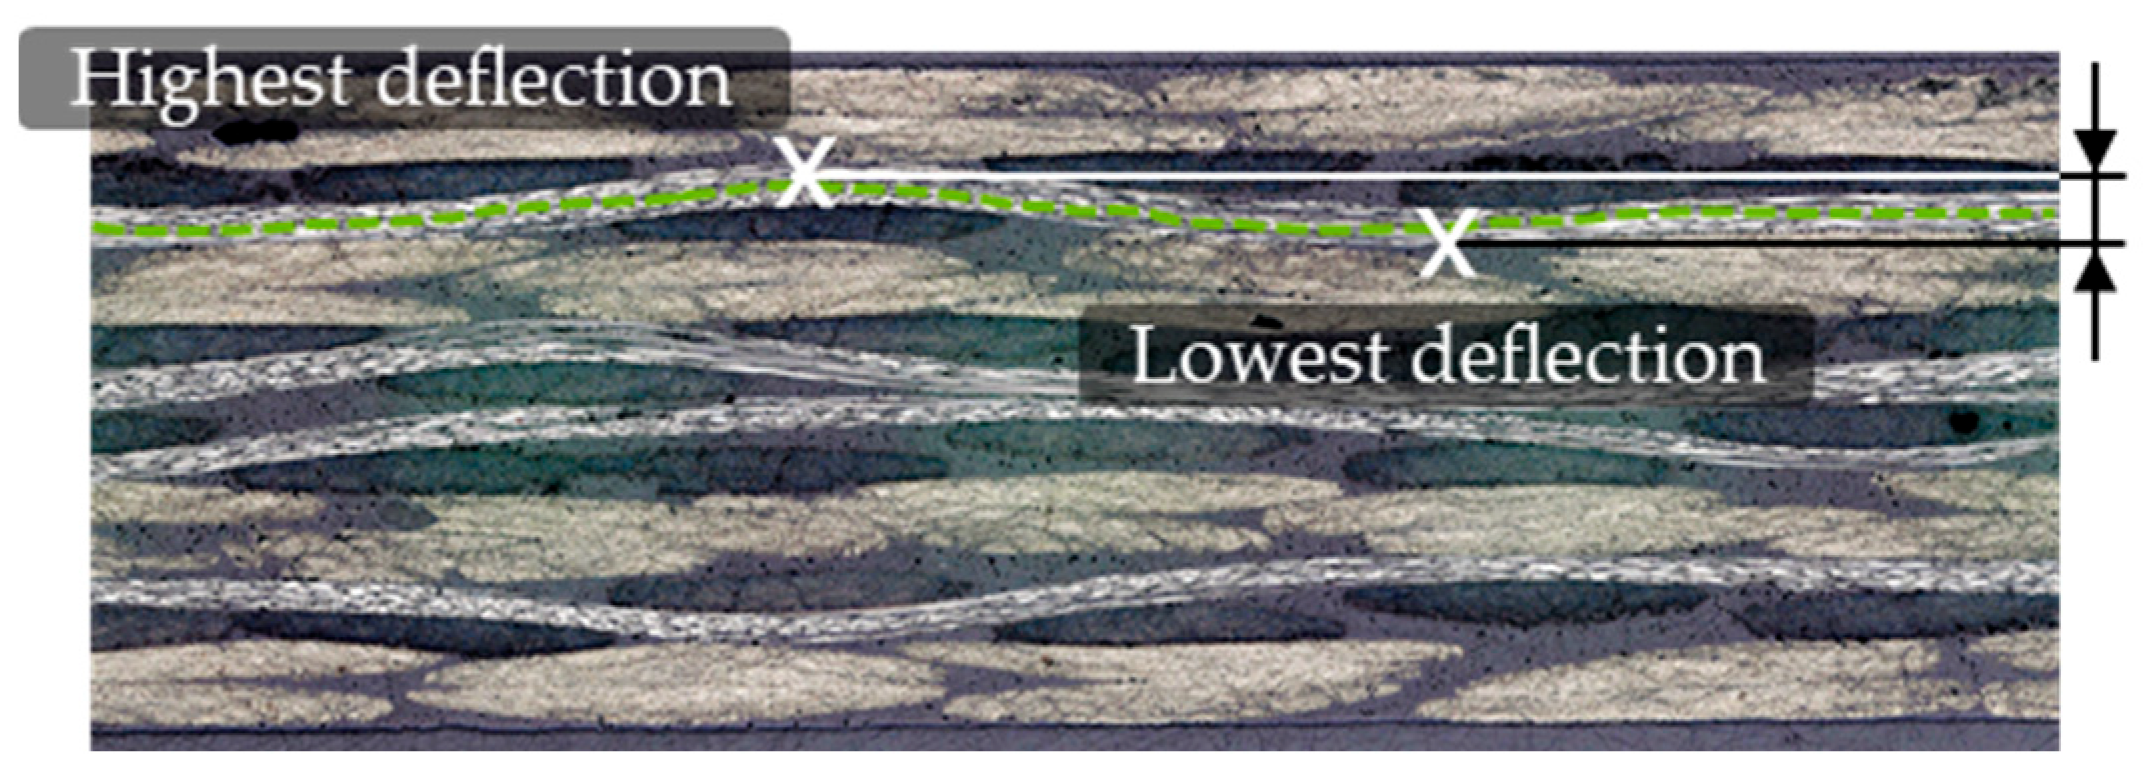
2.2. μCT Investigations on Void Volume Content and Fiber Undulation

Previous investigations have shown that there is a dependency of a material properties on laminate fabrication orientation, which leads to a dependency on specimen orientation [20,21,22]. Additionally, Spencer et al. showed a dependency of the strain in the longitudinal and transverse directions by means of DIC measurements [22]. In order to assess whether there was a preferred direction of specimen cutting, although the layer setup was meant to be quasi-isotropic, μCT investigations on void volume with regard to the orientation as well as to fiber undulations for both plane directions (transverse and longitudinal) of the fabricated laminate were carried out. The CT scans were performed with a Nikon XT-H 160 system (Nikon Metrology, Tokyo, Japan), with a beam energy of 80 kV, a beam current of 128 μA and an exposure time of 500 ms, which led to a voxel size of 10 μm. Volume reconstruction and defect detection of the scans were conducted with the software VGStudio Max 2.2 (Volume Graphics GmbH, Heidelberg, Germany).
Figure 1 presents a 3D CT volume with highlighted defect detection, in which defects are sorted by their volume in mm3. There is no predominant distribution apparent. However, it can be said that the defects are oriented in the 0°, 45° and 90° directions. In further investigations, solely the defects in the 0° and 90° directions were considered, since defects oriented in the 45° direction should have the same influence on both longitudinally and transversely oriented specimens.
Further information gathered from the CT investigations regarded the undulations resulting from the weaving type of the layers and the occurring misorientations, which were due to the manufacturing process. As shown in Figure 2, it was possible to differentiate between matrix and fiber material. On the basis of the distance between the highest and the lowest point of a single fiber, the undulations were measured.

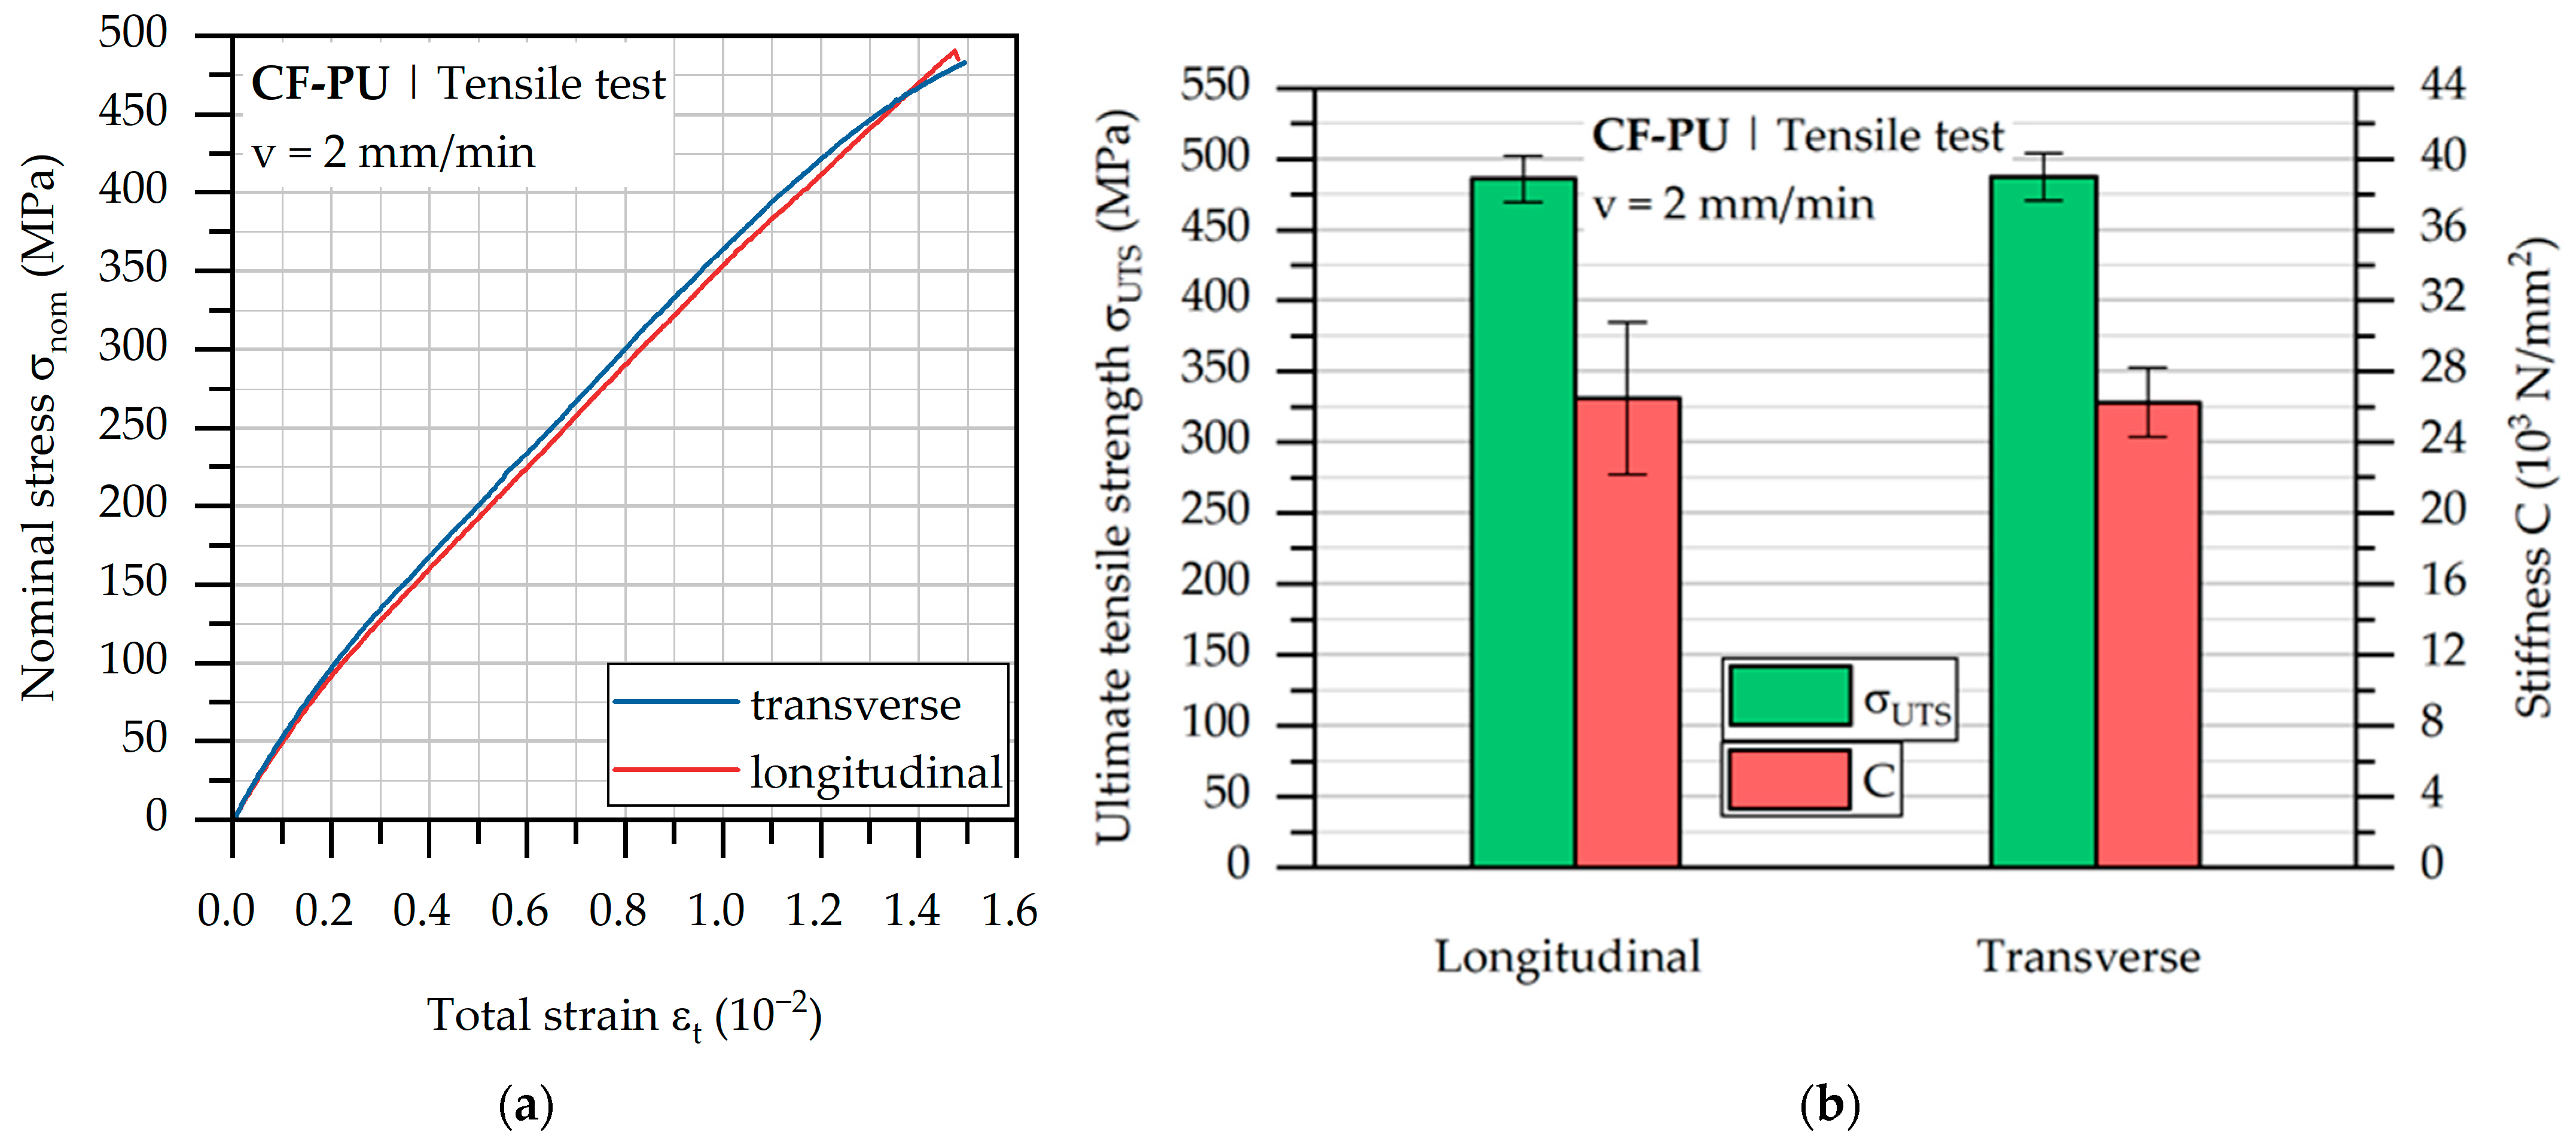
2.3. Tensile Testing

At first, quasi-static tensile tests were carried out to determine the influence of the specimen geometry on the mechanical properties. The tensile tests were performed on a servo-hydraulic testing system Shimadzu EHF-UV100 (Shimadzu, Kyoto, Japan), with nominal load of ±100 kN and nominal stroke of ±50 mm in laboratory conditions (23 °C and 50% rH). The testing speed was set to 2 mm/min [23]. The specimen geometry with bonded tabs made from a glass fiber-reinforced polymer (GFRP), based on DIN EN ISO 527 [23], is shown in Figure 3. The strain measurement was achieved by a single camera setup and a subsequent DIC analysis. In doing so, the specimens were applied a stochastic pattern with a black primer and white dotting. The investigation of the influence of a specimen width is mandatory, since an adapted specimen geometry has to be used for fatigue testing in order to match the circumstances of the testing machine and additional measurement techniques. The varied parameter was the width w of the specimen, which tends to have a great influence on the mechanical performance [24].

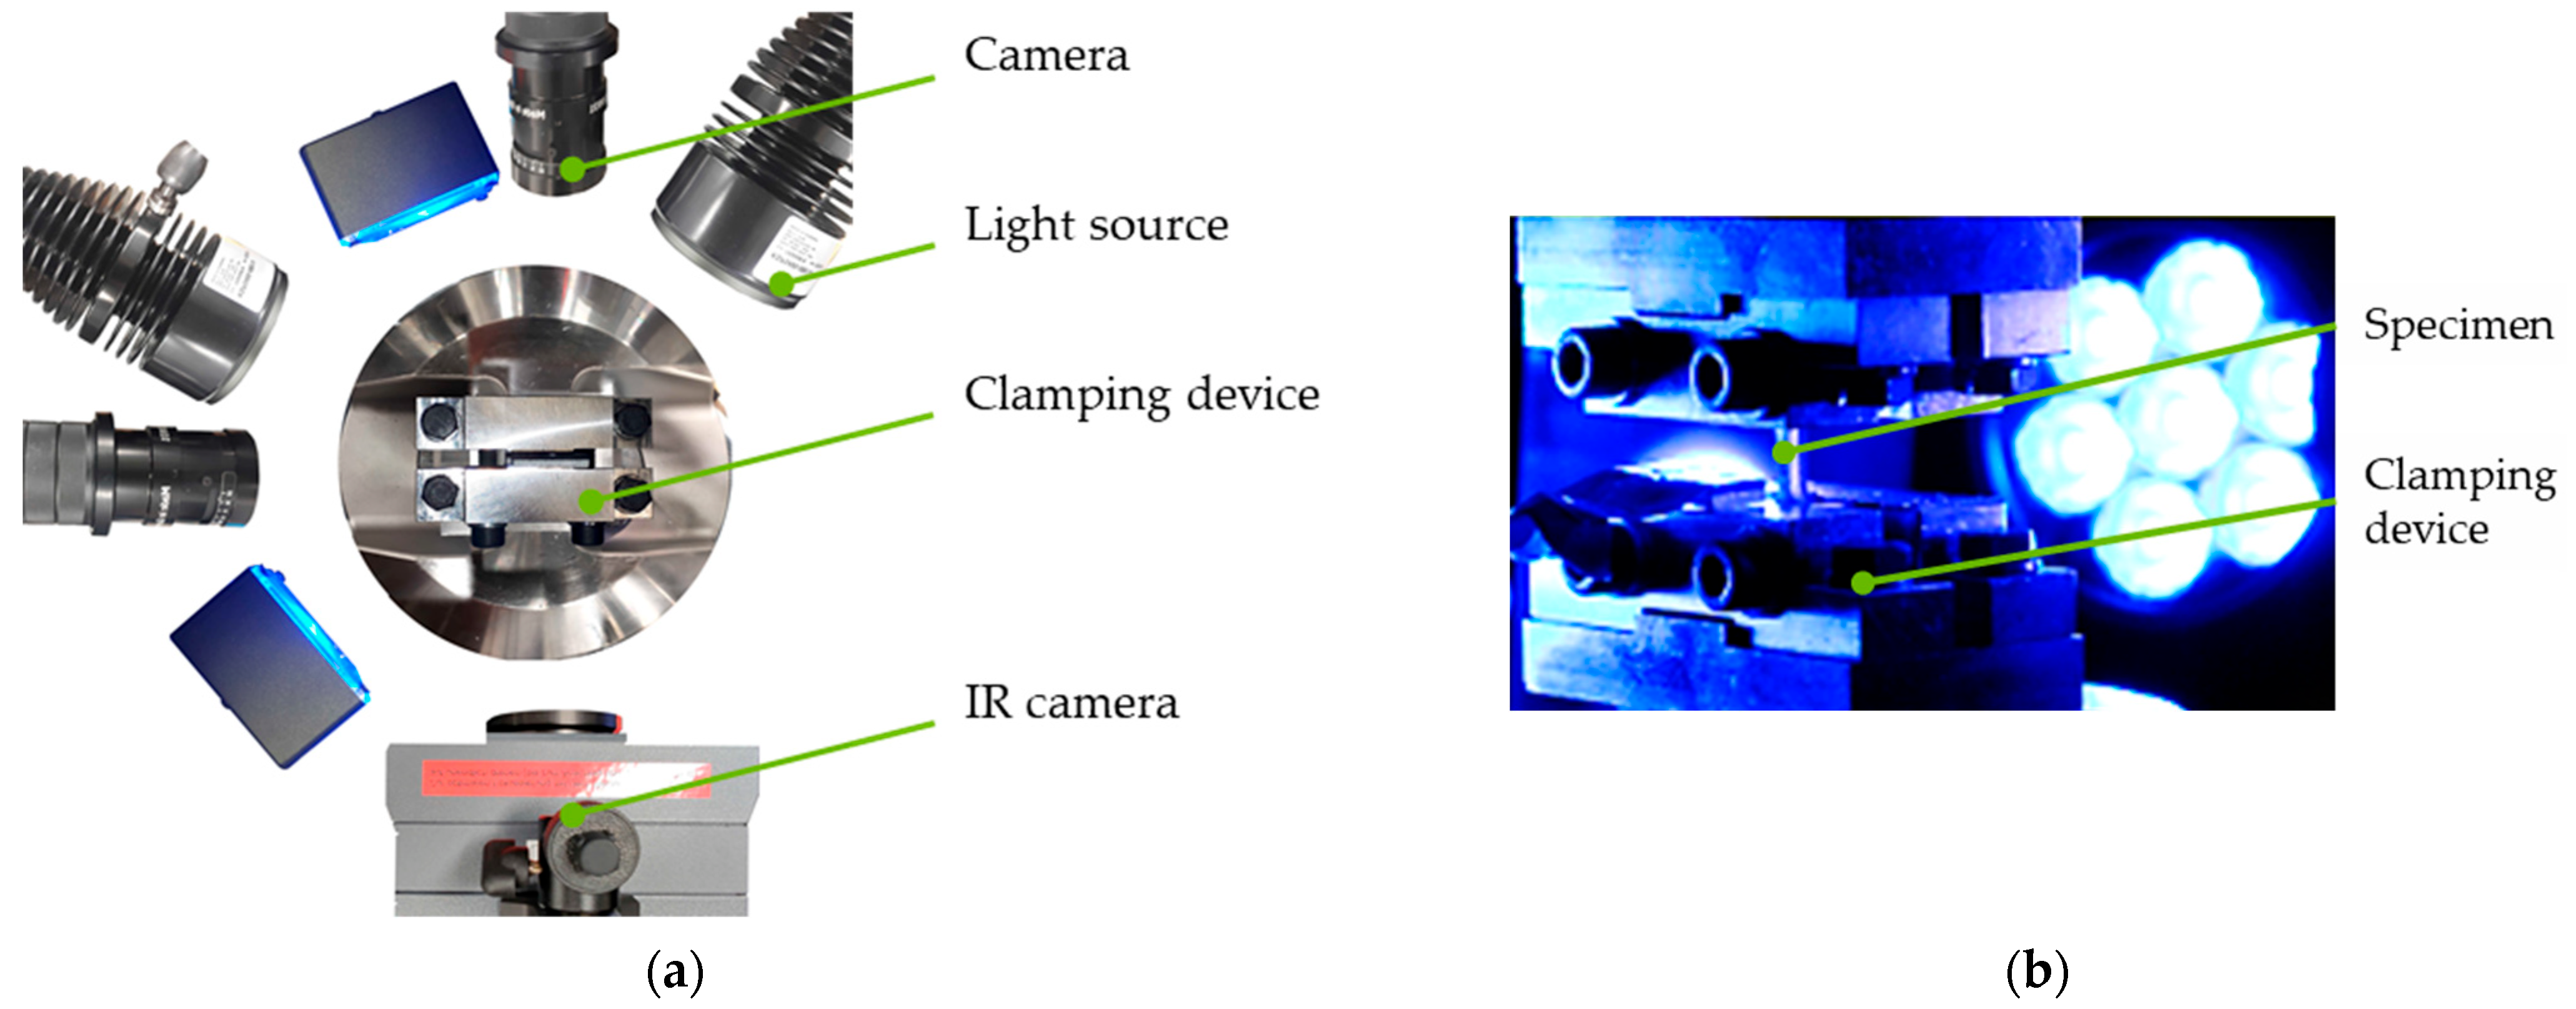
2.4. Fatigue Testing

The fatigue tests were performed on a servo-hydraulic testing machine MTS 858 Mini Bionix II system (MTS, Minneapolis, MN, USA), with a nominal load of ±25 kN. The testing system had a nominal stroke of ±50 mm and was used for constant-amplitude tests (CAT) with differing maximum stress levels reaching σmax = 325 to 425 MPa in steps of 25 MPa, a stress ratio R = 0.1 and a test frequency f = 10 Hz. The test parameters were chosen according to ISO 13003 in order to ensure a maximum rise in the specimen temperature of 10 K [25].
The tapered specimen geometry for the fatigue tests is shown in Figure 4. The small geometry enabled a high local resolution for the DIC and thermography measurements, since a small field of view was required. This underlines the importance of investigating the influence of the geometry and decreasing widths. Additionally, the specimens were cut in two directions (Figure 4).
The setup for the fatigue tests is presented in Figure 5, which shows the plan view with a specimen fixed in the clamping device. By using two high-speed cameras recording the side and front of the specimen, a subsequent DIC analysis of the deformation of the specimen was performed. The IR system was used for the determination of temperature hot spots and the assessment of the global change in temperature on the specimen surface.
The triggering and synchronization of the setup was divided in the individual components, the testing machine (master), the DIC system (slave 1) and the IR-system (slave 2). The communication was conducted via 5 V TTL signals, which provided the applied force of the testing machine to the DIC system in the first stage. The DIC system then decided autonomously when to capture pictures. The IR-system again worked as a slave to the DIC system, capturing information simultaneously to the DIC system.
Each measurement consisted of six peak values, recorded at the highest and lowest force, resulting in three complete hysteresis loops, which were sampled with a frequency of 115 Hz, which led to a 12-point loop. The position of each measurement is listed in Table 1.

3. Results

3.1. Investigations of Multiple Influences on the Tensile Test Properties

At first, quasi-static tensile tests on standardized specimens were carried out to determine the influence of the specimen geometry on the ultimate tensile strength (σUTS) of the CF-PU. The geometry was varied with regard to the width of the specimens, from 3 to 9 mm. Additionally, the influence of tempering (5 h and 45 min at 120 °C) was investigated with a single test series and the standardized geometry.
Figure 6 shows the results of the mentioned tensile tests. It is obvious that the geometry had a significant influence on the strength of the CF-PU. With an average σUTS of 530 MPa, the standardized specimens had the highest strength. The influence of the varying width was estimated to be near 475 MPa. Solely the specimens with a width of 3 mm showed a major decrease in strength, with σUTS of 410 MPa. Moreover, the standard deviation of the 3 mm specimen was significantly higher than that of the rest of the specimens. A possible cause for the described behavior is the number of guaranteed continuous fibers, which were not cut, especially in the loading direction, since the fiber bundles within this CF-PU had an average diameter of 2 mm.
The temperature treatment of the CF-PU did not have a positive influence on the material properties. With σUTS of 480 MPa, the strength could not be increased but decreased in comparison with that of the material state without heat treatment. As a result of the tensile tests, the specimens for the following fatigue tests were not tempered.
Furthermore, it was analyzed if there was an influence of the cutting direction of the specimen on the tensile properties. As shown earlier in Figure 4, the specimens were cut in the longitudinal and transverse directions. When considering the results (Figure 7), it is obvious that the cutting direction did not have an influence on the tensile properties of the material, either on the ultimate tensile strength or on the stiffness.

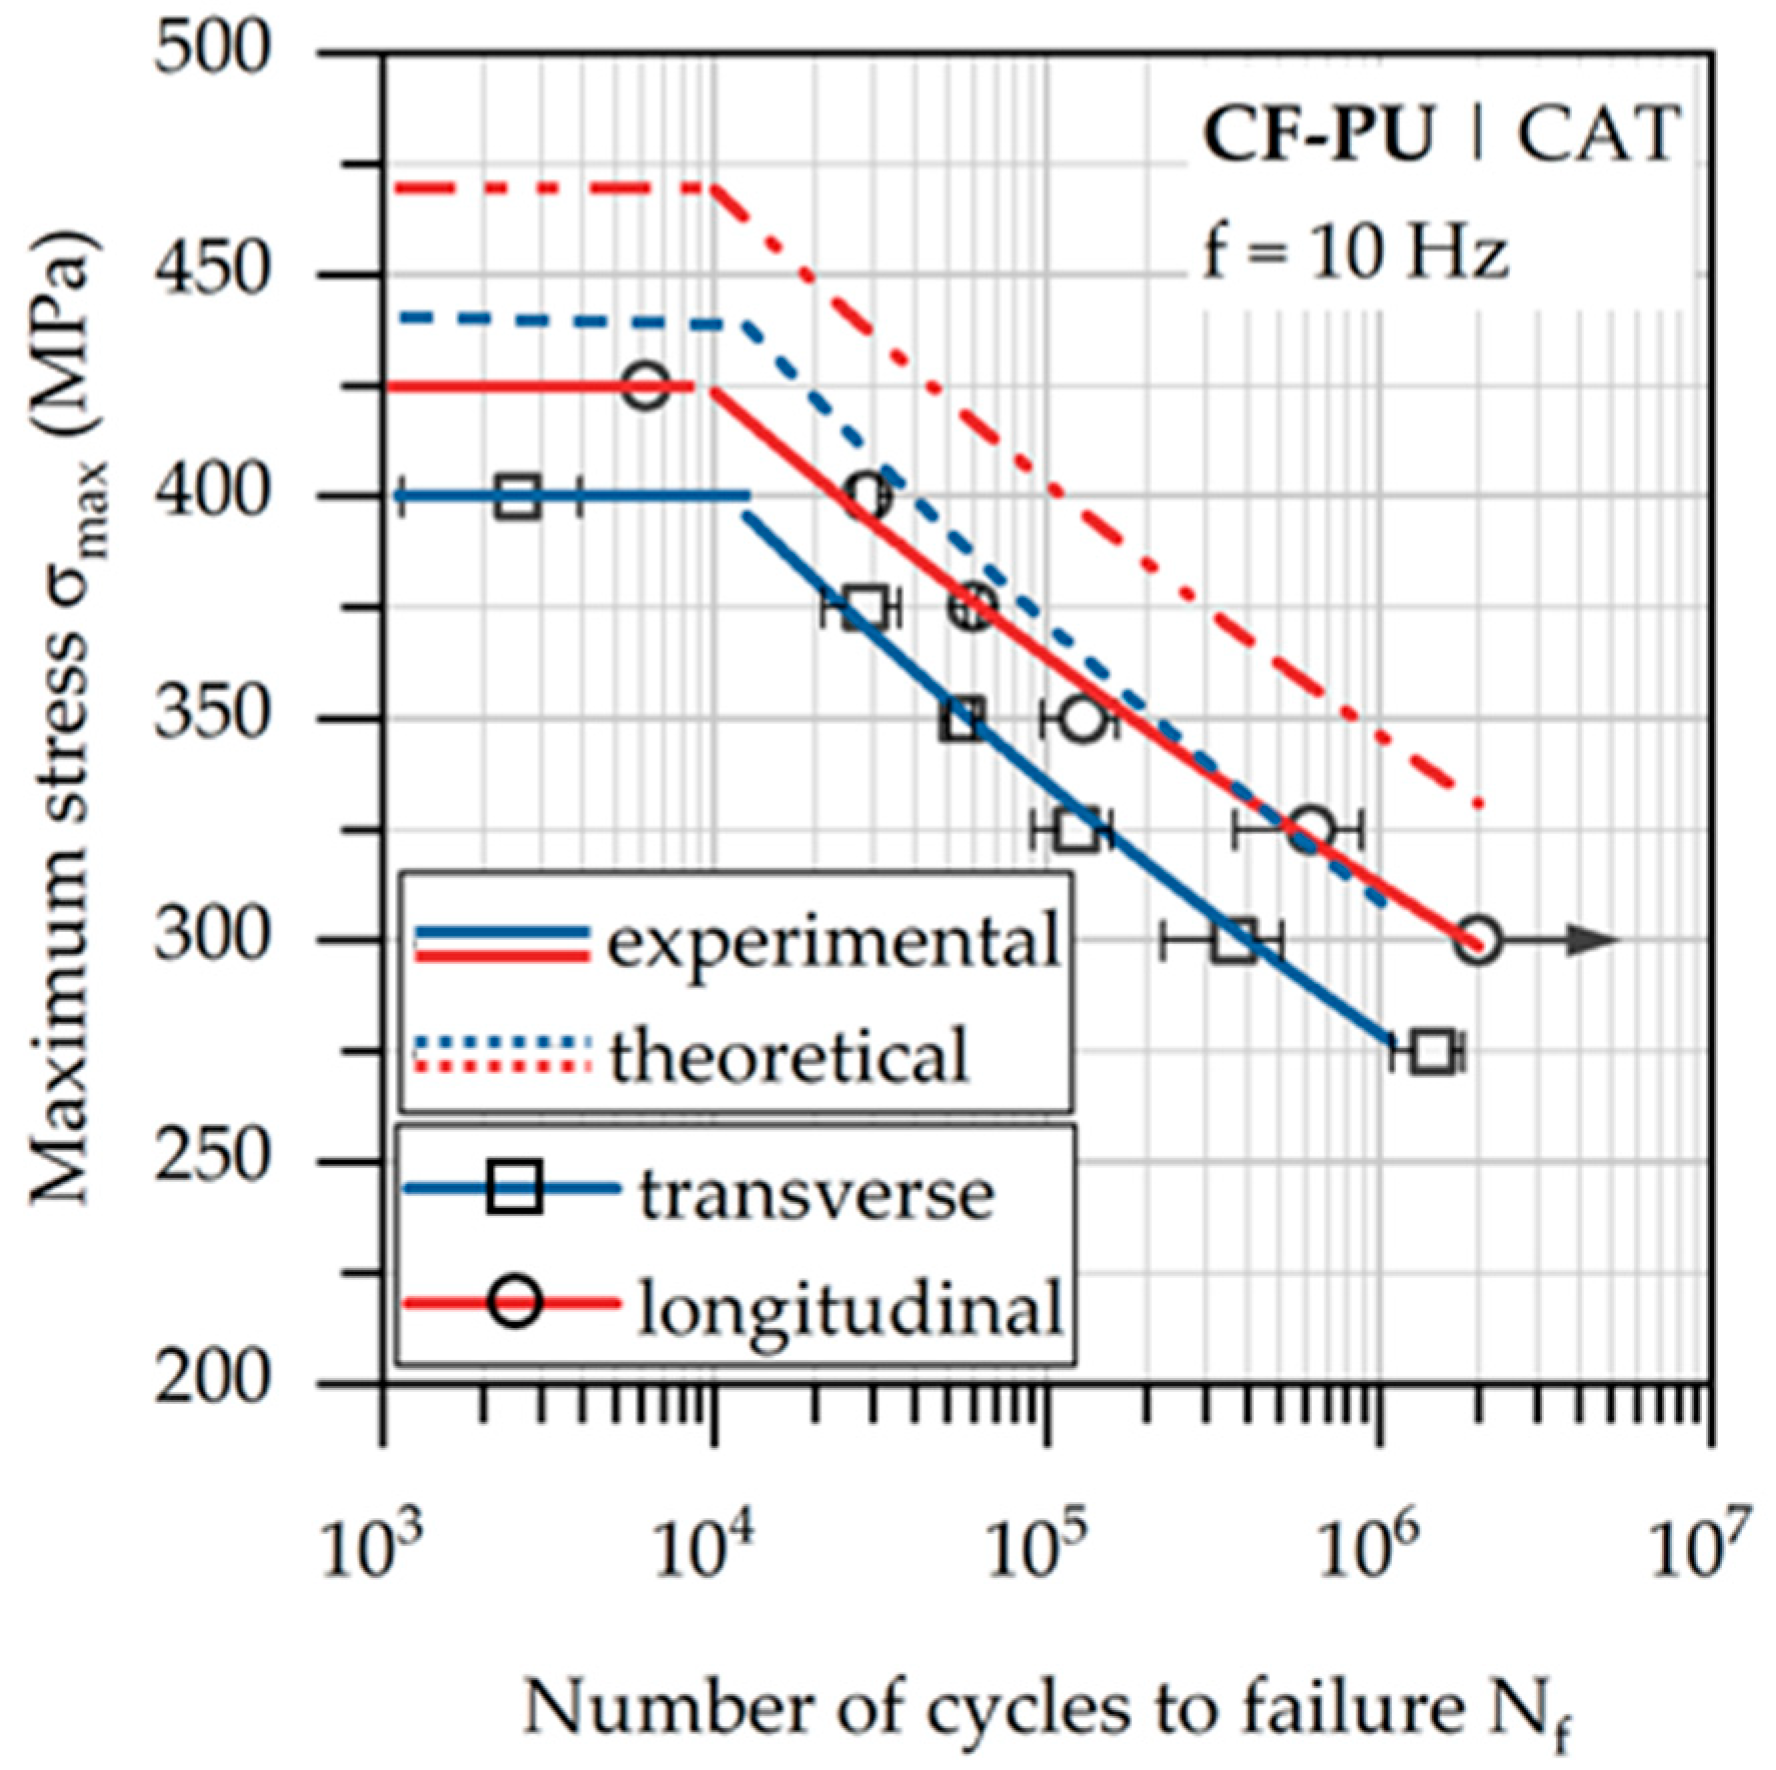
3.2. Fatigue Testing of Longitudinal and Transverse Cut Specimens

Even though the results did not show a difference in tensile properties, the fatigue behavior of the material was also investigated for the two cutting directions, since it is proven for a long time, that fatigue properties are affected in a different way by different parameters than tensile properties. Figure 8 gives the Woehler curves for the two cutting directions as well as the theoretically determined curves (dashed lines), which were corrected considering the higher strength of the standardized specimens in tensile testing.
It can be seen that the Woehler curves for both the longitudinal and the transverse direction show a plateau in the lower LCF regime, whereas the maximum bearable load decreased with a number of cycles of about 10,000. In addition, the curve for the transverse direction was about 6% lower than that for the longitudinal direction, meaning that there was indeed a dependency on the cutting orientation. The theoretical Woehler curves showed that the material was probably capable of a better fatigue performance with respect of the results of the fatigue testi It has to be mentioned that the theoretical Woehler curves were solely based on the experimental results from quasi-static tensile testing, thus not necessarily representing the real material behavior. However, previous investigations showed that there is a specimen width dependency for fatigue testing as well [24].
With regard to Figure 8, Table 2 reports the standard deviations and slopes of the Woehler curves from approx. 10,000 cycles. This was done since the curves present the mean values of the number of cycles leading to failure.

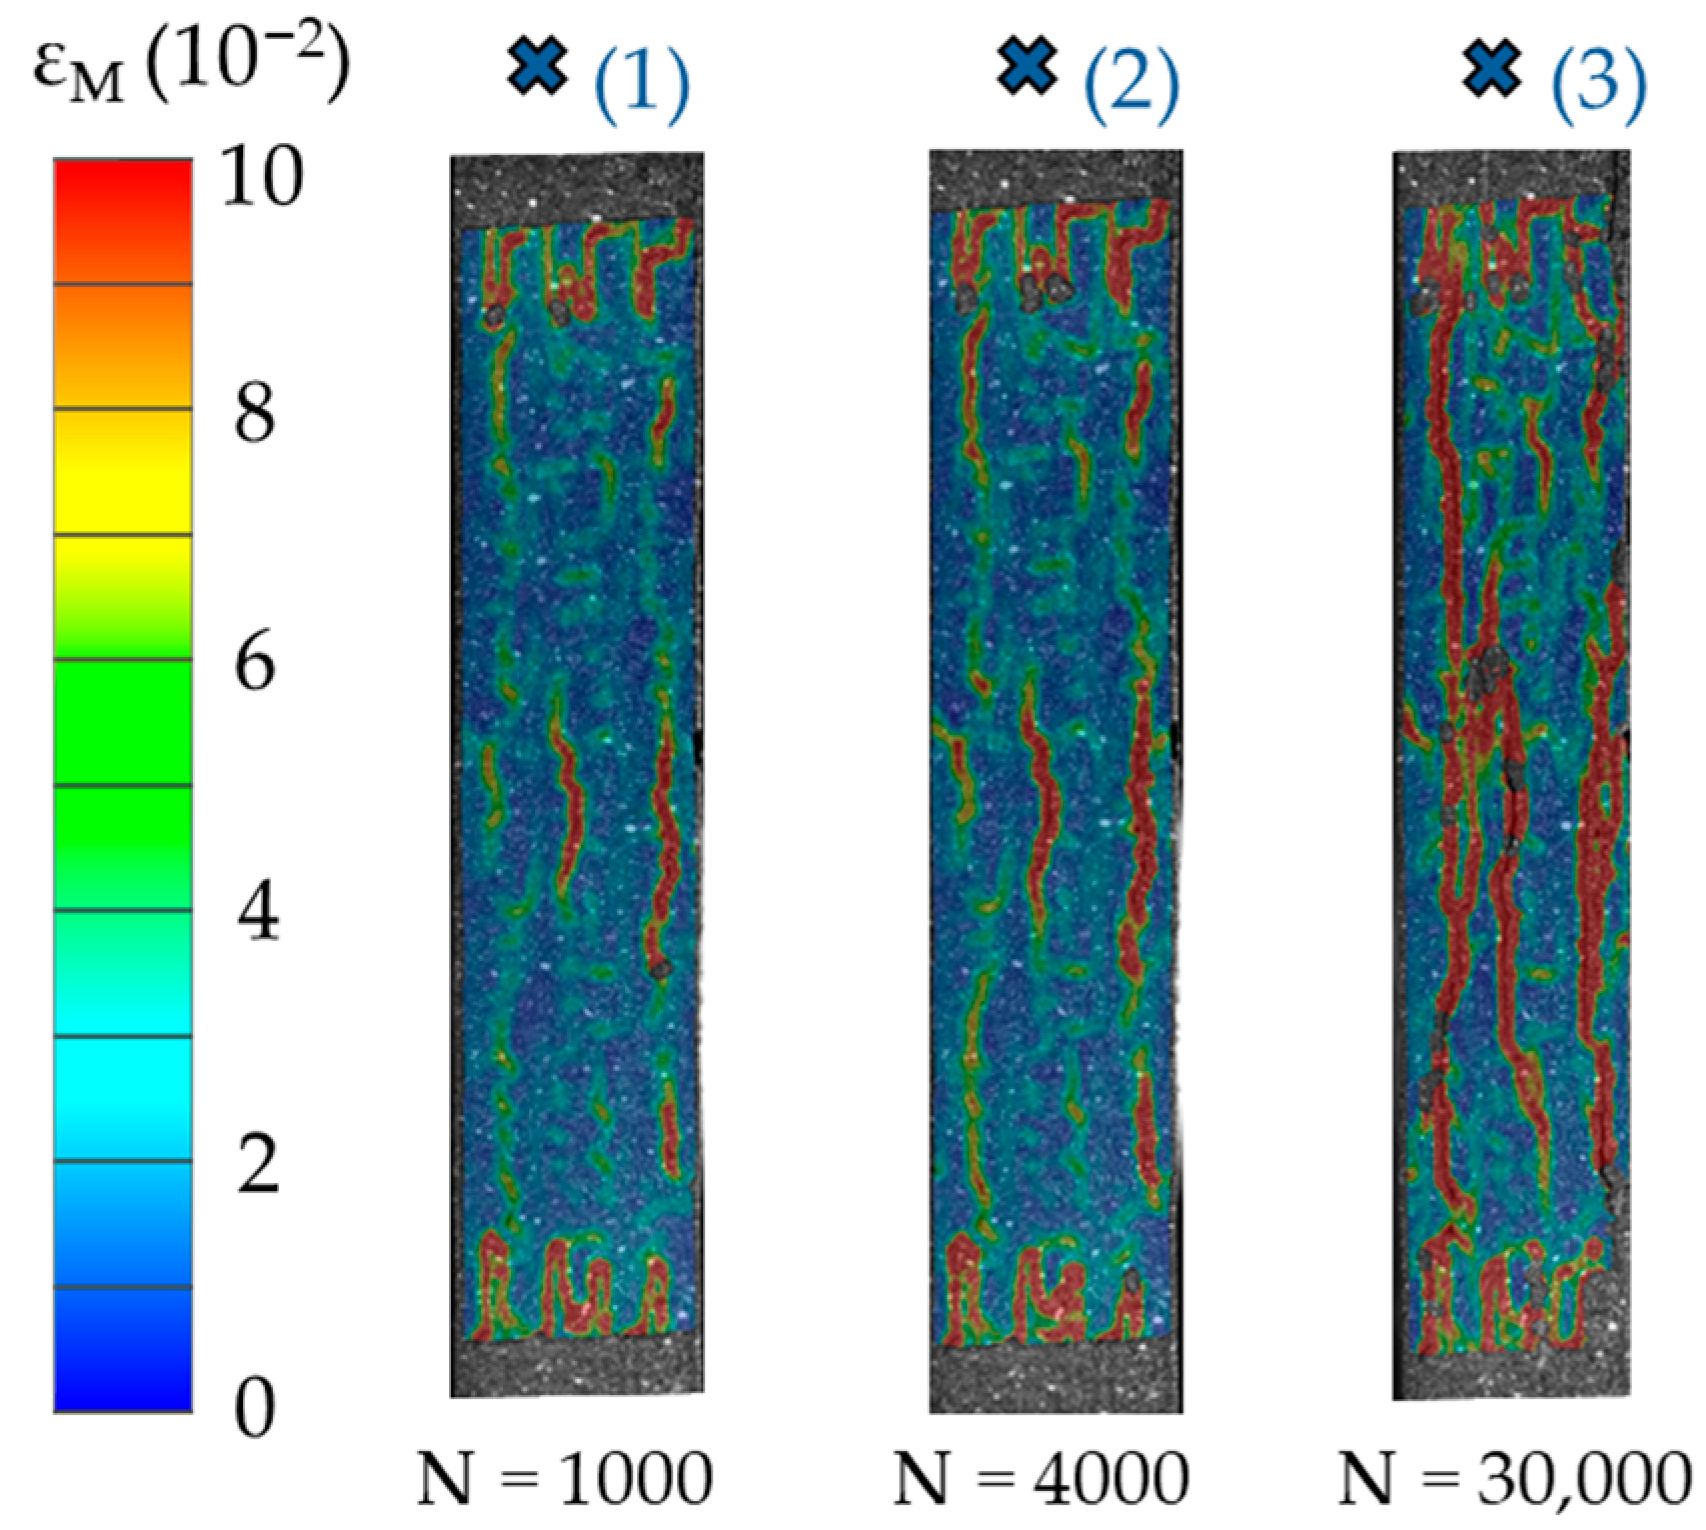
3.3. Microstructural Investigations on Longitudinally and Transversely Cut Specimens

As it became evident that the cutting orientation affected the fatigue properties of the material, it was necessary to perform further investigations. In order to find sufficient evidence for this behavior, microstructural investigations via µCT were carried out, since it is to be assumed that defects as well as fiber undulations affect the fatigue properties [26,27]. In Table 3, the defect volume in seven specimens is shown.
The results shown in Table 3 strengthen the assumption that defects in the x-direction (see Figure 4) could affect the fatigue lifetime of the specimens in the transverse direction in a more significant way. The approx. 10% higher volume content of longitudinal defects could represent a potential reason for the worse fatigue behavior observed. Considering that the defects in the x-direction had a greater influence on the material properties in transverse specimens, since they tended to open up, the quantitative description of defects seemed to be expedient. Nevertheless, many studies have dealt with fiber undulations [26,27,28] and showed their considerable influence on materials properties, especially, on the stiffness of CF-PU specimens [26,27].
As shown in Figure 2, the undulations could be determined with the help of the conducted CT scans. The evaluation was carried out based on the maximum and minimum deflection of fibers in the longitudinal and transverse directions. The results for the size of the undulations are shown in Table 4.
Regarding the presented results, it can be stated that there was a larger undulation size in the transverse direction in all seven specimens. This led to the same assumption that was already made regarding the effect of the defect direction, suggesting a reduced fatigue lifetime in the transverse direction. However, based on the current status of the investigations, it cannot be stated how big the influence of the defects versus that of the undulation size is regarding the fatigue properties.

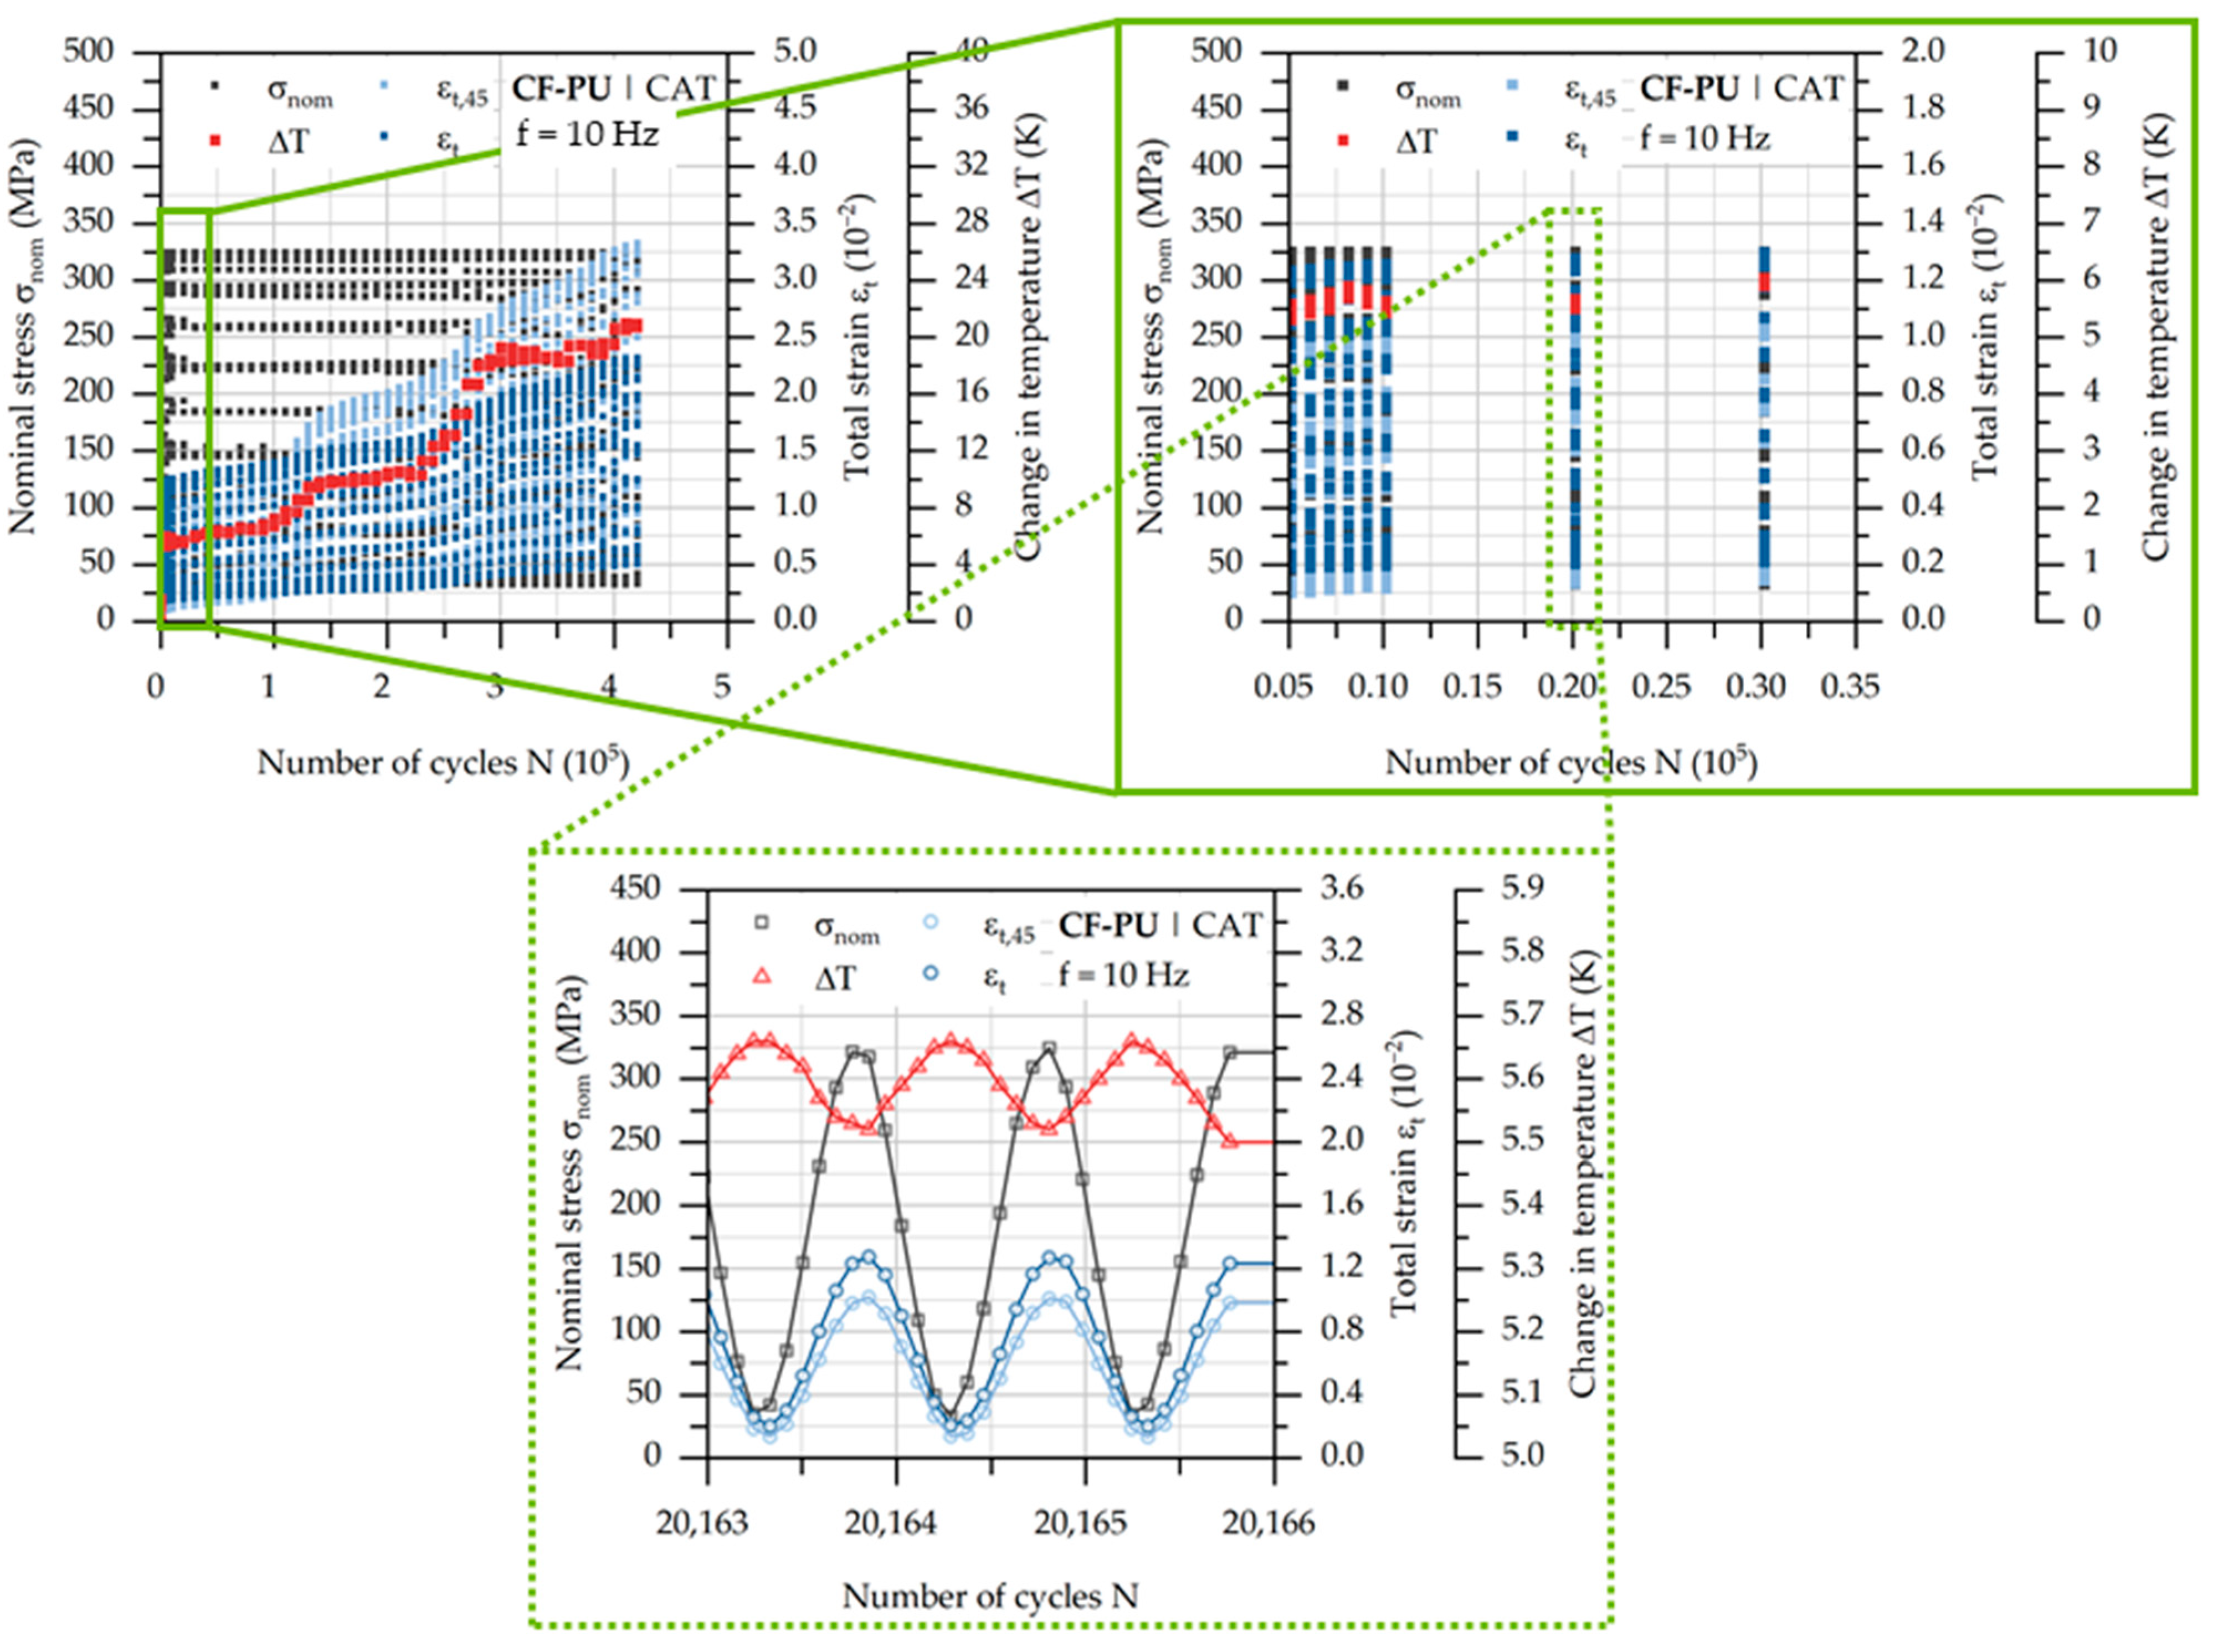
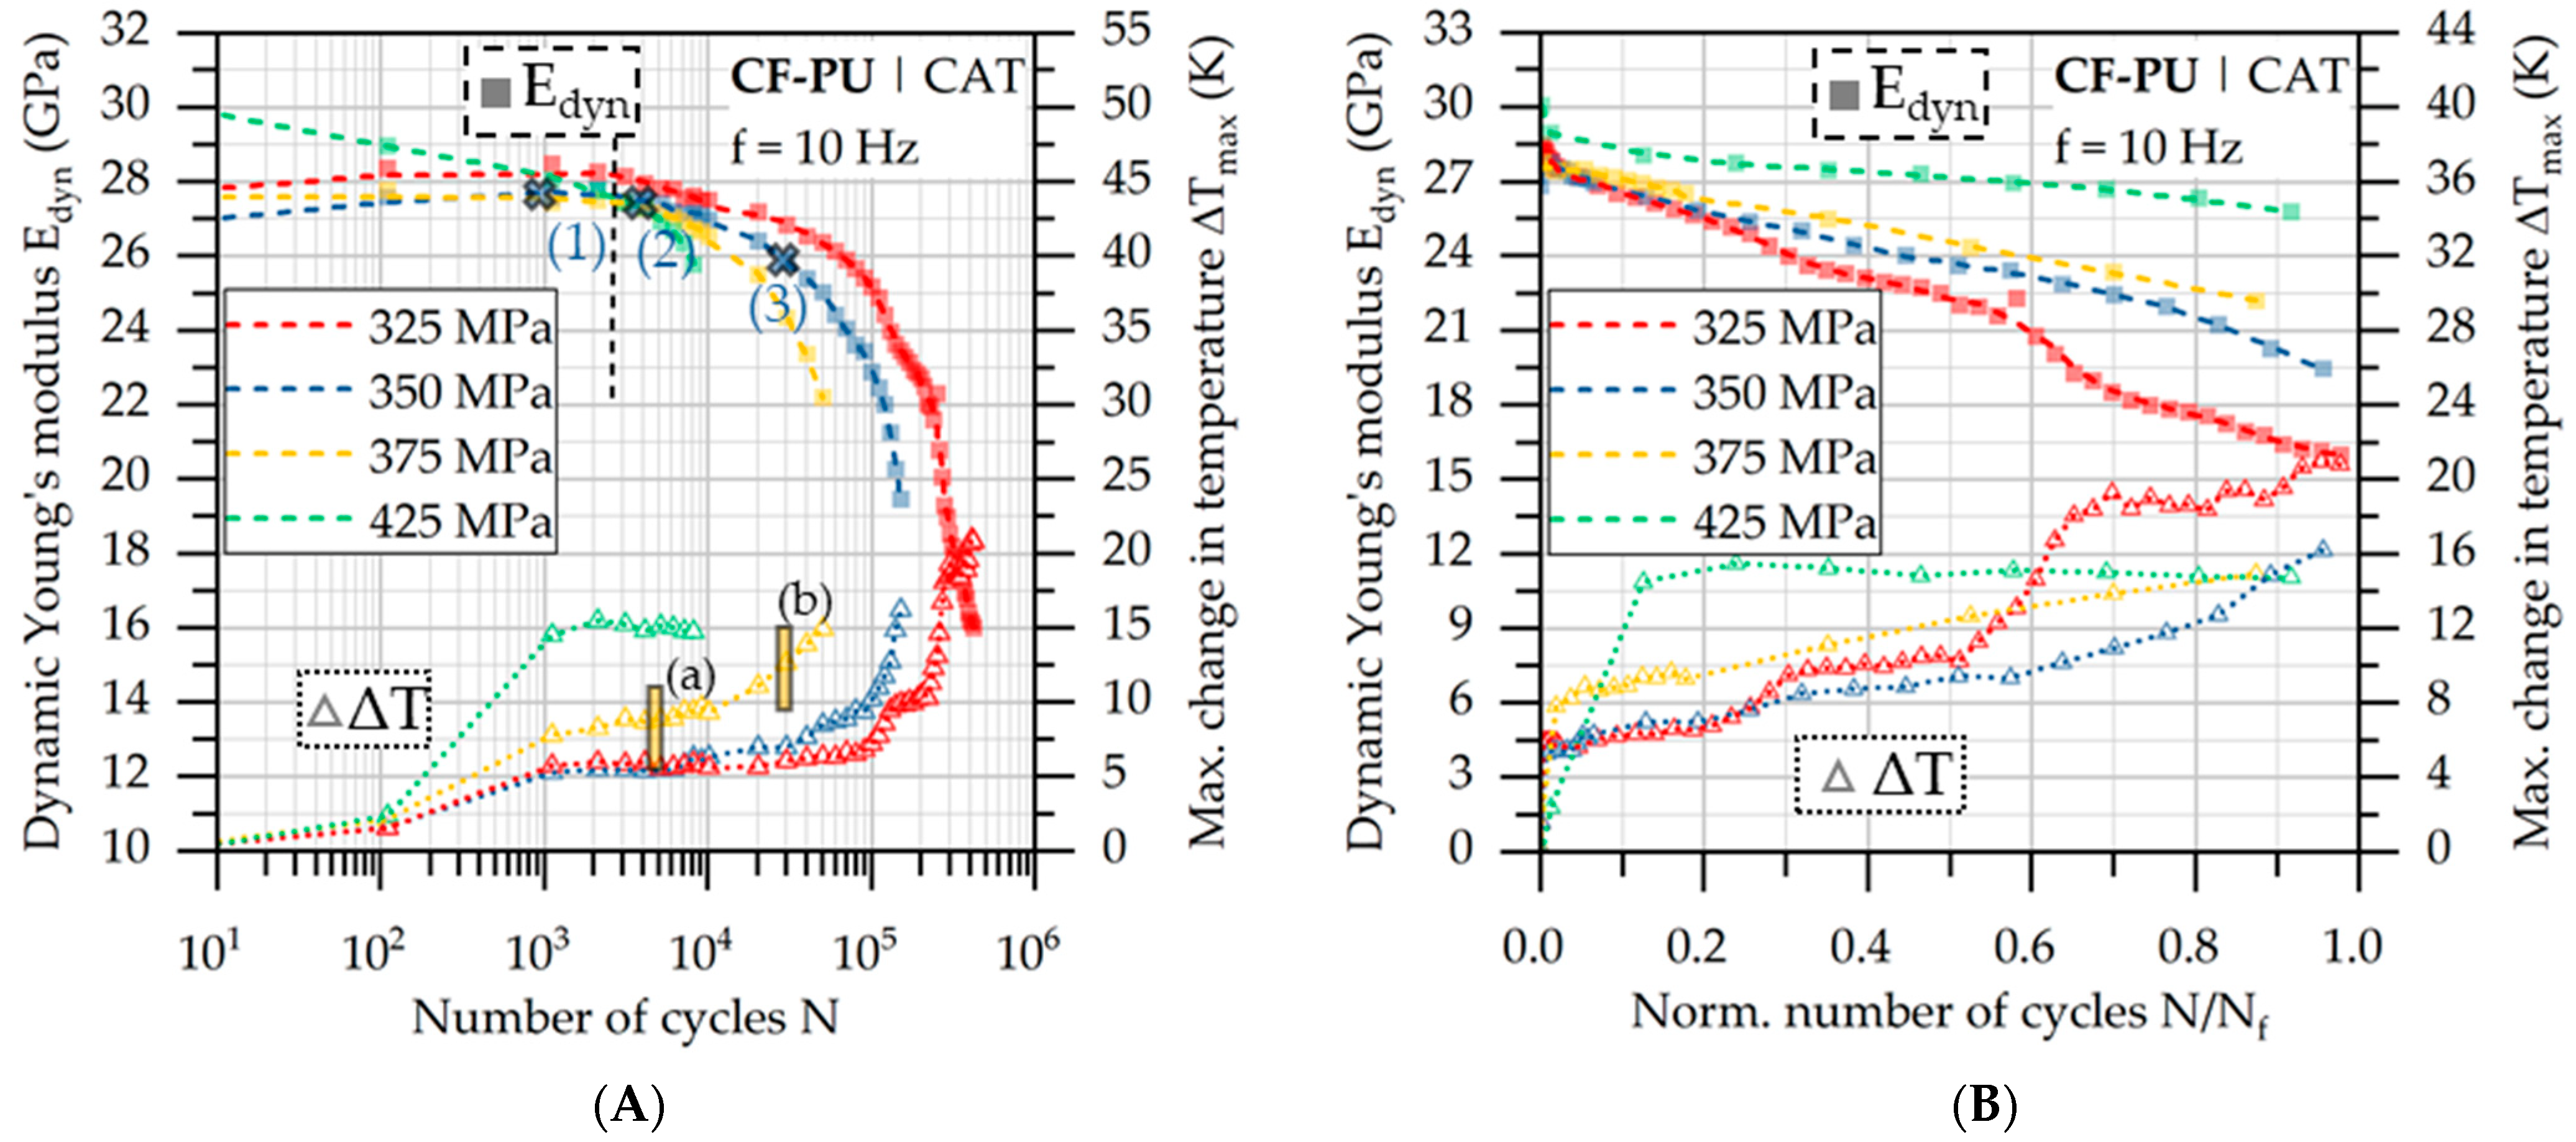
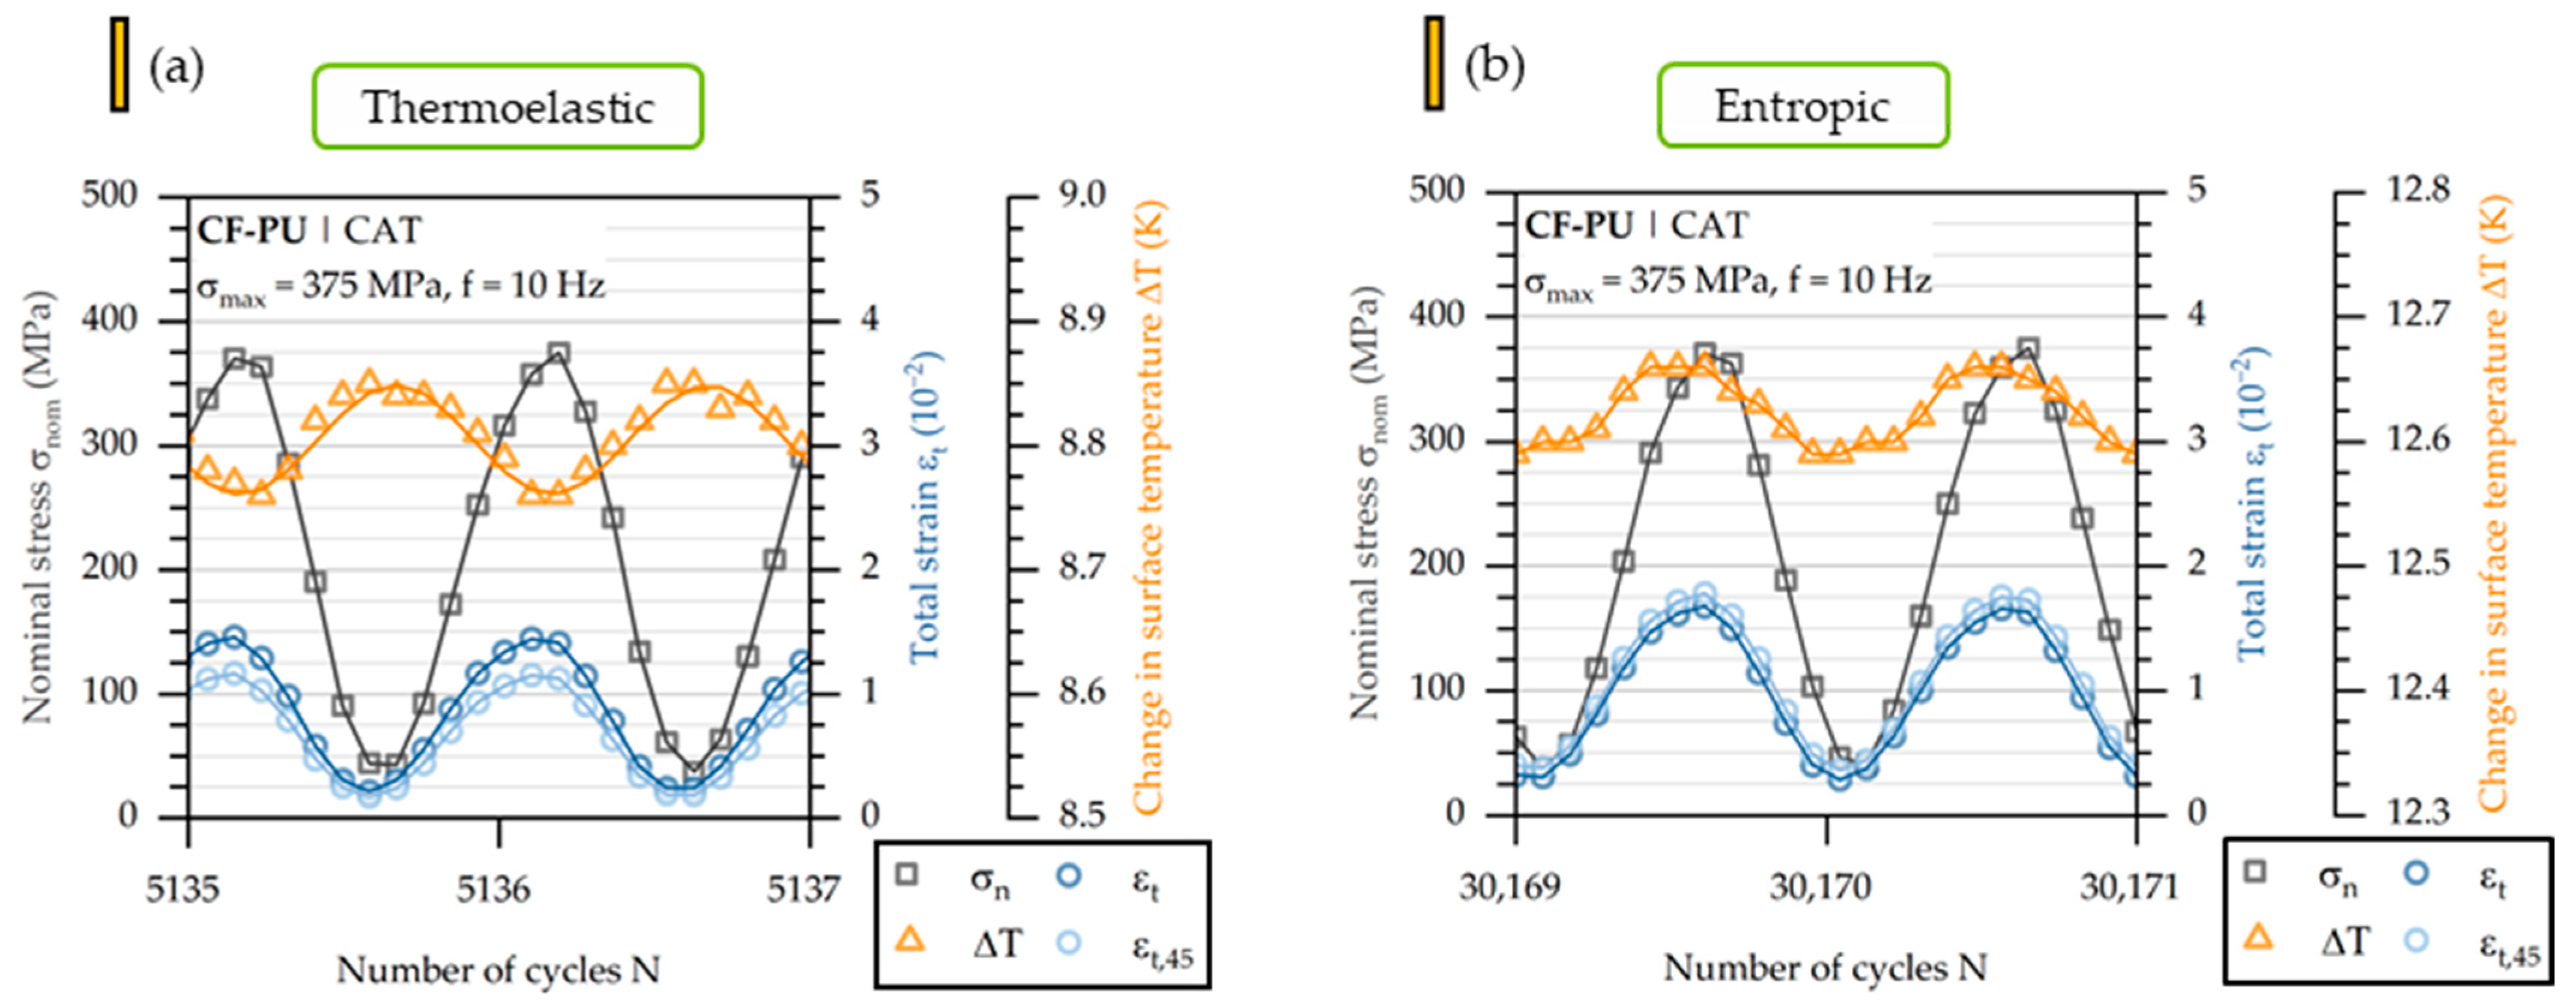
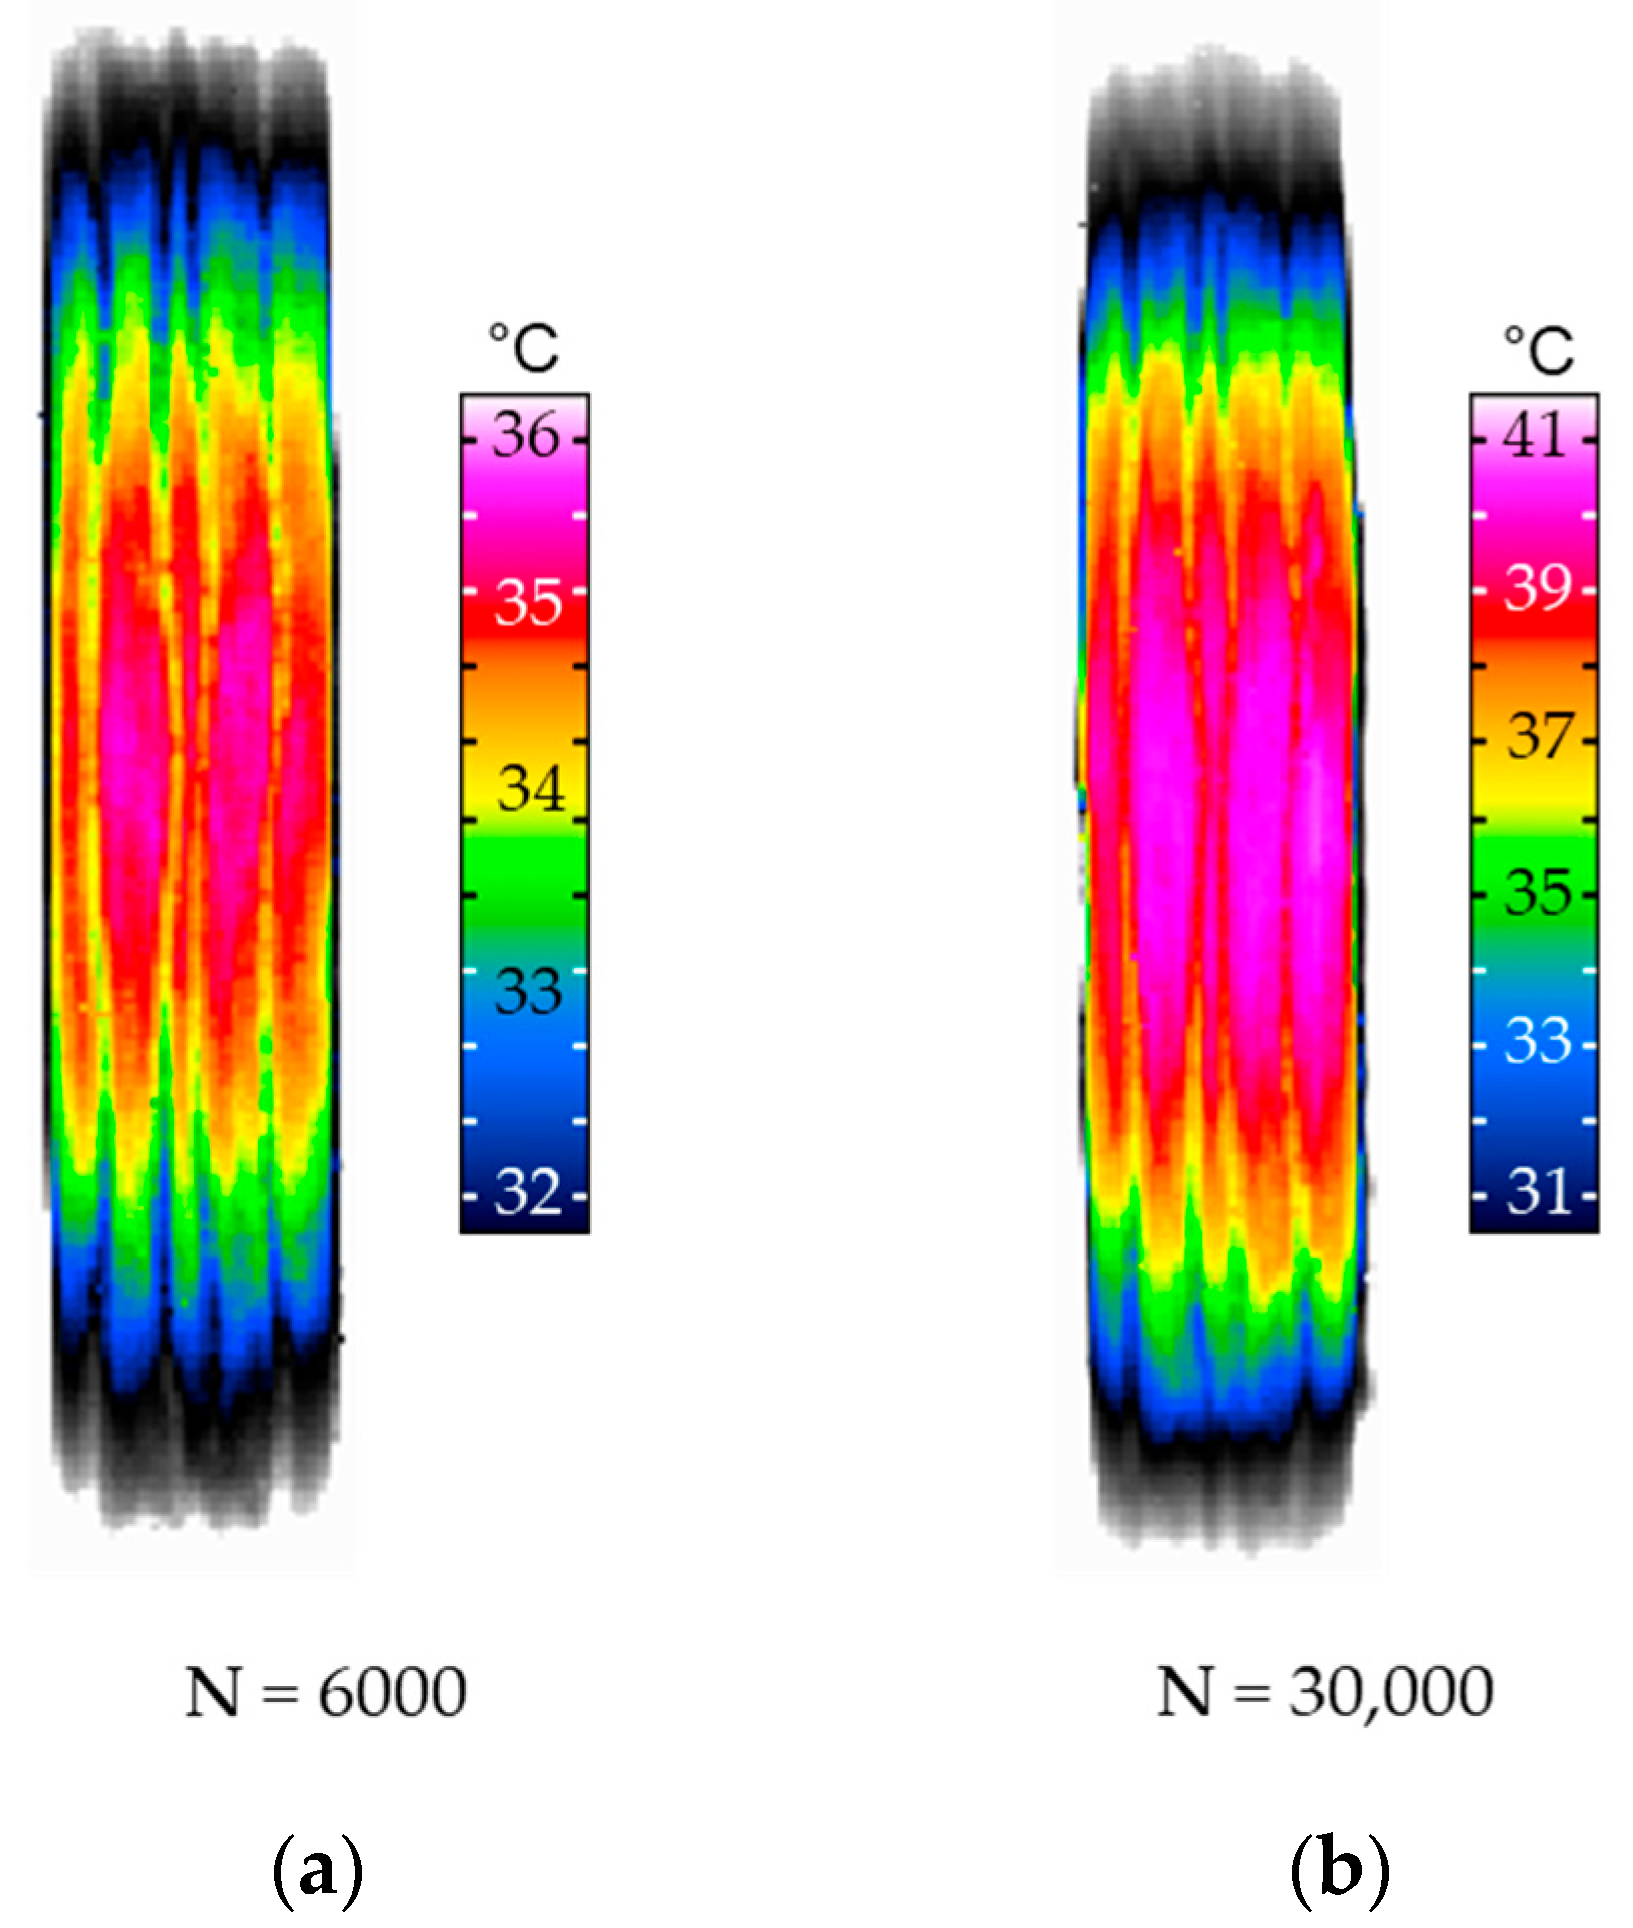
3.4. Extended Fatigue Charcterization

In Figure 9, the measured data during the fatigue tests are shown, whereas the top left diagram represents a whole fatigue test with a maximum stress of σmax = 325 MPa. As mentioned in Section 2.3, the measurement by the DIC and IR systems is not continuous. As can be seen in the diagrams, the recording was conducted at a defined number of cycles. Further zooming into the data reveals the expected sinusoidal course of the curves. It is evident that the strain measured on the front and on the side of the specimen ran in sync with the applied stress.
The change in temperature on the specimen’s surface showed a different course. Consistent with the described thermoelastic effect for FRPs [16,17], the curve of the temperature shoed a phase-shifted course, meaning that at the moment of the maximum stress. the temperature of the specimen was the lowest. The opposite was observed at the moment of the lowest stress, when the temperature was maximal. The results demonstrated that the thermoelastic effect of FRPs is applicable at the beginning of the fatigue lifetime.
As previously mentioned, the maximum stress was changed in the executed CAT for the examination of the fatigue behavior. Figure 10A shows the results of CAT on the basis of the measured data and material properties calculated. Regarding the dynamic Young’s modulus, it is noticeable that for all stress levels, the beginning of the fatigue tests showed no extinctive material reaction, and the course of the curve was flat, so no stiffness degradation was present. Solely the σmax = 425 MPa specimen underwent a constant decrease in Edyn from the start of the test. The presentation in the logarithmic scale of N indicates a turning point, which is marked in Figure 10A, where all specimens showed stronger material reactions in the form of degradation. The temperatures showed comparable courses, which enabled the correlation of the stress, strain and temperature data. In addition, it is of high interest that the material achieved higher degradation in the form of Edyn with lower σmax. However, it has to be stated that this type of degradation is connected to the longer lifetime achieved in the specimens with lower σmax. Regarding the global parameters of Edyn and ΔT, it can be assumed that the elastic deformation of the material was exceeded. Following this, dependencies on a local scale should now be obtained.
The diagram showed in Figure 10B provides the material properties versus the normalized number of cycles, allowing the comparison of fatigue tests with different maximum stresses to be more precise. Regarding the Young’s modulus, it is recognizable that in the beginning of the fatigue tests, all specimens showed a comparable linear stiffness degradation. However, a turning point, as shown in Figure 10A, could not be identified in this type of presentation.
Figure 11 presents three snapshots with subsequent strain measurements via DIC of three exemplary stages of fatigue damage of the CF-PU, which provide local information about the damage progression. The stages of fatigue life ((1), (2) and (3)) are also marked in Figure 10A. It can be seen that the described significant drop in the course was due to a crack developing through the entire specimen length. This is apparent from the crack initiation in the middle and at the edges of the specimen (stage (1) and (2)) and the connection of the initial cracks in stage (3). This behavior was observed in all fatigue tests, regardless of the maximum stress applied.
Figure 12 shows the described thermoelastic effect of the material at the beginning of fatigue testing, captured with the measurement technology of the DIC and IR systems. In consideration of the higher numbers of cycles, the behavior of the material switched from (a) thermoelastic to (b) entropic, meaning the temperature and residual measured properties were running in sync [18]. It seems obvious that the turning point, identified by the evaluation of Edyn, could not lead to a change from a thermoelastic to an entropic behavior of the material. Nevertheless, a significant temperature increase could be detected for all transition areas.
Figure 13 shows the recordings of the IR system for the previously discussed stages of the fatigue test (Figure 12). The thermoelastic behavior in Figure 13a shows that the matrix material exhibited a higher temperature than the fibers. After reaching the turning point to the entropic material behavior in Figure 13b, the matrix was still the area of highest temperature. It is clearly visible that at the turning of the material behavior, the temperature severely increased. However, the difference in temperature between fiber and matrix was 1 K, regardless of the damage progress, so that a differentiation of the thermoelastic effect in fiber and matrix could not be highlighted. Nevertheless, these investigations describe the complete composite material and provide information of high significance for the fatigue characterization.

4. Conclusions

Based on the presented investigations on CF-PU with regard to their fatigue properties in longitudinal and transverse directions, the following conclusions can be drawn.
The standardized specimen geometry provided a higher ultimate tensile strength (535 MPa) with respect to specimens with smaller widths. In comparison to specimens with widths of 9 and 15 mm, the ultimate tensile strength of the standardized specimen geometry was approx. 12% higher. Especially, specimens with widths of 3 mm should not be used for mechanical testing, since their ultimate tensile strength is decreased to 413 MPa. The tempering of CF-PU did not produce the desired effect and led to an ultimate tensile strength of 473 MPa.
No influence of the cutting direction on the tensile properties could be identified. Regarding the fatigue strength, the longitudinal specimens performed better than the transverse specimens by about 6%.
Following this, defects and fiber undulations within CF-PU were investigated by means of computed tomography. It can be stated that both affected the fatigue performance. This was due to the volume of defects oriented in the x-direction being 33.5%, while that of defects in Y-direction was 23.8%. Furthermore, undulations were found to be greater in the transverse direction by 17%.
Additional measurements with digital image correlation and infrared thermography provided gains in knowledge regarding global characteristic such as the dynamic Young’s modulus and the surface temperature of the specimens. These enabled a correlation between further material properties and identified a turning point between 2500 and 3000 cycles in the fatigue lifetime, where severe degradation begins.
Crack initiation and propagation resulted to cause unstable stiffness degradation. This was due to cracks spreading over the entire specimen length.
Transition areas between thermoelastic and entropic behavior of the material were identified at about 10,000 cycles for the maximum stress levels of 325, 350 and 375 MPa throughout the fatigue tests, accompanied with a global temperature increase.

Author Contributions

Conceptualization, L.G. and P.F.; methodology, L.G. and P.F.; investigation, L.G., P.F. and S.R.; writing—original draft preparation, L.G., P.F. and S.R.; writing—review and editing, G.A.B. and F.W.; visualization, L.G., P.F. and S.R.; supervision, G.A.B. and F.W. All authors have read and agreed to the published version of the manuscript.

Funding

The authors gratefully acknowledge the funding by Germany’s Federal Ministry for Economic Affairs and Energy (BMWi), managed by AiF Projekt GmbH within the Central Innovation Program for SMEs (ZIM, project no. ZF410111EB9 and ZF4631502EB8), Innosuisse Swiss Innovation Agency (project no. 33521.1 IP-ENG) and Austrian Research Promotion Agency (FFG, project no. 879899) of the project “Material and process development of high strength carbon-polyurethane-composite structures”. Furthermore, the authors thank the German Research Foundation (Deutsche Forschungsgemeinschaft, DFG) and the Ministry of Culture and Science of North Rhine-Westphalia (Ministerium fuer Kultur und Wissenschaft des Landes Nordrhein-Westfalen, NRW) for their financial support within the Major Research Instrumentation Program for the high-speed camera system (project no. 424852613, INST 212/428-1 FUGG) and the high-speed thermography system (project no. 444290516, INST 212/459-1 FUGG).

Institutional Review Board Statement

Not applicable.

Informed Consent Statement

Not applicable.

Data Availability Statement

The data presented in this study are available on request from the corresponding author.

Acknowledgments

We thank Rühl Puromer GmbH, FACC Operations GmbH, Isotherm AG, and 3A Composites/Airex AG for their great support.

Conflicts of Interest

The authors declare no conflict of interest.

References

  1. Vassilopoulos, A.P.; Keller, T. Fatigue of Fiber-Reinforced Composites; Springer-Verlag London Limited: London, UK, 2011; ISBN 9781849961813. [Google Scholar]
  2. Trappe, V.; Harbich, K. Intralaminar fatigue behaviour of carbon fibre reinforced plastics. Int. J. Fatigue 2006, 28, 1187–1196. [Google Scholar] [CrossRef]
  3. Blondeau, C.; Pappas, G.A.; Botsis, J. Crack propagation in CFRP laminates under mode I monotonic and fatigue loads: A methodological study. Compos. Struct. 2021, 256, 113002. [Google Scholar] [CrossRef]
  4. Guo, R.; Li, C.; Niu, Y.; Xian, G. The fatigue performances of carbon fiber reinforced polymer composites—A review. J. Mater. Res. Technol. 2022, 21, 4773–4789. [Google Scholar] [CrossRef]
  5. Crupi, V.; Guglielmino, E.; Risitano, G.; Tavilla, F. Experimental analyses of SFRP material under static and fatigue loading by means of thermographic and DIC techniques. Compos. Part B Eng. 2015, 77, 268–277. [Google Scholar] [CrossRef]
  6. Jerabek, M.; Major, Z.; Lang, R.W. Strain determination of polymeric materials using digital image correlation. Polym. Test. 2010, 29, 407–416. [Google Scholar] [CrossRef]
  7. Kashfuddoja, M.; Prasath, R.; Ramji, M. Study on experimental characterization of carbon fiber reinforced polymer panel using digital image correlation: A sensitivity analysis. Opt. Lasers Eng. 2014, 62, 17–30. [Google Scholar] [CrossRef]
  8. Golewski, P.; Sadowski, T.; Kneć, M.; Budka, M. The effect of thermal aging degradation of CFRP composite on its mechanical properties using destructive and non-destructive methods and the DIC system. Polym. Test. 2023, 118, 107902. [Google Scholar] [CrossRef]
  9. Morscher, G.; Maxwell, R. Monitoring tensile fatigue crack growth and fiber failure around a notch in laminate SIC/SIC composites utilizing acoustic emission, electrical resistance, and digital image correlation. J. Eur. Ceram. Soc. 2019, 39, 229–239. [Google Scholar] [CrossRef]
  10. Steinberger, R.; Valadasleitao, T.; Ladstatter, E.; Pinter, G.; Billinger, W.; Lang, R. Infrared thermographic techniques for non-destructive damage characterization of carbon fibre reinforced polymers during tensile fatigue testing. Int. J. Fatigue 2006, 28, 1340–1347. [Google Scholar] [CrossRef]
  11. Pitarresi, G.; Scalici, T.; Catalanotti, G. Infrared Thermography assisted evaluation of static and fatigue mode II fracture toughness in FRP composites. Compos. Struct. 2019, 226, 111220. [Google Scholar] [CrossRef]
  12. Popow, V.; Vogtmann, J.; Gurka, M. In-situ characterization of impact damage in carbon fibre reinforced polymers using infrared thermography. Infrared Phys. Technol. 2022, 122, 104074. [Google Scholar] [CrossRef]
  13. de Giorgi, M.; Nobile, R.; Palano, F. CFRP Fatigue Damage Detection by Thermal Methods. Materials 2022, 15, 3787. [Google Scholar] [CrossRef]
  14. Huelsbusch, D.; Walther, F. Damage detection and fatigue strength estimation of carbon fibre reinforced polymers (CFRP) using combined electrical and high-frequency impulse measurements. In Proceedings of the 6th International Symposium on NDT in Aerospace, Brussels, Belgium, 27–29 May 2015. [Google Scholar]
  15. Mortazavian, S.; Fatemi, A. Fatigue behavior and modeling of short fiber reinforced polymer composites: A literature review. Int. J. Fatigue 2015, 70, 297–321. [Google Scholar] [CrossRef]
  16. Dulieu-Barton, J.M.; Stanley, P. Applications of thermoelastic stress analysis to composite materials. Strain 1999, 35, 41–48. [Google Scholar] [CrossRef]
  17. Pitarresi, G.; Galietti, U.A. Quantitative analysis of the thermoelastic effect in CFRP composite materials. Strain 2010, 46, 446–459. [Google Scholar] [CrossRef]
  18. Benaarbia, A.; Chrysochoos, A.; Robert, G. Influence of relative humidity and loading frequency on the PA6.6 cyclic thermomechanical behavior: Part I. mechanical and thermal aspects. Polym. Test. 2014, 40, 290–298. [Google Scholar] [CrossRef] [Green Version]
  19. Hülsbusch, D.; Jamrozy, M.; Frieling, G.; Mueller, Y.; Barandun, G.A.; Niedermeier, M.; Walther, F. Comparative characterization of quasi-static and cyclic deformation behavior of glass fiber-reinforced polyurethane (GFR-PU) and epoxy (GFR-EP). Mater. Test. 2017, 59, 109–117. [Google Scholar] [CrossRef] [Green Version]
  20. Ma, Y.; Yang, Y.; Sugahara, T.; Hamada, H. A study on the failure behavior and mechanical properties of unidirectional fiber reinforced thermosetting and thermoplastic composites. Compos. Part B Eng. 2016, 99, 162–172. [Google Scholar] [CrossRef]
  21. Li, G.; Maricherla, D.; Singh, K.; Pang, S.-S.; John, M. Effect of fiber orientation on the structural behavior of FRP wrapped concrete cylinders. Compos. Struct. 2006, 74, 475–483. [Google Scholar] [CrossRef]
  22. Spencer, R.; Alwekar, S.; Jo, E.; Hassen, A.A.; Kim, S.; Vaidya, U. Fiber orientation evaluation in reinforced composites using digital image correlation and thermal excitation. Compos. Part B Eng. 2022, 234, 109713. [Google Scholar] [CrossRef]
  23. ISO 527-1; Plastics-Determination of Tensile Properties-Part 1: General Principles. Beuth Verlag: Berlin, Germany, 2019; pp. 1–37. [CrossRef]
  24. Mrzljak, S.; Gerdes, L.; Keuntje, J.; Wippo, V.; Jaeschke, P.; Walther, F. Assessment of laser cutting parameters and heat-affected zone on microstructure and fatigue behaviour of carbon fibre-reinforced epoxy. Proc. Inst. Mech. Eng. Part E J. Process Mech. Eng. 2022. [Google Scholar] [CrossRef]
  25. ISO 13003; Fibre-Reinforced Plastics-Determination of Fatigue Properties under Cyclic Loading Conditions. Beuth Verlag: Berlin, Germany, 2003; pp. 1–17.
  26. Neitzel, B.; Fiebig, C.; Koch, M. Influence of fiber undulation on the mechanical properties of fiber reinforced plastics. In Proceedings of the 59th Ilmenau Scientific Colloqium, Ilmenau, Germany, 11–15 September 2017. [Google Scholar]
  27. Charlebois, K.M.; Boukhili, R.; Zebdi, O.; Trochu, F.; Gasmi, A. Evaluation of the physical and mechanical properties of braided fabrics and their composites. J. Reinf. Plast. Compos. 2005, 24, 1539–1554. [Google Scholar] [CrossRef]
  28. Ahmad, F.; Yuvaraj, N.; Bajpai, P.K. Effect of reinforcement architecture on the macroscopic mechanical properties of fiberous polymer composites: A review. Polym. Compos. 2020, 41, 2518–2534. [Google Scholar] [CrossRef]
Figure 1. Defect detection of a CT scan with scaling of the defects by their size in mm3.
Eng 04 00060 g001
Figure 2. Exemplary evaluation of fiber undulations.
Eng 04 00060 g002
Figure 3. Specimen geometry for tensile testing with varying width w.
Eng 04 00060 g003
Figure 4. (a) Specimen geometry for the fatigue tests and (b) cutting orientations.
Eng 04 00060 g004
Figure 5. Setup for the fatigue testing; (a) plan view and (b) side view.
Eng 04 00060 g005
Figure 6. Dependency of the ultimate tensile strength on the specimen’s width.
Eng 04 00060 g006
Figure 7. Tensile tests on CF-PU specimen cut in longitudinal and transverse direction (a) stress vs. strain data and (b) material properties.
Eng 04 00060 g007
Figure 8. Experimentally determined and theoretical Woehler curves of CF-PU for longitudinal and transverse specimens’ orientations.
Eng 04 00060 g008
Figure 9. Exemplar measurement data recorded during the fatigue tests.
Eng 04 00060 g009
Figure 10. Dynamic Young’s modulus and change in temperature versus (A) number of cycles and (B) normalized number of cycles.
Eng 04 00060 g010
Figure 11. Strain measured via DIC for three different stages of damage.
Eng 04 00060 g011
Figure 12. Exemplary representation of the transition from (a) thermoelastic to (b) entropic material behavior.
Eng 04 00060 g012
Figure 13. Temperature of a specimen captured in (a) a thermoelastic area and (b) an entropic area.
Eng 04 00060 g013
Table 1. Measurement points of the DIC and IR systems.
Number of CyclesMeasurement
1 to 6
100 to 10,000every 1000
10,000 to 600,000every 10,000
600,000 to 900,000every 50,000
900,000 to 2,000,000every 300,000
Table 2. Standard deviations and slopes as shown in Figure 8.
275 MPa300 MPa325 MPa350 MPa375 MPa400 MPa425 MPa
Nf with standard deviationlongitudinal/completed625,872
± 258,687
129,685
± 33,100
59,898
± 2440
28,755
± 2611
6228
± 329
transverse1,447,704
± 352,296
366,803
± 143,747
123,119
± 32,563
55,457
± 4766
28,519
± 7341
2547
± 1398
/
Slopelongitudinal f N = 778.21 × N 0.0660
transverse f N = 840.11 × N 0.0798
Table 3. Results of microstructural investigations regarding the defect volume content for longitudinal and transverse specimen.
Defect Volume
Content [%]
S1S2S3S4S5S6S7AverageStandard
Deviation
x-direction34.654.943.437.215.613.035.533.5±13.7
y-direction33.223.131.733.813.811.120.023.8±8.7
Table 4. Undulations in the longitudinal and transverse directions estimated from µCT-scans.
Undulation Size
[μm]
S1S2S3S4S5S6S7AverageStandard Deviation
Longitudinal direction487.0482.2470.5372.5502.0461.7473.6464.2±39.3
Transverse direction521.0495.5526.1516.4596.8615.6540.0544.5±41.2
Disclaimer/Publisher’s Note: The statements, opinions and data contained in all publications are solely those of the individual author(s) and contributor(s) and not of MDPI and/or the editor(s). MDPI and/or the editor(s) disclaim responsibility for any injury to people or property resulting from any ideas, methods, instructions or products referred to in the content.

