
Measuring the Adoption of Drones: A Case Study of the United States Agricultural Aircraft Sector

Spatial Data Analysis and Visualization Laboratory, University of Hawaii at Hilo, Hilo, HI 96720, USA
Eng 2023, 4(1), 977-983; https://doi.org/10.3390/eng4010058
Submission received: 31 December 2022
/
Revised: 27 February 2023
/
Accepted: 16 March 2023
/
Published: 17 March 2023
(This article belongs to the Special Issue Feature Papers in Eng 2022)
Abstract
:Unmanned aircraft systems (UAS), commonly referred to as drones, are an emerging technology that has changed the way many industries conduct business. Precision agriculture is one industry that has consistently been predicted to be a major locus of innovation for UAS. However, this has not been the case globally. The agricultural aircraft sector in the United States is used as a case study here to consider different metrics to evaluate UAS adoption, including a proposed metric, the normalized UAS adoption index. In aggregate, UAS operators only make up 5% of the number of agricultural aircraft operators. However, the annual number of new UAS operators exceeded that of manned aircraft operators in 2022. When used on a state-by-state basis, the normalized UAS adoption index shows that there are regional differences in UAS adoption with western and eastern states having higher UAS adoption rates while central states have significantly lower UAS adoption rates. This has implications for UAS operators, manufacturers, and regulators as this industry continues to develop at a rapid pace.
1. Introduction
Unmanned aircraft systems (UAS), also referred to as unmanned aerial vehicles (UAV) and drones, have made great strides globally as regulatory frameworks have gradually accommodated this growing sector. Precision agriculture is frequently projected to be the most significant industry to benefit from these new tools [1,2,3]. However, these optimistic predictions have not been achieved [4,5]. In many cases throughout the world, regulatory hurdles remain in the United States [6], Europe [7,8], India [9], and Africa [10]. Meanwhile, UAS have been at the forefront of aerial application in Japan [11], China [12], and Korea [13].
Traditional aerial applications of plant protection products have been at the core of developments in UAS [14,15,16,17]. Additionally, some more specific applications in agriculture and forestry have crossed over from manned aircraft, including insect sampling [18,19], encapsulated herbicide applications [20], and aerial ignition [21]. Novel applications that are unique to this platform include vegetation sampling [22,23,24] and cattle herding [25]. While these new developments have introduced more cases for UAS, the implementation has proven difficult to measure.
Recent bibliometric studies on agricultural UAS have shown an increasing trend [26,27,28]. However, these studies are biased toward research and remote sensing. This study seeks to measure the implementation of UAS by industry—specifically, agricultural aircraft operators. Several metrics for the assessment of technology adoption have been developed, which are typically based on the percentages of users [29]. For agricultural technology, the Agricultural Technology Adoption Index uses an area that the technology is operated within as the base metric [30]. While the area is an effective base measurement, this data is not publicly available for applied areas of different aerial application technology.
In this study, the adoption of UAS compared to existing manned aviation is considered the use of a number of agricultural aircraft operators in the USA as a case study: Section 2 describes the materials and methods, including operator data acquisition and analysis; Section 3 describes the results of aggregated data analysis and annual trends; Section 4 discusses the experimental results including implications for regulators; and Section 5 concludes the work.
2. Materials and Methods
Data on agricultural aircraft operators was downloaded from the FAA databases [31] on 24 November 2022. Agricultural aircraft operators are regulated under Title 14 of the Code of Federal Regulations Part 137. The data was partitioned first by operator type (i.e., Part 137) and then by aircraft operated to separate those operators who had UAS listed on the operator certificates and those who did not. Data were then aggregated by year and by state for temporal and spatial analyses. Agricultural aircraft operators utilizing UAS who had certificates prior to the introduction of Part 107, i.e., operated manned aircraft and added UAS to their existing certificate, were aggregated together during the temporal analysis. The number of farms and the average farm size on a state basis, based on a 2021 USDA report [32], were also incorporated into the analysis. ANOVA was performed using R [33] to identify significant factors correlating with the number of agricultural aircraft operators using UAS.
To illustrate the adoption of UAS, an additional metric, the normalized UAS adoption index, I, is defined as
where nUAS is the total number of agricultural aircraft operators using UAS, nM is the total number of agricultural aircraft operators only using manned aircraft, and the subscript x denotes the quantity at the individual state level. The normalized UAS adoption index was calculated for each state and regional trends were analyzed qualitatively.
3. Results
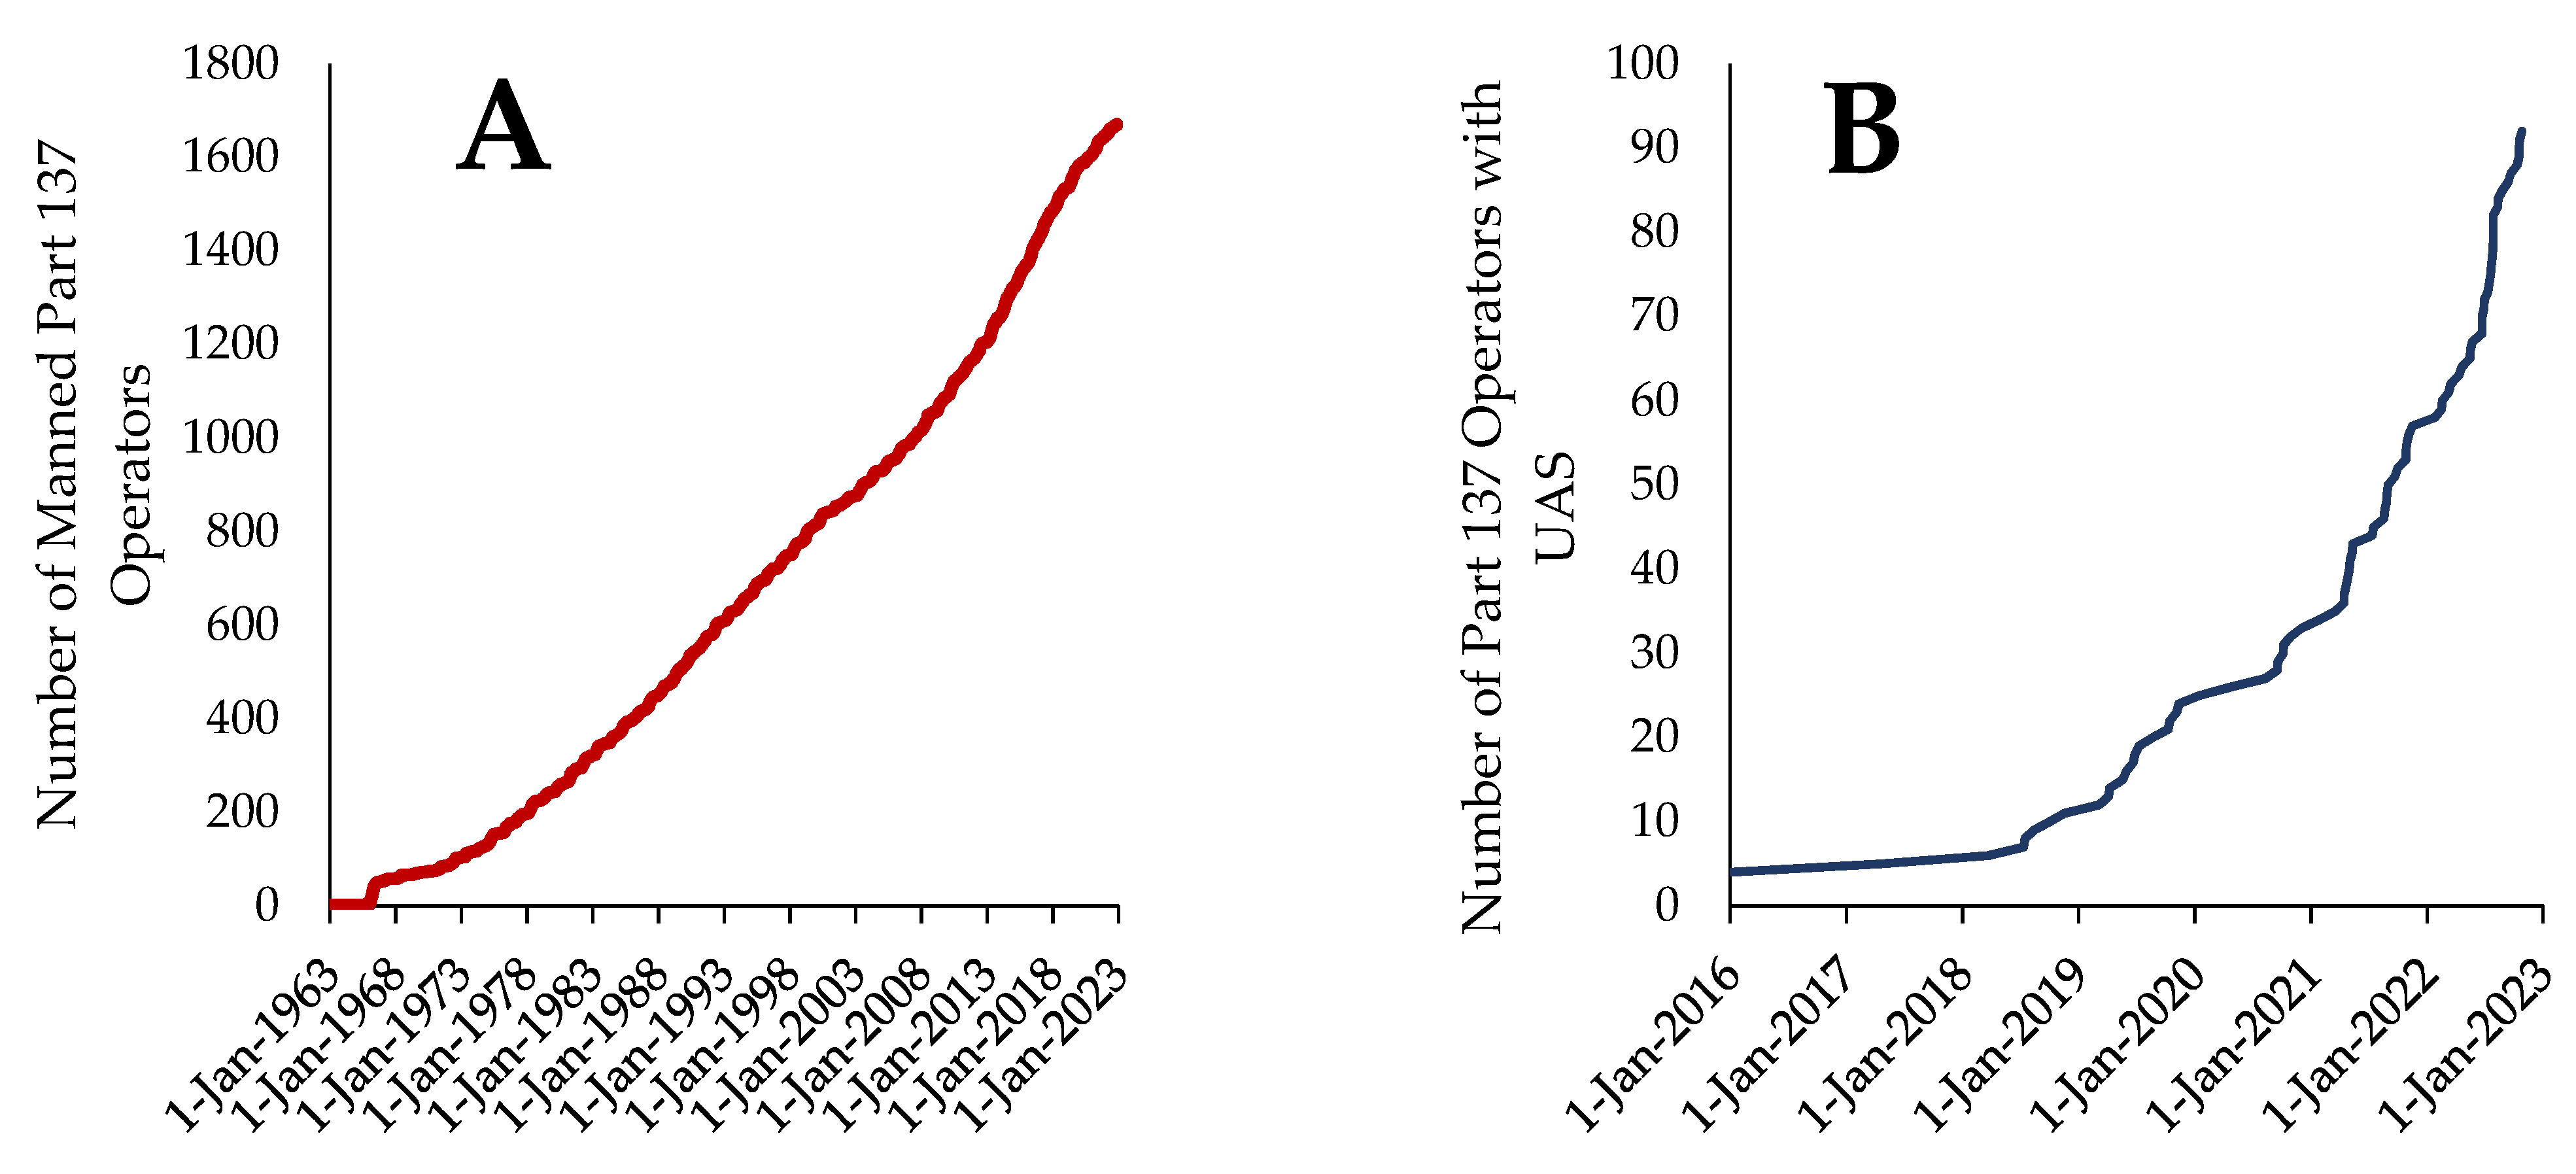
Following the initial introduction of the Part 137 operator certificate in 1967, there has been a steady increase in the number of operators (Figure 1). We see a similar pattern for UAS agricultural aircraft operators following the introduction of 14 CFR 107 in 2016 and the standardized exemption for agricultural UAS operations. At the end of the study period, there were 1767 Part 137 operators, of which 93 (5%) made use of UAS.
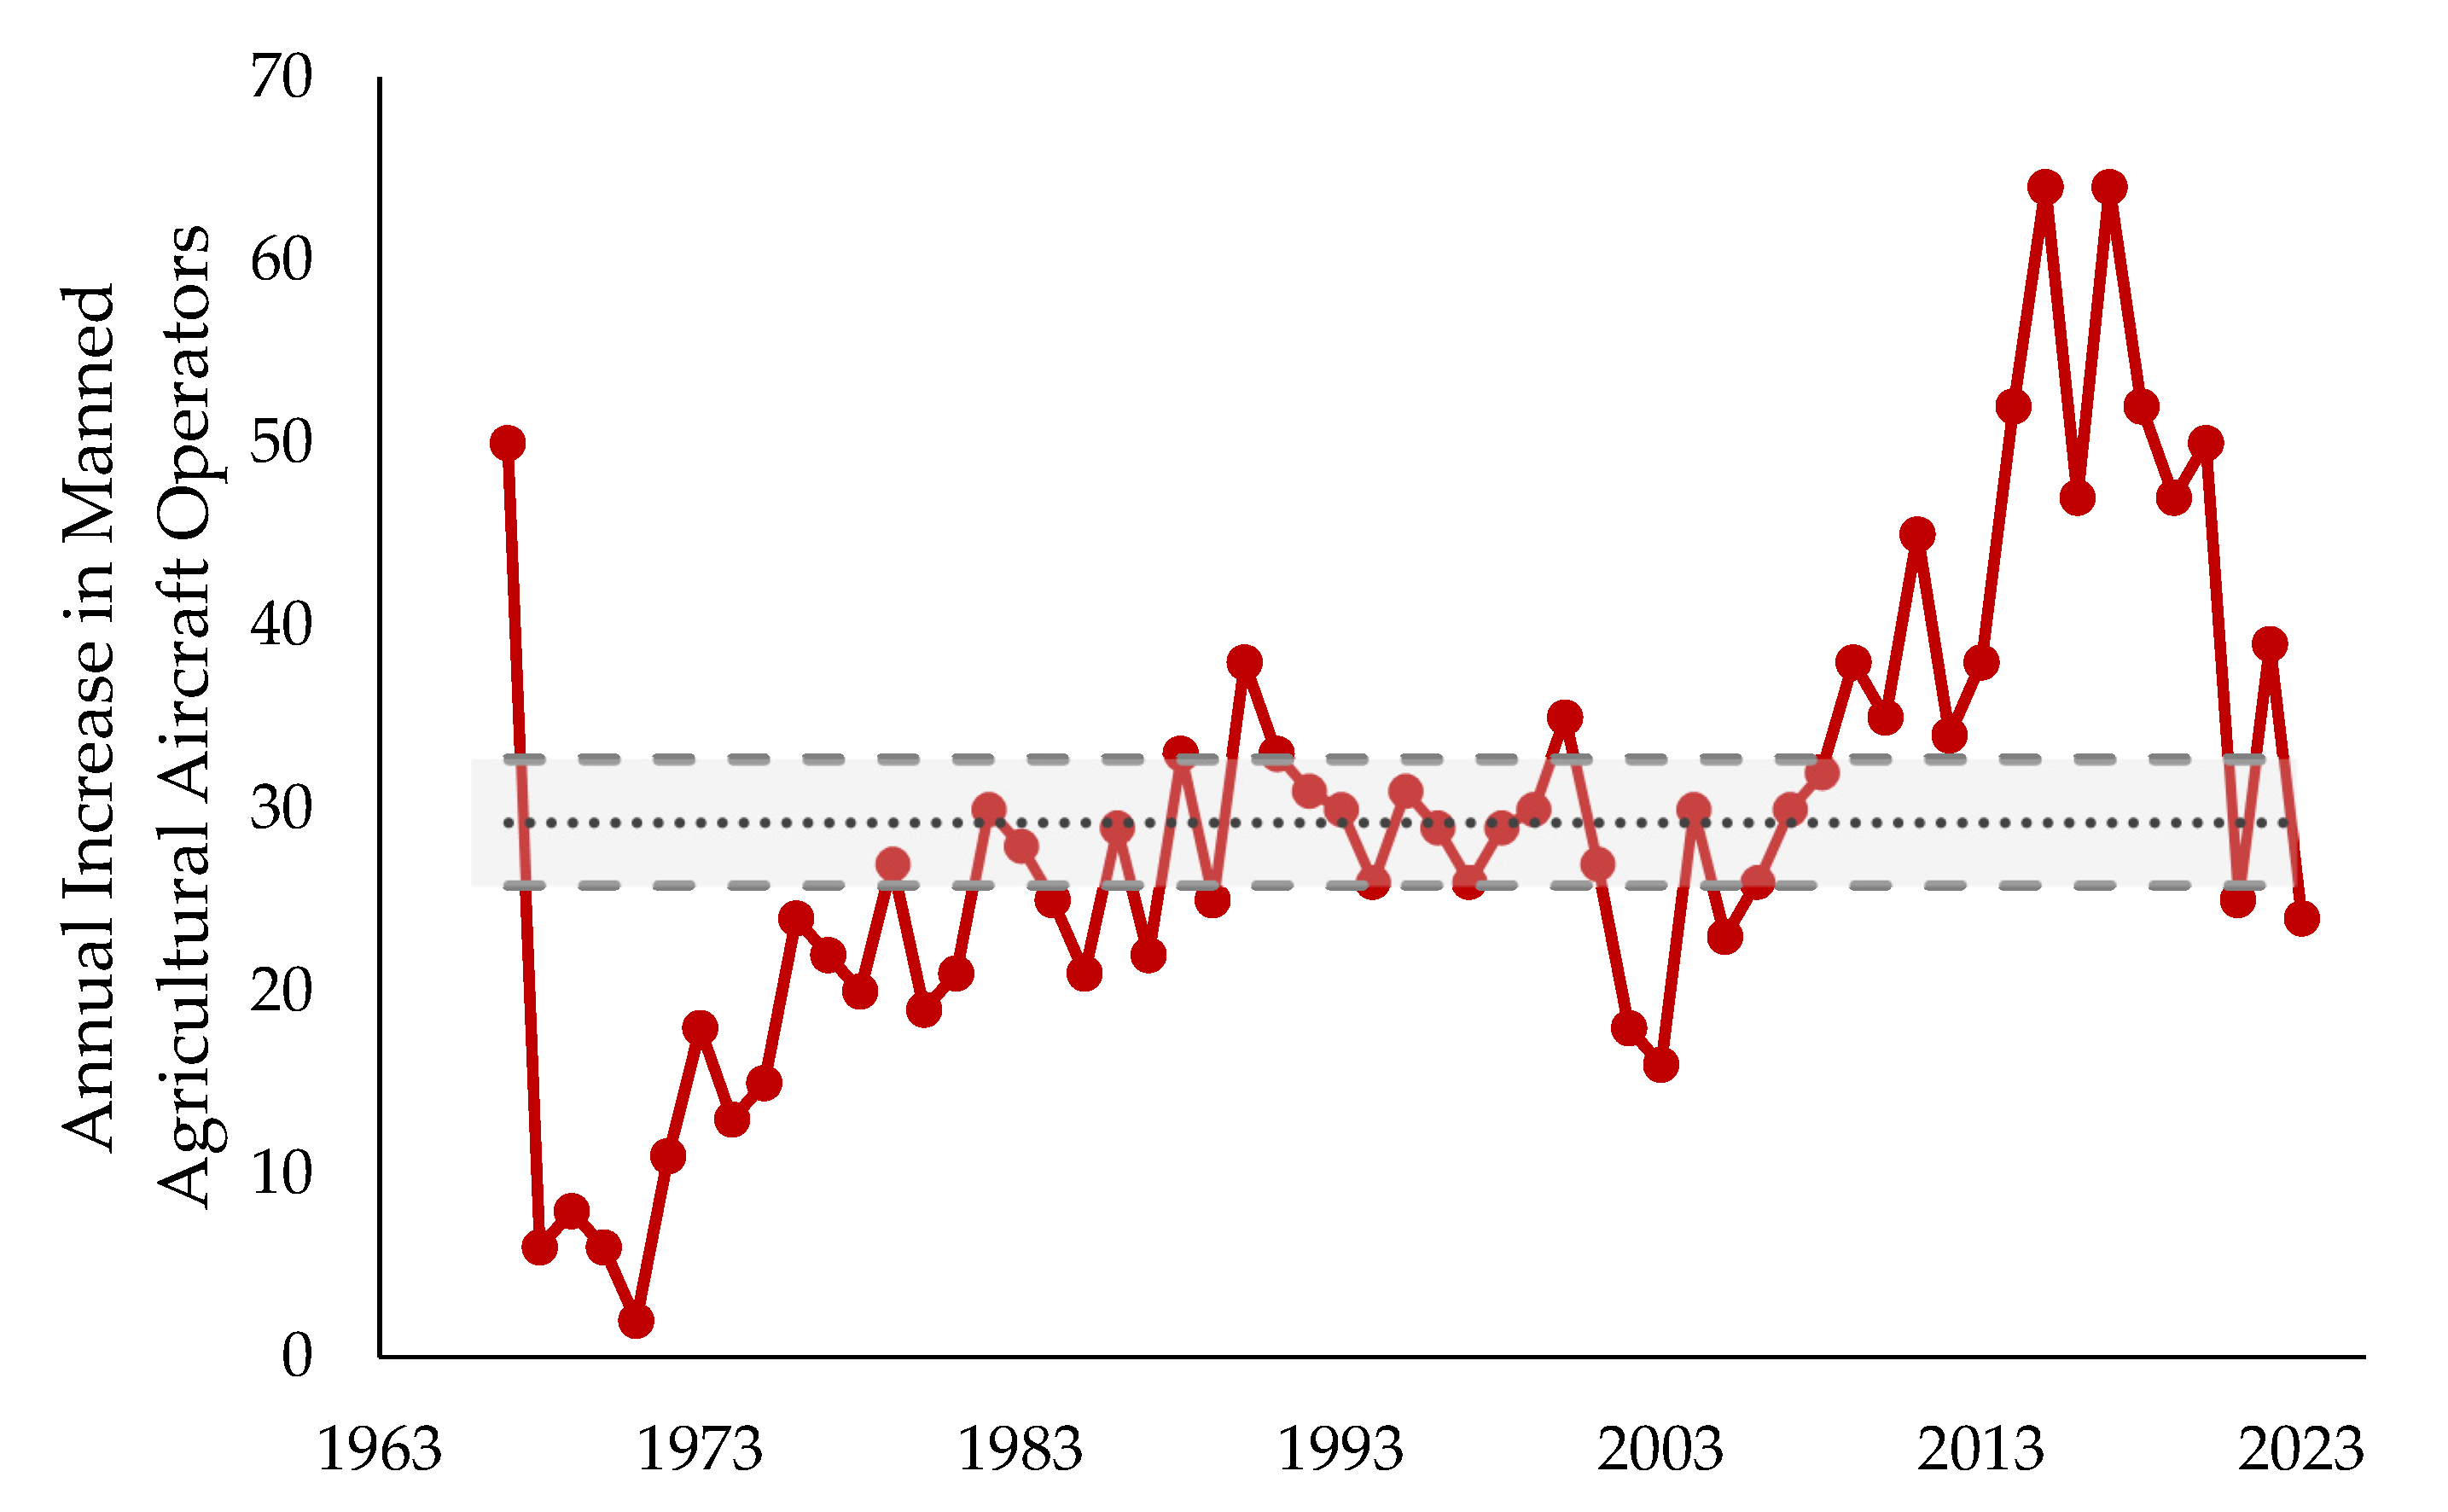
Focusing on manned agricultural aircraft operators, we see that the annual increase in the number of operators was relatively stable after 1986 until 2008 (Figure 2). The years from 2009 to 2020 saw an increase in the annual increase in operators, with a sharp increase starting in 2014. This increase is likely due to changes in the certification process following the FAA Modernization and Reform Act of 2012 [34], and in response to an audit report by the Inspector General [35]. Since 2021, the rate has fallen back to average levels of 29.3 new operators per year, likely due to complications in the certification process caused by COVID-19, e.g., restrictions on travel and meetings preventing in-person knowledge and skill tests.
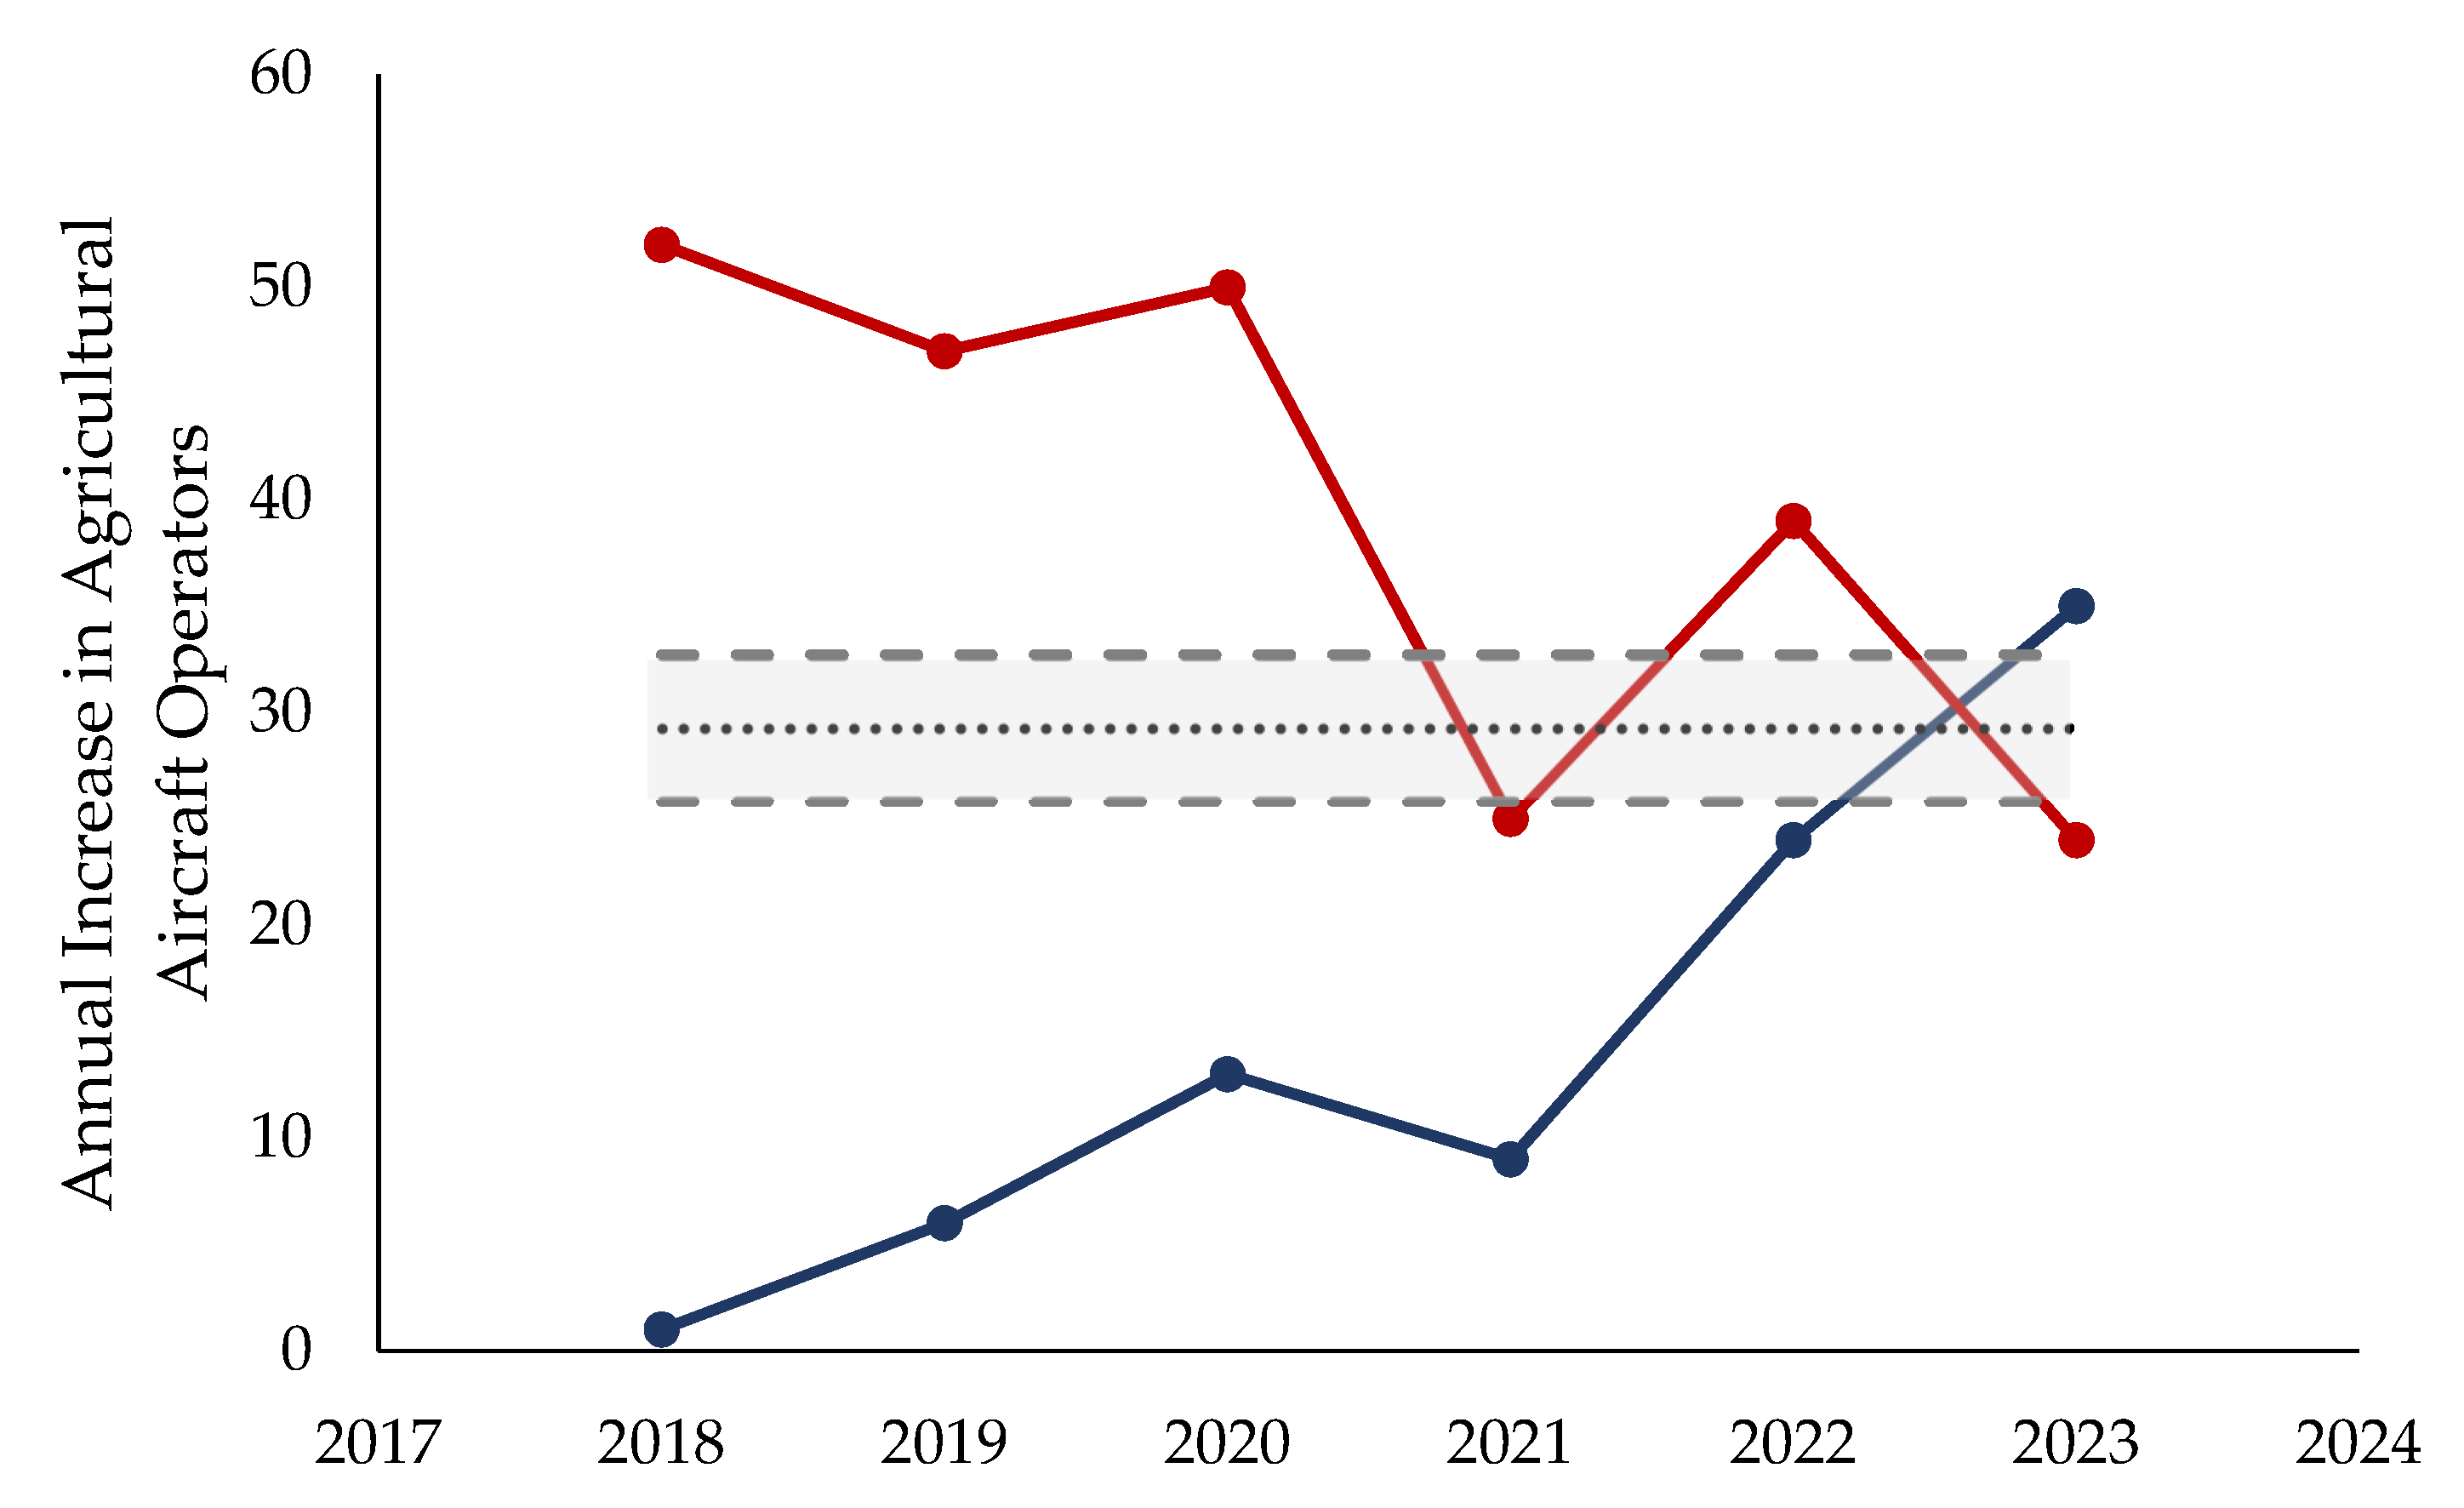
Comparing the rate of new operators per year, we see that the addition of UAS operators had a significantly slower start than manned agricultural aircraft operators, which did not have the initial spike that manned agricultural aircraft operators experienced (Figure 3). However, the rate of new additions has rapidly climbed and in 2022, for the first time, the addition of new UAS agricultural aircraft operators has exceeded that of manned agricultural aircraft operators and also the average annual rate of new manned agricultural aircraft operators.
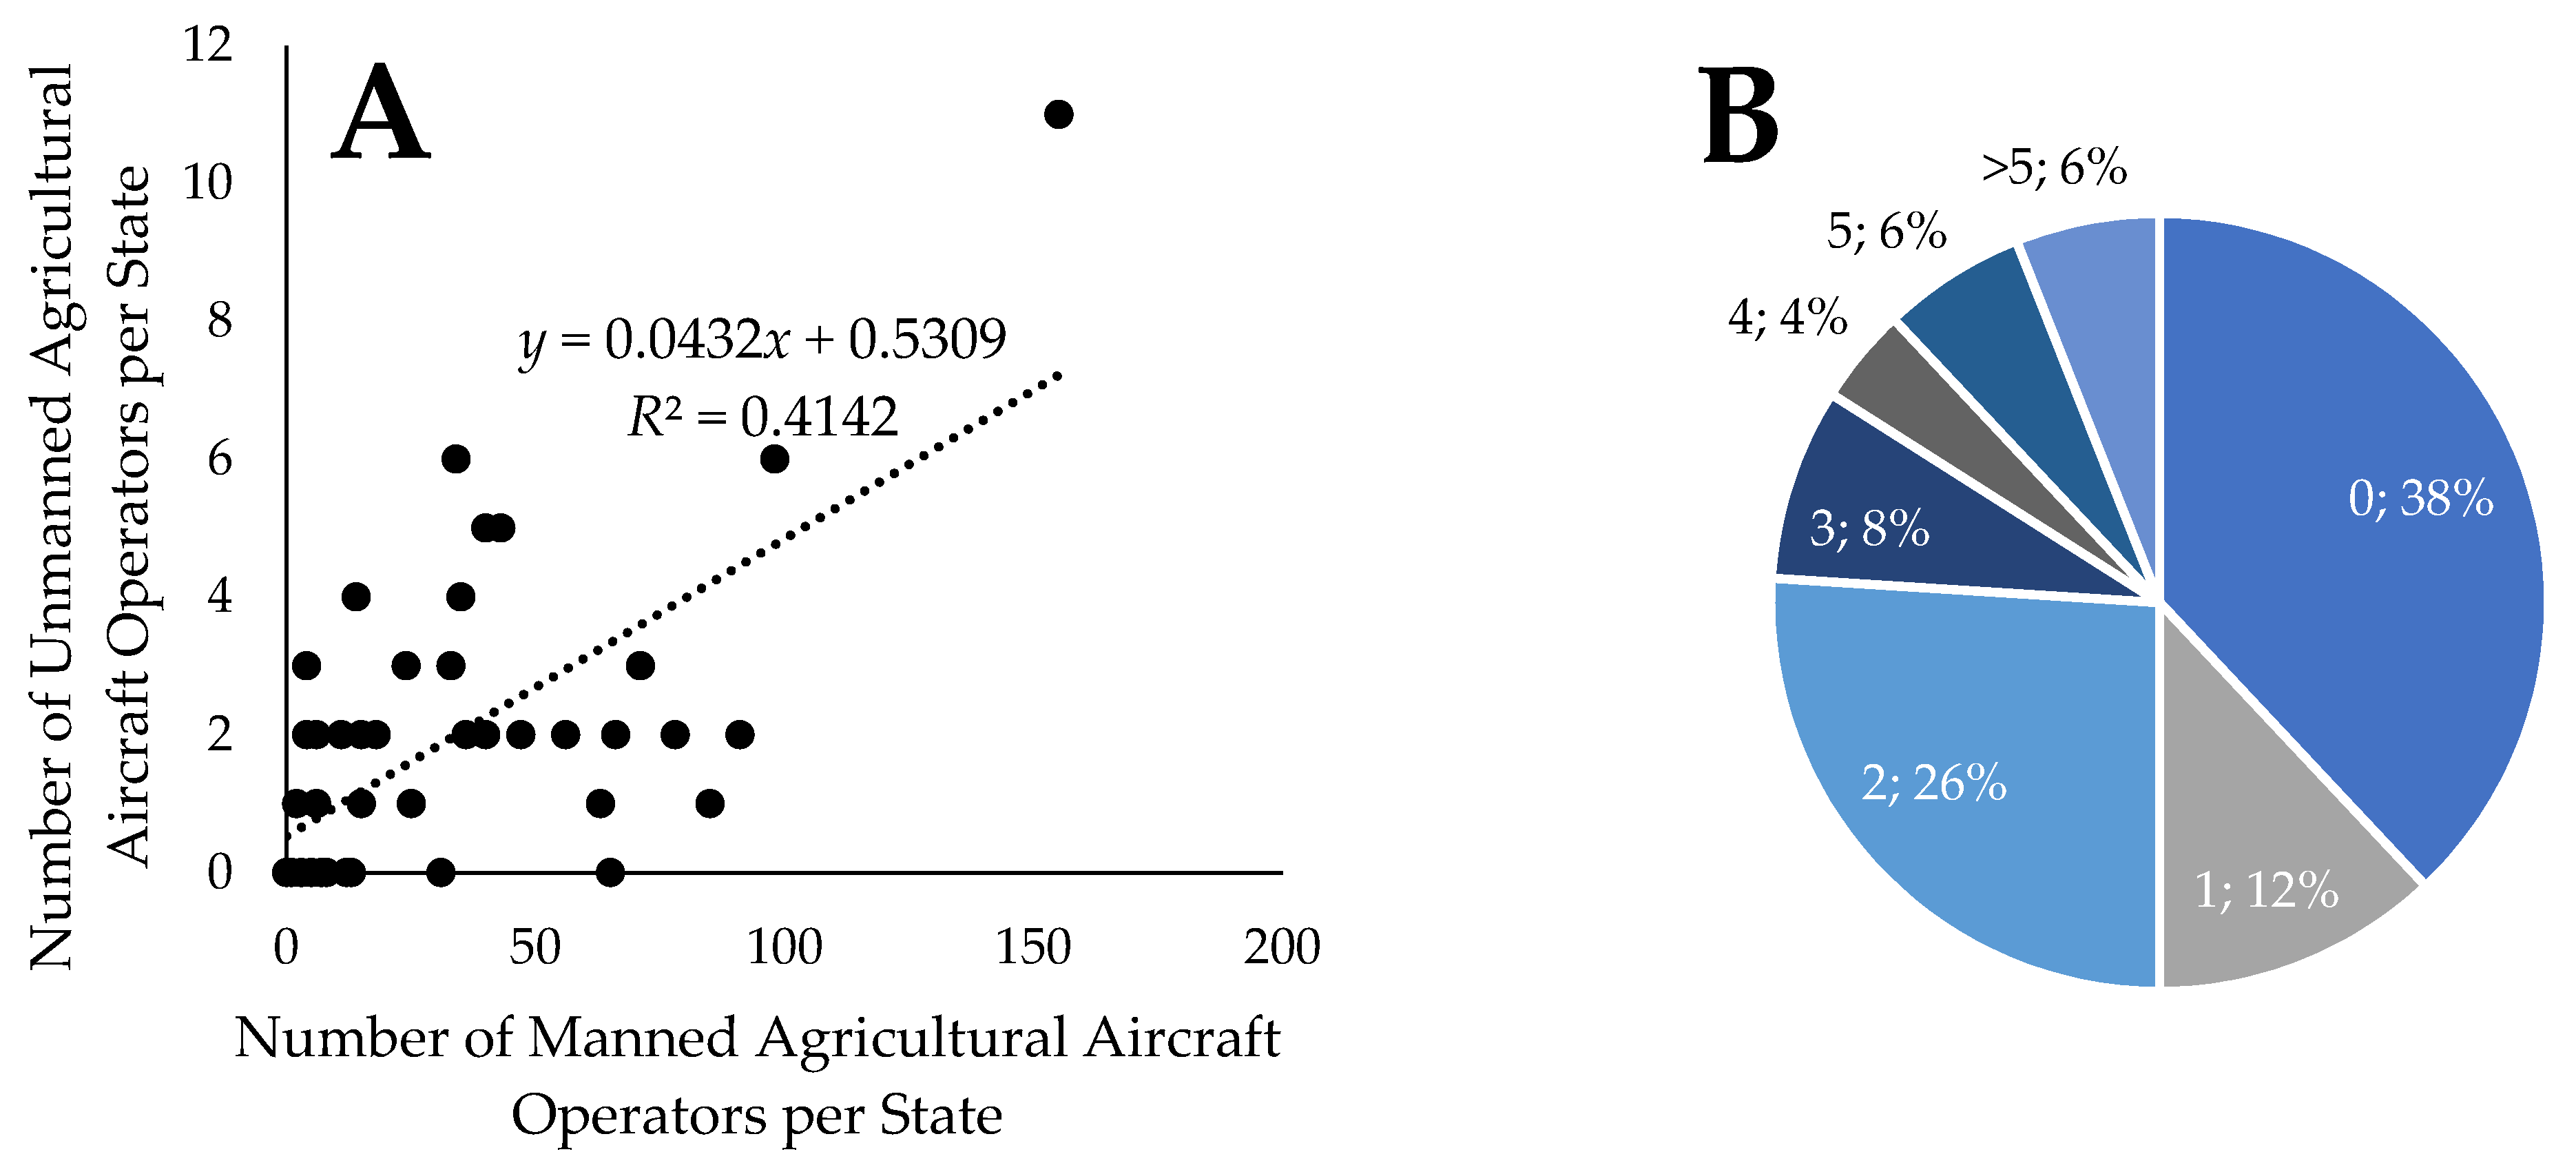
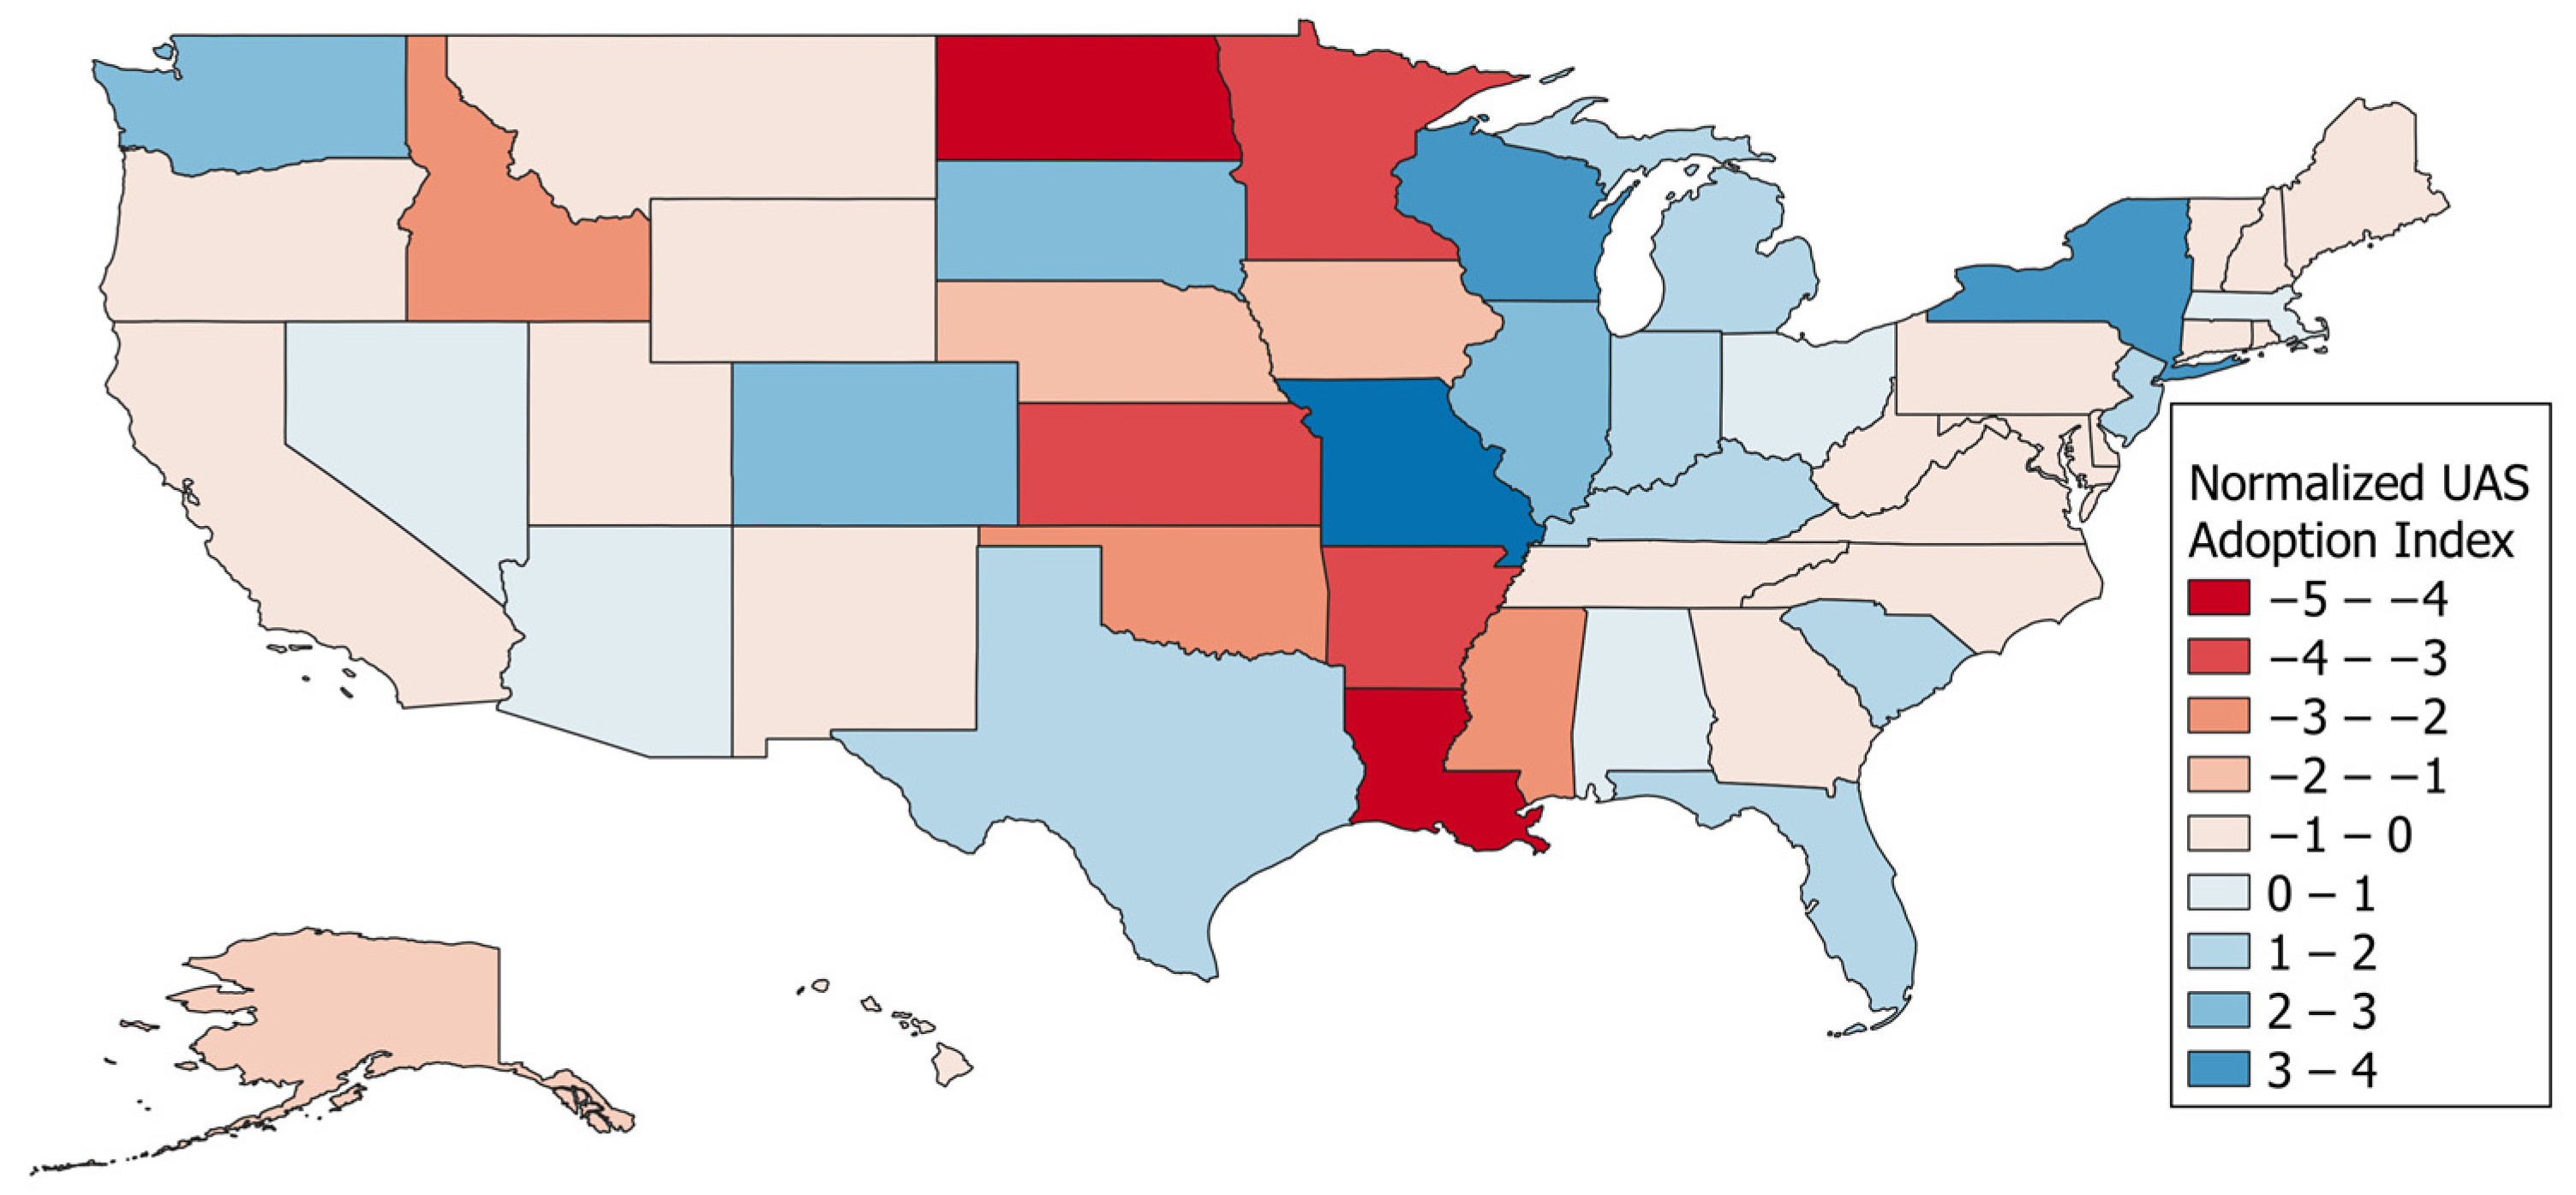
The ANOVA analysis showed that the number of farms in a state and the number of manned agricultural aircraft operators were both significant factors in determining the number of UAS agricultural aircraft operators (Table 1). On a state-by-state basis, the number of UAS agricultural aircraft operators is only weakly correlated with the number of manned agricultural aircraft operators (Figure 4A). This indicates that UAS are not simply replacing a portion of the existing aerial application market. Over a third of states do not have a UAS agricultural aircraft operator, and yet half have two or more, which indicates a regional bias (Figure 4B). The primary factor in this regional bias is the number of farms in a particular state. The normalized UAS adoption index (Figure 5) further illustrates this regional bias with states with relatively high adoption indices concentrated together. A positive index value indicates that the rate of increase in the number of agricultural aircraft operators using UAS exceeds that of operators using only manned aircraft while a negative index value indicates the opposite.
4. Discussion
While the total number of agricultural aircraft operators utilizing UAS is relatively low compared to that of manned agricultural aircraft operators, the rapid increase in the annual rate of new agricultural aircraft operators using UAS, which has now overtaken the rate of new manned agricultural aircraft operators, provides a strong argument that the industry has finally started taking these new tools seriously. This also has ramifications for the FAA as the agency must now account for double the amount of new Part 137 applicants, with roughly half being potential UAS agricultural aircraft operators. The relatively high number of states without an agricultural aircraft operator with UAS also impacts local Flight Standards Districts Offices (FSDO), with many having no experience with these new aircraft, which will lead to difficulties performing oversight and inspections of these new agricultural aircraft operators.
Based on the individual state analysis, there is still some regional bias to operators, as has been previously noted [6]. In particular, western and eastern states have higher UAS adoption rates while central states have significantly lower UAS adoption rates. The primary determining factor is the number of farms in a particular state, with the number of manned agricultural aircraft operators having a smaller effect size. Additional regional variability may be due to the types of crops in these areas and continuing regulatory barriers. Manufacturers may use this information when considering customer service locations, e.g., for repairs of UAS.
The normalized UAS adoption index as a metric was able to capture this regional bias. To analyze individual factors such as regulation and crops, alternative geographic boundaries could be used in place of state boundaries, such as Flight Standards Districts. The normalized UAS adoption index could be further applied within the United States to analyze other types of operator, such as Part 135 air carrier operators, or applied on a global scale to analyze the adoption across different nations in order to understand how variations in regulations have helped or hurt the adoption of UAS.
The limitations of this study include the use of the headquarters’ location listed on the certificate and the lack of applied area data in the calculation of adoption rates. The service area of an agricultural aircraft operator can extend beyond the state that the base of operations is located in. In particular, adjacent states typically accept the pesticide applicator license based on reciprocity. Due to the limited payload capacity of UAS, the applied area per flight is typically much lower than that of manned aircraft. This would result in a bias in area calculations, as manned aircraft are currently a more economical alternative to UAS.
5. Conclusions
Based on aggregate numbers of operators in the USA, UAS still have a long way to go in comparison to manned agricultural aircraft operators in agricultural operations, with only 5% of agricultural aircraft operators using UAS. However, in terms of new operators being added to the sector, UAS are now leading the charge. The normalized UAS adoption index, a proposed metric to evaluate the introduction of UAS into a sector, applied on a state-by-state basis, indicates a strong regional bias in the distribution of these operators. This index may be applied to other operator types and other geographic boundaries to determine factors that may be impacting UAS utilization.
Funding
This research received no external funding.
Institutional Review Board Statement
Not applicable.
Informed Consent Statement
Not applicable.
Data Availability Statement
All underlying data is made publicly available at https://av-info.faa.gov/dd_sublevel.asp?Folder=\AIROPERATORS (accessed on 24 November 2022).
Conflicts of Interest
The author declares no conflict of interest.
References
- Wargo, C.; Snipes, C.; Roy, A.; Kerczewski, R. UAS Industry Growth: Forecasting Impact on Regional Infrastructure, Environment, and Economy. In Proceedings of the 2016 IEEE/AIAA 35th Digital Avionics Systems Conference (DASC), Sacramento, CA, USA, 25–29 September 2016; pp. 1–5. [Google Scholar]
- Doering, C. Growing Use of Drones Poised to Transform Agriculture. USA Today 2014, 23. [Google Scholar]
- AUVSI. The Economic Impact of Unmanned Aircraft Systems Integration in the United States; Association for Unmanned Vehicle Systems International (AUVSI) Economic Report; AUVSI: Denver, CO, USA, 2013. [Google Scholar]
- Hunt, E.R.; Daughtry, C.S.T. What Good Are Unmanned Aircraft Systems for Agricultural Remote Sensing and Precision Agriculture? Int. J. Remote Sens. 2018, 39, 5345–5376. [Google Scholar] [CrossRef] [Green Version]
- Freeman, P.K.; Freeland, R.S. Agricultural UAVs in the U.S.: Potential, Policy, and Hype. Remote Sens. Appl. Soc. Environ. 2015, 2, 35–43. [Google Scholar] [CrossRef]
- Rodriguez, R. Perspective: Agricultural Aerial Application with Unmanned Aircraft Systems: Current Regulatory Framework and Analysis of Operators in the United States. Trans. ASABE 2021, 64, 1475–1481. [Google Scholar] [CrossRef]
- Lowenberg-DeBoer, J.; Behrendt, K.; Ehlers, M.-H.; Dillon, C.; Gabriel, A.; Huang, I.Y.; Kumwenda, I.; Mark, T.; Meyer-Aurich, A.; Milics, G.; et al. Lessons to Be Learned in Adoption of Autonomous Equipment for Field Crops. Appl. Econ. Perspect. Policy 2022, 44, 848–864. [Google Scholar] [CrossRef]
- Reger, M.; Bauerdick, J.; Bernhardt, H. Drones in Agriculture: Current and Future Legal Status in Germany, the EU, the USA and Japan. Landtechnik 2018, 73, 62–80. [Google Scholar]
- Srivastava, S.; Gupta, S.; Dikshit, O.; Nair, S. A Review of UAV Regulations and Policies in India. In Proceedings of the UASG 2019, Roorkee, India, 6–7 April 2019; Jain, K., Khoshelham, K., Zhu, X., Tiwari, A., Eds.; Springer International Publishing: Cham, Switzerland, 2020; pp. 315–325. [Google Scholar]
- Ayamga, M.; Tekinerdogan, B.; Kassahun, A. Exploring the Challenges Posed by Regulations for the Use of Drones in Agriculture in the African Context. Land 2021, 10, 164. [Google Scholar] [CrossRef]
- Sheets, K.D. The Japanese Impact on Global Drone Policy and Law: Why a Laggard United States and Other Nations Should Look to Japan in the Context of Drone Usage. Ind. J. Glob. Legal Stud. 2018, 25, 513. [Google Scholar] [CrossRef]
- Yang, S.; Yang, X.; Mo, J. The Application of Unmanned Aircraft Systems to Plant Protection in China. Precis. Agric. 2018, 19, 278–292. [Google Scholar] [CrossRef]
- Xiongkui, H.; Bonds, J.; Herbst, A.; Langenakens, J. Recent Development of Unmanned Aerial Vehicle for Plant Protection in East Asia. Int. J. Agric. Biol. Eng. 2017, 10, 18–30. [Google Scholar]
- Wang, G.; Lan, Y.; Qi, H.; Chen, P.; Hewitt, A.; Han, Y. Field Evaluation of an Unmanned Aerial Vehicle (UAV) Sprayer: Effect of Spray Volume on Deposition and the Control of Pests and Disease in Wheat. Pest Manag. Sci. 2019, 75, 1546–1555. [Google Scholar] [CrossRef]
- Woldt, W.; Martin, D.; Lahteef, M.; Kruger, G.; Wright, R.; McMechan, J.; Proctor, C.; Jackson-Ziems, T. Field Evaluation of Commercially Available Small Unmanned Aircraft Crop Spray Systems. In Proceedings of the 2018 ASABE Annual International Meeting, Dearborn, MI, USA, 31 July 2018; American Society of Agricultural and Biological Engineers: St. Joseph, MI, USA, 2018; p. 1. [Google Scholar]
- Martin, D.E.; Rodriguez, R.; Woller, D.A.; Reuter, K.C.; Black, L.R.; Latheef, M.A.; Taylor, M.; López Colón, K.M. Insecticidal Management of Rangeland Grasshoppers Using a Remotely Piloted Aerial Application System. Drones 2022, 6, 239. [Google Scholar] [CrossRef]
- Chen, H.; Lan, Y.; Fritz, B.K.; Hoffmann, W.C.; Liu, S. Review of Agricultural Spraying Technologies for Plant Protection Using Unmanned Aerial Vehicle (UAV). Int. J. Agric. Biol. Eng. 2021, 14, 38–49. [Google Scholar] [CrossRef]
- Mulero-Pázmány, M.; Martínez-de Dios, J.R.; Popa-Lisseanu, A.G.; Gray, R.J.; Alarcón, F.; Sánchez-Bedoya, C.A.; Viguria, A.; Ibáñez, C.; Negro, J.J.; Ollero, A.; et al. Development of a Fixed-Wing Drone System for Aerial Insect Sampling. Drones 2022, 6, 189. [Google Scholar] [CrossRef]
- Kakutani, K.; Matsuda, Y.; Nonomura, T.; Takikawa, Y.; Osamura, K.; Toyoda, H. Remote-Controlled Monitoring of Flying Pests with an Electrostatic Insect Capturing Apparatus Carried by an Unmanned Aerial Vehicle. Agriculture 2021, 11, 176. [Google Scholar] [CrossRef]
- Rodriguez III, R.; Leary, J.J.K.; Jenkins, D.M. Herbicide Ballistic Technology for Unmanned Aircraft Systems. Robotics 2022, 11, 22. [Google Scholar] [CrossRef]
- Lawrence, B.; Mundorff, K.; Keith, E. The Impact of UAS Aerial Ignition on Prescribed Fire: A Case Study in Multiple Ecoregions of Texas and Louisiana. Fire Ecol. 2022, 19, 11. [Google Scholar] [CrossRef]
- Perroy, R.L.; Meier, P.; Collier, E.; Hughes, M.A.; Brill, E.; Sullivan, T.; Baur, T.; Buchmann, N.; Keith, L.M. Aerial Branch Sampling to Detect Forest Pathogens. Drones 2022, 6, 275. [Google Scholar] [CrossRef]
- Krisanski, S.; Taskhiri, M.S.; Montgomery, J.; Turner, P. Design and Testing of a Novel Unoccupied Aircraft System for the Collection of Forest Canopy Samples. Forests 2022, 13, 153. [Google Scholar] [CrossRef]
- Charron, G.; Robichaud-Courteau, T.; La Vigne, H.; Weintraub, S.; Hill, A.; Justice, D.; Bélanger, N.; Lussier Desbiens, A. The DeLeaves: A UAV Device for Efficient Tree Canopy Sampling. J. Unmanned Veh. Syst. 2020, 8, 245–264. [Google Scholar] [CrossRef]
- Li, X.; Huang, H.; Savkin, A.V.; Zhang, J. Robotic Herding of Farm Animals Using a Network of Barking Aerial Drones. Drones 2022, 6, 29. [Google Scholar] [CrossRef]
- Singh, A.P.; Yerudkar, A.; Mariani, V.; Iannelli, L.; Glielmo, L. A Bibliometric Review of the Use of Unmanned Aerial Vehicles in Precision Agriculture and Precision Viticulture for Sensing Applications. Remote Sens. 2022, 14, 1604. [Google Scholar] [CrossRef]
- Rejeb, A.; Abdollahi, A.; Rejeb, K.; Treiblmaier, H. Drones in Agriculture: A Review and Bibliometric Analysis. Comput. Electron. Agric. 2022, 198, 107017. [Google Scholar] [CrossRef]
- Raparelli, E.; Bajocco, S. A Bibliometric Analysis on the Use of Unmanned Aerial Vehicles in Agricultural and Forestry Studies. Int. J. Remote Sens. 2019, 40, 9070–9083. [Google Scholar] [CrossRef]
- Skare, M.; Riberio Soriano, D. How Globalization Is Changing Digital Technology Adoption: An International Perspective. J. Innov. Knowl. 2021, 6, 222–233. [Google Scholar] [CrossRef]
- Jain, R.; Arora, A.; Raju, S.S. A Novel Adoption Index of Selected Agricultural Technologies: Linkages with Infrastructure and Productivity. Agric. Econ. Res. Rev. 2009, 22, 109–120. [Google Scholar]
- FAA Data Downloads: Air Operators. Available online: av-info.gov/dd_sublevel.asp?Folder=\AIROPERATORS (accessed on 24 November 2022).
- National Agricultural Statistics Service. Farms and Land in Farms 2021 Summary; United States Department of Agriculture: Washington, DC, USA, 2022.
- R Core Team. R: A Language and Environment for Statistical Computing; R Core Team: Vienna, Austria, 2019. [Google Scholar]
- United States House of Representatives. FAA Modernization and Reform Act of 2012; United States House of Representatives: Washington, DC, USA, 2012.
- Federal Aviation Administration. Weak Processes Have Led to a Backlog of Flight Standards Certification Applications; Federal Aviation Administration: Washington, DC, USA, 2014.
Figure 1.
The total number of manned ((A), red) and unmanned ((B), blue) agricultural aircraft operators in the United States.
Figure 1.
The total number of manned ((A), red) and unmanned ((B), blue) agricultural aircraft operators in the United States.

Figure 2.
The annual increase in manned agricultural aircraft operators. The average annual increase is 29.3 (black dashed) with a 95% confidence interval of 25.8–32.7 (dashed grey).
Figure 2.
The annual increase in manned agricultural aircraft operators. The average annual increase is 29.3 (black dashed) with a 95% confidence interval of 25.8–32.7 (dashed grey).

Figure 3.
The annual increase in manned (red) and unmanned (blue) agricultural aircraft operators and the average annual increase in manned operators since 1967, with a 95% confidence interval.
Figure 3.
The annual increase in manned (red) and unmanned (blue) agricultural aircraft operators and the average annual increase in manned operators since 1967, with a 95% confidence interval.

Figure 4.
(A) Number of unmanned agricultural aircraft operators vs number of manned agricultural aircraft operators. (B) Number of unmanned agricultural aircraft operators by state.
Figure 4.
(A) Number of unmanned agricultural aircraft operators vs number of manned agricultural aircraft operators. (B) Number of unmanned agricultural aircraft operators by state.

Figure 5.
Normalized UAS adoption index across the United States indicates significant regional bias in the adoption of UAS for aerial application.
Figure 5.
Normalized UAS adoption index across the United States indicates significant regional bias in the adoption of UAS for aerial application.


Table 1.
Results of statistical analysis of factors affecting number of UAS agricultural aircraft operators. Only significant results, number of farms, and number of manned agricultural aircraft operators are shown.
Table 1.
Results of statistical analysis of factors affecting number of UAS agricultural aircraft operators. Only significant results, number of farms, and number of manned agricultural aircraft operators are shown.
| Variable | Sum of Squares | Degrees of Freedom | F | p | η2 |
|---|---|---|---|---|---|
| Number of Farms | 127.218 | 1 | 62.768 | <0.001 | 0.57 |
| Manned Agricultural Aircraft Operators | 9.521 | 1 | 4.698 | 0.03 | 0.09 |
| Residual | 95.26 | 47 |
Disclaimer/Publisher’s Note: The statements, opinions and data contained in all publications are solely those of the individual author(s) and contributor(s) and not of MDPI and/or the editor(s). MDPI and/or the editor(s) disclaim responsibility for any injury to people or property resulting from any ideas, methods, instructions or products referred to in the content. |
© 2023 by the author. Licensee MDPI, Basel, Switzerland. This article is an open access article distributed under the terms and conditions of the Creative Commons Attribution (CC BY) license (https://creativecommons.org/licenses/by/4.0/).
Share and Cite
MDPI and ACS Style
Rodriguez, R., III. Measuring the Adoption of Drones: A Case Study of the United States Agricultural Aircraft Sector. Eng 2023, 4, 977-983. https://doi.org/10.3390/eng4010058
AMA Style
Rodriguez R III. Measuring the Adoption of Drones: A Case Study of the United States Agricultural Aircraft Sector. Eng. 2023; 4(1):977-983. https://doi.org/10.3390/eng4010058
Chicago/Turabian StyleRodriguez, Roberto, III. 2023. "Measuring the Adoption of Drones: A Case Study of the United States Agricultural Aircraft Sector" Eng 4, no. 1: 977-983. https://doi.org/10.3390/eng4010058