
Stiffness Moduli Modelling and Prediction in Four-Point Bending of Asphalt Mixtures: A Machine Learning-Based Framework

 ,
,  , , , ,
  and
and 
Abstract
:1. Introduction
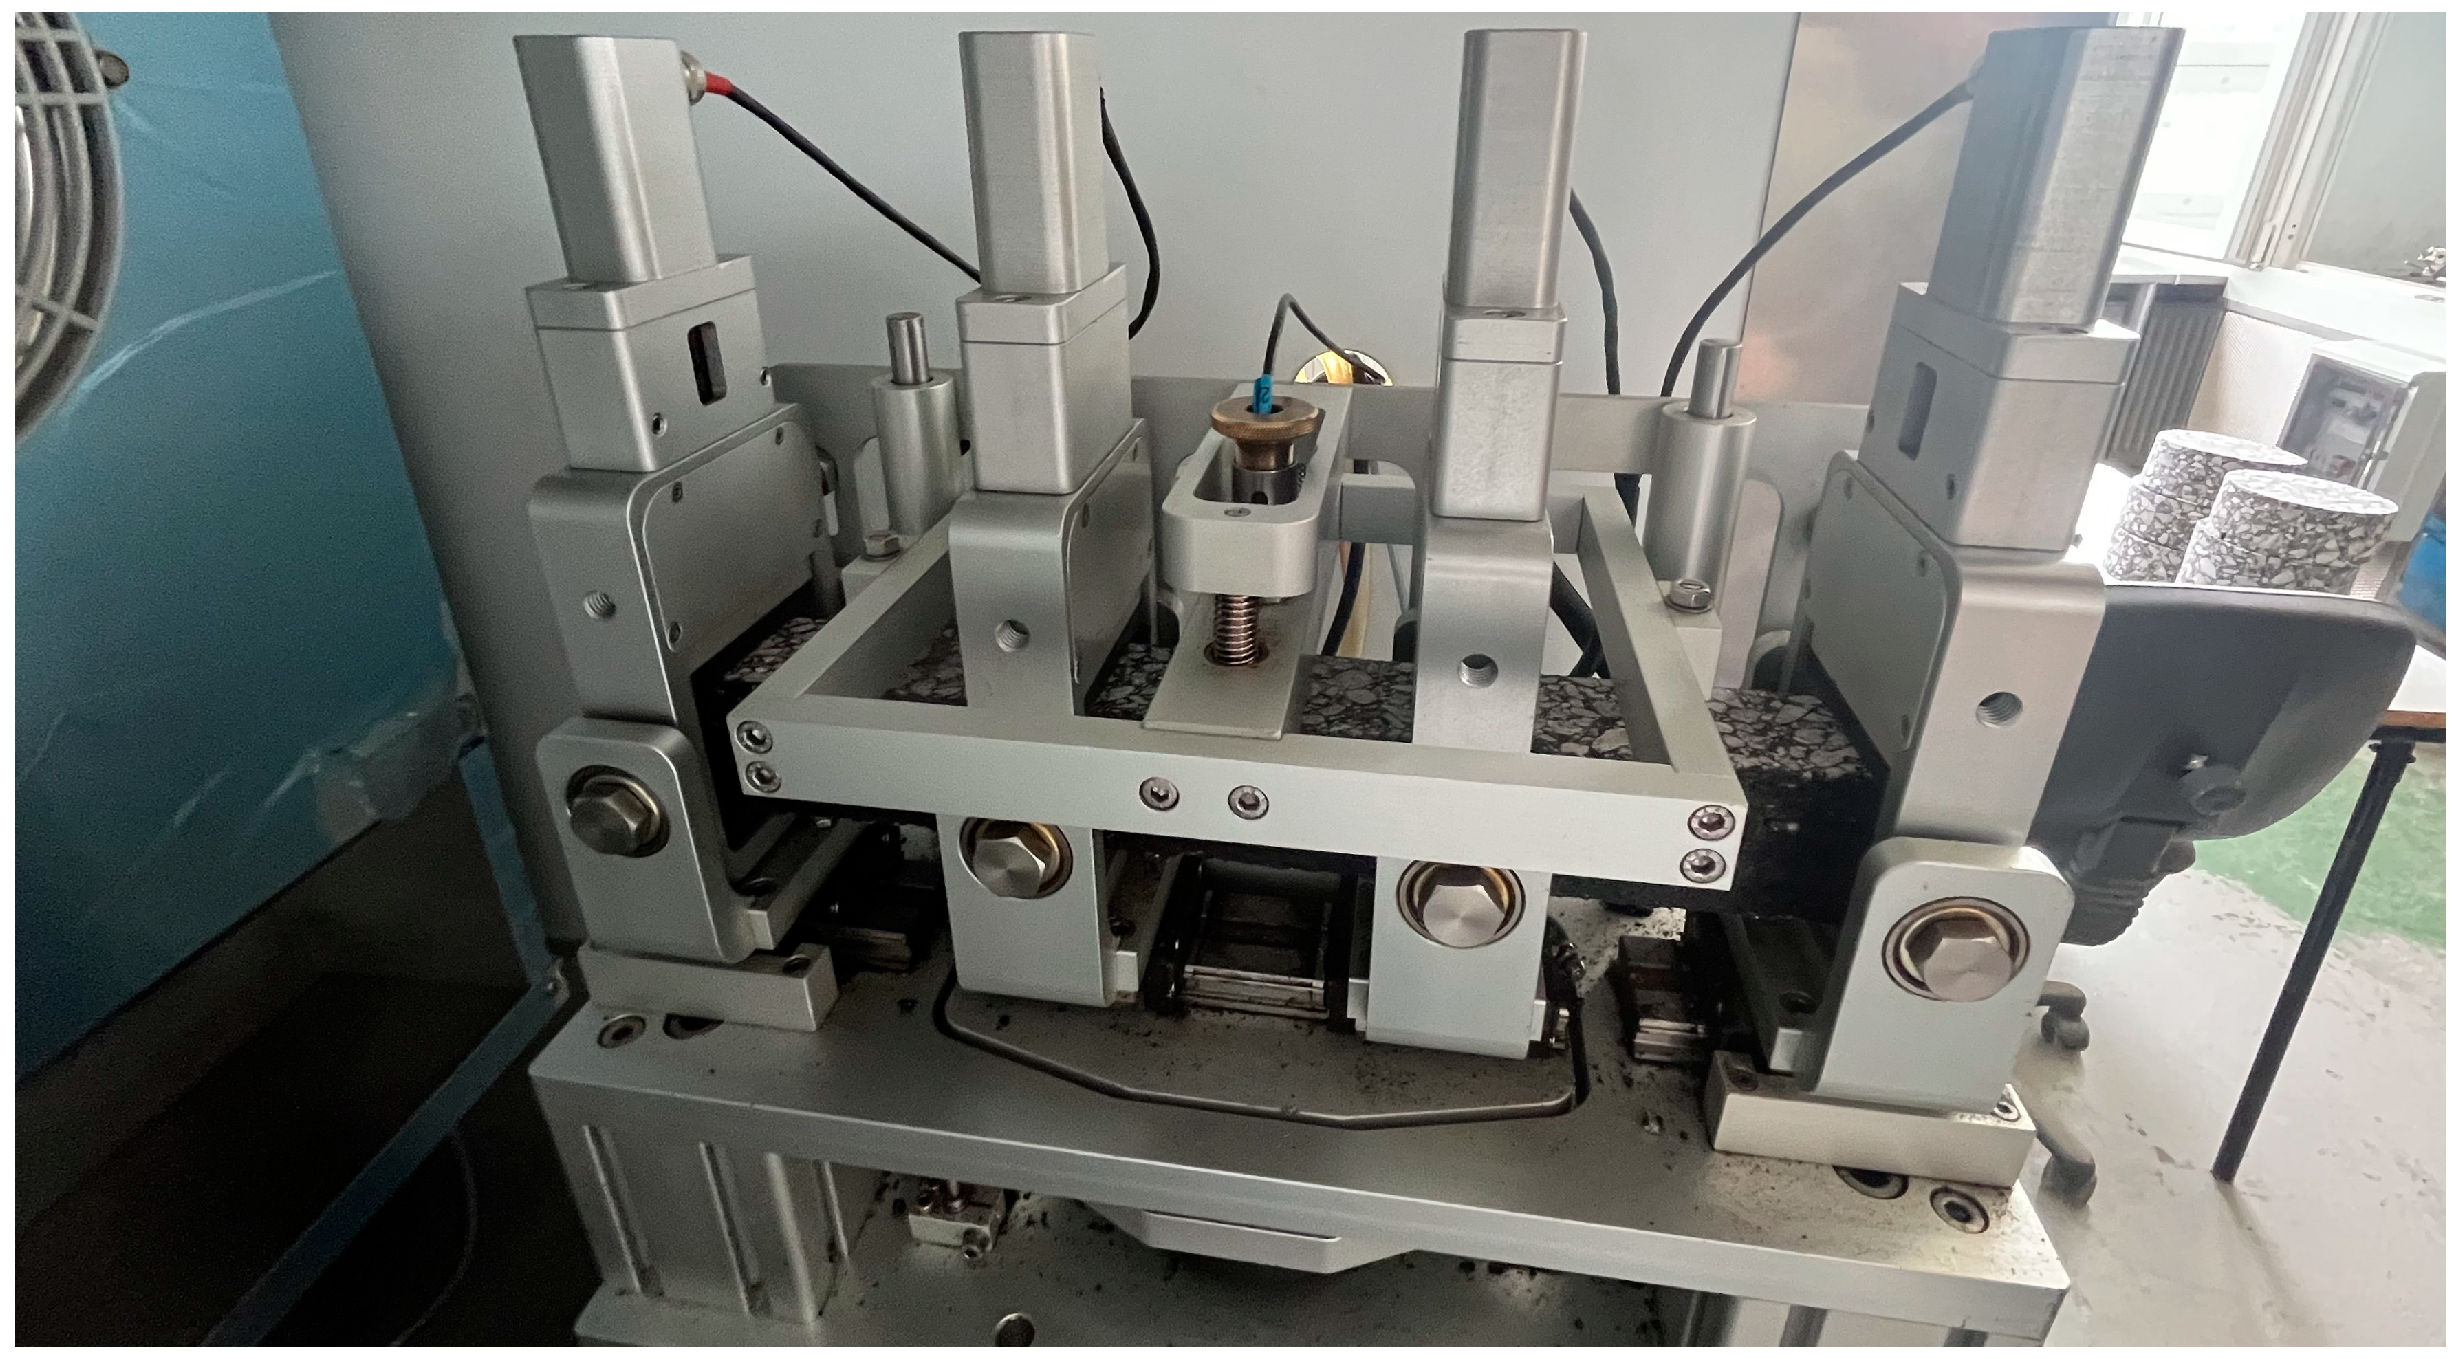
2. Materials and Methods
3. Machine Learning Framework
3.1. Categorical Boosting
3.2. Artificial Neural Network
3.3. Grid Search and k-Fold Cross-Validation
4. Results and Discussion
5. Conclusions
- Based on mixture composition and testing conditions, both the models were able to reliably predict the resulting stiffness modulus of each mixture, properly balancing accuracy and generalizability. This was ensured by the careful optimization of the hyperparameters of both models using three different algorithms, namely an extensive grid search, a five-fold cross-validation, and an overfitting detection.
- The optimal CatBoost model was characterized by a maximum tree depth of 3, a learning rate of 0.01, and a maximum number of training iterations of 5000. Conversely, the optimal ANN model involved the Adam solver, and its architecture was characterized by 38 hidden neurons, a ReLU activation function, and a maximum number of training iterations of 1000.
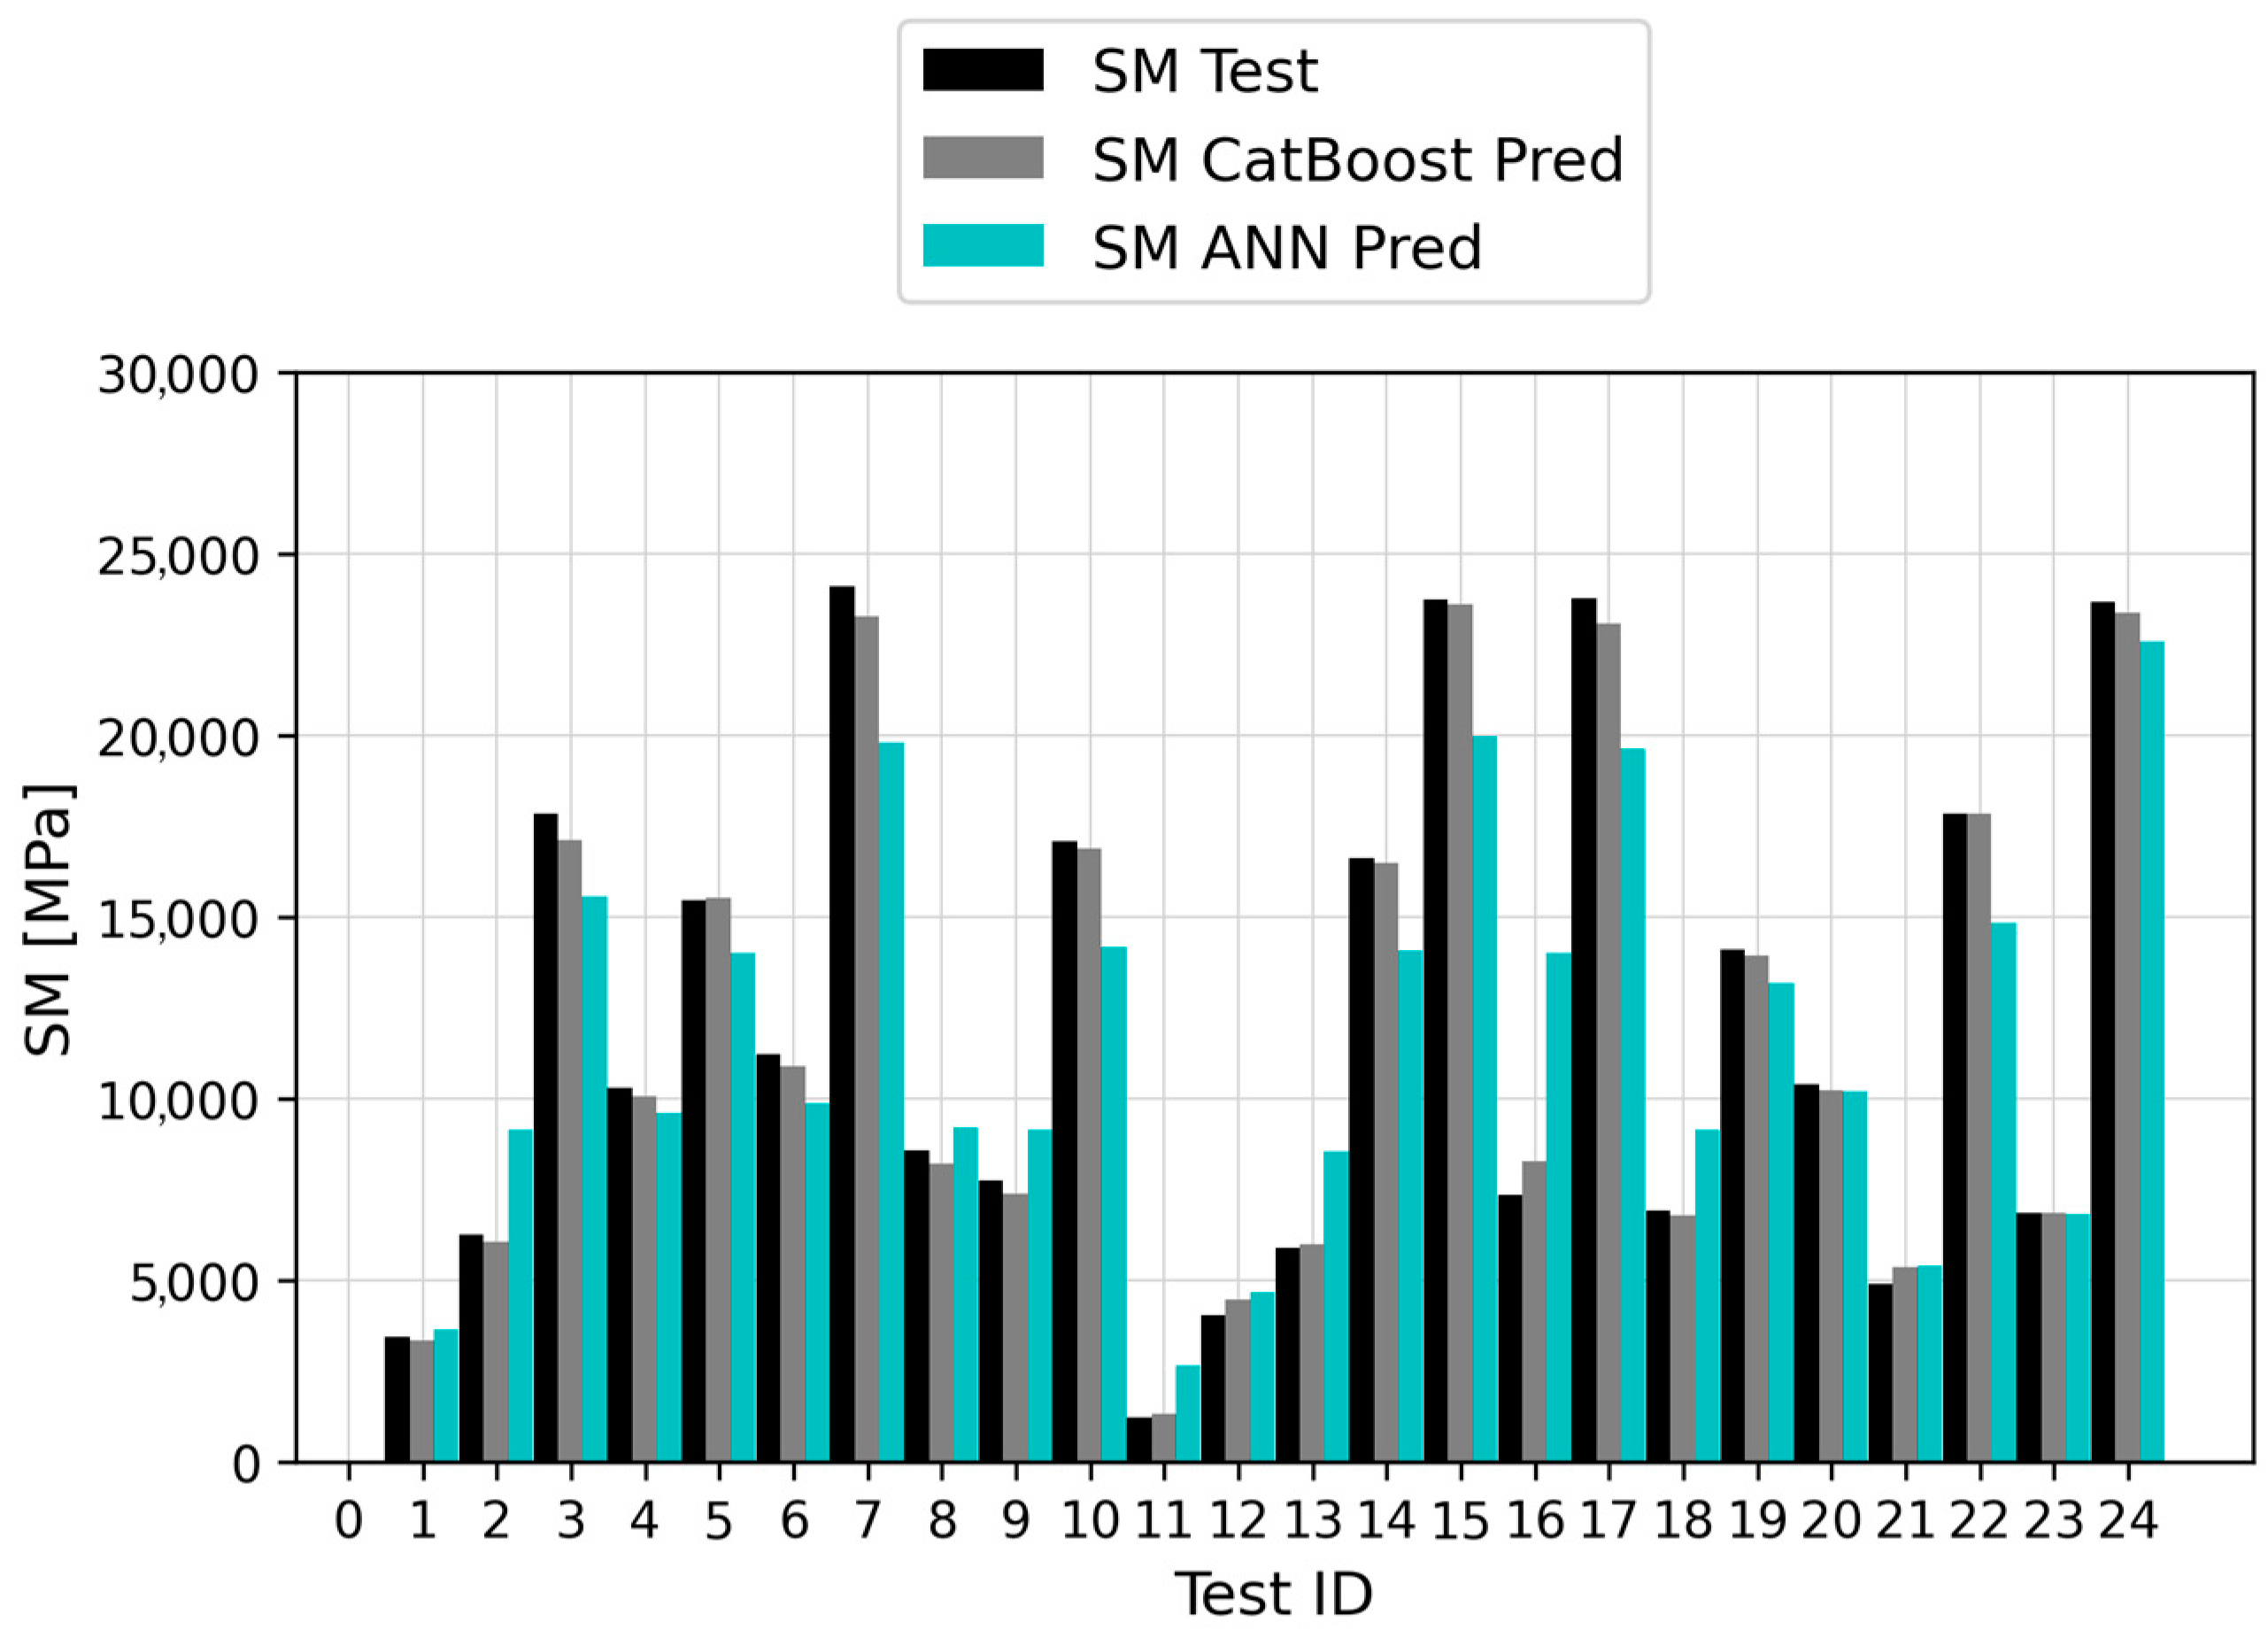
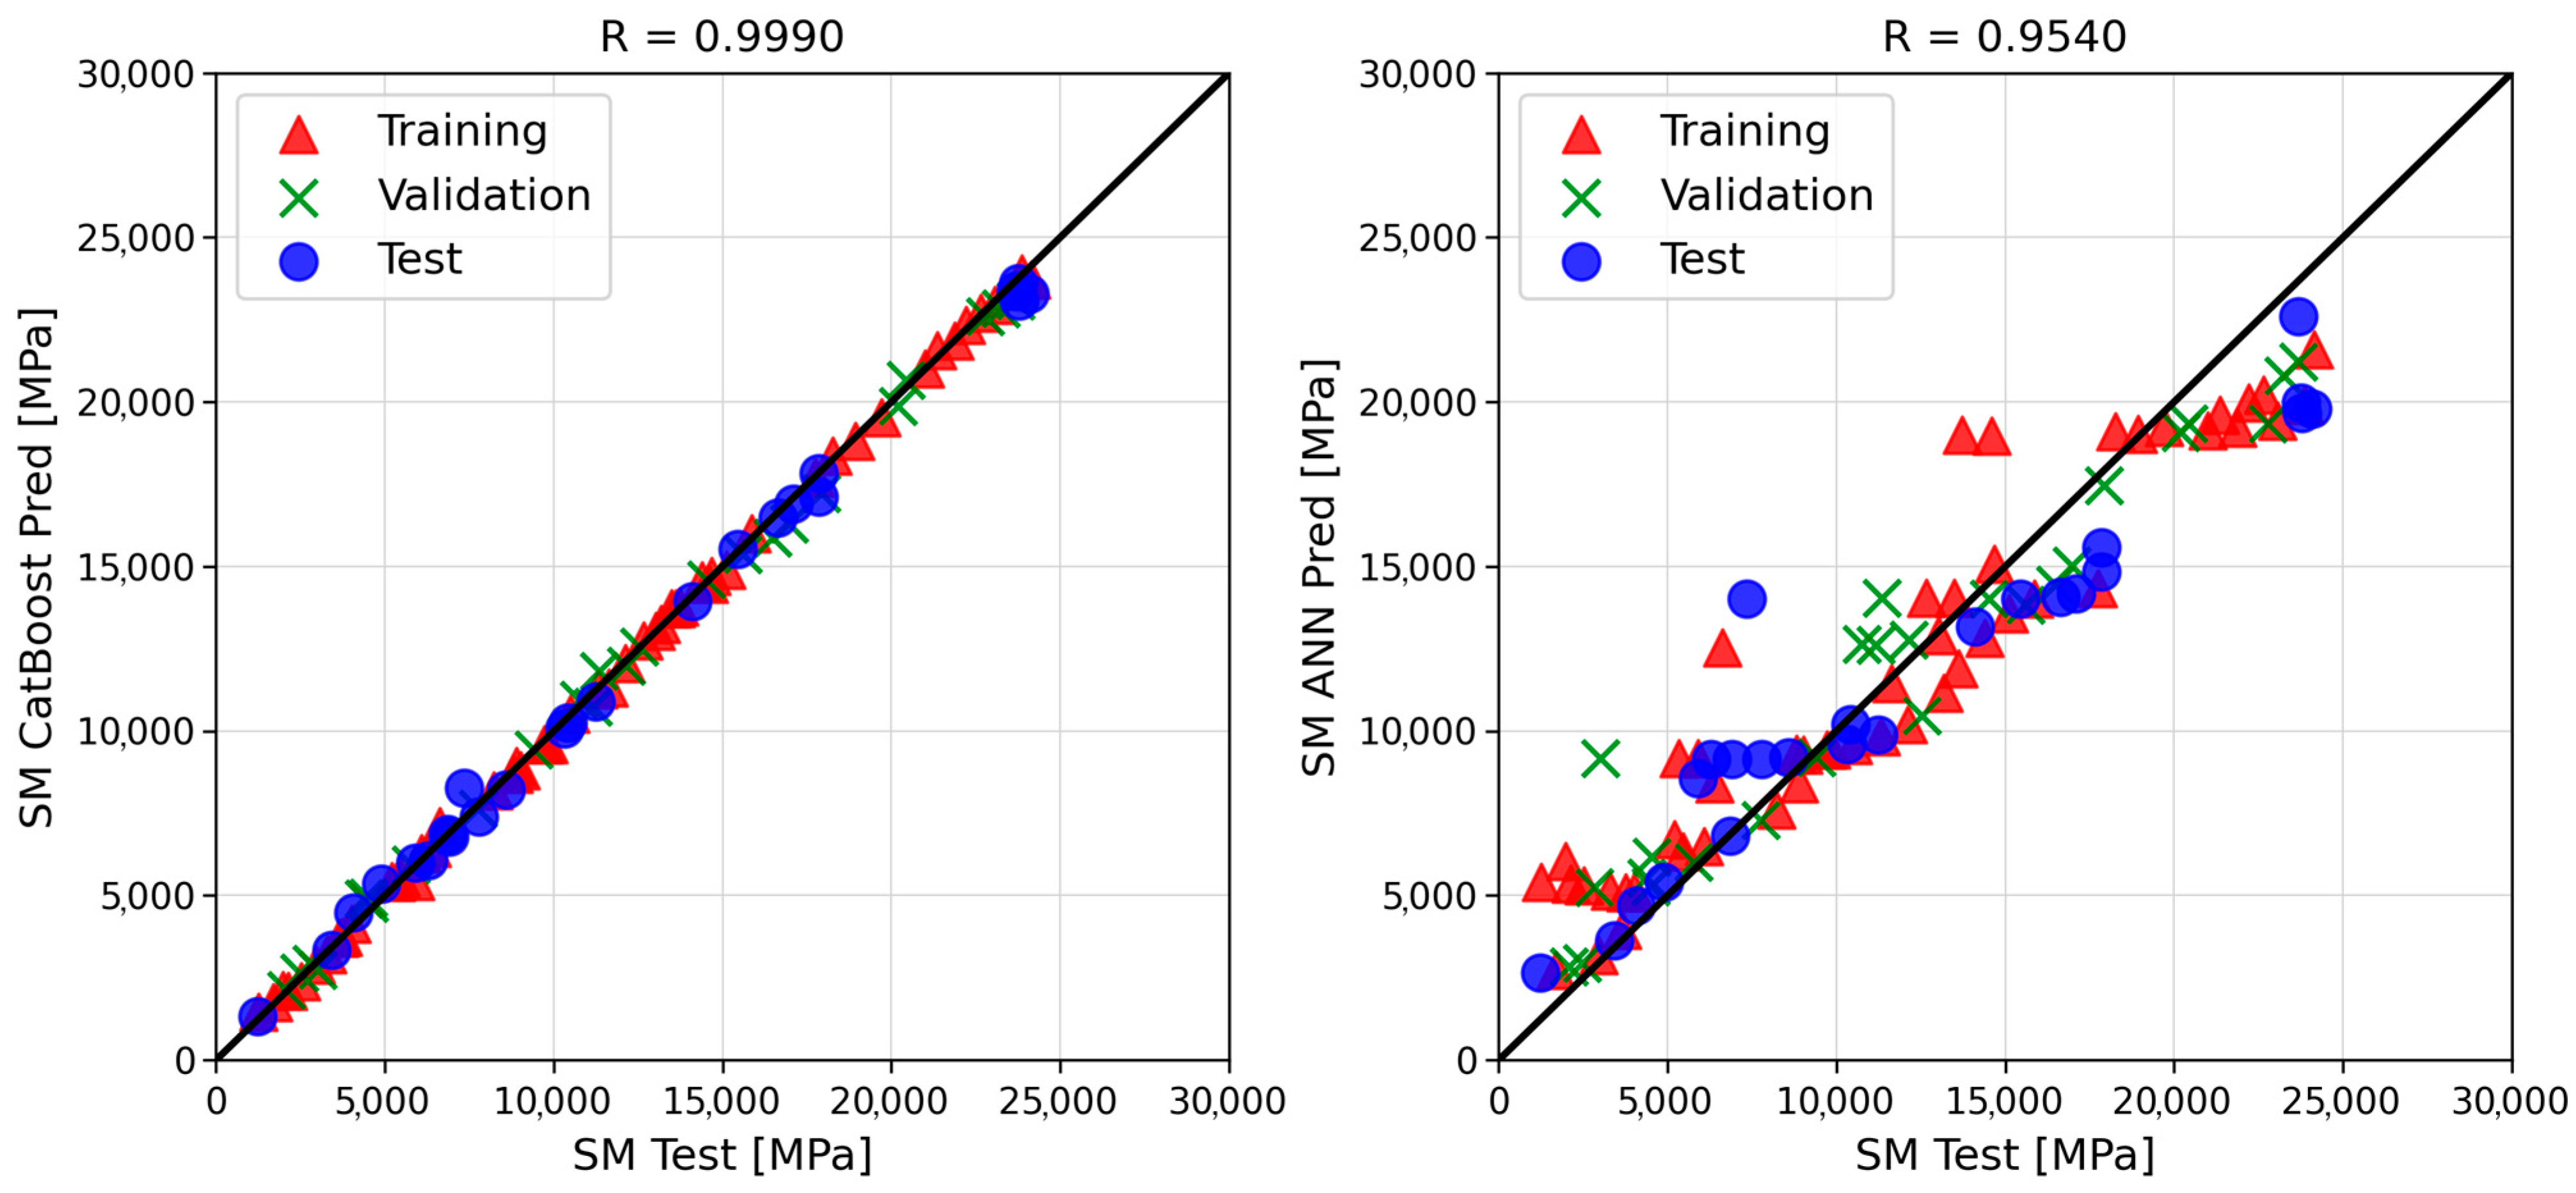
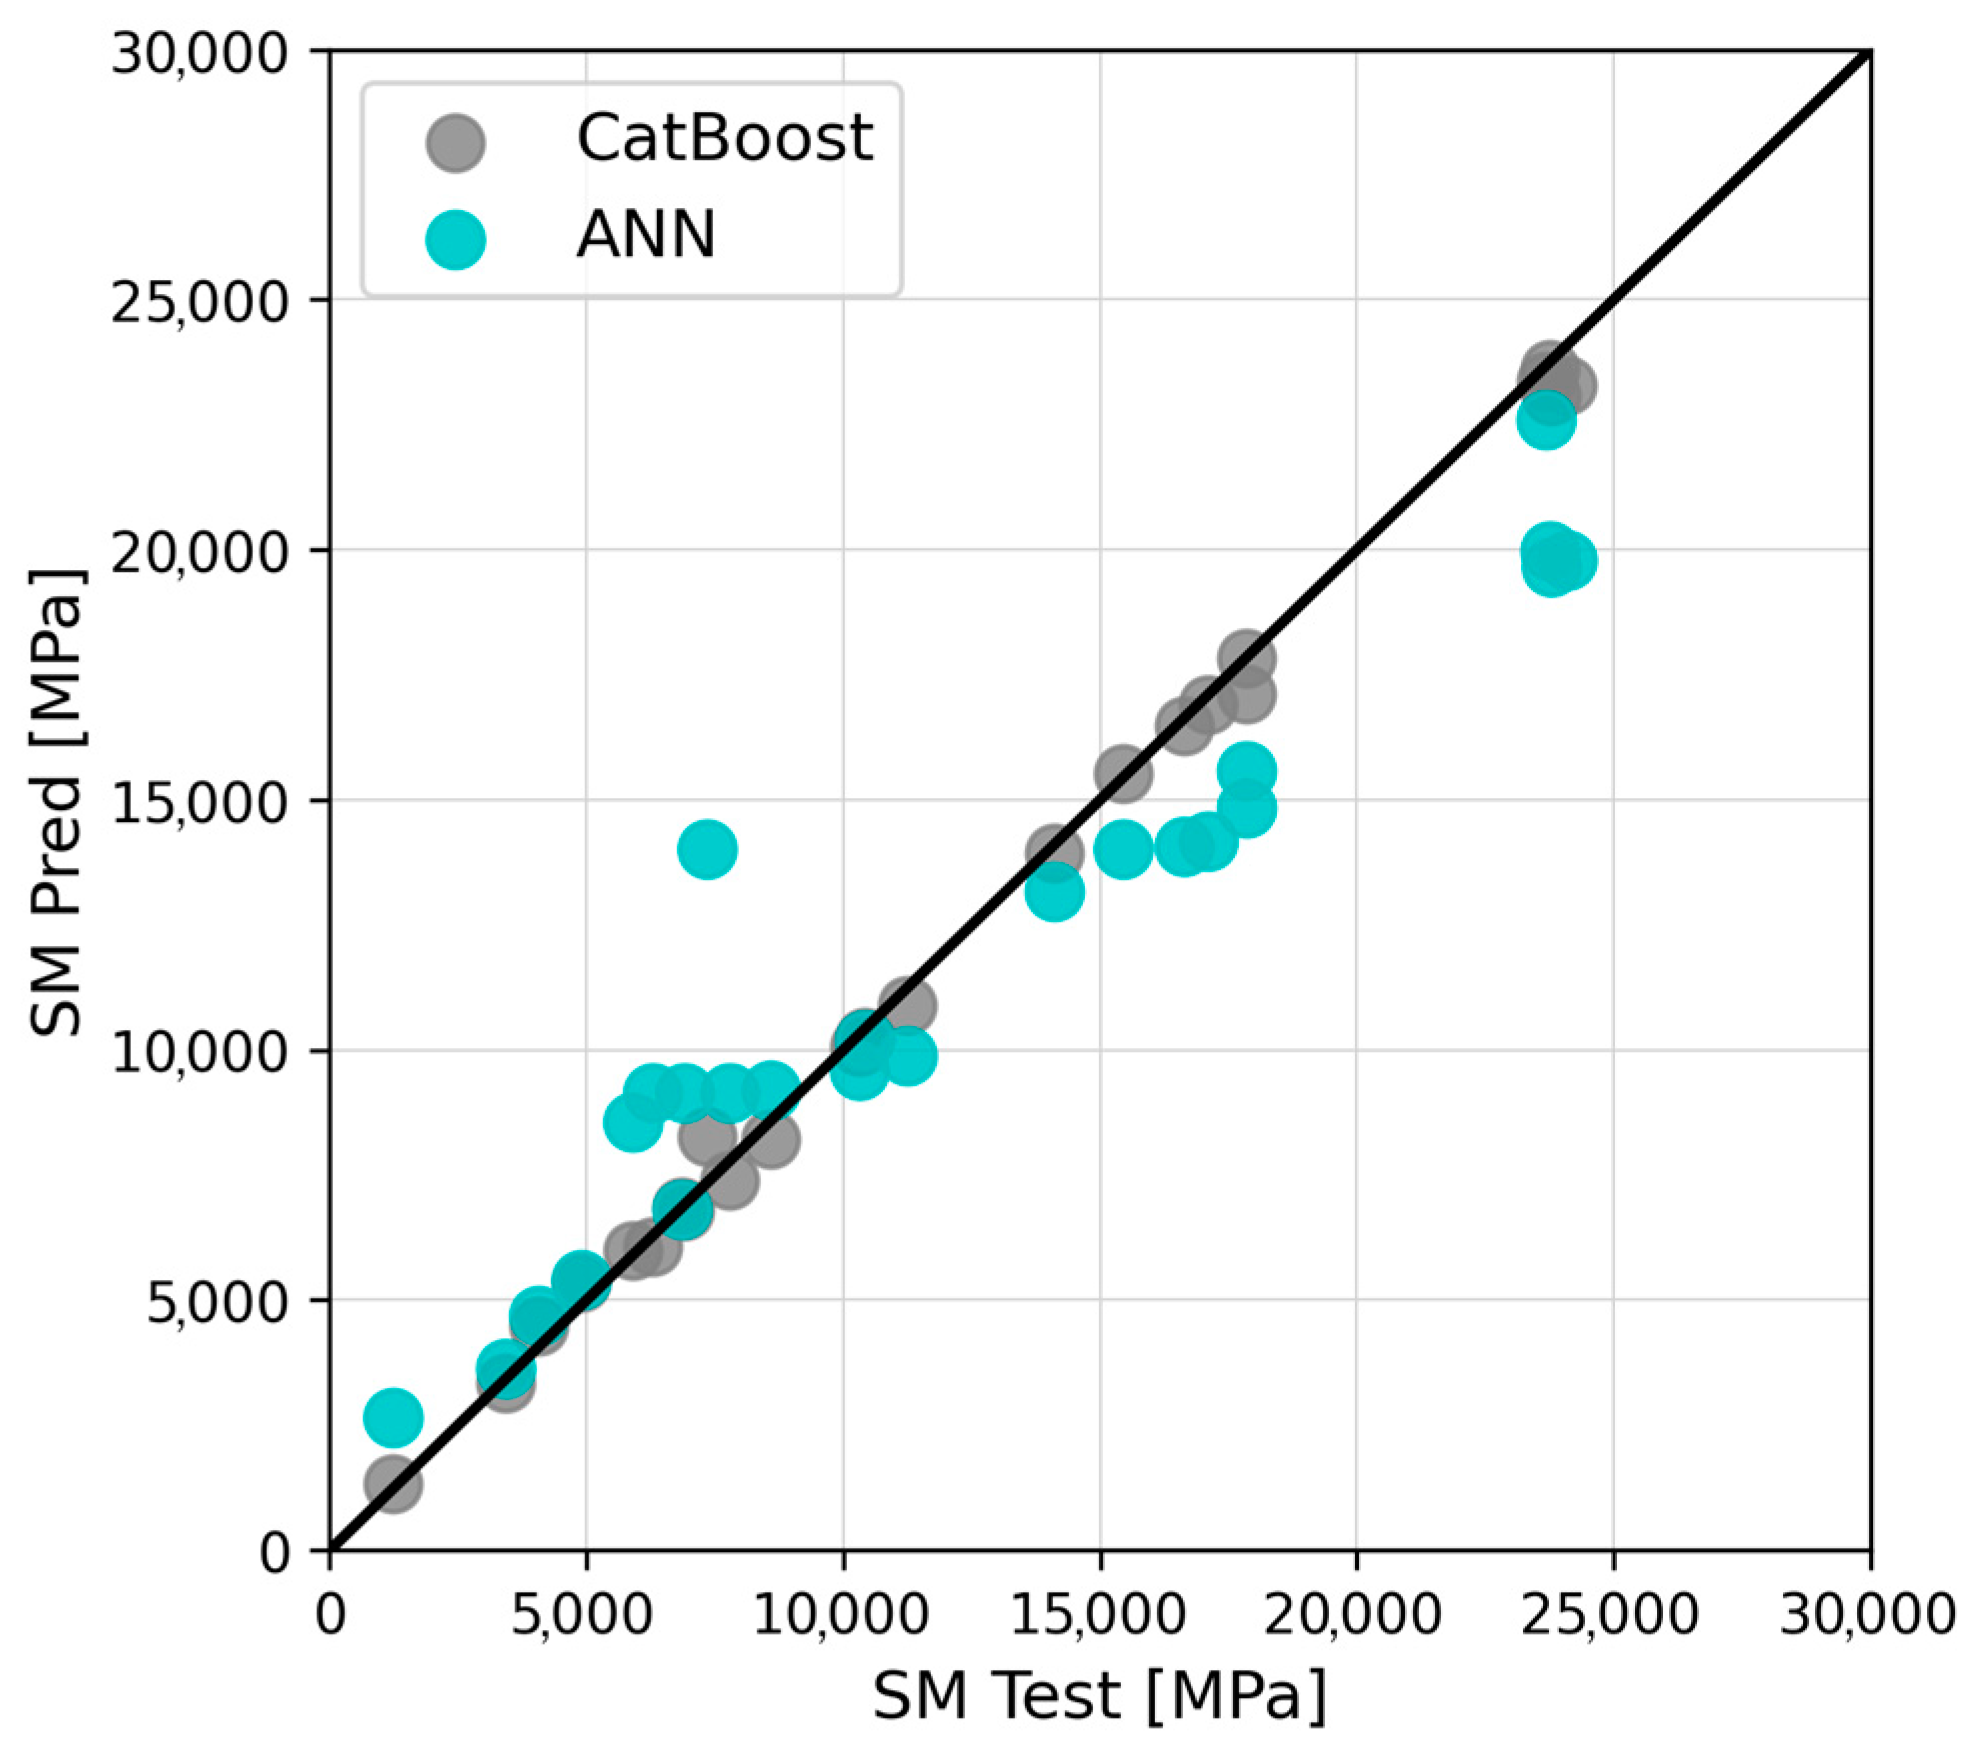
- Based on six goodness-of-fit metrics, CatBoost proved to be the most suitable algorithm to model the phenomena under investigation, outperforming the ANN. Its predictions were characterized by outstanding accuracy, expressed by MAE, MAPE, and R2 values equal to 300.49 MPa, 3.41%, and 0.9968, respectively. The corresponding ANN error metrics were roughly an order of magnitude higher, resulting in a comparatively lower prediction accuracy.
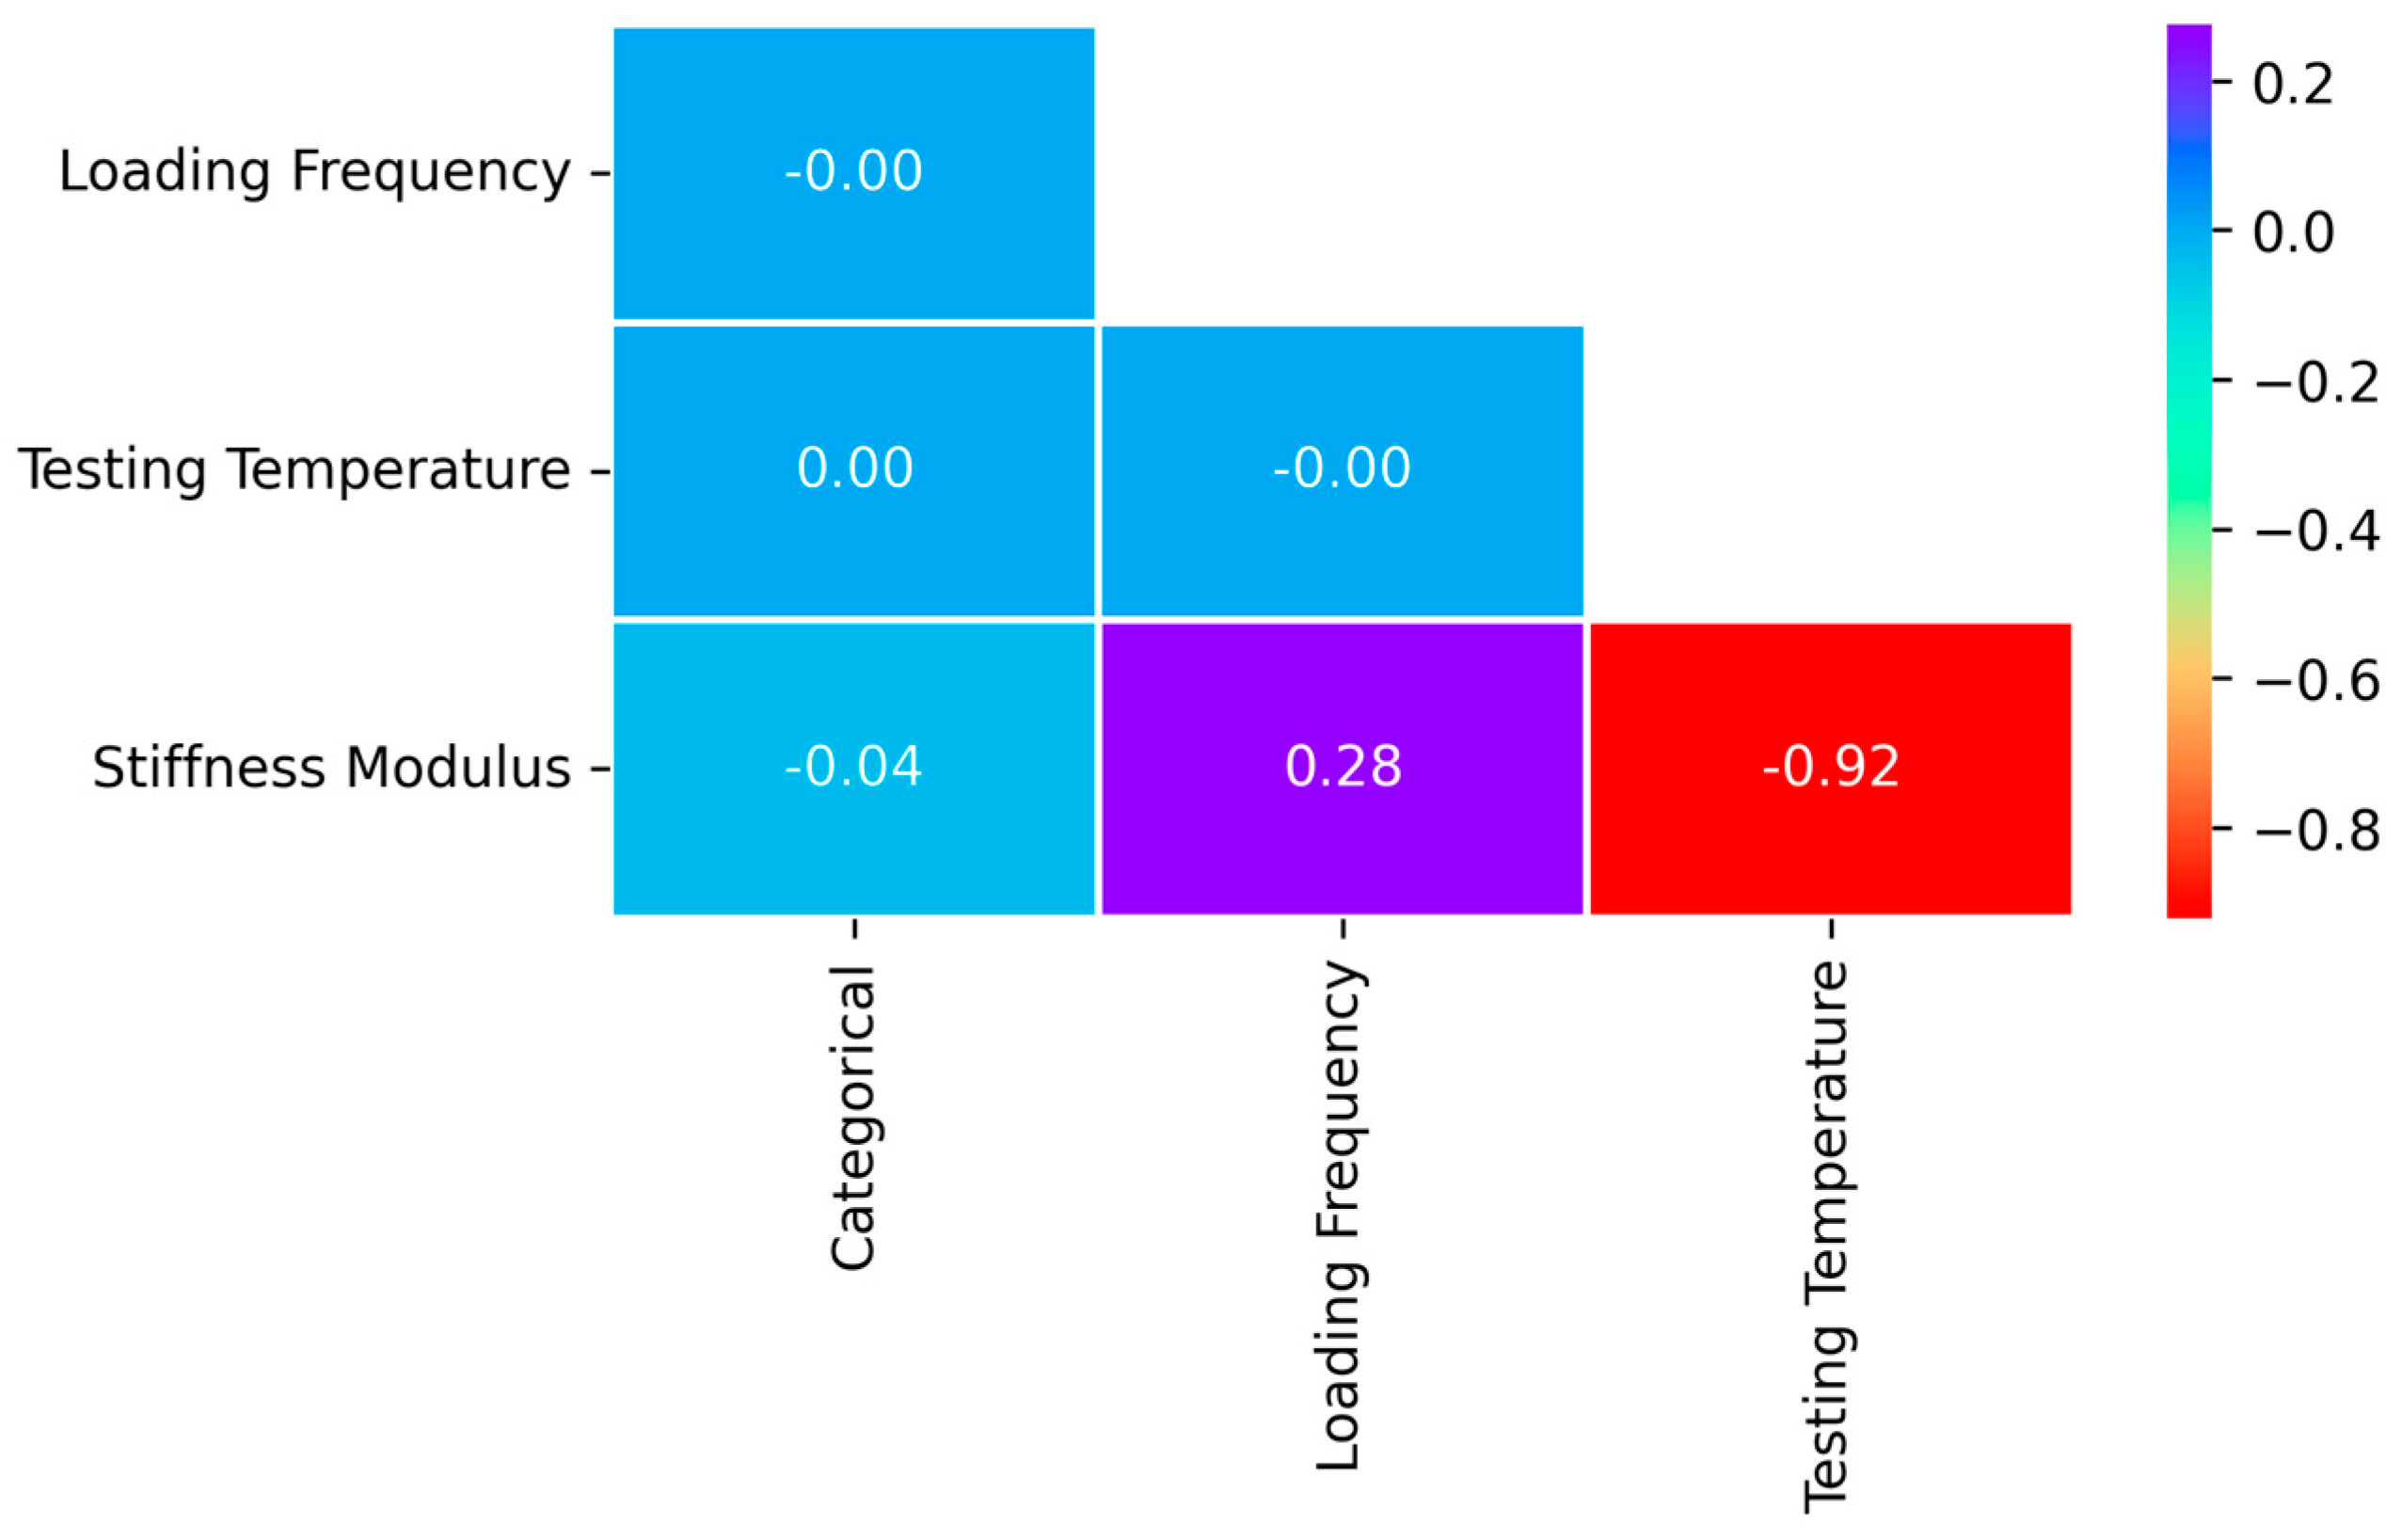
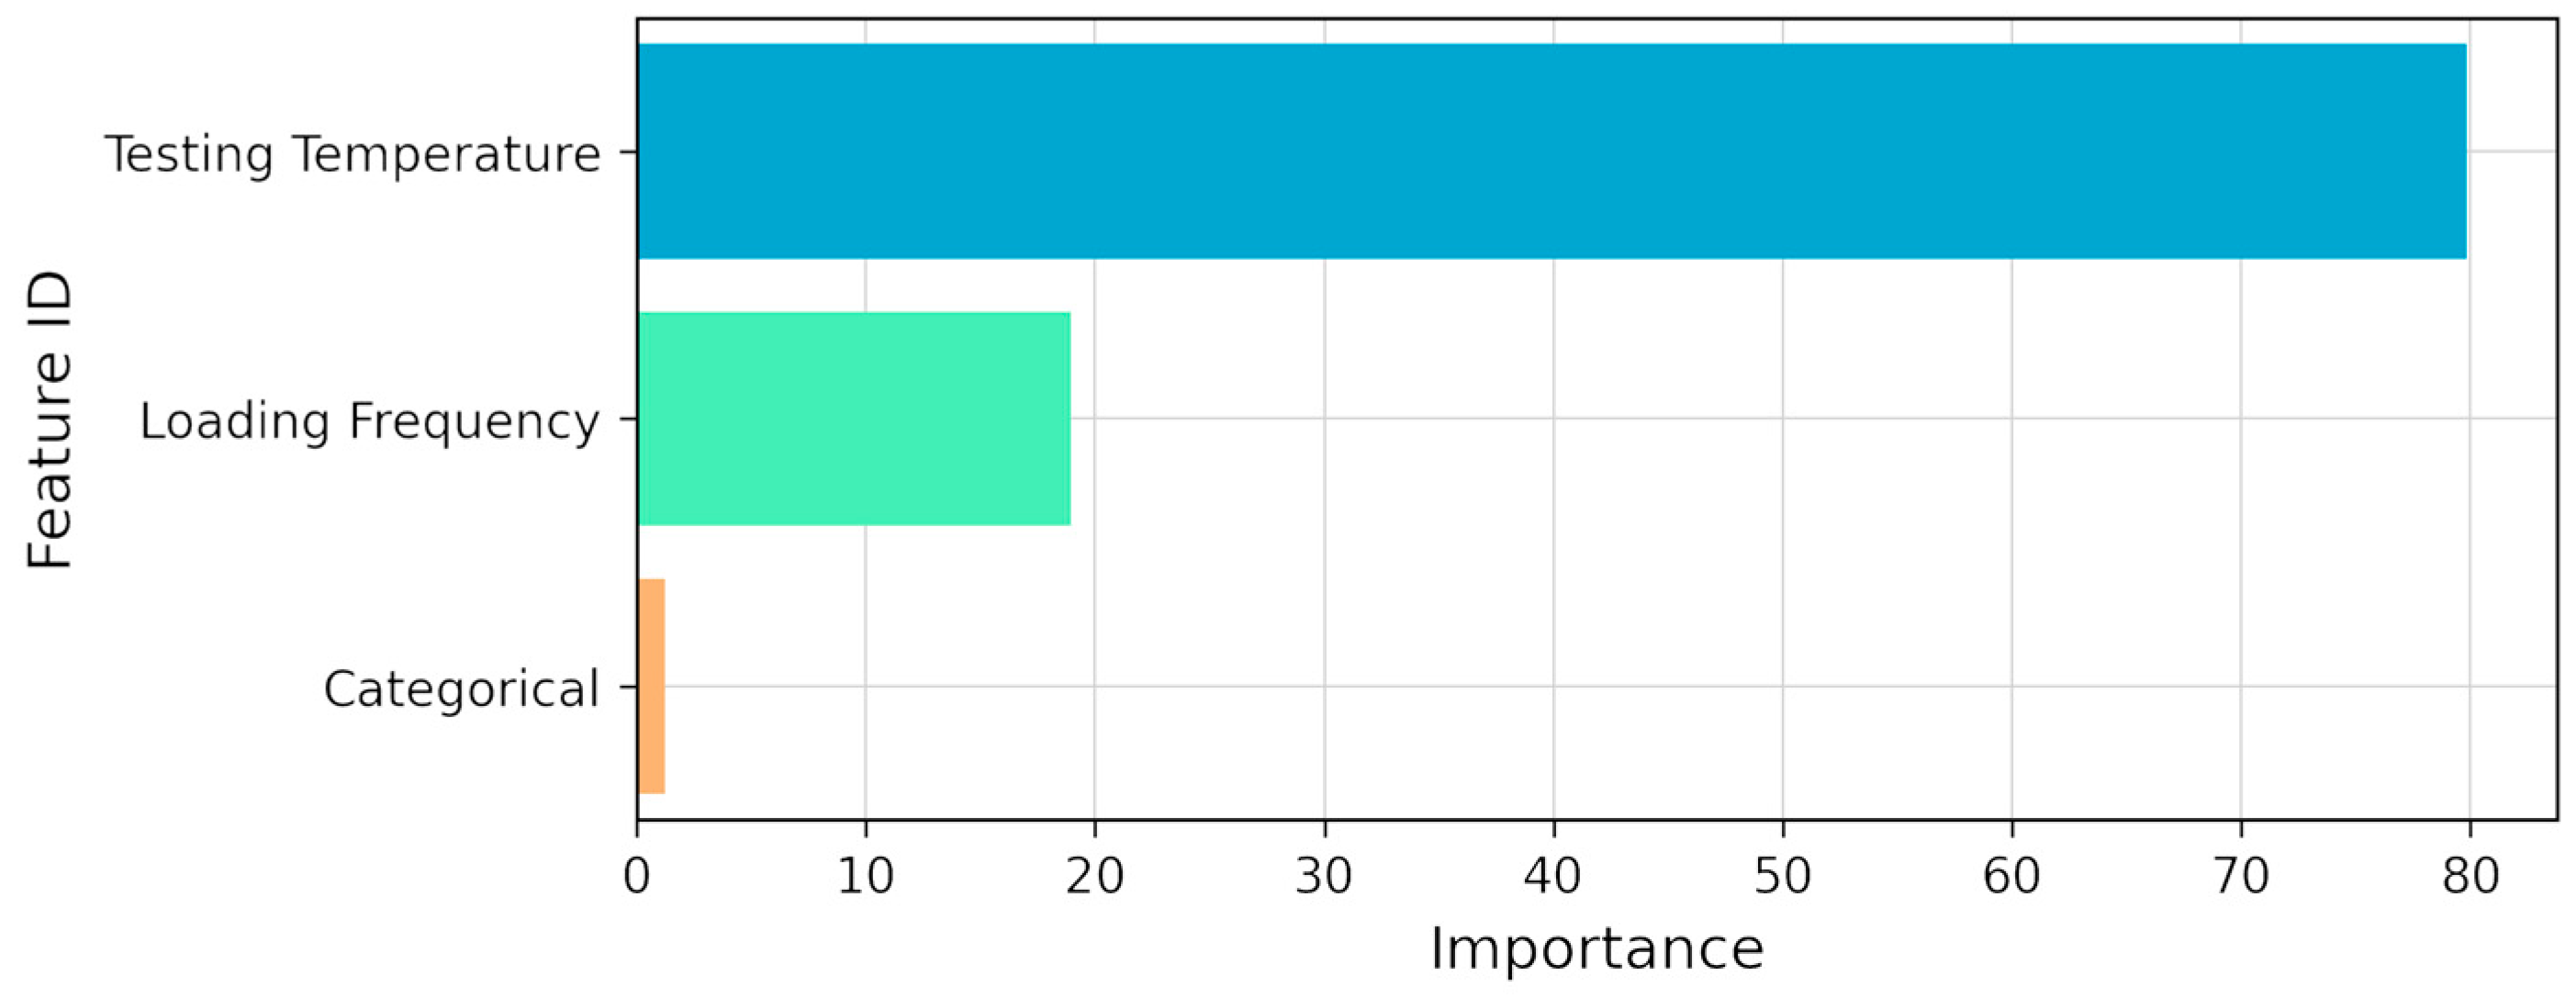
- A sensitivity analysis carried out on the CatBoost model revealed that the testing temperature had the strongest influence on the SM predictions (79.82% of total importance), followed by the loading frequency (18.93%) and the categorical variable (1.25%).
Author Contributions
Funding
Data Availability Statement
Conflicts of Interest
References
- Dash, S.S.; Chandrappa, A.K.; Sahoo, U.C. Design and performance of cold mix asphalt—A review. Constr. Build. Mater. 2022, 315, 125687. [Google Scholar] [CrossRef]
- Zhou, F.; Scullion, T.; Sun, L. Verification and modeling of three-stage permanent deformation behavior of asphalt mixes. J. Transp. Eng. 2004, 130, 486–494. [Google Scholar] [CrossRef]
- Gandomi, A.H.; Alavi, A.H.; Mirzahosseini, M.R.; Nejad, F.M. Nonlinear genetic-based models for prediction of flow number of asphalt mixtures. J. Mater. Civ. Eng. 2011, 23, 248–263. [Google Scholar] [CrossRef]
- Alavi, A.H.; Ameri, M.; Gandomi, A.H.; Mirzahosseini, M.R. Formulation of flow number of asphalt mixes using a hybrid computational method. Constr. Build. Mater. 2011, 25, 1338–1355. [Google Scholar] [CrossRef]
- Dias, J.L.F.; Picado-Santos, L.; Capitão, S. Mechanical performance of dry process fine crumb rubber asphalt mixtures placed on the Portuguese road network. Constr. Build. Mater. 2014, 73, 247–254. [Google Scholar] [CrossRef]
- Liu, Q.T.; Wu, S.P. Effects of steel wool distribution on properties of porous asphalt concrete. Key Eng. Mater. 2014, 599, 150–154. [Google Scholar] [CrossRef]
- Garcia, A.; Norambuena-Contreras, J.; Bueno, M.; Partl, M.N. Influence of steel wool fibers on the mechanical, termal, and healing properties of dense asphalt concrete. J. Test. Eval. 2014, 42, 1107–1118. [Google Scholar] [CrossRef]
- Pasandín, A.; Pérez, I. Overview of bituminous mixtures made with recycled concrete aggregates. Constr. Build. Mater. 2015, 74, 151–161. [Google Scholar] [CrossRef]
- Zaumanis, M.; Mallick, R.B.; Frank, R. 100% hot mix asphalt recycling: Challenges and benefits. Transp. Res. Procedia 2016, 14, 3493–3502. [Google Scholar] [CrossRef]
- Wang, L.; Gong, H.; Hou, Y.; Shu, X.; Huang, B. Advances in pavement materials, design, characterisation, and simulation. Road Mater. Pavement Des. 2017, 18, 1–11. [Google Scholar] [CrossRef]
- Masad, E.; Tashman, L.; Little, D.; Zbib, H. Viscoplastic modeling of asphalt mixes with the effects of anisotropy, damage and aggregate characteristics. Mech. Mater. 2005, 37, 1242–1256. [Google Scholar] [CrossRef]
- Giunta, M.; Pisano, A.A. One dimensional viscoelastoplastic constitutive model for asphalt concrete. Multidiscip. Model. Mater. Struct. 2006, 2, 247–264. [Google Scholar] [CrossRef]
- Erkens, S.M.J.G.; Liu, X.; Scarpas, A. 3D finite element model for asphalt concrete response simulation. Int. J. Geomech. 2002, 2, 305–330. [Google Scholar] [CrossRef]
- Costanzi, M.; Cebon, D. Generalized phenomenological model for the viscoelasticity of idealized asphalts. J. Mater. Civ. Eng. 2014, 26, 399–410. [Google Scholar] [CrossRef]
- Pasetto, M.; Baldo, N. Computational analysis of the creep behaviour of bituminous mixtures. Constr. Build. Mater. 2015, 94, 784–790. [Google Scholar] [CrossRef]
- Collop, A.C.; McDowell, G.R.; Lee, Y. Use of the distinct element method to model the deformation behavior of an idealized asphalt mixture. Int. J. Pavement Eng. 2004, 5, 1–7. [Google Scholar] [CrossRef]
- Abbas, A.; Masad, E.; Papagiannakis, T.; Harman, T. Micromechanical modelling of the viscoelastic behavior of asphalt mixtures using the discrete-element method. Int. J. Geomech. 2007, 7, 131–139. [Google Scholar] [CrossRef]
- Dondi, G.; Simone, A.; Vignali, V.; Manganelli, G. Numerical and experimental study of granular mixes for asphalts. Powder Technol. 2012, 232, 31–40. [Google Scholar] [CrossRef]
- Liu, Z.; Gu, X.; Wu, C.; Ren, H.; Zhou, Z.; Tang, S. Studies on the validity of strain sensors for pavement monitoring: A case study for a fiber Bragg grating sensor and resistive sensor. Constr. Build. Mater. 2022, 321, 126085. [Google Scholar] [CrossRef]
- Asteris, P.G.; Kokoris, S.; Gavriilaki, E.; Tsoukalas, M.Z.; Houpas, P.; Paneta, M.; Koutzas, A.; Argyropoulos, T.; Alkayem, N.F.; Armaghani, D.J.; et al. Early prediction of COVID-19 outcome using artificial intelligence techniques and only five laboratory indices. Clin. Immunol. 2023, 246, 109218. [Google Scholar] [CrossRef]
- Li, J.; Sha, A.; Jiang, W.; Ren, X. Investigation on internal mechanical response of asphalt mixture during creep test utilizing the Smart Aggregate. Constr. Build. Mater. 2022, 349, 128800. [Google Scholar] [CrossRef]
- Majidifard, H.; Jahangiri, B.; Buttlar, W.G.; Alavi, A.H. New machine learning-based prediction models for fracture energy of asphalt mixtures. Measurement 2019, 135, 438–451. [Google Scholar] [CrossRef]
- Ghafari, S.; Ehsani, M.; Nejad, F.M. Prediction of low-temperature fracture resistance curves of unmodified and crumb rubber modified hot mix asphalt mixtures using a machine learning approach. Constr. Build. Mater. 2022, 314, 125332. [Google Scholar] [CrossRef]
- Rahman, A.A.; Mendez Larrain, M.M.; Tarefder, R.A. Development of a nonlinear rutting model for asphalt concrete based on Weibull parameters. Int. J. Pavement Eng. 2019, 20, 1055–1064. [Google Scholar] [CrossRef]
- Baldo, N.; Miani, M.; Rondinella, F.; Valentin, J.; Vackcová, P.; Manthos, E. Stiffness Data of High-Modulus Asphalt Concretes for Road Pavements: Predictive Modeling by Machine-Learning. Coatings 2022, 12, 54. [Google Scholar] [CrossRef]
- Baldo, N.; Miani, M.; Rondinella, F.; Manthos, E.; Valentin, J. Road Pavement Asphalt Concretes for Thin Wearing Layers: A Machine Learning Approach towards Stiffness Modulus and Volumetric Properties Prediction. Period. Polytech. Civ. Eng. 2022, 66, 1087–1097. [Google Scholar] [CrossRef]
- Tarefder, R.A.; White, L.; Zaman, M. Neural network model for asphalt concrete permeability. J. Mater. Civ. Eng. 2005, 17, 19–27. [Google Scholar] [CrossRef]
- Ozsahin, T.S.; Oruc, S. Neural network model for resilient modulus of emulsified asphalt mixtures. Constr. Build. Mater. 2008, 22, 1436–1445. [Google Scholar] [CrossRef]
- Liu, J.; Liu, F.; Zheng, C.; Fanijo, E.O.; Wang, L. Improving asphalt mix design considering international roughness index of asphalt pavement predicted using autoencoders and machine learning. Constr. Build. Mater. 2022, 360, 129439. [Google Scholar] [CrossRef]
- Xiao, F.; Amirkhanian, S.; Juang, C.H. Prediction of fatigue life of rubberized asphalt concrete mixtures containing reclaimed asphalt pavement using artificial neural networks. J. Mater. Civ. Eng. 2009, 21, 253–261. [Google Scholar] [CrossRef]
- Ahmed, T.M.; Green, P.L.; Khalid, H.A. Predicting fatigue performance of hot mix asphalt using artificial neural networks. Road Mater. Pavement Des. 2017, 18, 141–154. [Google Scholar] [CrossRef]
- Bui, Q.A.T.; Nguyen, D.D.; Iqbal, M.; Jalal, F.E.; Prakash, I.; Pham, B.T. Prediction of Interface Shear Stiffness Modulus of Asphalt Pavement using Bagging Ensemble-based Hybrid Machine Learning Model. Arab. J. Sci. Eng. 2023, 48, 13889–13900. [Google Scholar] [CrossRef]
- Piro, N.S.; Mohammed, A.; Hamad, S.M.; Kurda, R. Artificial neural networks (ANN), MARS, and adaptive network-based fuzzy inference system (ANFIS) to predict the stress at the failure of concrete with waste steel slag coarse aggregate replacement. Neural Comput. Appl. 2023, 35, 13293–13319. [Google Scholar] [CrossRef]
- Mahmood, W.; Mohammed, A. Performance of ANN and M5P-tree to forecast the compressive strength of hand-mix cement-grouted sands modified with polymer using ASTM and BS standards and evaluate the outcomes using SI with OBJ assessments. Neural Comput. Appl. 2022, 34, 15031–15051. [Google Scholar] [CrossRef]
- Yang, Z.; Zhang, A.; Sudjianto, A. Enhancing explainability of neural networks through architecture constraints. IEEE Trans. Neural Netw. Learn. Syst. 2020, 32, 2610–2621. [Google Scholar] [CrossRef]
- Baduge, S.K.; Thilakarathna, S.; Perera, J.S.; Arashpour, M.; Sharafi, P.; Teodosio, B.; Shringi, A.; Mendis, P. Artificial intelligence and smart vision for building and construction 4.0: Machine and deep learning methods and applications. Autom. Constr. 2022, 141, 104440. [Google Scholar] [CrossRef]
- Koopialipoor, M.; Asteris, P.G.; Mohammed, A.S.; Alexakis, D.E.; Mamou, A.; Armaghani, D.J. Introducing stacking machine learning approaches for the prediction of rock deformation. Transp. Geotech. 2022, 34, 100756. [Google Scholar] [CrossRef]
- Slack, D.; Friedler, S.A.; Scheidegger, C.; Roy, C.D. Assessing the local interpretability of machine learning models. arXiv 2019, arXiv:1902.03501. [Google Scholar]
- Mansour, E.; Mousa, M.R.; Dhasmana, H.; Hassan, M. Machine-Learning-Based Framework for Prediction of the Long-Term Field Performance of Asphalt Concrete Overlays in a Hot and Humid Climate. Transp. Res. Rec. 2023, 2677, 03611981231161353. [Google Scholar] [CrossRef]
- SIST EN 12591; Bitumen and Bituminous Binders—Specifications for Paving Grade Bitumens. European Committee for Standardization: Brussels, Belgium, 2009.
- ČSN 73 6121 (736121); Stavba Vozovek—Hutněné Asfaltové Vrstvy—Provádění a Kontrola Shody. Česká Technická Norma: Prague, Czech Republic, 2019.
- SIST EN 12697: Part 12; Bituminous Mixtures-Test Methods for Hot Mix Asphalt-Determination of the Water Sensitivity of Bituminous Specimens. European Committee for Standardization: Brussels, Belgium, 2019.
- SIST EN 12697: Part 26; Bituminous Mixtures-Test Methods for Hot Mix Asphalt-Stiffness. European Committee for Standardization: Brussels, Belgium, 2019.
- Subasi, A. Practical Machine Learning for Data Analysis Using Python; Elsevier: London, UK, 2020. [Google Scholar]
- Pallant, J. SPSS Survival Manual: A Step by Step Guide to Data Analysis Using IBM SPSS, 7th ed.; Routledge: London, UK, 2020. [Google Scholar] [CrossRef]
- Zhou, B.Q.; Yang, R.C.; Li, H.P.; Wang, Y.J.; Zhang, C.Y.; Xiao, Z.J.; He, Z.Q.; Pang, W.H. Numeric and nonnumeric information input to predict adsorption amount, capacity and kinetics of tetracyclines by biochar via machine learning. Chem. Eng. J. 2023, 471, 144636. [Google Scholar] [CrossRef]
- Rondinella, F.; Daneluz, F.; Hofko, B.; Baldo, N. Improved predictions of asphalt concretes’ dynamic modulus and phase angle using decision-tree based categorical boosting model. Constr. Build. Mater. 2023, 400, 132709. [Google Scholar] [CrossRef]
- Prokhorenkova, L.; Gusev, G.; Vorobev, A.; Dorogush, A.V.; Gulin, A. Catboost: Unbiased boosting with categorical features. arXiv 2017, arXiv:1706.09516. [Google Scholar]
- Huang, G.M.; Wu, L.F.; Ma, X.; Zhang, W.Q.; Fan, J.L.; Yu, X.; Zeng, W.Z.; Zhou, H.M. Evaluation of CatBoost method for prediction of reference evapotranspiration in humid regions. J. Hydrol. 2019, 574, 1029–1041. [Google Scholar] [CrossRef]
- Hancock, J.T.; Khoshgoftaar, T.M. CatBoost for big data: An interdisciplinary review. J. Big data 2020, 7, 94. [Google Scholar] [CrossRef]
- Moayedi, H.; Mosallanezhad, M.; Rashid, A.S.A.; Jusoh, W.A.W.; Muazu, M.A. A systematic review and meta-analysis of artificial neural network application in geotechnical engineering: Theory and applications. Neural Comput. Appl. 2020, 32, 495–518. [Google Scholar] [CrossRef]
- Rumelhart, D.E.; Hinton, G.E.; Williams, R.J. Learning representations by back-propagating errors. Nature 1986, 323, 533–536. [Google Scholar] [CrossRef]
- Hagan, M.T.; Menhaj, M.B. Training feedforward networks with the Marquardt algorithm. IEEE Trans. Neural Netw. 1994, 5, 989–993. [Google Scholar] [CrossRef]
- Holland, J.H. Adaptation in Natural and Artificial Systems: An Introductory Analysis with Applications to Biology, Control, and Artificial Intelligence; MIT Press: Cambridge, MA, USA, 1992. [Google Scholar]
- Althoey, F.; Akhter, M.N.; Nagra, Z.S.; Awan, H.H.; Alanazi, F.; Khan, M.A.; Javed, M.F.; Eldin, S.M.; Özkılıç, Y.O. Prediction models for marshall mix parameters using bio-inspired genetic programming and deep machine learning approaches: A comparative study. Case Stud. Constr. Mater. 2023, 18, e01774. [Google Scholar] [CrossRef]
- Svilar, M.; Peško, I.; Šešlija, M. Model for Estimating the Modulus of Elasticity of Asphalt Layers Using Machine Learning. Appl. Sci. 2022, 12, 10536. [Google Scholar] [CrossRef]
- Baldo, N.; Miani, M.; Rondinella, F.; Celauro, C. A Machine Learning Approach to Determine Airport Asphalt Concrete Layer Moduli Using Heavy Weight Deflectometer Data. Sustainability 2021, 13, 8831. [Google Scholar] [CrossRef]
- Rondinella, F.; Daneluz, F.; Vacková, P.; Valentin, J.; Baldo, N. Volumetric Properties and Stiffness Modulus of Asphalt Concrete Mixtures Made with Selected Quarry Fillers: Experimental Investigation and Machine Learning Prediction. Materials 2023, 16, 1017. [Google Scholar] [CrossRef] [PubMed]
- Kingma, D.P.; Ba, J. Adam: A Method for Stochastic Optimization. arXiv 2014, arXiv:1412.6980. [Google Scholar]
- Van Rossum, G.; Drake, F.L. Introduction to Python 3: Python Documentation Manual Part 1; CreateSpace: Charleston, SC, USA, 2009. [Google Scholar]


| Basic Bitumen Characteristic | Unit | Value |
|---|---|---|
| Penetration at 25 °C | mm/10 | 59 |
| Softening point (ring and ball) | °C | 50.6 |
| Breaking point after Fraas | °C | −11 |
| Remaining penetration after short-term ageing (RTFOT) | % | 41 |
| Softening point after short-term ageing (RTFOT) | °C | 54.2 |
| Control Sieve (mm) | Grading Curve—Passing (%) | |||
|---|---|---|---|---|
| AML16 | Mix Requirements | AMP22 | Mix Requirements | |
| 32 | 100 | 100 | ||
| 22 | 100 | 96 | 100–90 | |
| 16 | 97 | 100–90 | 80 | 85–60 |
| 11 | 77 | 68 | ||
| 8 | 64 | 80–52 | 55 | 65–40 |
| 5.6 | 55 | 48 | ||
| 4 | 44 | 61–31 | 38 | |
| 2 | 28 | 45–20 | 24 | 38–22 |
| 1 | 18 | 17 | ||
| 0.5 | 14 | 14 | ||
| 0.25 | 11 | 12 | ||
| 0.125 | 10 | 16–4 | 10 | 13–5 |
| 0.063 | 8.5 | 10–3 | 9.0 | 9–4 |
| AML16 Mix | AMP22 Mix | |
|---|---|---|
| Binder content | 4.5% | 4.2% |
| Air voids content | 5.2% | 5.3% |
| Bulk density | 2.417 g/cm3 | 2.421 g/cm3 |
| Moisture susceptibility | 84% | 81% |
| IT-CY stiffness at 15 °C | 7537 MPa | 8257 MPa |
| Mix | Testing Temperature (°C) | Stiffness Modulus (SM) (MPa) under Loading Frequency (Hz) | ||||||||||
|---|---|---|---|---|---|---|---|---|---|---|---|---|
| 0.1 | 1 | 2 | 3 | 5 | 8 | 10 | 15 | 20 | 30 | 50 | ||
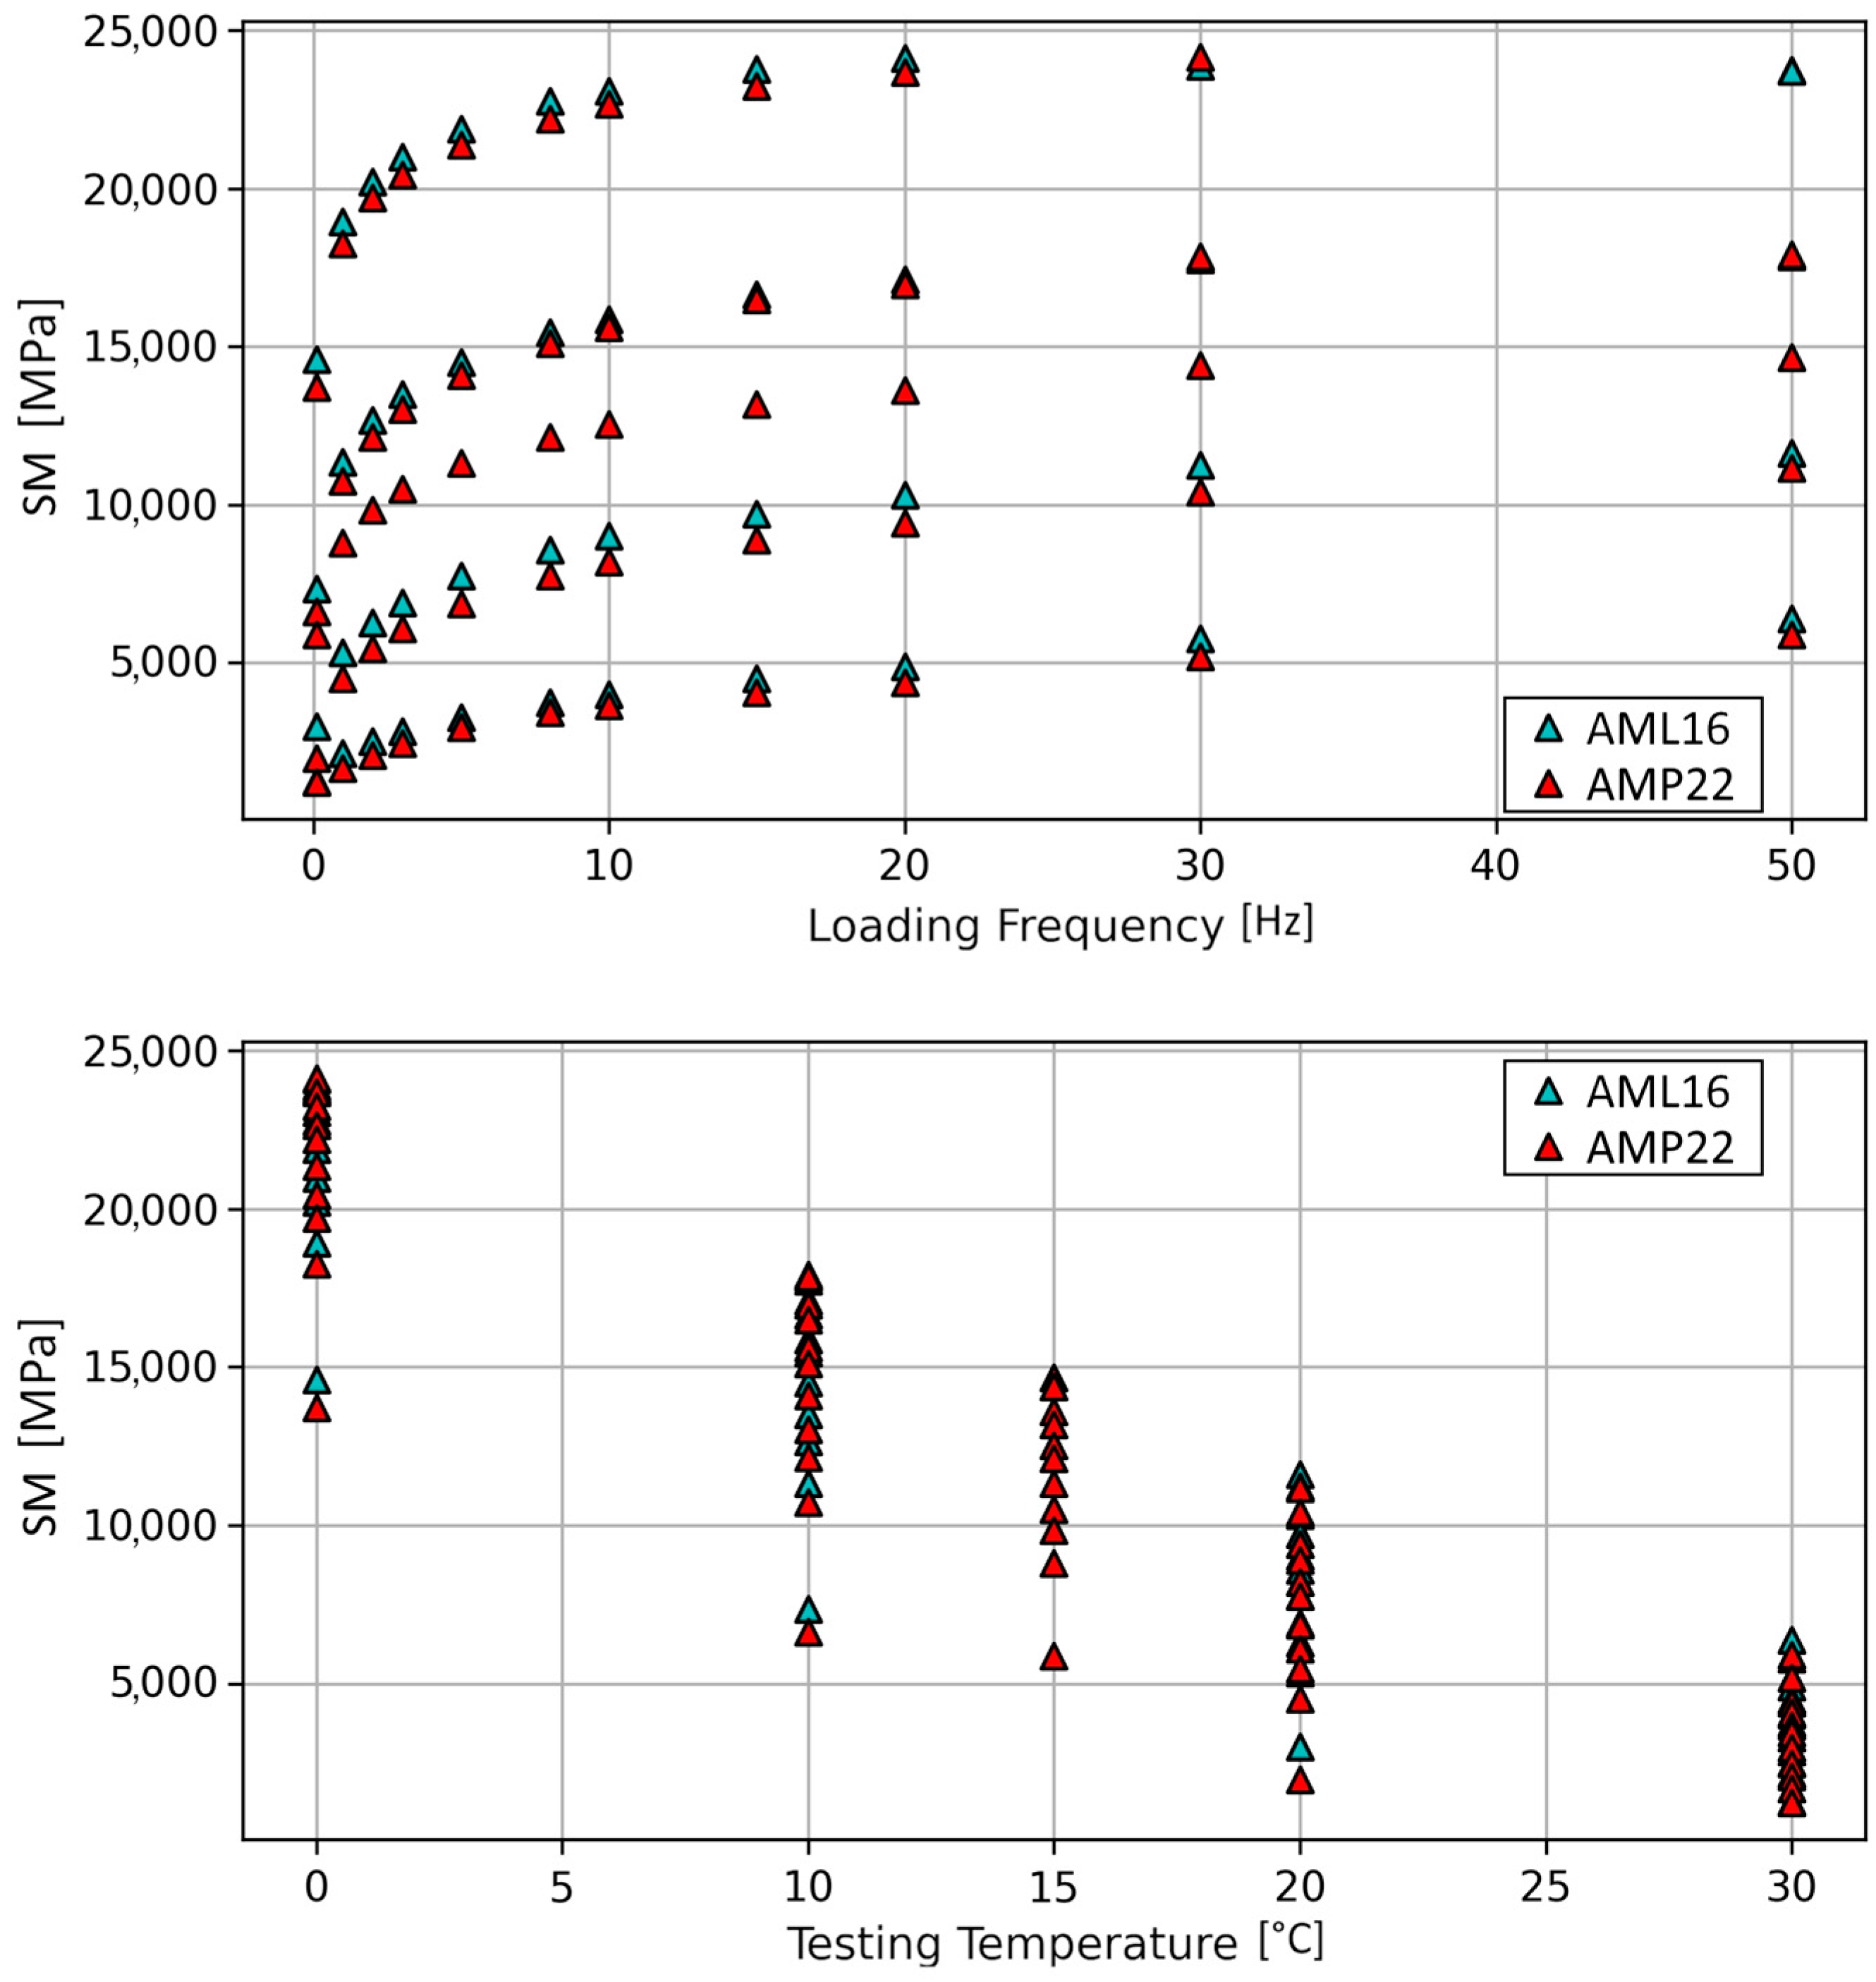
| AML16 | 0 | 14,606 | 18,939 | 20,203 | 20,984 | 21,874 | 22,763 | 23,067 | 23,785 | 24,104 | 23,862 | 23,751 |
| 10 | 7346 | 11,335 | 12,659 | 13,497 | 14,510 | 15,453 | 15,855 | 16,639 | 17,108 | 17,733 | 17,844 | |
| 20 | 3001 | 5325 | 6276 | 6912 | 7769 | 8574 | 9009 | 9722 | 10,317 | 11,238 | 11,618 | |
| 30 | 1265 | 2140 | 2506 | 2831 | 3285 | 3754 | 4005 | 4496 | 4891 | 5777 | 6387 | |
| AMP22 | 0 | 13,719 | 18,268 | 19,697 | 20,435 | 21,364 | 22,196 | 22,654 | 23,245 | 23,672 | 24,133 | 23,691 |
| 10 | 6633 | 10,741 | 12,142 | 13,017 | 14,097 | 15,108 | 15,613 | 16,485 | 16,959 | 17,847 | 17,912 | |
| 15 | 5887 | 8803 | 9845 | 10,503 | 11,320 | 12,123 | 12,534 | 13,172 | 13,606 | 14,396 | 14,664 | |
| 20 | 1975 | 4521 | 5467 | 6089 | 6857 | 7757 | 8210 | 8897 | 9414 | 10,414 | 11,155 | |
| 30 | 1222 | 1681 | 2073 | 2472 | 2962 | 3433 | 3660 | 4061 | 4377 | 5192 | 5896 | |
| ML Model | Hyperparameter | Search Range | Optimal Value |
|---|---|---|---|
| CatBoost | Max depth | 3–6 | 3 |
| Learning rate | 0.005, 0.01, 0.05 | 0.01 | |
| Max iterations | 500, 1000, 5000 | 5000 | |
| ANN | Hidden layer size | 1–50 | 38 |
| Activation function | Identity, Logistic, TanH, ReLU | ReLU | |
| Solver | SGD [52], Adam [59] | Adam | |
| Max iterations | 500, 1000, 5000 | 1000 |
| Goodness-of-Fit Measure | ML Model | |
|---|---|---|
| CatBoost | ANN | |
| MAE (MPa) | 300.49 | 2000.98 |
| MAPE (%) | 3.41 | 22.68 |
| MSE (MPa2) | 1.55 × 10⁵ | 6.49 × 10⁶ |
| RMSE (MPa) | 393.33 | 2547.83 |
| R | 0.9990 | 0.9540 |
| R2 | 0.9968 | 0.8674 |
Disclaimer/Publisher’s Note: The statements, opinions and data contained in all publications are solely those of the individual author(s) and contributor(s) and not of MDPI and/or the editor(s). MDPI and/or the editor(s) disclaim responsibility for any injury to people or property resulting from any ideas, methods, instructions or products referred to in the content. |
© 2023 by the authors. Licensee MDPI, Basel, Switzerland. This article is an open access article distributed under the terms and conditions of the Creative Commons Attribution (CC BY) license (https://creativecommons.org/licenses/by/4.0/).
Share and Cite
Baldo, N.; Rondinella, F.; Daneluz, F.; Vacková, P.; Valentin, J.; Gajewski, M.D.; Król, J.B. Stiffness Moduli Modelling and Prediction in Four-Point Bending of Asphalt Mixtures: A Machine Learning-Based Framework. CivilEng 2023, 4, 1083-1097. https://doi.org/10.3390/civileng4040059
Baldo N, Rondinella F, Daneluz F, Vacková P, Valentin J, Gajewski MD, Król JB. Stiffness Moduli Modelling and Prediction in Four-Point Bending of Asphalt Mixtures: A Machine Learning-Based Framework. CivilEng. 2023; 4(4):1083-1097. https://doi.org/10.3390/civileng4040059
Chicago/Turabian StyleBaldo, Nicola, Fabio Rondinella, Fabiola Daneluz, Pavla Vacková, Jan Valentin, Marcin D. Gajewski, and Jan B. Król. 2023. "Stiffness Moduli Modelling and Prediction in Four-Point Bending of Asphalt Mixtures: A Machine Learning-Based Framework" CivilEng 4, no. 4: 1083-1097. https://doi.org/10.3390/civileng4040059