Article

Numerical and Experimental Investigation of Anchor Channels Subjected to Tension Load in Composite Slabs with Profiled Steel Decking

1
Faculty of Civil Engineering, University of Rijeka, Radmile Matejčić 3, 51000 Rijeka, Croatia
2
Hilti Corporation, Feldkircherstrasse 100, 9494 Schaan, Liechtenstein
3
Institute of Construction Materials, University of Stuttgart, Pfaffenwaldring 4, 70569 Stuttgart, Germany
*
Author to whom correspondence should be addressed.
CivilEng 2022, 3(2), 296-315; https://doi.org/10.3390/civileng3020018
Submission received: 15 November 2021 / Revised: 31 March 2022 / Accepted: 6 April 2022 / Published: 8 April 2022
(This article belongs to the Special Issue Connections in Concrete Volume 2)

Abstract

:
In curtain wall applications, anchor channels are frequently installed near the edge of composite slabs with profiled steel decking. The complex concrete geometry of these floor slabs affects the capacity of all concrete failure modes, but there are currently no guidelines or investigations available on this topic. The main objective of the present research is to investigate how the position of anchor channels and the complex slab geometry influence the tensile capacity of anchor channels. For this purpose, an extensive numerical parametric study was performed using the 3D nonlinear FE code MASA, which is based on the microplane constitutive model. In order to validate the numerical results, an experimental program was carried out for some of the configurations possible in practice. Based on the results, recommendations are given for the reduction in the tensile capacity of anchor channels in composite slabs with profiled steel decking.

1. Introduction

Cast-in anchor channels have become a common fastening system for curtain walls due to their adjustability and reduced on-site labor requirements compared to post-installed fasteners. The curtain wall application of anchor channels is characterized by installation near the edge of thin concrete slabs, resulting in a lower capacity of concrete failure modes. The design becomes even more challenging when composite slabs consisting of profiled steel decking with an in situ concrete topping are used. Their specific geometry requires a design based on engineering judgments that may lack precision. Bogdanić et al. [1] investigated the influence of complex geometry on the concrete edge breakout capacity of anchor channels under shear load and proposed a modification factor. To extend the work presented in [1], the same conditions under tensile loads were analyzed. The aim of the present study was to present the numerical and experimental investigations and discuss the influence of the geometry of composite slabs on the capacity of anchor channels under tension. Two typical shapes of profiled steel decking (trapezoidal and re-entrant profiles) were simulated. In order to cover as many configurations as possible, the orientation of the steel decking (perpendicular and parallel to the edge) was varied, as well as the position of anchor channels with respect to the profiled steel decking and the overall thickness of the composite slab. Common details of the profiled steel decking are illustrated in Figure 1.

Design of Tension-Loaded Anchor Channels

The design of anchor channels in thick concrete members is based on the concrete breakout model proposed by Kraus [2]. Since anchor channels behave as a continuously supported beam would, Kraus [2] also proposed a method for calculating the forces on the anchors based on a simplified triangular distribution over a so-called “influence length”. The anchor forces are utilized for the concrete capacity verifications which need to be performed for each single anchor. In the case of anchor channels in thin members, the governing failure mode is often the concrete splitting failure due to loading which has not been extensively investigated. This is evidenced by the different design approaches in Europe (EN 1992-4 [3]) and in the United States (ACI 318 [4] with the amendment of AC 232 [5]). Moreover, the concrete behavior of fastening systems subjected to tension in thin members is also affected by the bending stresses induced in the slab itself by external loads [6,7,8].
The installation of anchors channels close to the edge of thin plain concrete slabs has already been investigated by the authors [6] and modifications to the current design model for splitting of EN 1992-4 [3] have been proposed. According to [6], the characteristic resistance of an anchor channel shall be calculated according to the following equation:
N R k , s p = N R k 0 · Ψ c h , s , N · Ψ c h , c , N · Ψ c h , e , N · Ψ r e , N · Ψ h , s p ,
where factor N0Rk is the minimum of basic characteristic concrete breakout resistance and characteristic pull-out resistance with a pre-factor to ensure optimal agreement between the results and the proposed model:
N R k 0 = 1.15 · m i n ( N R k , c 0 ,   N R k , p ) .
Modification factors Ψch,s,N, Ψch,c,N, and Ψre,N in Equation (1) should be calculated according to the provisions for concrete breakout failure. However, the characteristic edge distance ccr,N and spacing scr,N shall be replaced by ccr,sp and scr,sp, respectively. For the influence of edge distance, a linear function has been proposed:
Ψ c h , e , N = 0.52 + 0.08 c 1 h e f 1.0 .
With the above Equation (3), the characteristic edge distance corresponds to ccr,sp = 6hef. The characteristic spacing scr,sp is defined as twice the value of the characteristic edge distance for splitting, i.e., scr,sp = 12hef. An additional factor Ψh,sp takes into account the influence of member thickness and is computed as follows:
Ψ h , s p = ( h h e f ) 2 / 3 m a x { 1 ; ( h e f + c c r , N h m i n ) 2 / 3 } 2.0 .
The numerical and experimental results showed that the modified model is able to accurately predict the tensile capacity of anchor channels in thin concrete slabs. Therefore, the proposed modified model from [6] should be used as a basis and an additional modification factor should be applied to account for the influence of the complex concrete geometry of composite slabs.

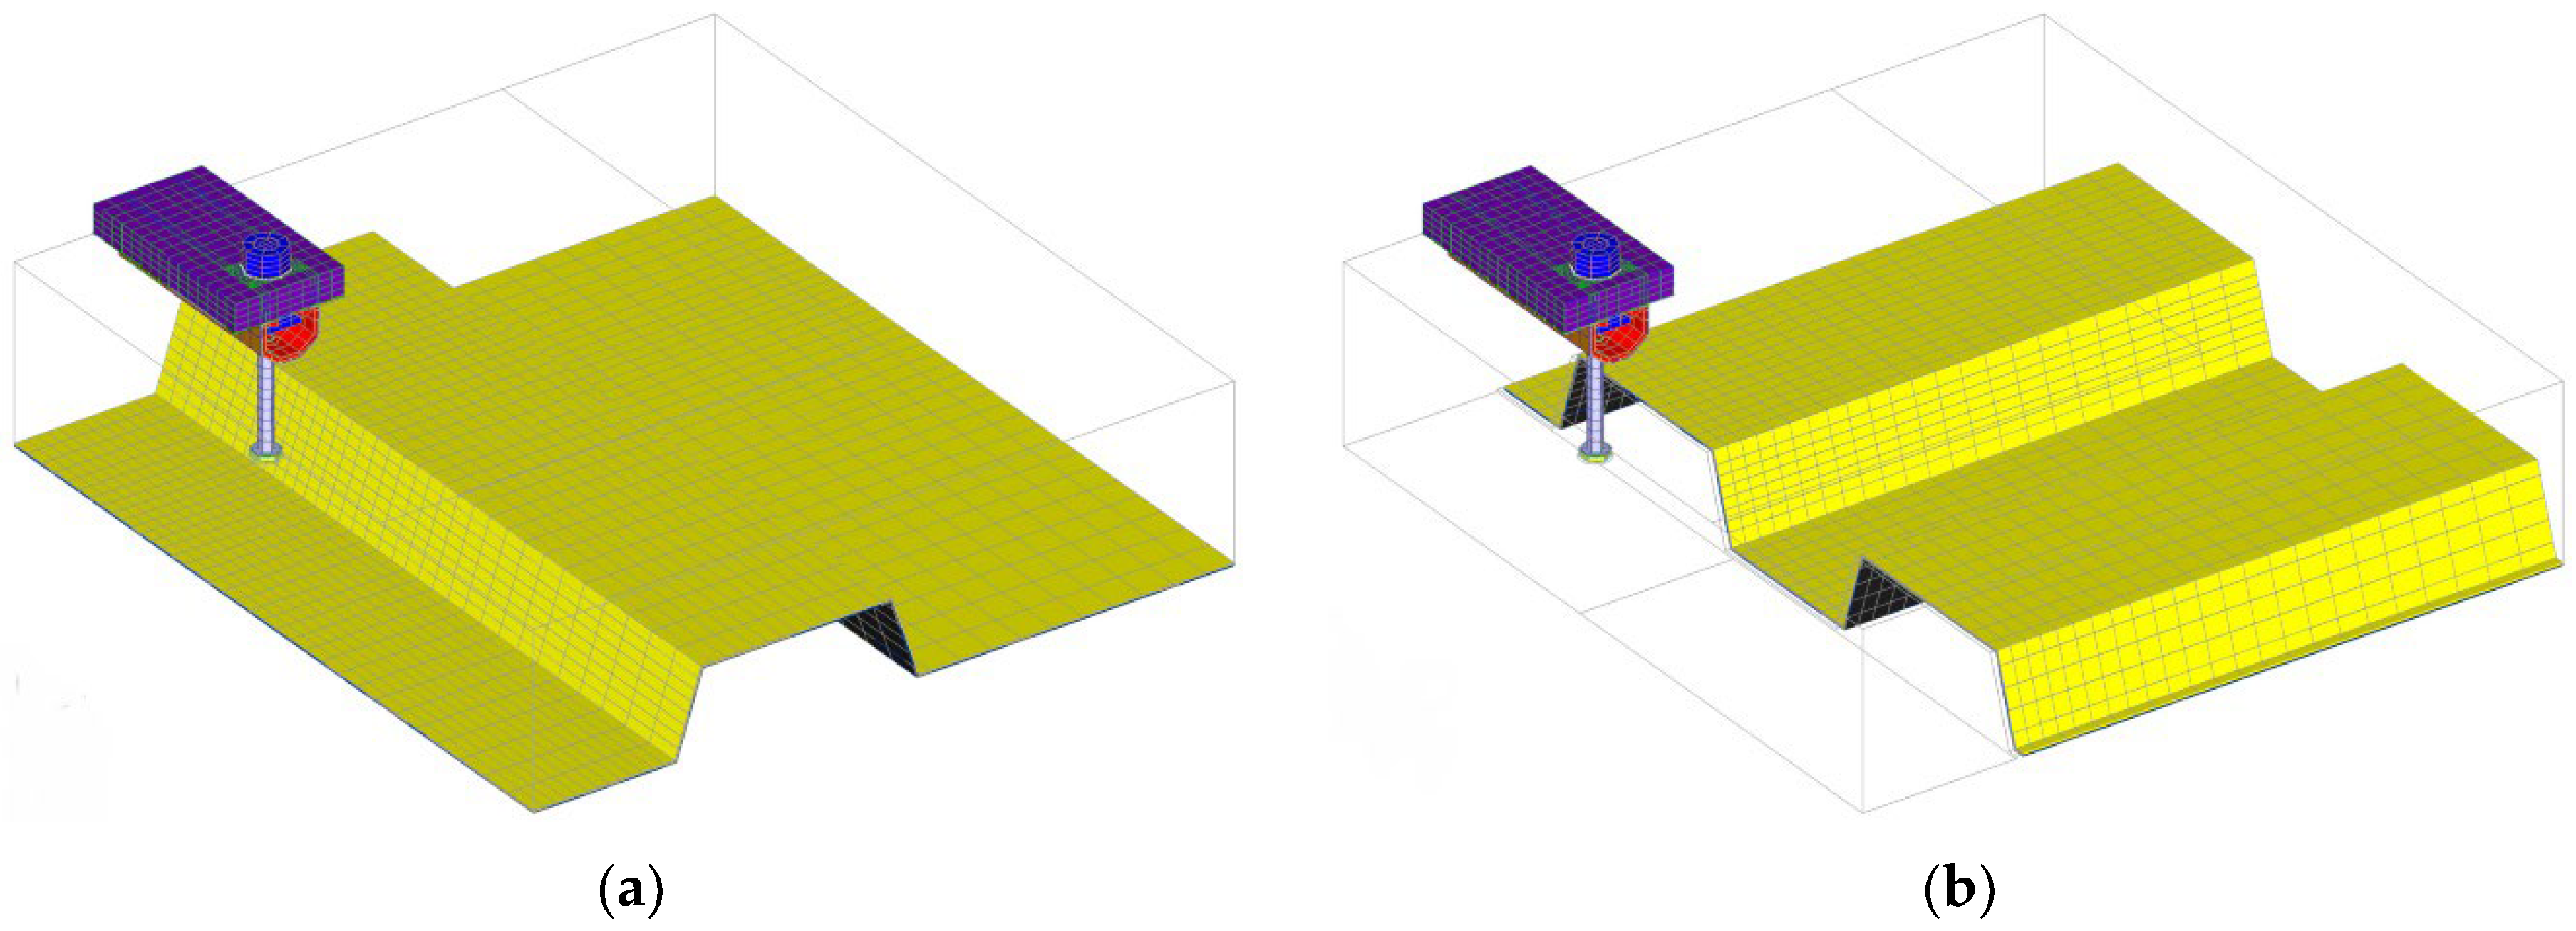
2. FE Model and Experimental Validation

A 3D nonlinear finite element (FE) code MASA [9] was employed for the numerical parametric study. The code is based on the microplane constitutive law for concrete with a relaxed kinematic constraint, where the microplane strains are assumed to be projections of the macroscopic strain tensor [9]. The constitutive properties are entirely characterized by uniaxial relationships between the stress and strain components at each microplane. The macroscopic stiffness and stress tensors are calculated as an integral over the unit radius sphere by monitoring stresses and strains in different predefined directions [9]. Since the analysis is performed within the framework of the smeared crack approach, a regularization technique is required to prevent mesh-dependent results. The crack band method [10]—which is one of the simplest techniques—is employed in the FE code. In this method, the post-peak (softening) response of the constitutive law depends on the fracture energy and the element size, i.e., the larger the element, the more brittle the material response should be. In order to minimize the mesh sensitivity, one should be aware of its drawbacks, e.g., the influence of mesh alignment, element shape, etc. [11,12]. Nevertheless, the code has been successfully used in a number of 3D numerical studies for various structural problems in concrete engineering [1,6,13,14,15]. The FE discretization and the evaluation of numerical results were performed using the commercial pre- and post-processing program FEMAP [16].
The validation of numerical simulations for plain and composite slabs was described in detail in the recently published paper [6]. Tests were carried out for anchor channels in uncracked plain concrete slabs as well as in composite slabs (steel decking Cofraplus 60) with the same overall thickness of h = 130 mm. Medium-size anchor channels (HAC-60) with two anchors (embedment depth hef = 106 mm) were installed parallel to the orientation of the steel decking in composite slabs with a distance between the anchors and the steel decking of 50 mm. The anchor spacing s = 200 mm and the edge distance c1 = 100 mm were selected due to their common occurrence in curtain wall applications. The dimensions and arrangement of the reinforcement were identical for the plain slab and the composite slabs to obtain information on the capacity reduction due to the presence of the steel decking. The width and length of the slabs were 1300 mm.
The tests were carried out in accordance with the EAD [17] in the laboratory of the Faculty of Civil Engineering in Rijeka, Croatia, using a Zwick Roell servo-hydraulic actuator with 500 kN load cell. The load was distributed equally to two channel bolts (HBC-C M20 × 80 8.8F) inserted directly over the anchors, as shown in Figure 2a, whereas the distance between the anchors and the vertical supports was set to 2hef. All the slabs were made of the same batch of a low-strength concrete (C16/20), in which crushed (edged) aggregate with a maximum size of 16 mm was used. The measured concrete properties were as follows: fcc = 34.61 N/mm2 (fc = 27.69 N/mm2) measured on 5 cubes (150 × 150 × 150) with CoV = 3.90%, ft = 2.39 N/mm2 measured on 3 cylinders (300 × 150) with CoV = 2.56% and GF = 55 J/m2 measured on 6 prismatic specimens (100 × 100 × 400) with CoV = 4.82%.
The concrete slab was discretized with four-node solid finite elements, whereas steel parts were modeled mainly with eight-node solid elements, as shown in Figure 3a. The size of the finite elements was set to approximately 10 mm in the vicinity of the channel (fracture process zone) and gradually increased towards the edges of the model. Since the focus was on the concrete failure, steel parts were assumed to be linear elastic with a Young’s modulus of 210 GPa and a Poisson’s ratio of 0.33. To ensure a realistic behavior of the connection, 1D linear contact elements were used between the concrete and steel. These elements can take up only compressive forces and in-plane shear forces (friction). Since anchor channels belong to the fastening systems that transfer applied tension loads through mechanical interlock, the friction coefficient has minimal influence and was set to 0.3.
With the geometry and boundary conditions corresponding to the performed tests, the numerical models were able to realistically predict the ultimate loads and crack patterns, as shown in Table 1 and Figure 2b. Note that the analysis was predictive, i.e., it was performed before the experimental verification tests. The difference between the numerical and test results was less than 6% in all investigated cases. As discussed in [6], the only difference occurred in the load–displacement curves, where the numerical results showed a slightly stiffer response. This can be attributed to the local effects (e.g., local crushing of the concrete around the anchor head), which cannot be properly accounted for in macroscopic analyses [18]. However, this discrepancy is not significant to the outcome of the study and the proposed design changes because, unlike similar studies [19], the displacement does not directly affect the determination of the bearing capacity. In fact, the difference between the displacements at the maximum resistance was less than 1 mm. More details related to the numerical verification of the model can be found in [6].

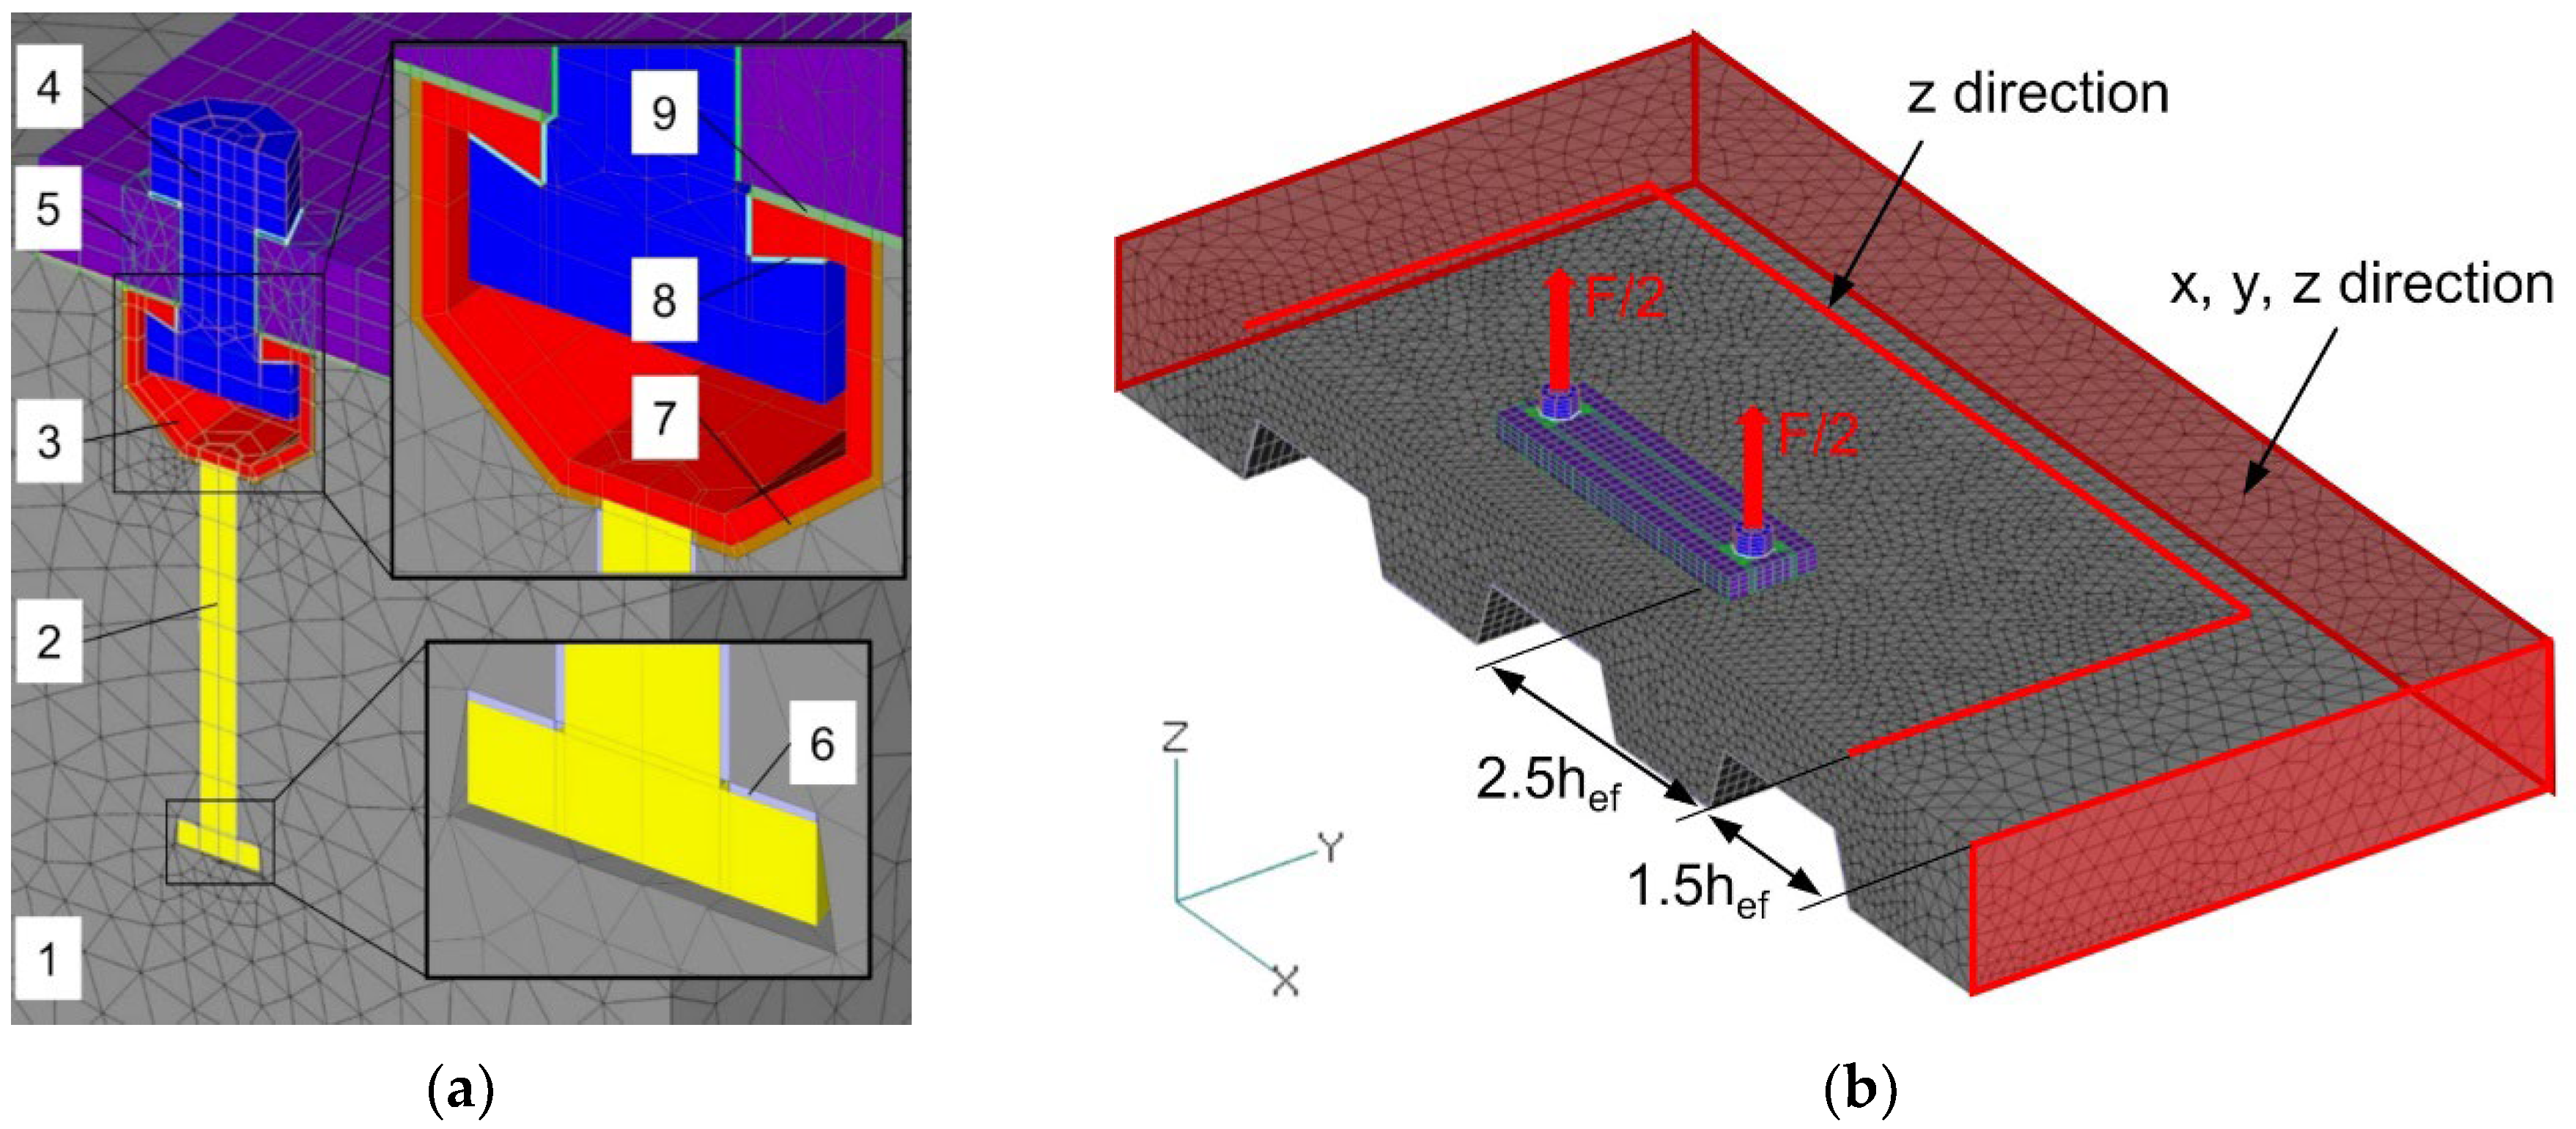
Definition of Boundary Conditions

A typical finite element discretization (model) used in the numerical parametric study is shown in Figure 3b. The only difference between the model for composite slabs and the model for plain concrete slabs was the presence of steel decking and the corresponding interface elements with contact bars. The edge trim (or pour stop) of the steel decking in composite slabs was considered as a non-structural element and its contribution was not taken into account. The boundary conditions were defined as nodal loads and constraints. The load was applied at the nodes on the T-bolts, which were placed directly above the anchors. The nodes on the red surfaces were assumed to be fixed. These surfaces are outside the range affected by cracks and high stresses and therefore the model realistically replicates the behavior of anchor channels in floor slabs in practice. The nodes on the red curves represent the vertical supports that should be placed at a distance greater than 2hef according to the current approval guidelines [5,17]. When possible, half of the model was simulated, taking advantage of symmetry to reduce computational costs (Series 1 and Series 2 of Section 3).
In [6], it was shown that the spacing between the anchor and the vertical support does not have pronounced influence on the results for plain concrete slabs. However, for composite slabs, the influence of the support span is much more pronounced, due to the lower local flexural stiffness. For example, Figure 4 shows the breakout patterns at the ultimate load for the support spans 2.5hef and 4.5hef for the steel decking oriented parallel to the edge. The finite elements colored in red correspond to a crack width of approximately 0.1 mm or larger. Namely, the deformation of 0.008 was obtained by dividing the crack width by the average element size (band width) in the fracture zone (app. 12.5 mm). In this case, the thinnest section overlying the flange is the weakest part of the model and causes the failure crack to form behind the channel (at the distance l1), regardless of how far away the vertical support is. The reduction increases with the support span as the lever arm between the point of load application and the support (distance l2) becomes larger without significantly increasing the flexural stiffness, and thus without a notable increase in resistance (Table 2). The same analogy can be applied for the steel decking oriented perpendicular to the edge. Additionally, for large support spans, the slab failure occurs before anchorage failure. Therefore, the question arises of whether this bending failure should be treated as a global problem or as a local failure, since in practice, the location of the vertical supports is not known in advance. In this study, the support span was set at 2.5hef, in a consistent way with the specification according to qualification tests in the current guidelines [5,17]. Nevertheless, the interaction between the global stresses (due to shear or bending) and the local stresses introduced by the fastening element for thin members is one of the problems that need to be considered in further research.

3. Numerical Parametric Study

The numerical parametric study was conducted to investigate the vast majority of possible configurations of anchor channels in composite slabs. Each composite slab configuration had its counterpart in the equivalent plain concrete slab with the same overall thickness to determine the capacity reduction. In all simulations, a medium size anchor channel (HAC-50, more information on which can be found in [20]) with two anchors was adopted, varying the embedment depth and anchor spacing. Within the study, two steel decking profile types were simulated: Ribdeck S60, representing the typical trapezoidal profile, and Superib, representative of the re-entrant profiles. It should be noted that the height of the Superib profile was increased from 51 mm to 60 mm to allow a better comparison between the two geometries in the simulations, as shown in Figure 5.
Material properties of concrete were defined according to the CEB FIP Model Code 90 [21]: cylinder compressive strength fc = 20 N/mm2; uniaxial tensile strength ft = 1.57 N/mm2; fracture energy Gf = 50 J/m2; Young’s modulus Ec = 27,100 N/mm2; and Poisson’s ratio νc = 0.18. Steel was assumed to be linear elastic with parameters identical to those given in Section 2 since the concrete failure was the main topic of investigations. The influence of reinforcement was not investigated within this study. In general, composite slabs are only lightly reinforced with surface mesh reinforcement to control cracking. According to EN 1994-1-1 [22], the minimum cross-sectional area of the reinforcement should be as follows:
  • 0.2% of the cross-sectional area of the concrete above the ribs for unpropped construction.
  • 0.4% of the cross-sectional area of the concrete above the ribs for propped construction.
Therefore, the amount of reinforcement usually present in slabs cannot even be considered according to the current code provisions [3,5]. However, a recent study of headed studs [8] has revealed that surface reinforcement can increase the concrete breakout capacity, especially in thin members. Therefore, the influence of surface reinforcement could be an interesting topic for future research.
In the scope of this study, three cases were distinguished based on the orientation of the steel decking and the position of anchor channels. Unless otherwise stated, the overall member thickness of 130 mm, which is fairly common in practice, was selected.
The most important parameters are illustrated in Figure 6. The parameter dw represents the distance between the anchor and the web of the profile which depends on the width of the perimeter beam bpb. In addition, the angle α is acute for trapezoidal profiles, obtuse for re-entrant profiles, and a right angle for the perpendicular orientation of the steel decking.
In Series 1, the profiled steel decking was oriented parallel to the edge and the width of the perimeter beam bpb was varied for a constant edge distance c1 = 100 mm. Embedment depths hef = 91, 106 and 120 mm, which are common for these applications and the two profile types, were investigated, as shown in Table 3. Shorter anchors were excluded from this study as in this case the influence of bending would be less pronounced since the concrete cone failure becomes decisive rather than concrete splitting [6].
In order to investigate the influence of member thickness, the width of the perimeter beam was varied, simulating an additional member thickness h = 180 mm with the trapezoidal profile Ribdeck S60. In addition, a single configuration (hef = 106 mm, h = 130 mm, Ribdeck S60) was investigated for the edge distance c1 = 200 mm to understand whether this parameter also affects the capacity reduction.
In Series 2, anchor channels with embedment depths of hef = 91, 106 and 120 mm were also placed in the perimeter beams with various widths, but the orientation of the steel decking was perpendicular to the beam. Since this configuration is very similar to Series 1 (see Figure 7), only trapezoidal profile Ribdeck S60 was simulated, as shown in Table 4.
The main objective of Series 3 was to investigate the installation of anchor channels over the decking profile, when it is oriented in perpendicular to the edge (see Table 5). Since the considered embedment depths exceeded the thickness of the concrete layer above the steel decking, the anchor spacing was varied to be compatible with the dimensions of the steel decking. The anchor spacings s = 250 mm and s = 300 mm were simulated for the trapezoidal profile, whereas the anchor spacings s = 150 mm and s = 200 mm were chosen for the re-entrant profile. Moreover, in order to cover a number of configurations, the anchor channels were placed symmetrically over the flange (symmetric configuration), but also shifted to one side (asymmetric configuration). For example, Table 6 shows the configurations investigated for the trapezoidal profile.

4. Numerical Results

4.1. Series 1

The numerical results of Series 1 are reported in Figure 8 in terms of relative capacity Nu/Nu,Ref as a function of the anchor lateral distance dw from the decking profile, whereby Nu is the ultimate tensile concrete capacity in composite slabs and Nu,Ref is the reference ultimate capacity in the plain concrete slab. According to the obtained numerical results, the capacity reduction does not significantly depend on the width of the perimeter beam, as long as the parameter dw is not small enough to provoke a sort of blowout failure. As shown in Figure 8a, reducing dw below approximately 30 mm, the relative capacity for all investigated cases decreases rapidly. For larger dw distances, reductions of less than 20% were observed compared to the reference plain concrete slab, with no particular trend. As the width of perimeter beam bpb increases, one would expect smaller reductions. At the same time, however, an opposite effect occurs, as the lever arm between the applied forces and the weakest cross-section behind the channel l1 also increases (see Figure 4). For comparison, Figure 9 shows the post-peak breakout patterns in terms of deformations for the distances dw = 15 and dw = 45 mm and the corresponding reference plain concrete slab. For the reference slab, a typical cone-shaped pattern was developed. In contrast, a sort of blowout failure can be observed for the smallest distance dw, accompanied by flexural cracks behind the channel starting from the corner of the flange. For the distance dw = 45 mm, a cone-shaped breakout pattern was developed together with clearly visible flexural cracks. However, the dimension of the cone behind the channel was smaller than that of the reference plain slab due to the disturbance caused by the steel decking.
Moreover, it can be also observed from Figure 8a that the results for both investigated edge distances are comparable, and thus the edge distance also does not have a pronounced influence on the reductions. The results for the 180 mm-thick composite slabs are shown in Figure 8b. In a similar way as for the 130 mm-thick slab, the relative capacity in case of composite slabs was over 80% in all cases. However, a larger reduction was not obtained for the smallest value of dw since the anchor length did not exceed the thickness of the layer above the steel decking, and the blowout failure could not develop.

4.2. Series 2

In Series 2, the steel decking profile was oriented in a direction perpendicular to the perimeter beam. In general, there was no significant difference between the investigated embedment depths and the results were comparable with the Series 1 results, as shown in Figure 10. Additionally, in this case, the largest reduction was again observed for the smallest value of the parameter dw, while for the other studied values, the reductions in capacity of the composite slabs did not exceed 20%. It should be mentioned that the anchors were placed in the direction of flanges (refer to Figure 7b). Consequently, as the parameter dw decreases, the anchors approach the voids and the failure mode turns into a sort of blowout failure.

4.3. Series 3

Various positions of the anchors in the ribs of the decking profile were investigated in Series 3. The relative capacity Nu/Nu,Ref for the trapezoidal and the re-entrant profiles are shown in Figure 11a,b, respectively. It can be observed that the relative capacities between the investigated configurations were comparable between the different embedment depths, although slightly larger reductions were observed with increasing embedment depth. The most critical case was the configuration with both anchors in the vicinity of the steel decking, which would correspond to the anchor spacing of s = 300 mm and asymmetric configuration (see Table 6). Unlike in Series 1, the influence of member thickness cannot be neglected. As can be seen from Figure 9a, there was a difference in the relative capacities for the embedment depth hef = 120 mm installed in the 130 mm and 180 mm thick slabs between 0.21 and 0.29.
The shape of the steel decking had a significant effect on the capacity reduction. The reductions for composite slabs with the trapezoidal profile Ribdeck S60 were more than 20% larger than for the re-entrant profile Superib. To explain this fact, Figure 12 shows the cross-sections through the longitudinal axis of the channel and the corresponding principal stresses σ33 (compressive stresses in concrete) at the ultimate load for both decking profiles. As can be seen, a sort of strut-and-tie mechanism develops in the case of re-entrant profiles, where the compressive forces are transferred from the anchor head to the corners of the flanges (green area in Figure 12b). Therefore, the re-entrant profile provides a confinement and higher stresses can be generated around the anchor head. This can be recognized by the larger purple areas around the anchor heads which experienced compressive stresses of approximately 60 N/mm2. For fasteners loaded in tension, this directly increases the concrete capacity.

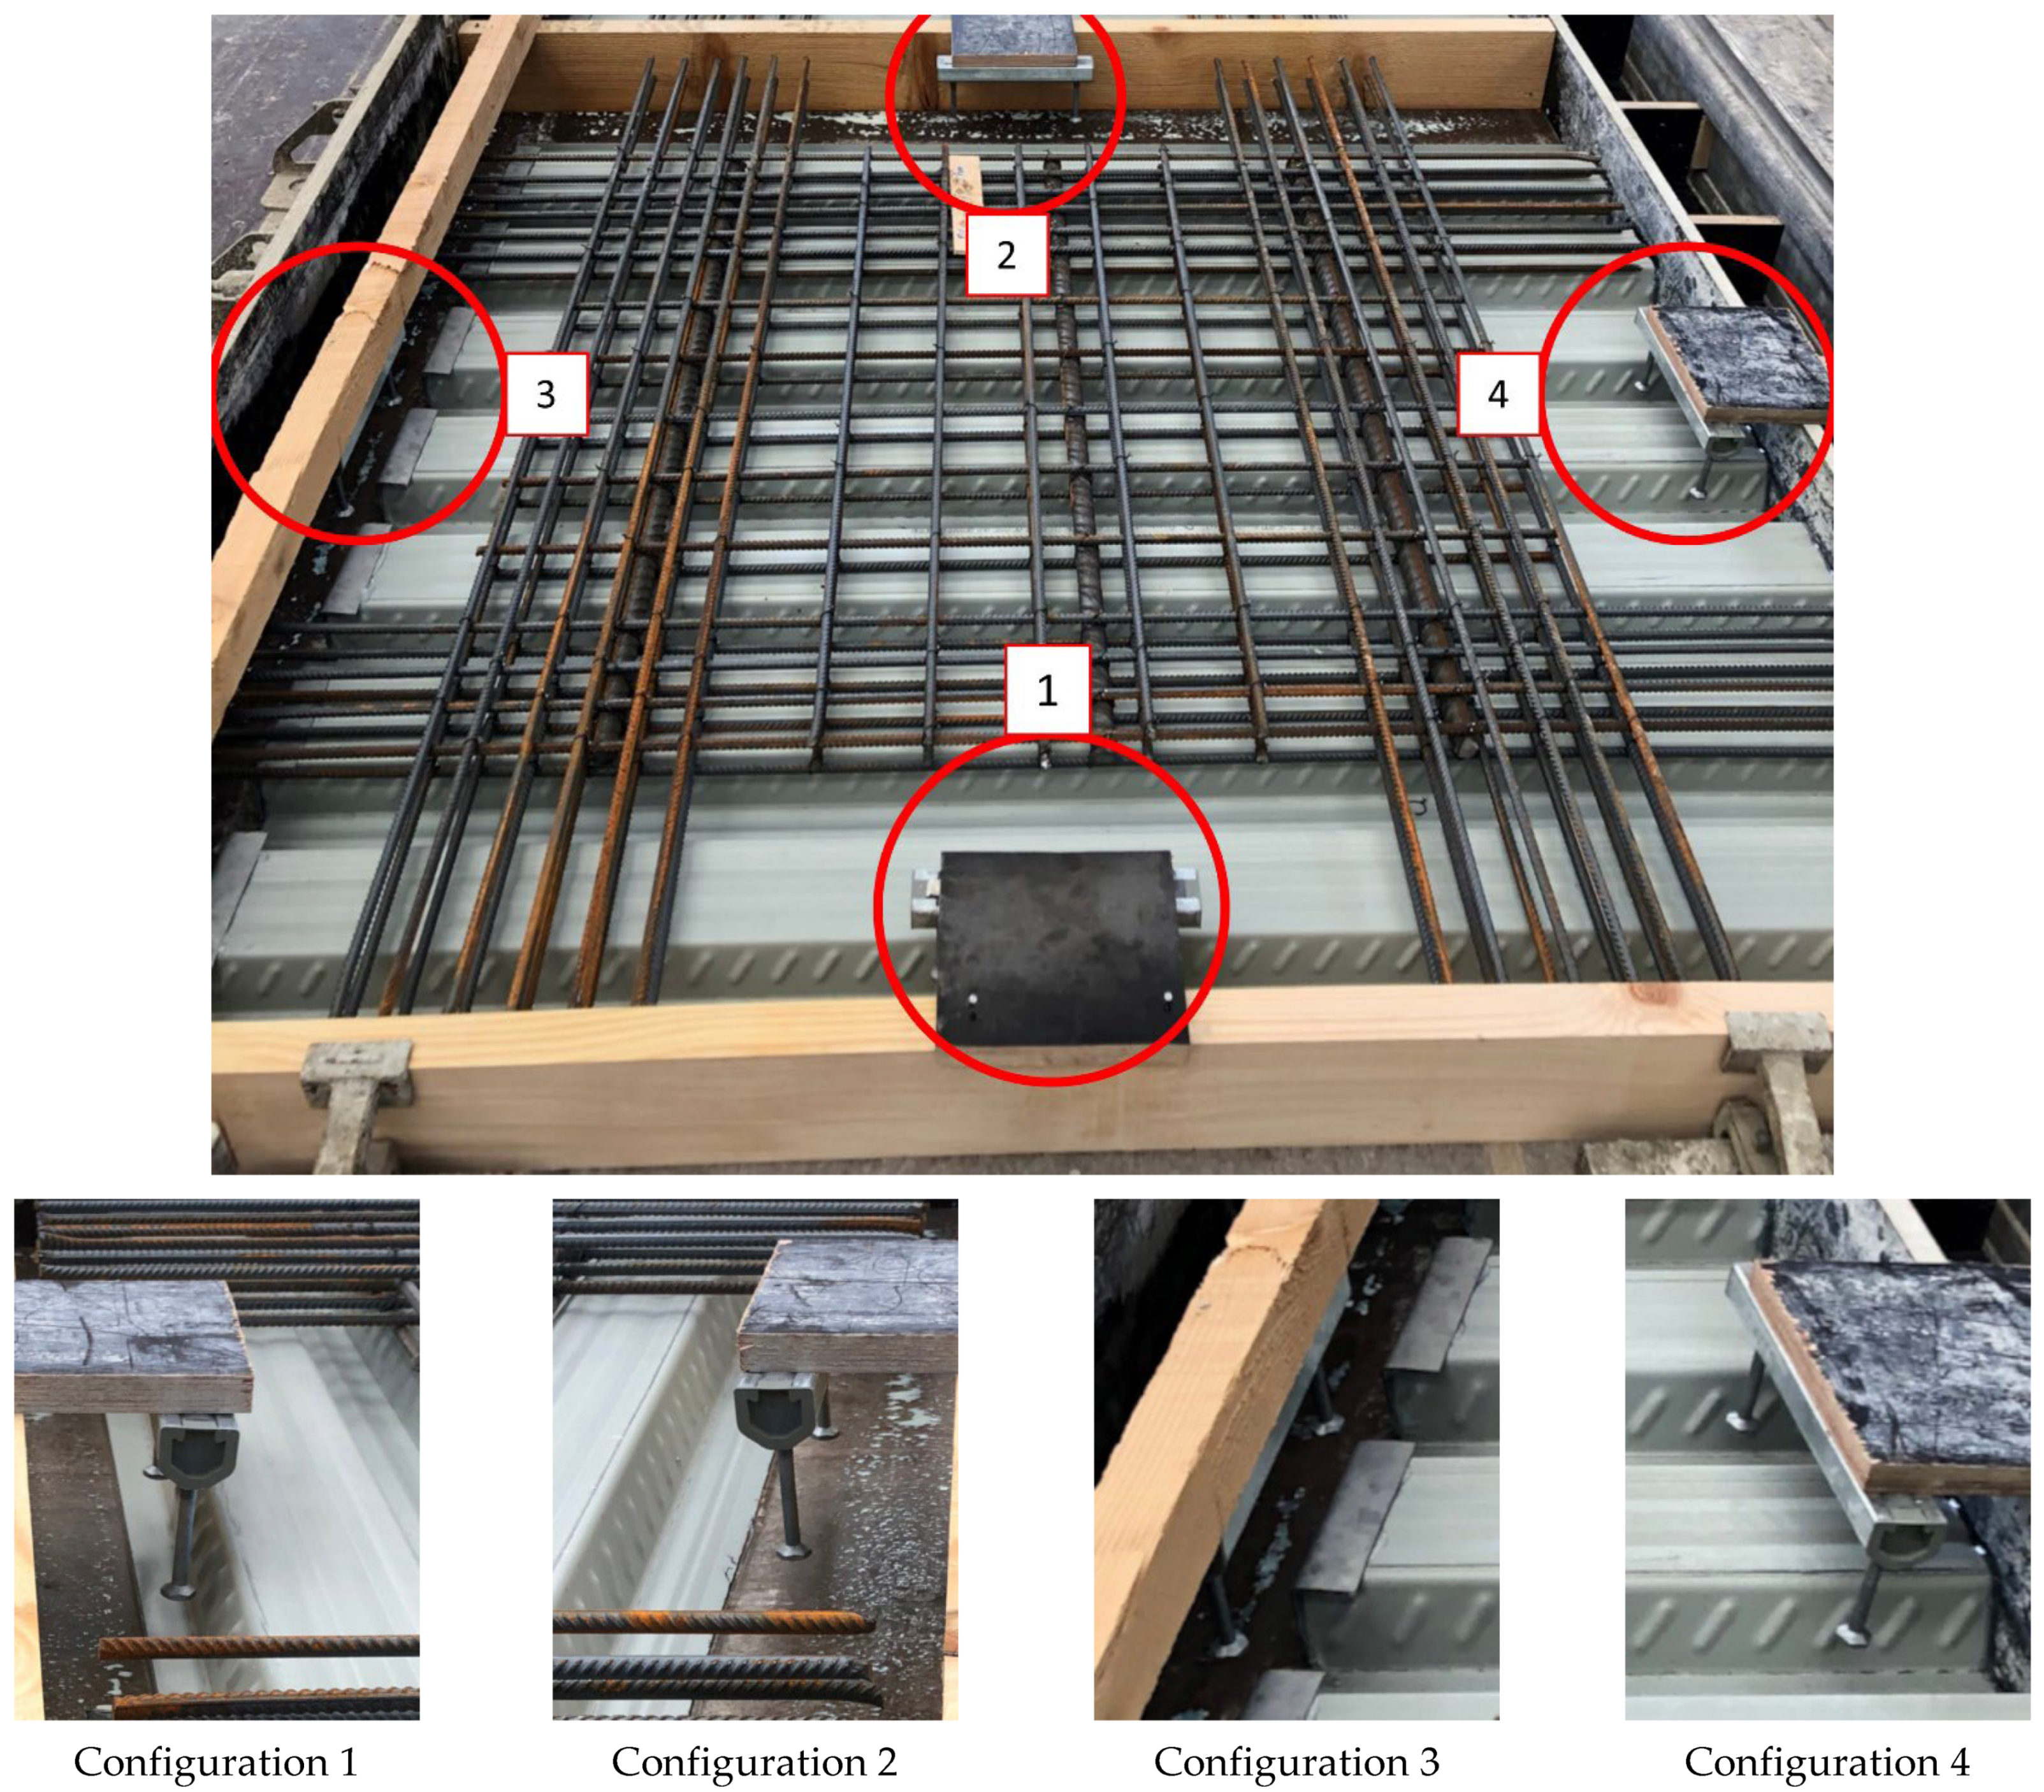
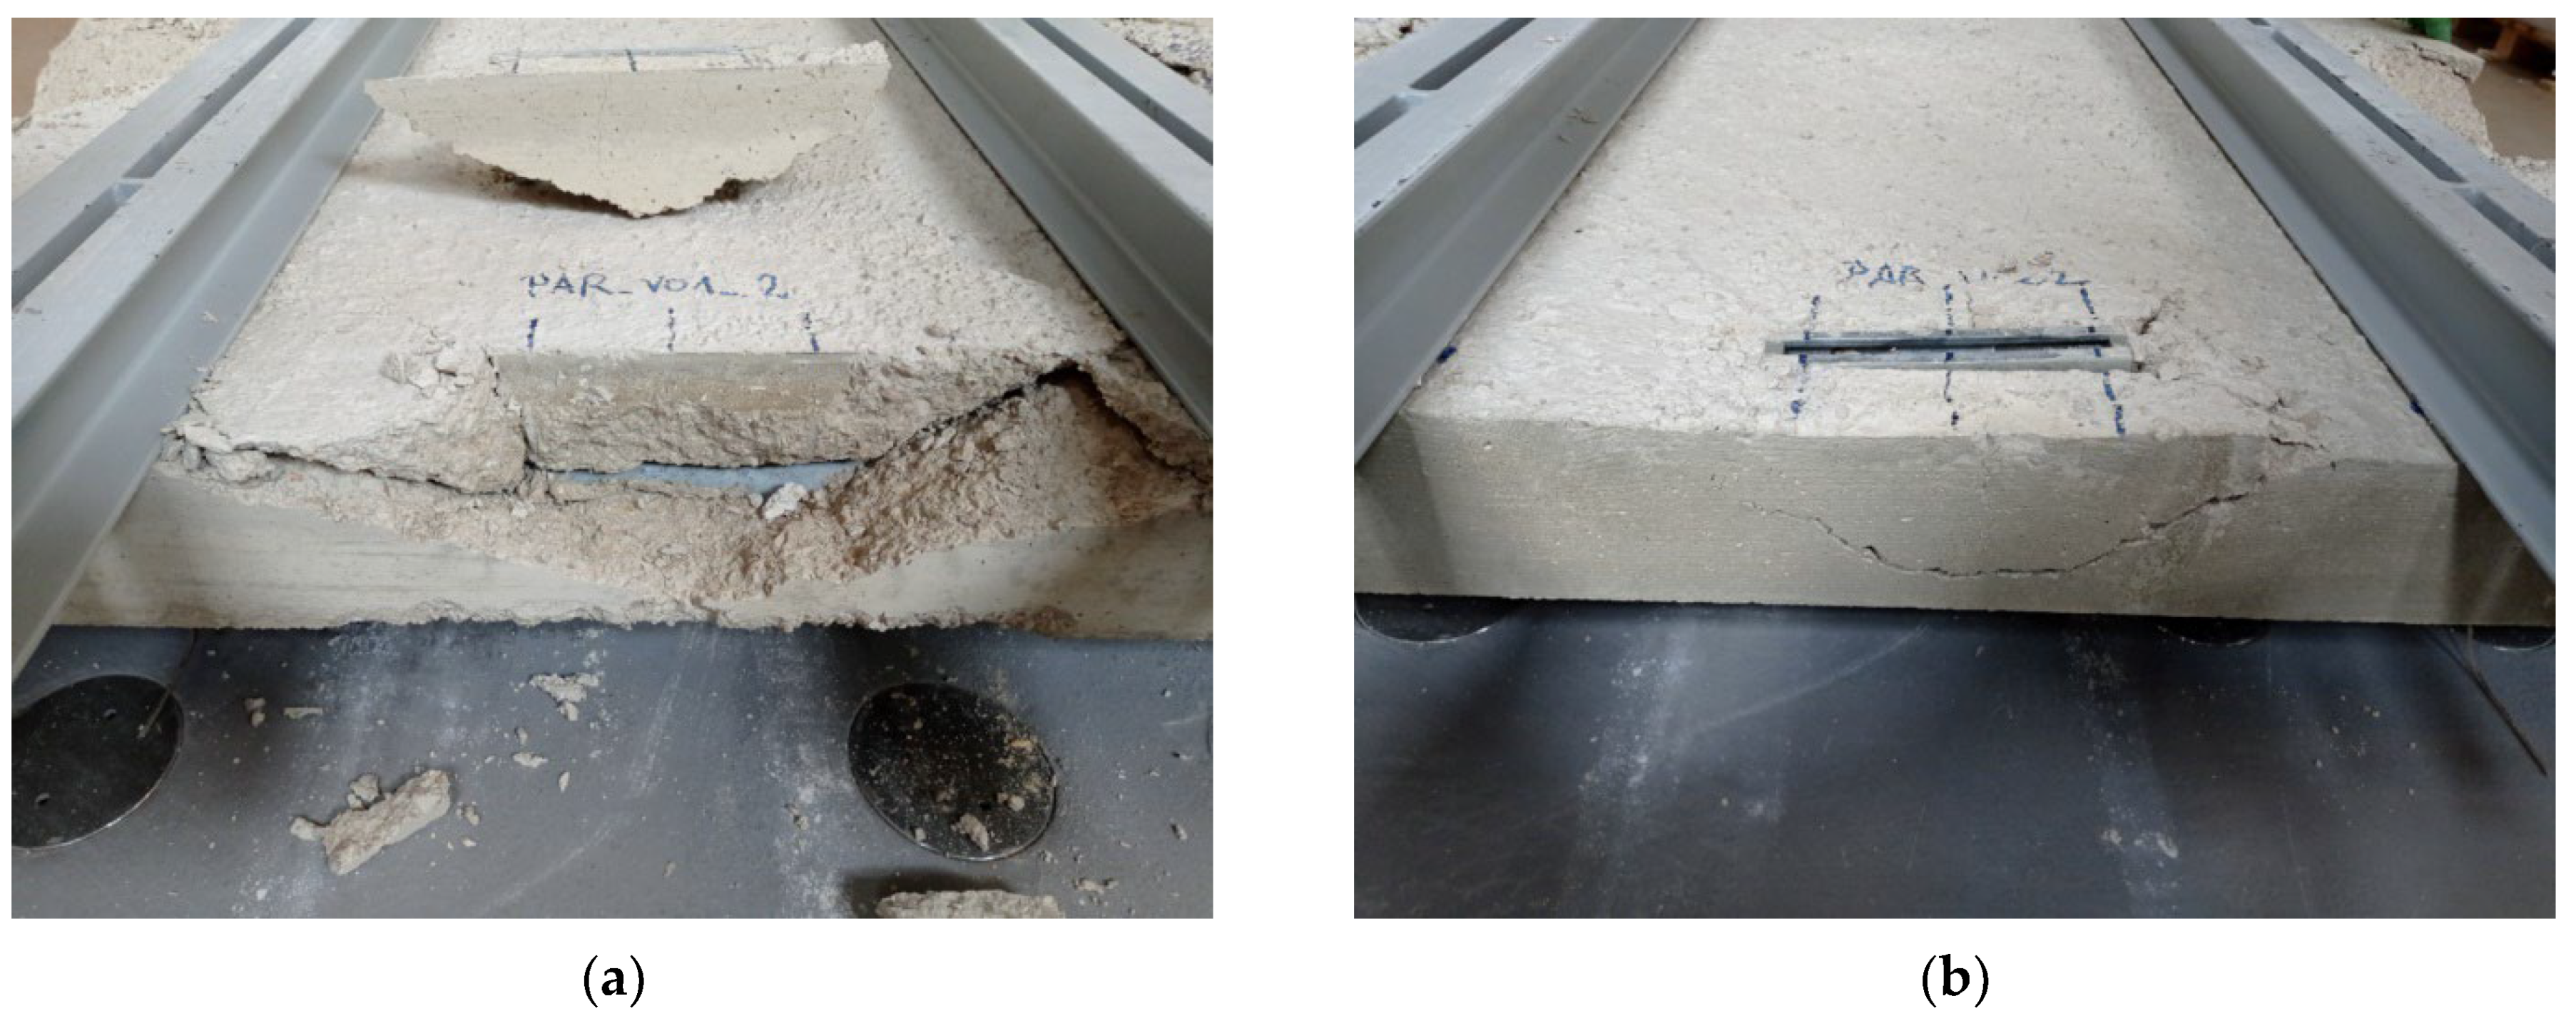
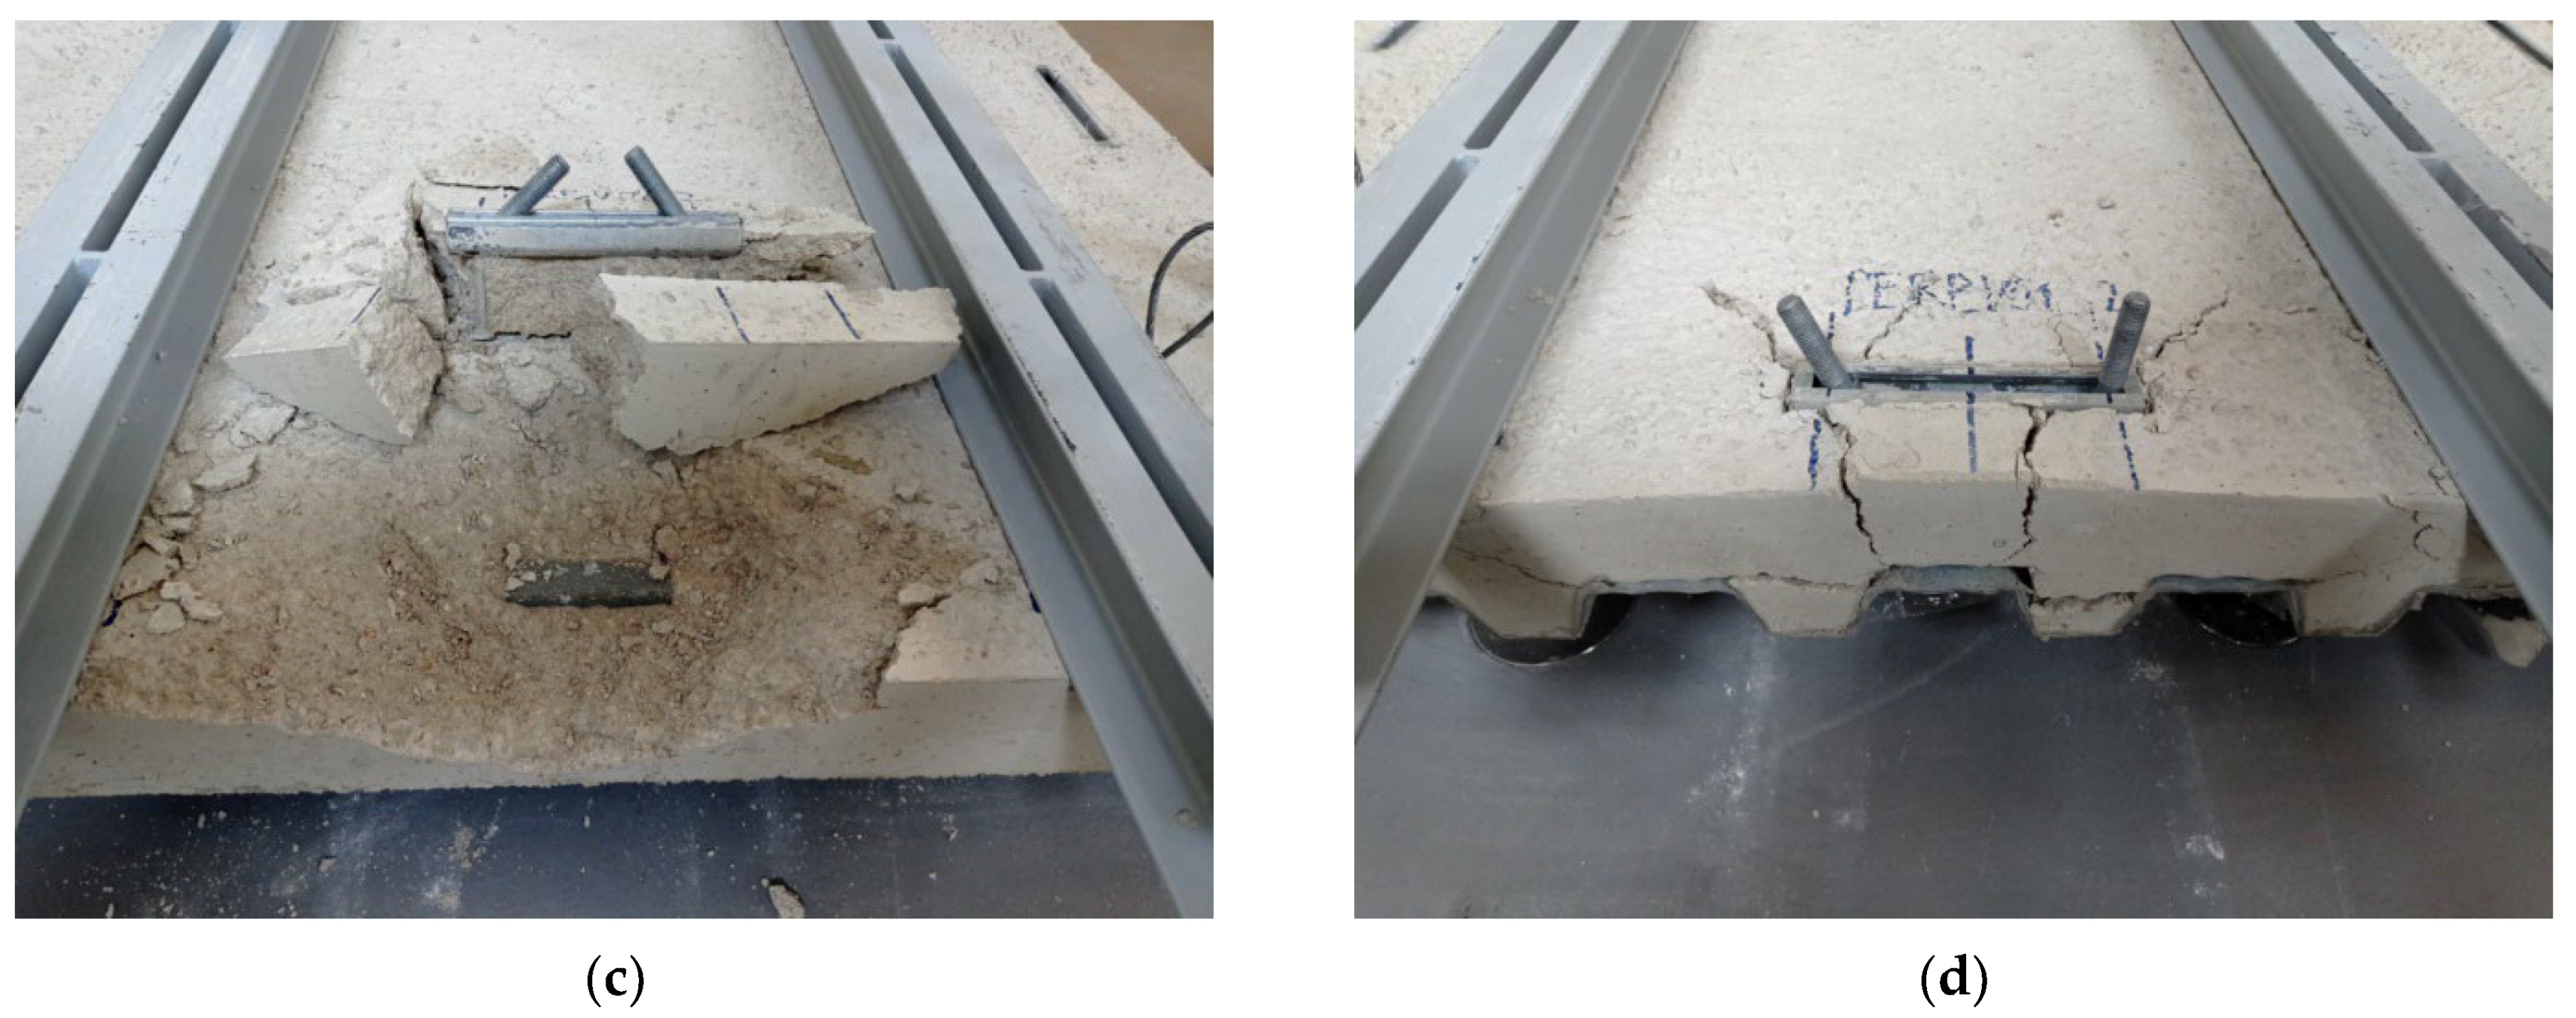
5. Experimental Results

In an experimental test program aiming to verify the numerical results, a total of four configurations in composite slabs in addition to the reference in plain concrete were tested. An example of a composite slab used for testing is shown in Figure 13. The composite slabs had a length of 1800 mm, a width of 1700 mm and a thickness of 150 mm, whereas a Cofraplus 60 profiled steel decking was used. Using all four edges of the composite slabs resulted in two anchor channels in parallel and in two anchor channels perpendicular to the decking profile in each slab. The large amount of reinforcement visible in Figure 13 was placed outside of the possible breakout bodies and was aimed to avoid any kind of splitting or corner influence, but also to avoid the influence of possible cracks on the subsequent tests. The reference plain concrete slab was squared with a length of 1800 mm and the same overall thickness as composite slabs. The two configurations with a channel parallel to the profiled steel decking were aimed to investigate the behavior in narrower (dw = 25 mm—configuration 1) and wider (dw = 125 mm—configuration 2) perimeter beams. These tests correspond to the simulations performed within Series 1. For the perpendicular orientation of the steel decking, the installation in a narrow perimeter beam (dw = 25 mm—configuration 3) was designed according to Series 2, whereas the installation over the profile (configuration 4) was designed to validate the numerical results obtained in Series 3.
Anchor channels (HAC-60 profile provided by the company Hilti [20]) equipped with two anchors at a distance of s = 200 mm were utilized. The edge distance c1 = 100 mm and the embedment depth hef = 106 mm were chosen. The tests were performed in accordance with EAD [17] at the laboratory of the Faculty of Civil Engineering in Rijeka, Croatia. The experimental setup was the same as depicted in Figure 2a. A constant displacement rate of 0.05 mm/s was applied and controlled by machine stroke. All slabs were made of the same batch of a low-strength concrete. Crushed (edged) aggregate with a maximum size of 16 mm was used. The tests were performed approximately a month after casting, and in the meantime, the slabs were stored in the laboratory. The concrete compressive strength of fcc = 20.80 N/mm2 (the corresponding fc = 16.64 N/mm2) was measured on 3 cubes (150 mm × 150 mm × 150 mm) with a coefficient of variation of CoV = 5.98% at the time of testing.
The test results are summarized in Table 7. Configuration 1 was one of the most critical configurations with a relative capacity of 0.71. This result is consistent with the numerical results obtained in Series 1, wherein the largest reductions were observed for dw < 30 mm. As shown in Figure 14a, the crack ran directly into the steel decking as the anchor heads were placed near the steel decking, resulting in a smaller breakout body. The installation parallel to the steel decking in a 225 mm-wide perimeter beam (configuration 2) was the most favorable configuration. The reduction of 10% can be attributed to the reduced flexural stiffness of the slab due to the presence of the steel decking at the distance of dw = 125 mm with only minor influence on the breakout size, as shown in Figure 14b. It should be noted that this result agrees well with the numerical results in Series 1 for larger distances dw. A very similar relative capacity of 0.87 was also observed for the anchor channels placed in a narrow perimeter beam and perpendicular orientation of the steel decking (configuration 3). A greater reduction might have been expected; however, the anchors were placed in the direction of the ribs, right in the area of major stiffness of the composite slab. Thus, the anchor heads were not located near voids and consequently, the development of blowout failure was prevented, as shown in Figure 14c. As expected, the most unfavorable configuration was the installation over the profile (configuration 4) with a relative capacity of 0.66 with respect to the mean reference capacity in the plain concrete slab. The breakout pattern, shown in Figure 14d, reveals that the cracks developed at the flange corners were followed by the formation of a typical cone-shaped pattern. This result also agrees well with the numerical results that showed a reduction of approximately 40% for the given embedment depth and symmetric configurations in a slightly thinner composite slab.

6. Design Recommendations

According to the obtained numerical and experimental results, anchor channels in perimeter beams exhibit very similar capacity reduction if they are placed sufficiently far from the steel decking. Therefore, a constant reduction factor, which should be included in Equation (1), is proposed for the installation of anchor channels in perimeter beams:
Ψ c o m , p b , N = 0.8 .
In case the embedment depth exceeds the thickness of the concrete layer above the steel decking, the required distance to preclude the blowout failure is relatively small, i.e., a distance of approximately 30 mm is sufficient according to the results. This rather simple and praxis-oriented proposal leads to the mean simulation-to-prediction value of 1.09 and the corresponding standard deviation of 0.06, as shown in Figure 15a. It should be mentioned that values obtained for dw = 15 mm are not included in statistical evaluation.
For the installation over the decking profile, the capacity reduction is more pronounced in the case of trapezoidal profiles and depends on member thickness. Therefore, the following expression should be considered for this configuration:
Ψ c o m , p , N = h c h ,
where hc represents the thickness of the concrete layer above the steel decking and h is the overall member thickness. The shape of the re-entrant profiles is more favorable in this case and thus a constant factor of 0.8 should be applied. It should be mentioned that for thicker composite slabs the value of 0.8 might be slightly conservative, but in the interest of simplicity, the proposed approach could be considered in design. Again, this proposal results in the acceptable mean value of 1.05 and standard deviation of 0.09, as shown in Figure 15b. Numerical results are summarized in Appendix A.

7. Conclusions

This paper deals with anchor channels loaded in tension in composite slabs with profiled steel decking. An extensive numerical parametric study and a corresponding experimental program were carried out to investigate how the complex geometry of composite slabs affects the capacity of concrete failure modes. In order to cover as many possibilities as possible in practice, the orientation of the steel decking and the position of anchor channels were varied. Based on the numerical and experimental results, the following conclusion can be drawn:
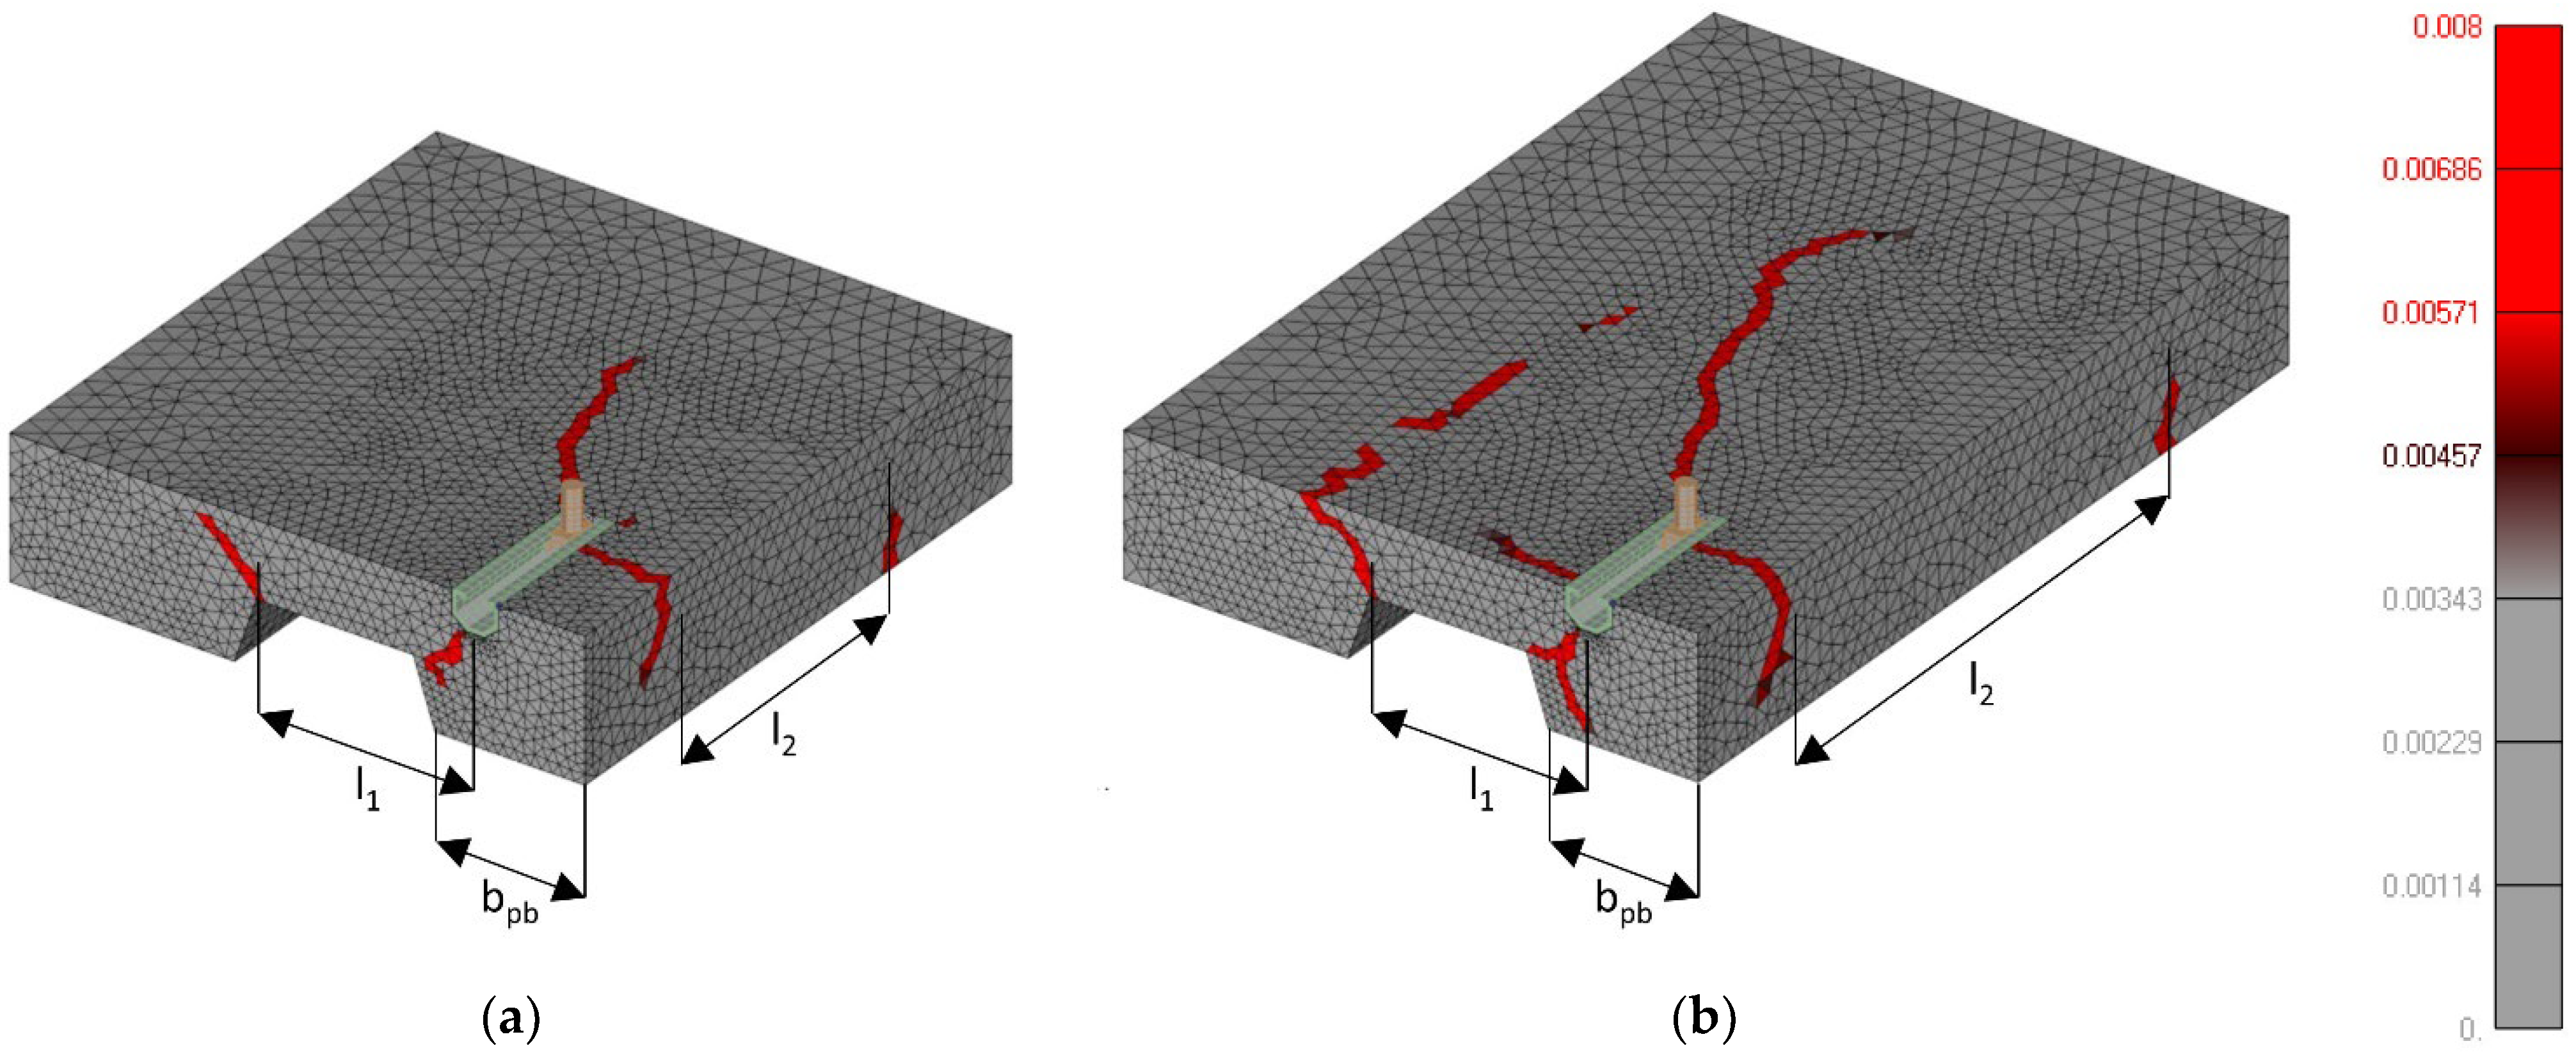
  • The influence of bending affects the concrete capacity of tension-loaded fasteners in thin concrete members. It was shown that the influence of support span is not so pronounced when installed in plain concrete slabs. However, for composite slabs, the influence is significant, and the interaction between the global stresses and the local stresses caused by the fastening system should be considered for further discussion.
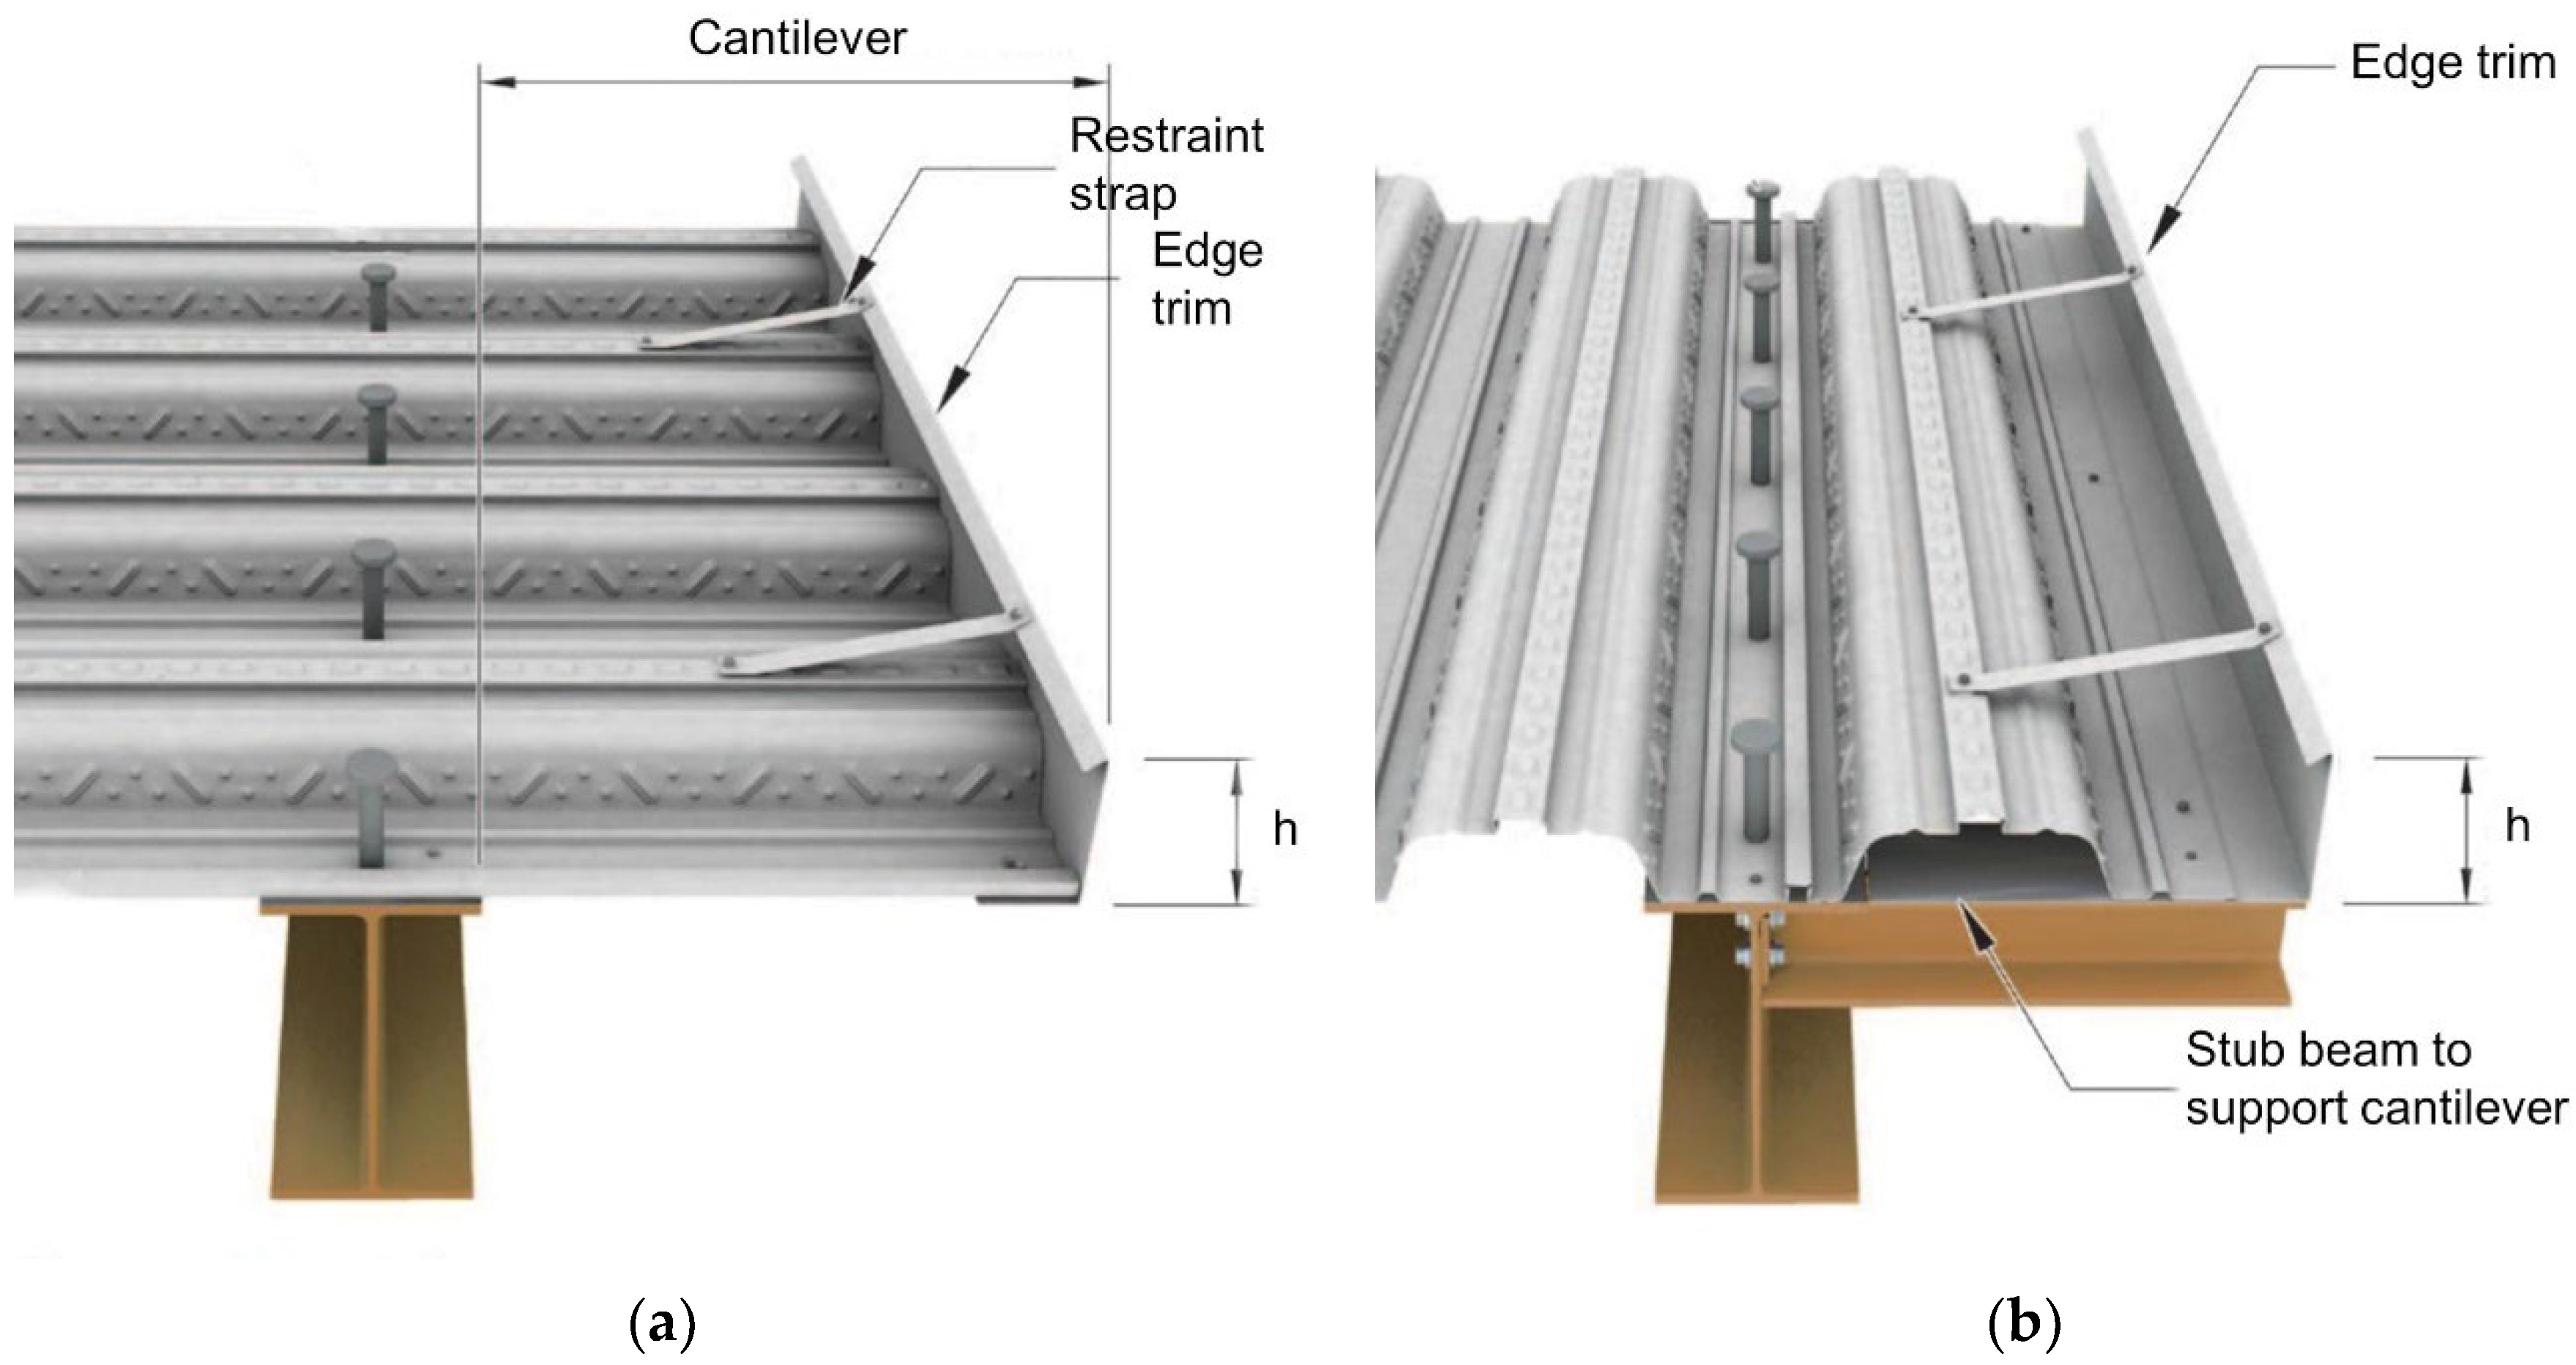
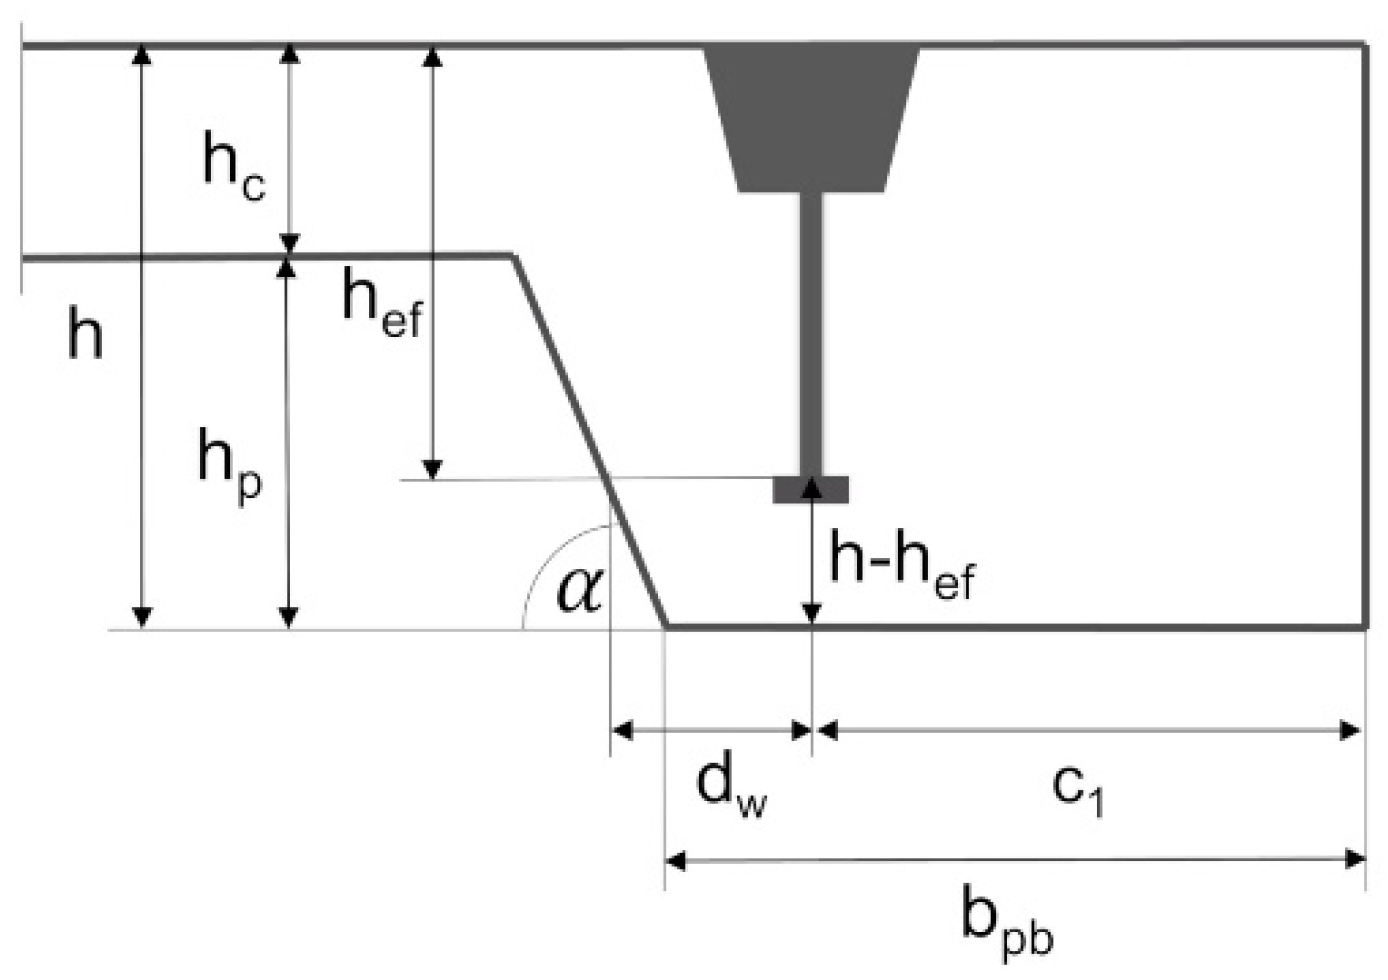
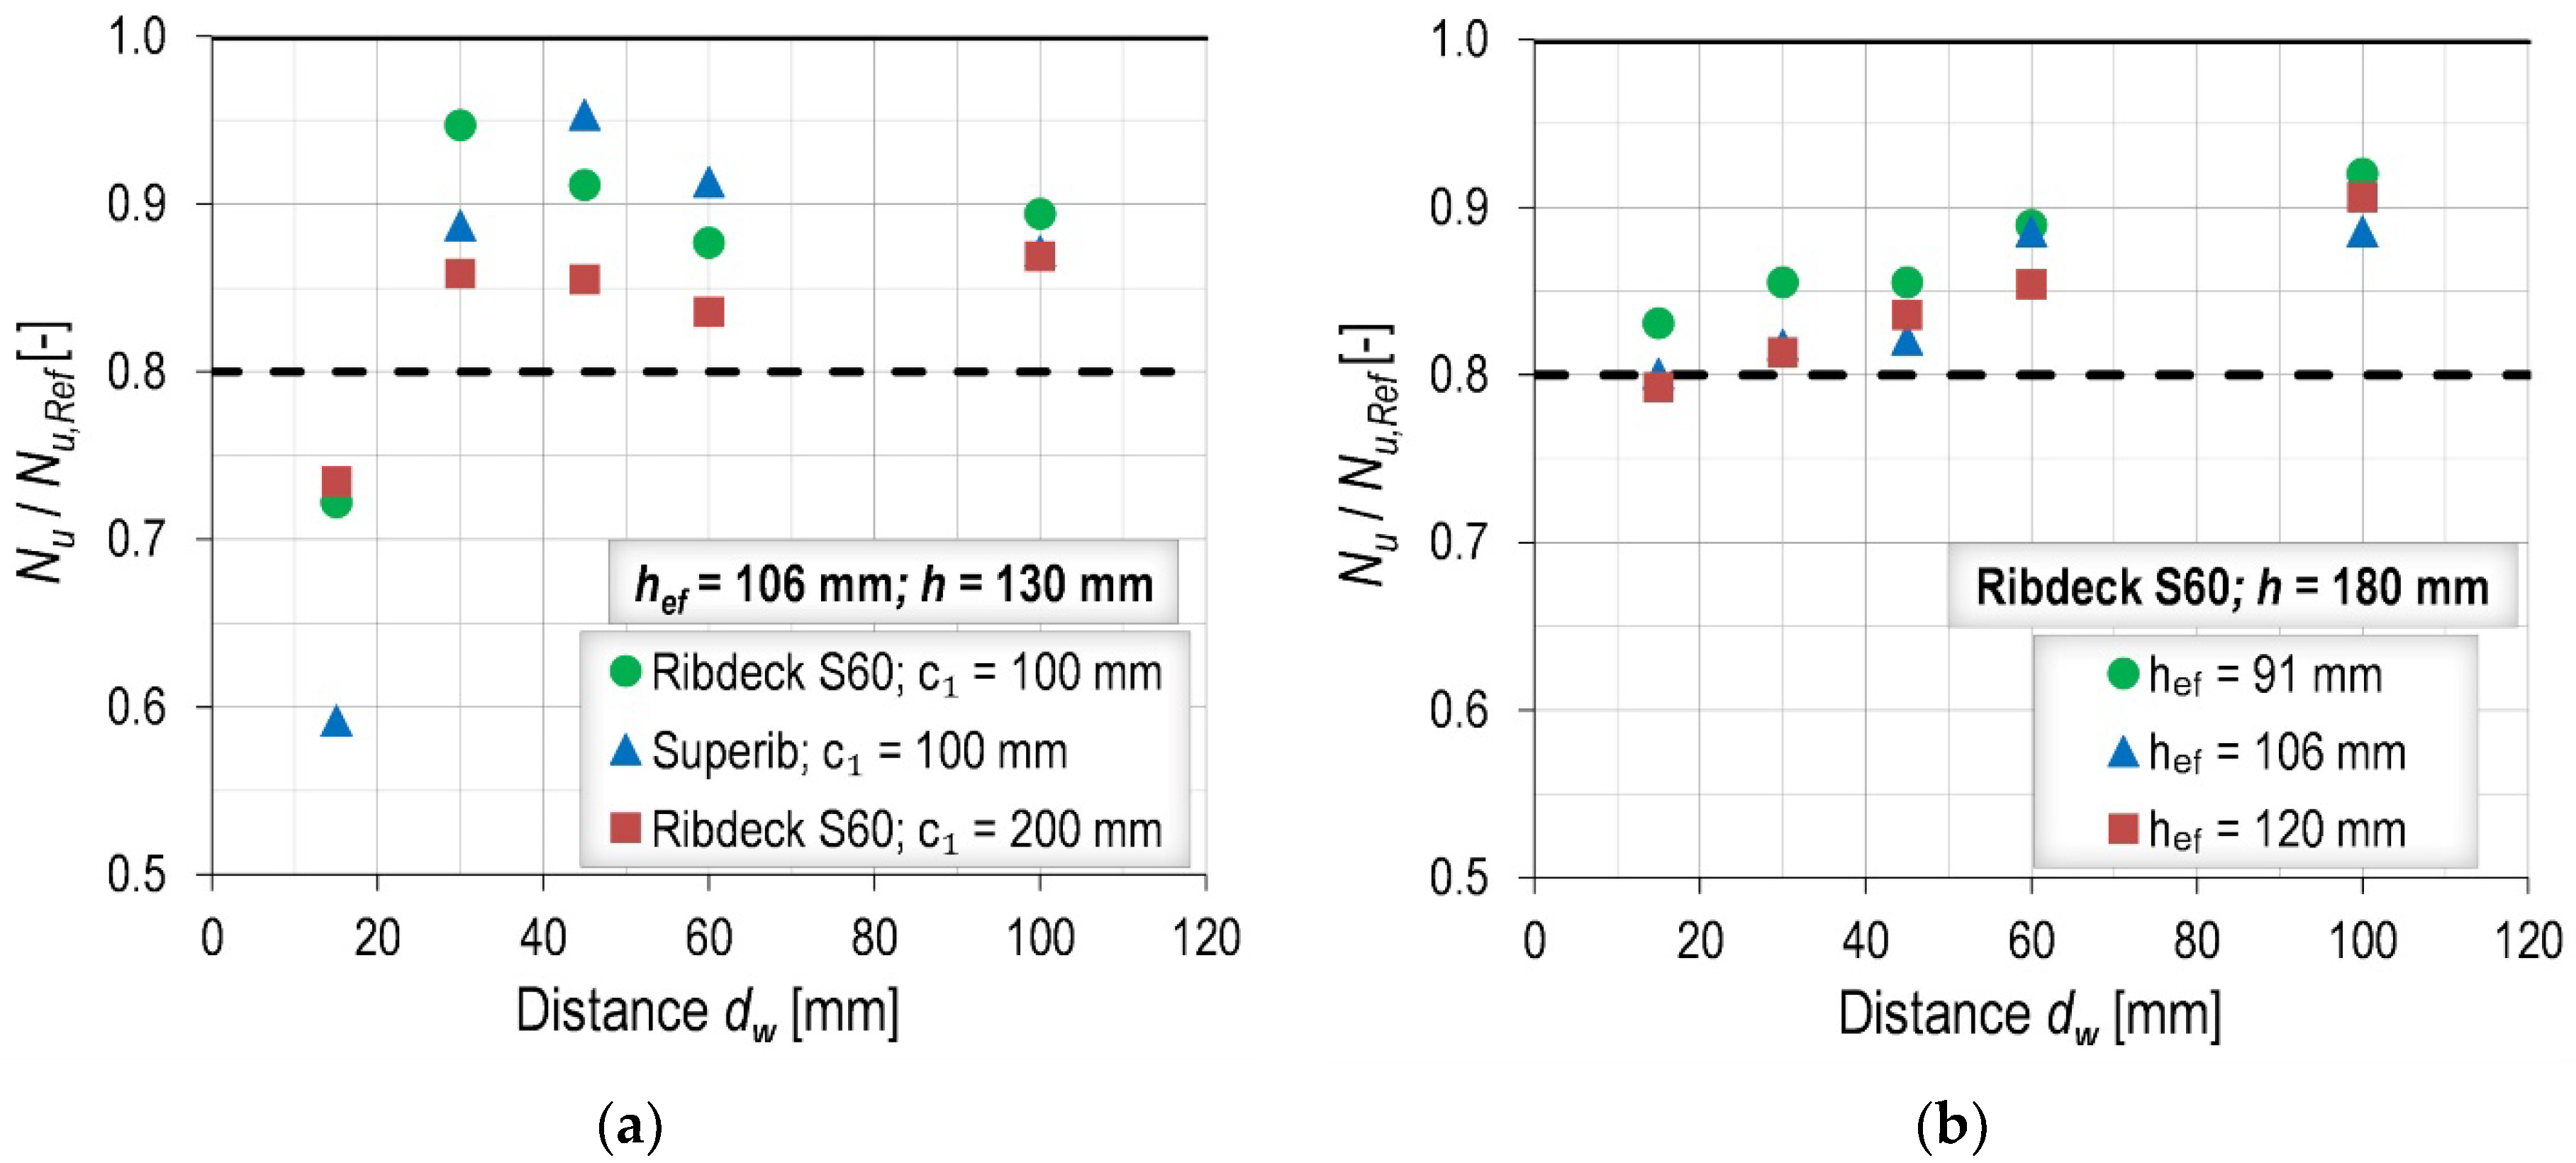
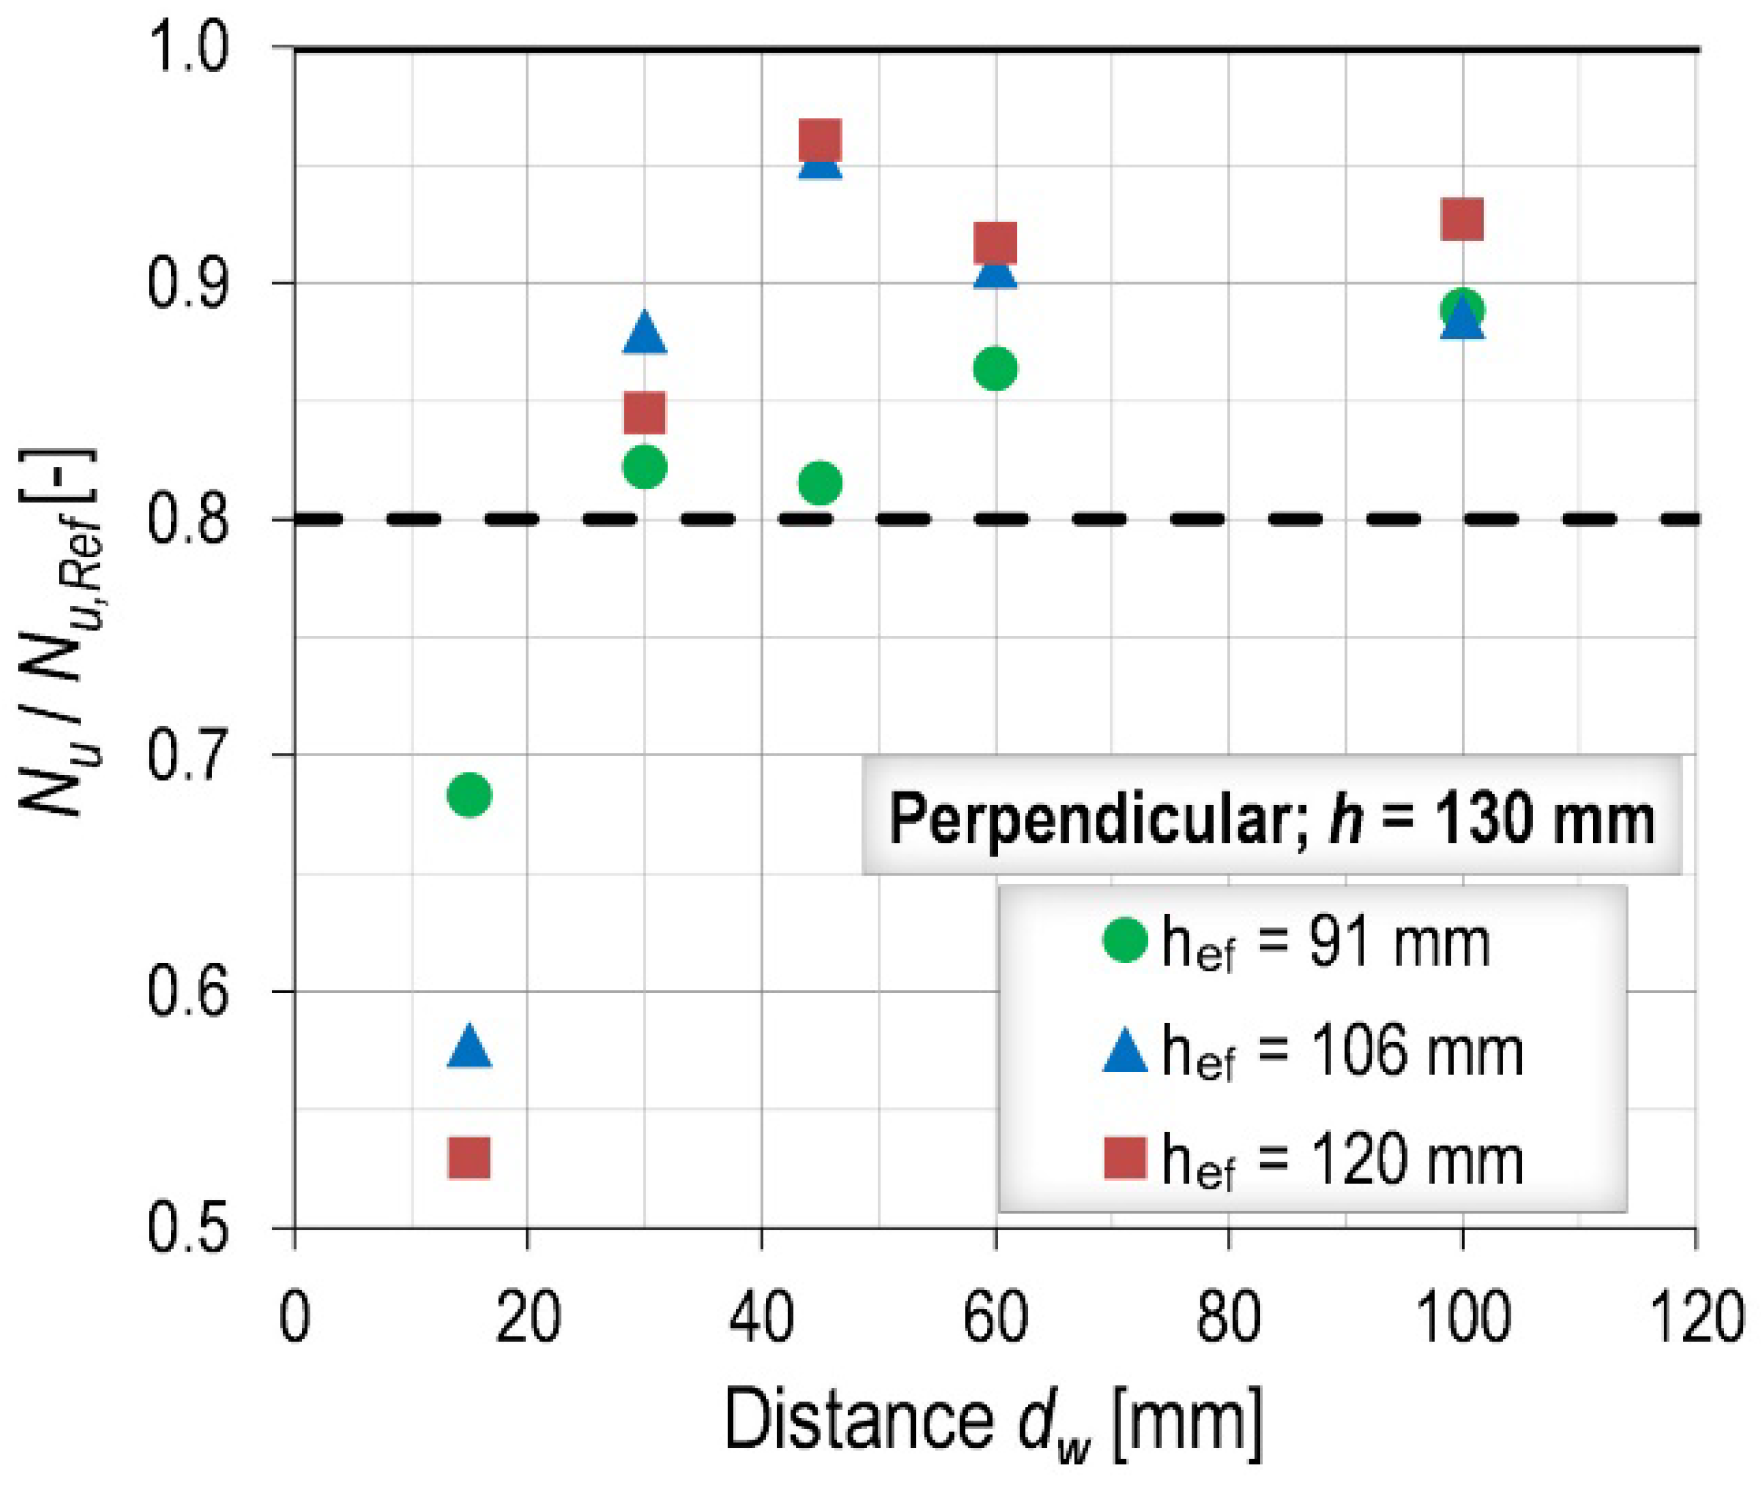
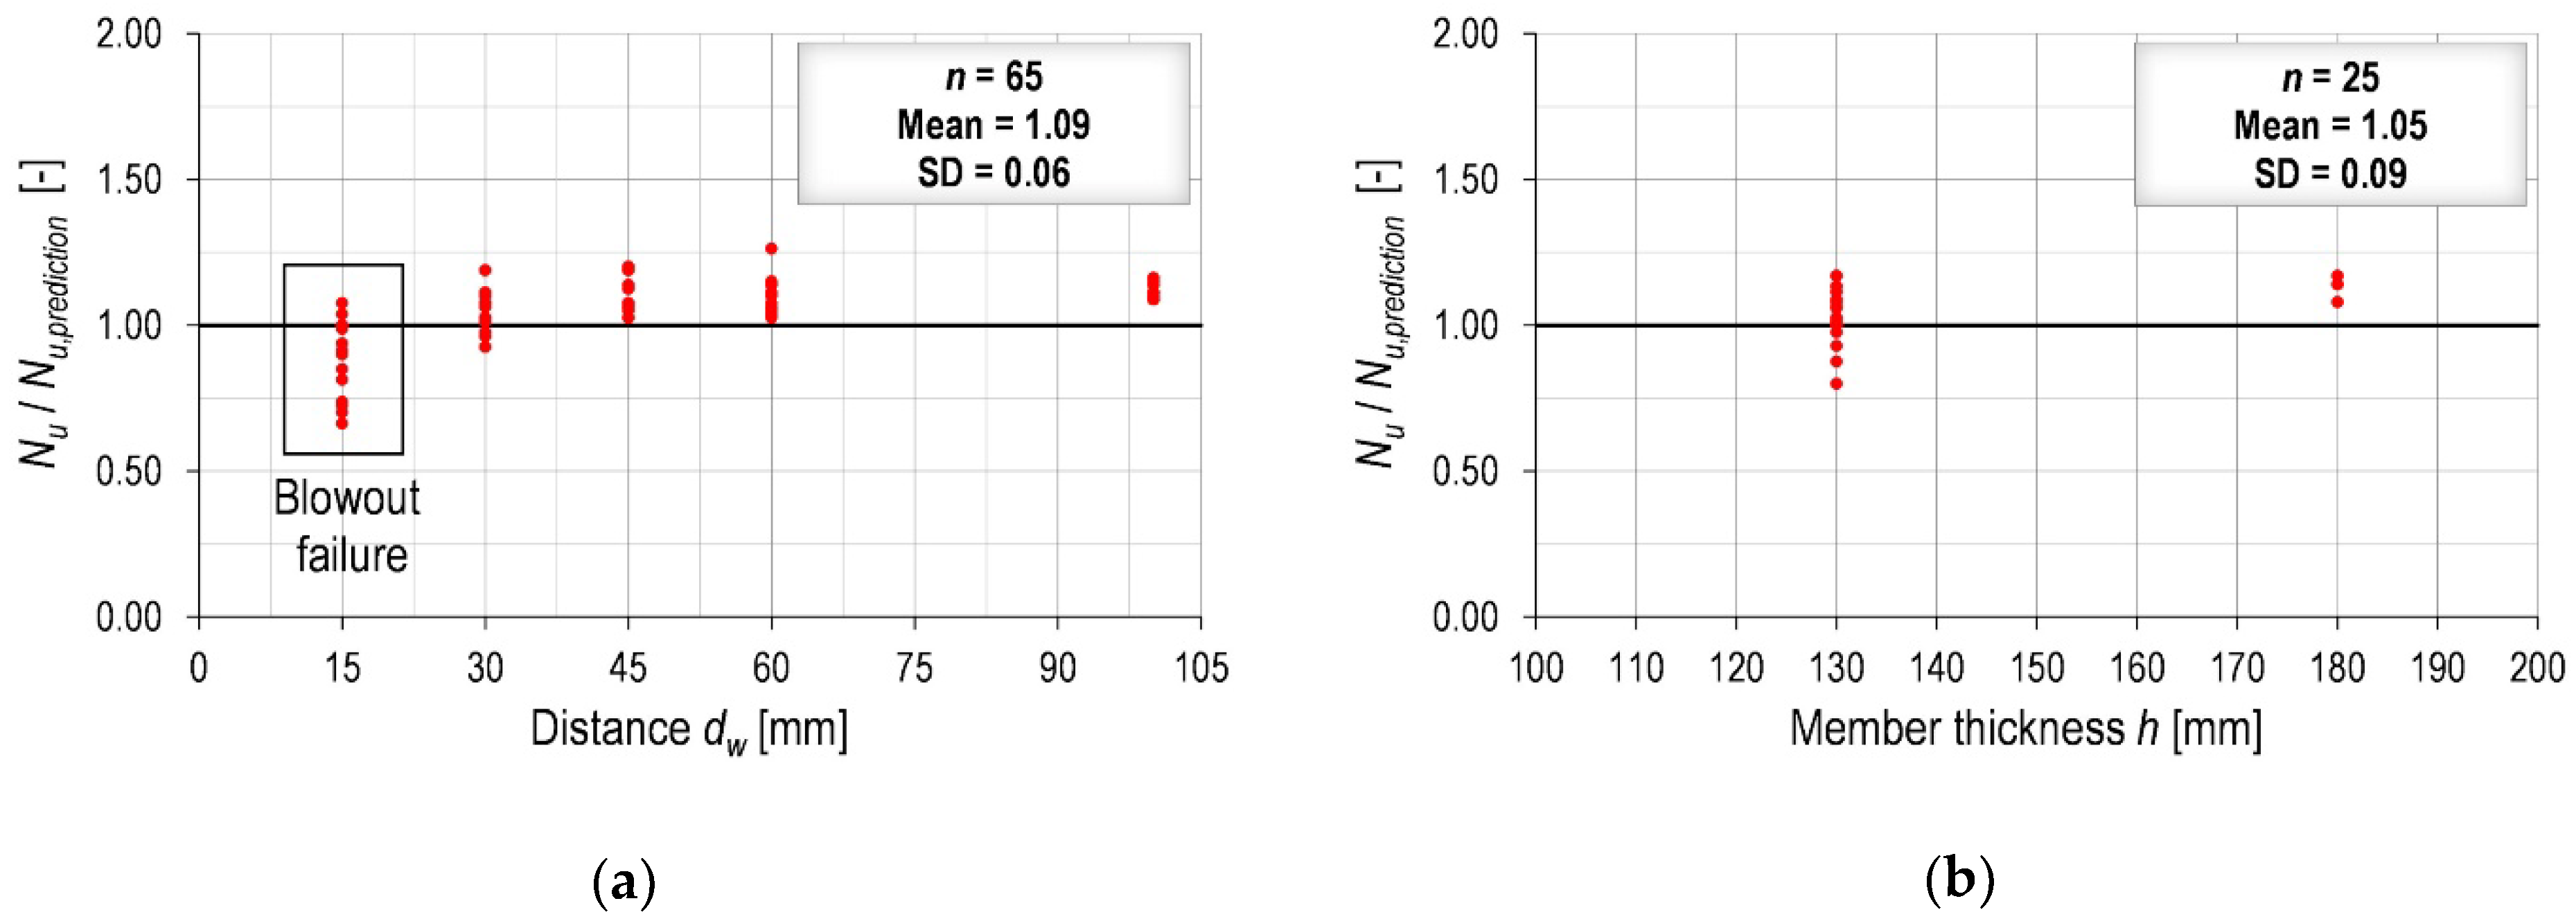
  • When anchor channels are installed in perimeter beams, the orientation of the profiled steel decking does not have a pronounced influence. If anchors are placed sufficiently far from the steel decking, a reduction of up to 20% can be expected for the studied geometry, regardless of the width of the perimeter beam, embedment depth, edge distance or member thickness. Therefore, a constant reduction factor of 0.8 is proposed if the distance between the anchor and the steel decking is sufficient to avoid blowout failure. According to the obtained results, this distance should be dw > 30 mm.
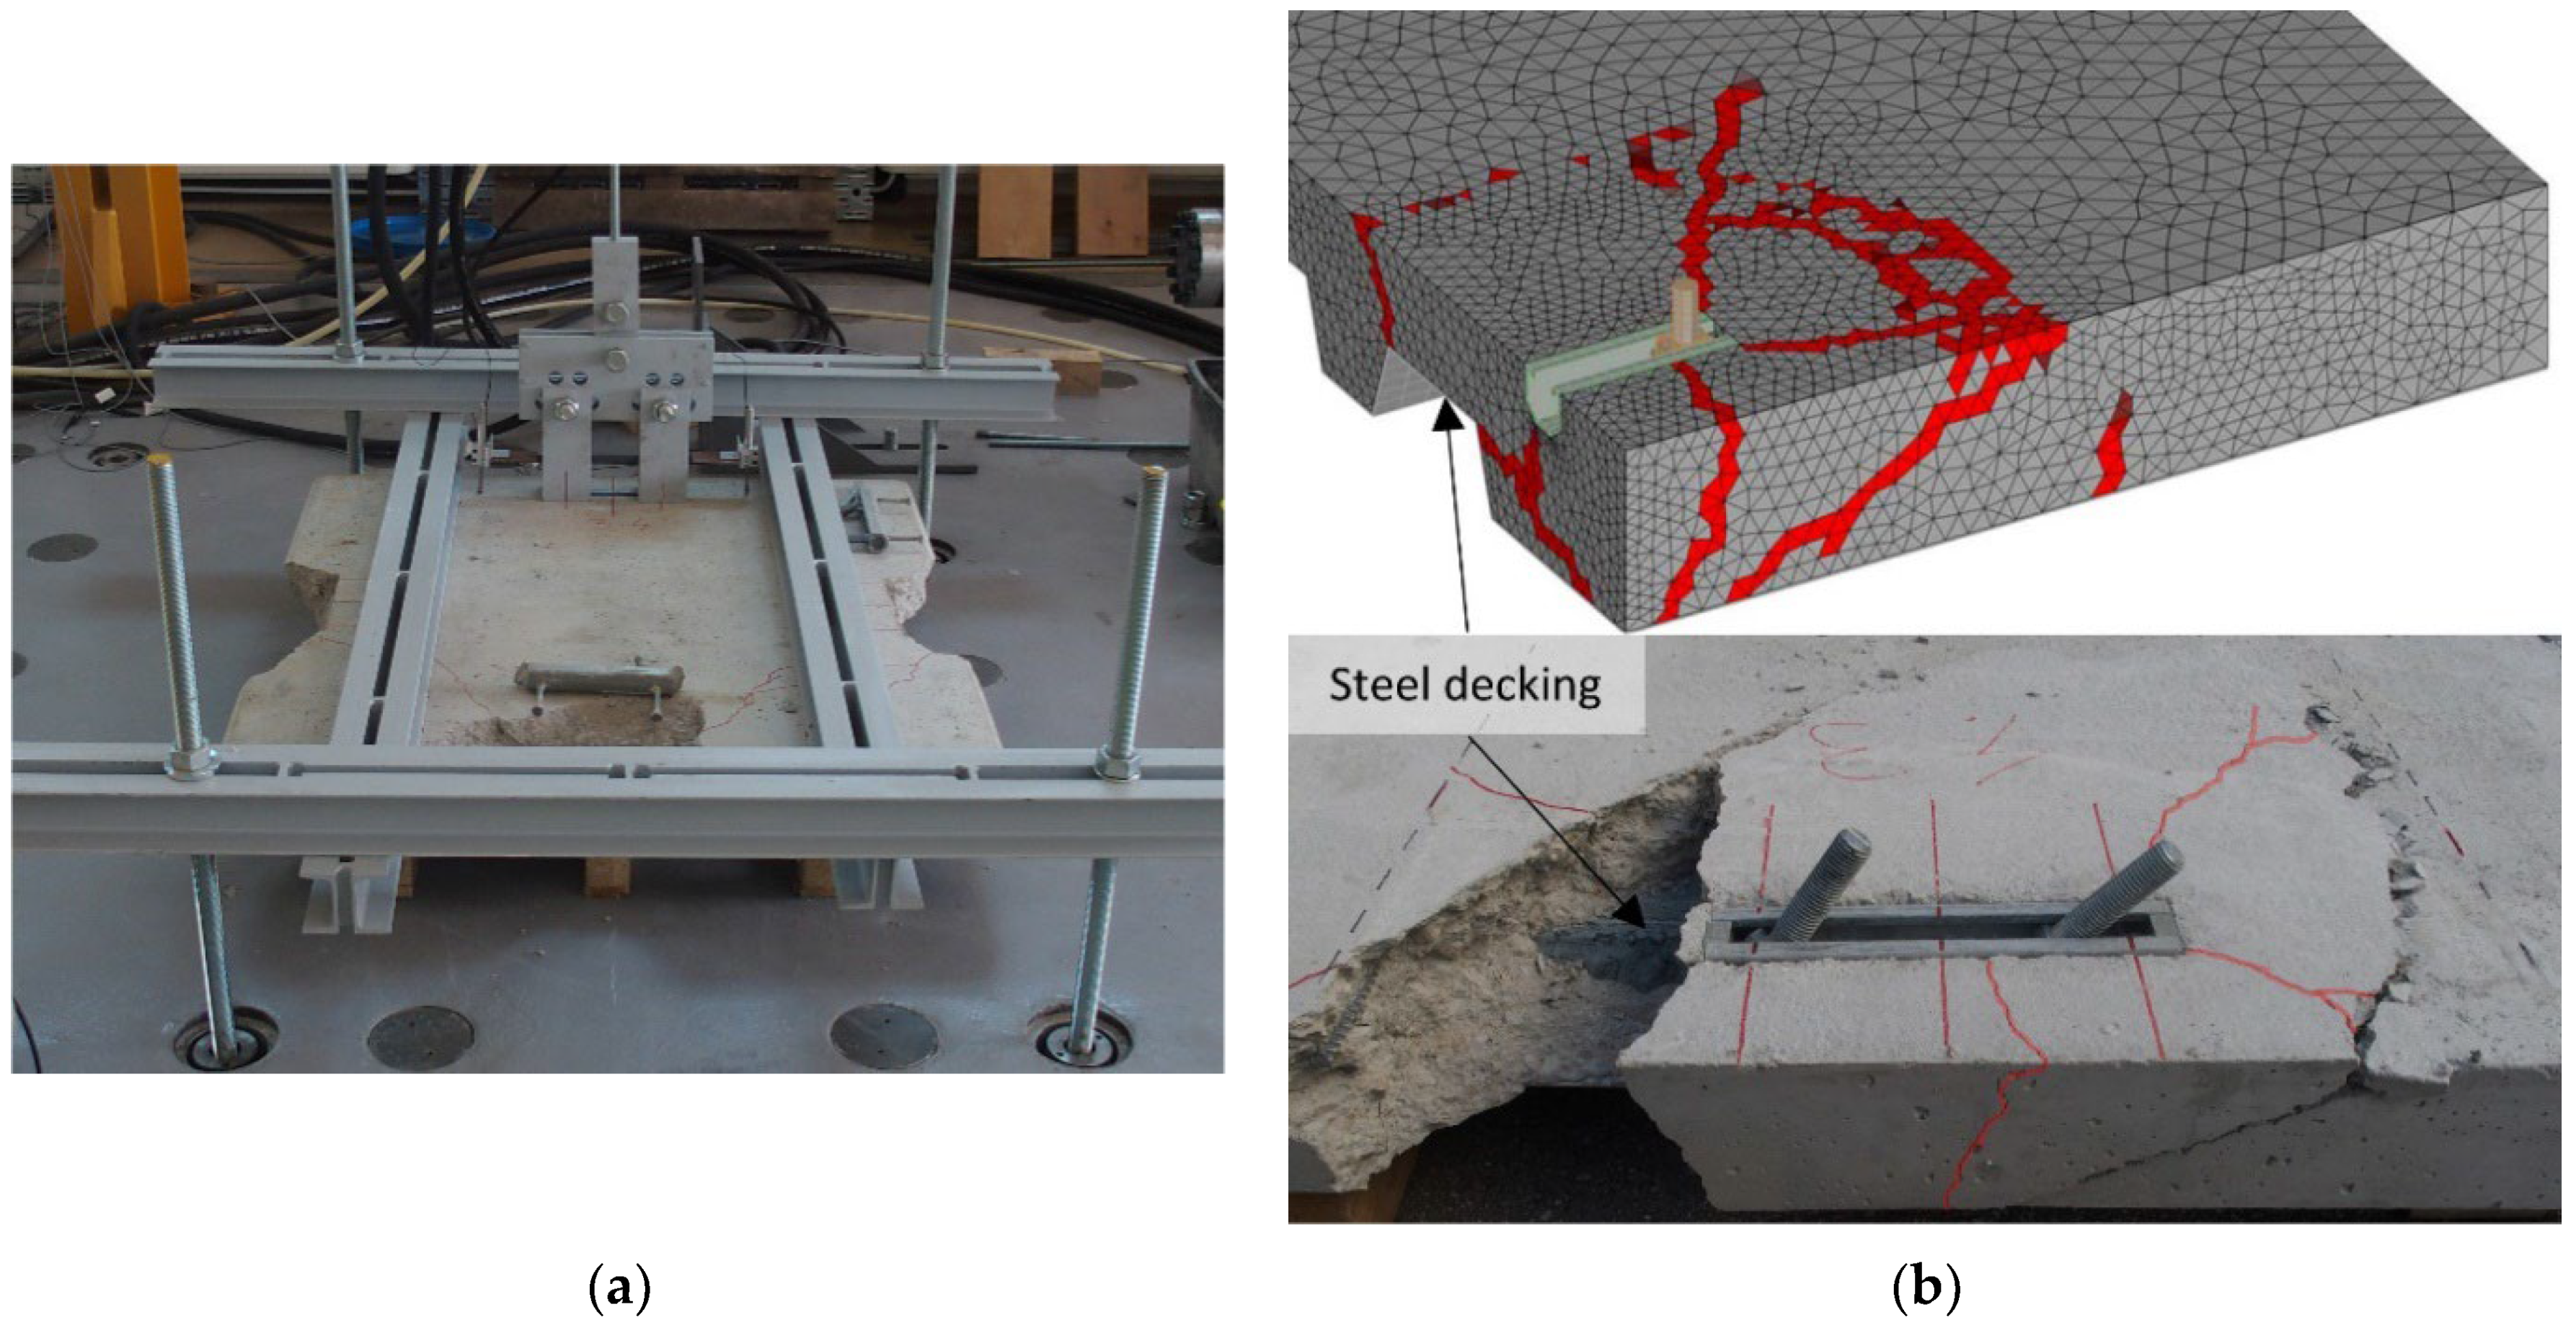
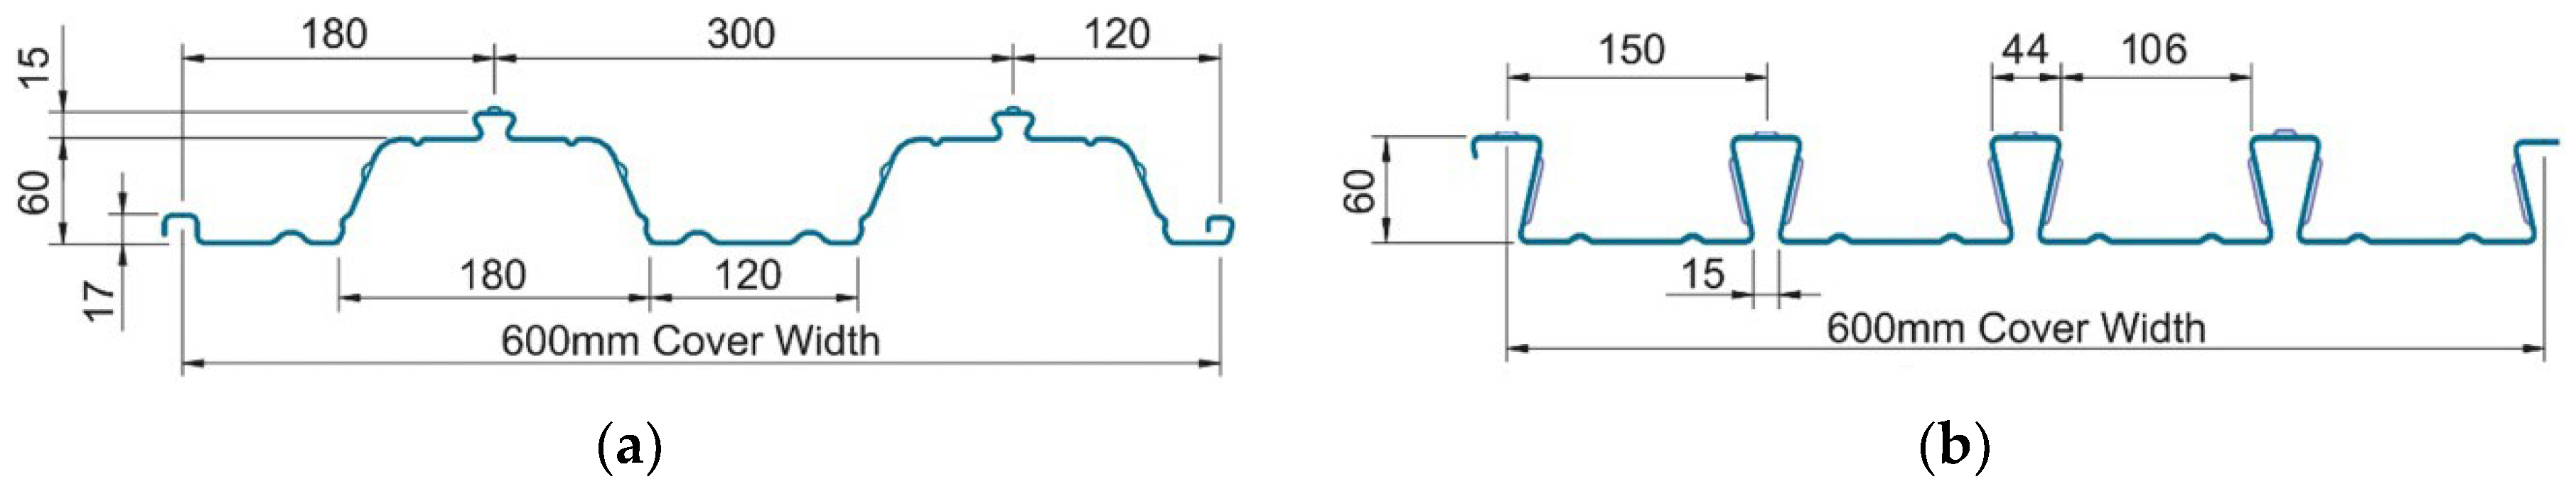
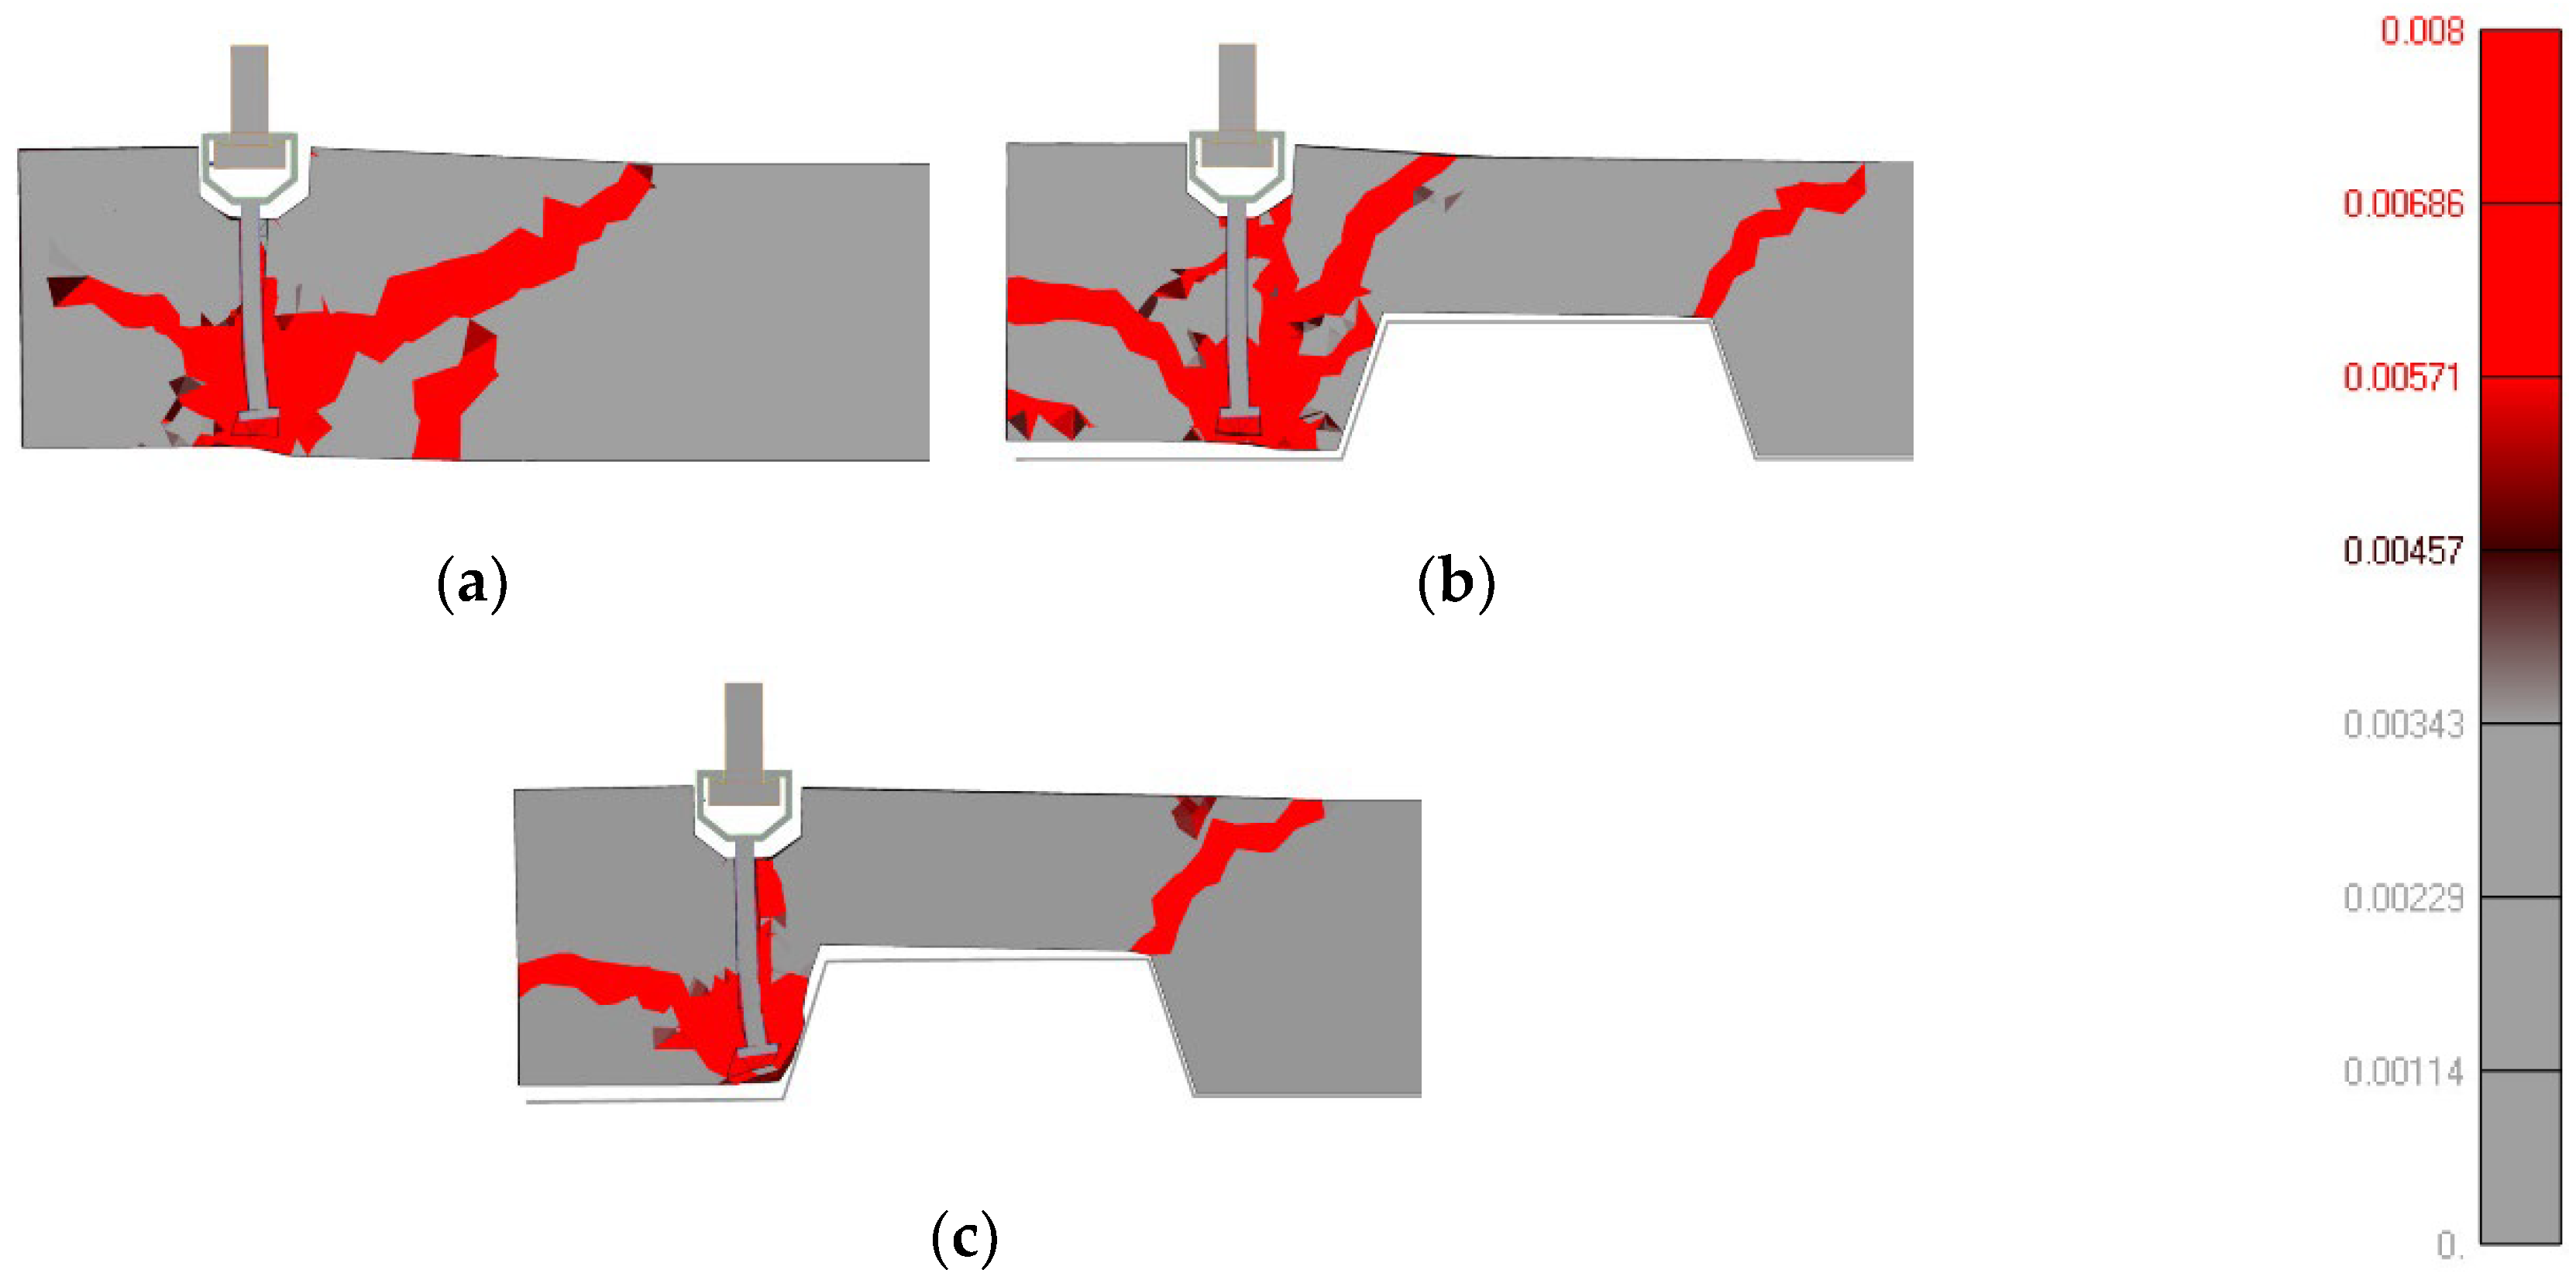
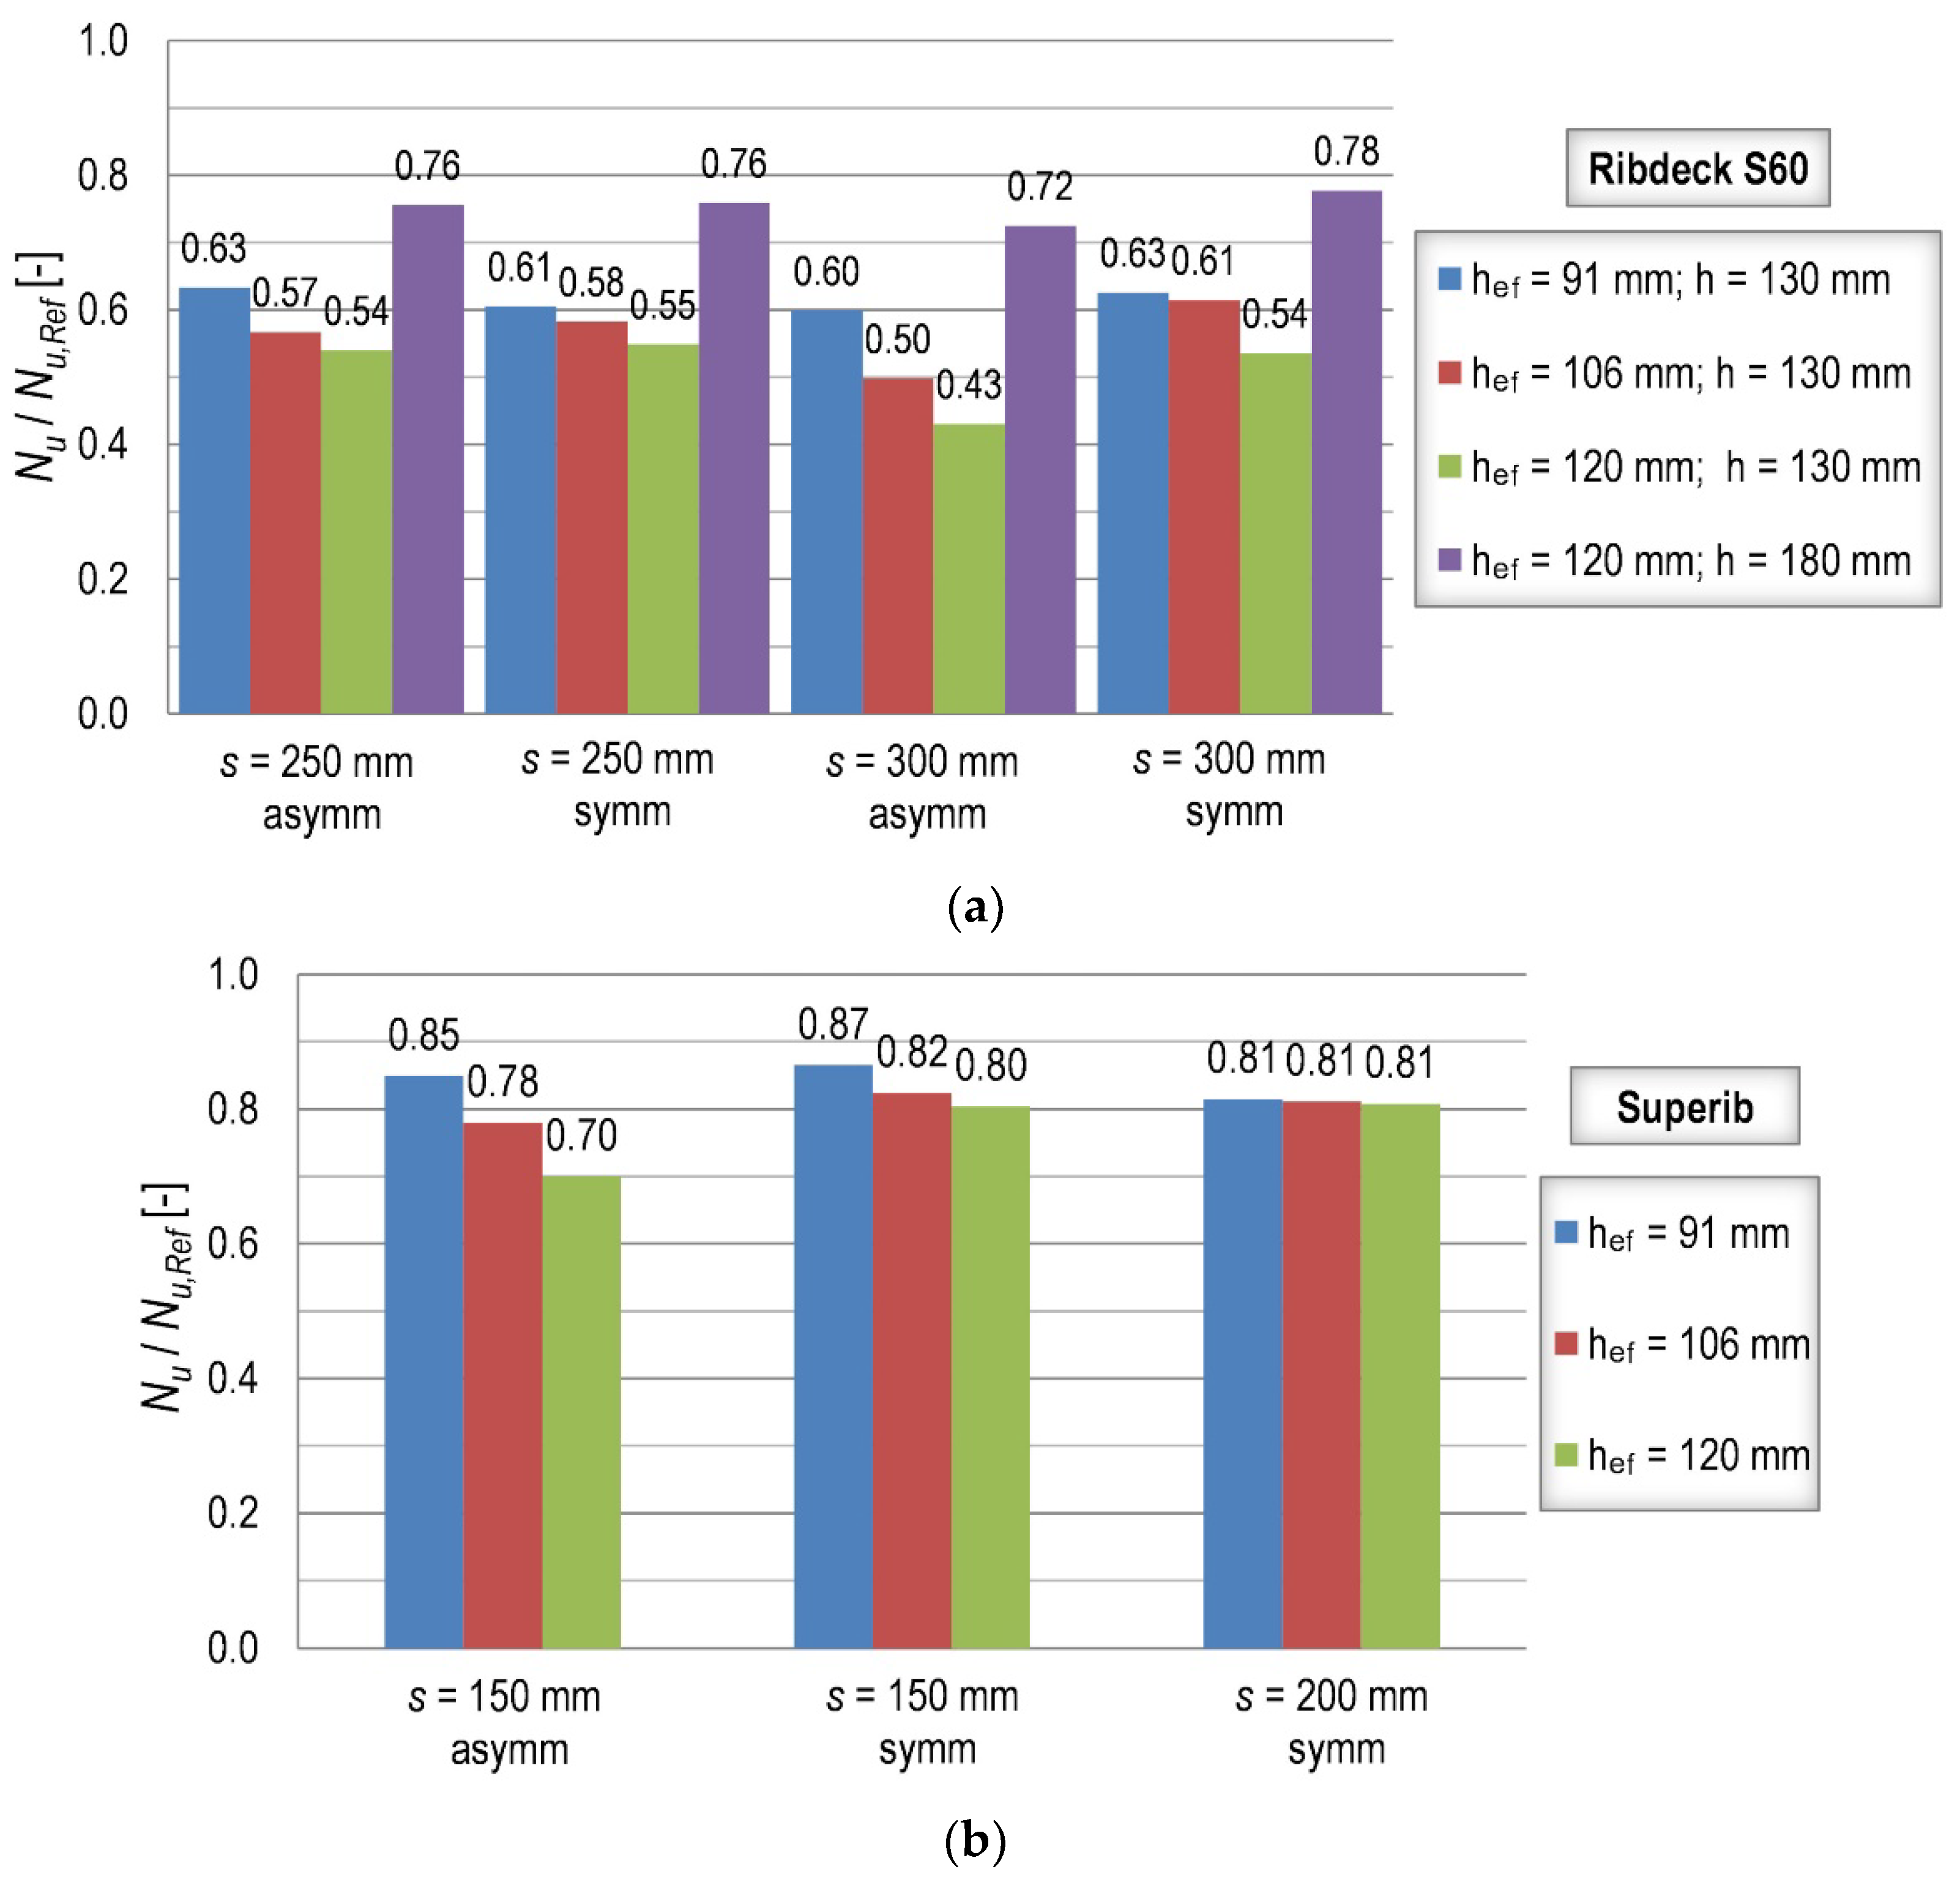
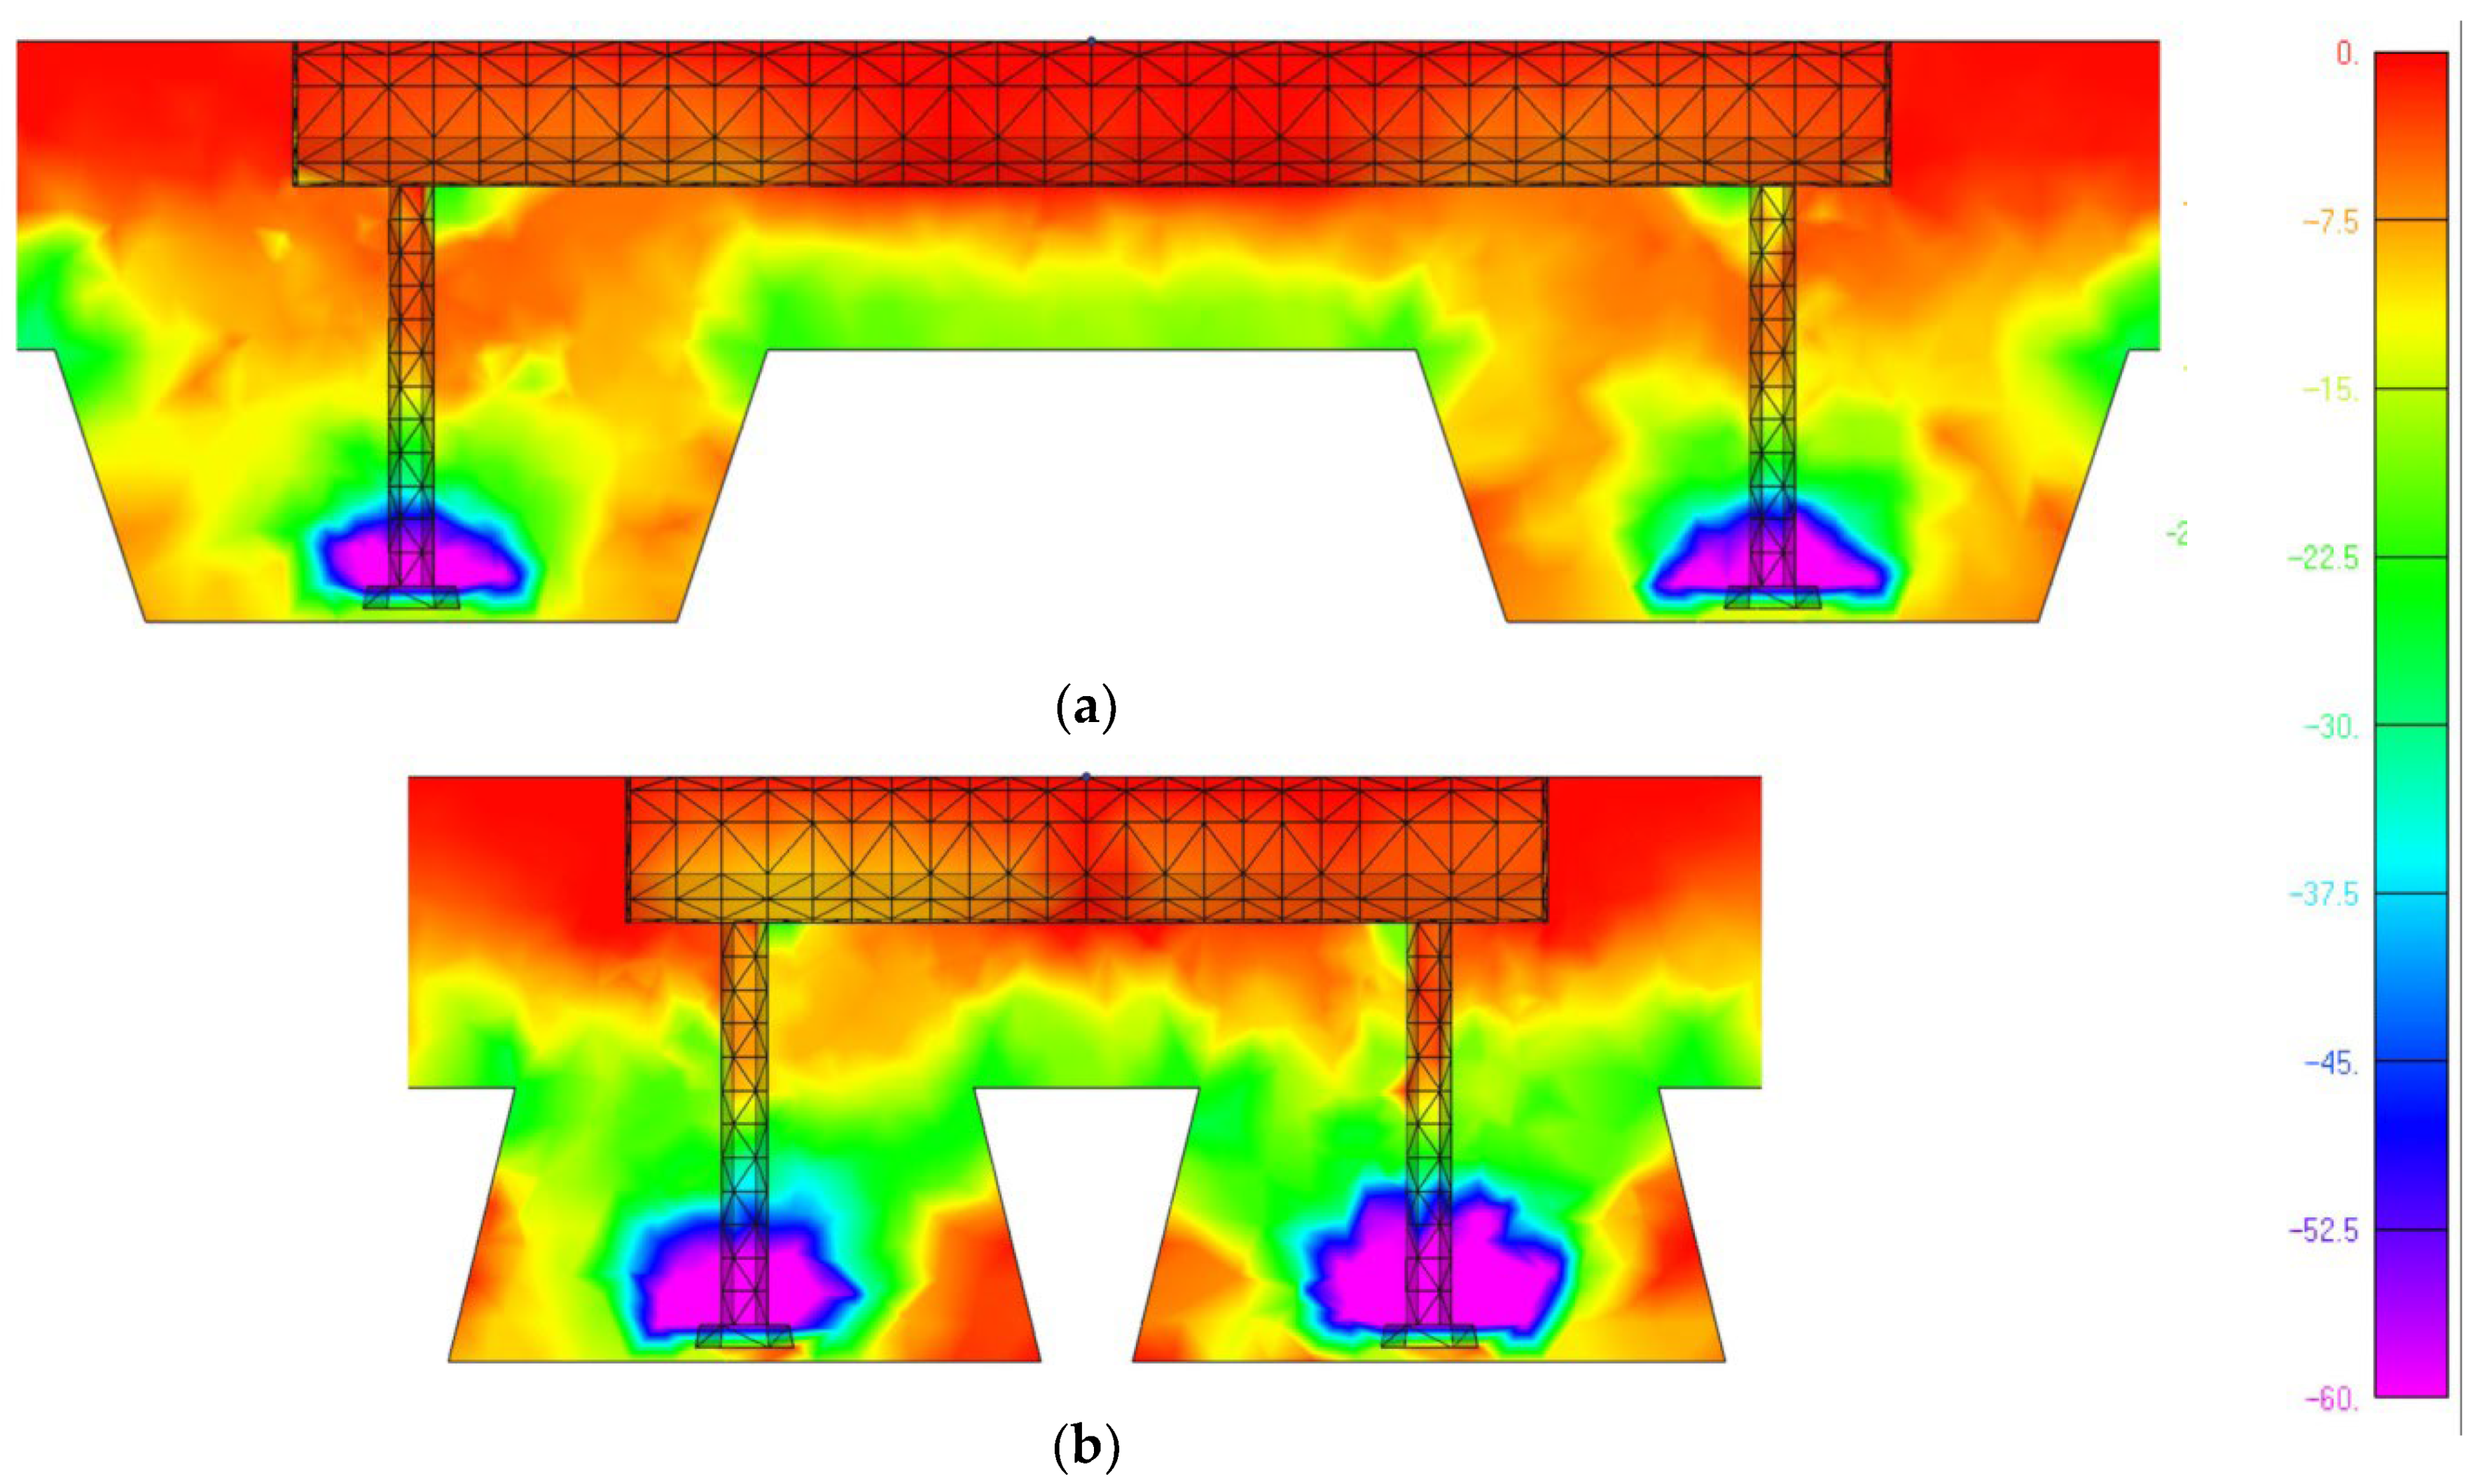
  • Installation over the steel decking is the most critical position, especially in the case of composite slabs with trapezoidal profiles. For a common thickness of 130 mm, capacity reductions of up to approximately 50% compared to a plain concrete slab are possible for trapezoidal profiles. The influence of the anchor position is minor, as well as the influence of embedment depth. However, the influence of member thickness cannot be neglected in this case. Therefore, a modification factor based on the thickness of the concrete layer above the steel decking and the overall member thickness is proposed. For re-entrant profiles, a constant factor of 0.8 can be adopted as their shape enhances concrete capacity.
  • Given the complexity of the topic, the obtained test results can be considered as the first evidence. In order to optimize the design method, further experimental investigations are recommended in the future.

Author Contributions

Conceptualization, A.B., D.C. and J.O.; methodology, A.B., D.C. and J.O.; software, J.O.; validation, A.B.; formal analysis, A.B.; investigation, A.B., D.C. and J.O.; resources, A.B. and D.C.; data curation, A.B.; writing—original draft preparation, A.B.; writing—review and editing, D.C. and J.O.; visualization, A.B.; supervision, J.O.; project administration, D.C.; funding acquisition, D.C. and J.O. All authors have read and agreed to the published version of the manuscript.

Funding

This research was funded by HILTI AG, Principality of Liechtenstein—grant number: ACCS_2019_1.

Data Availability Statement

Data within the article are available from the corresponding author on request.

Acknowledgments

The authors are grateful to Hilti Corporation, 9494 Schaan, Liechtenstein, for financial support and especially to Philipp Grosser for their valuable contribution. The authors are also grateful to RI-ISA d.o.o, 51000 Rijeka, Croatia, a member of Permasteelisa Group, for sharing information about the challenges in the design of anchor channels in composite slabs and the relevant configurations for real applications. The authors are thankful to GP Krk d.d. for the preparation of specimens and the lab technician Dominik Štrok for his help in the experimental part of the investigation. Testing equipment at the Faculty of Civil Engineering in Rijeka was purchased under the project Research Infrastructure for Campus-based Laboratories at the University of Rijeka, number RC.2.2.06-0001, which was co-funded by the European Fund for Regional Development (ERDF).

Conflicts of Interest

The authors declare no conflict of interest.

Appendix A

Table A1. Numerical results—plain concrete slabs (reference models, fc = 20 N/mm2).
c1
(mm)
hef
(mm)
h
(mm)
s
(mm)
Nu
(kN)
1009113030073.96
1009113025067.98
1009113020064.51
1009113015059.34
1009118025075.09
10010613030079.08
10010613025073.45
10010613020073.19
10010613015068.21
10010618025087.29
20010613025087.72
10012013030086.79
10012013025080.20
10012013020078.46
10012013015076.13
100120180300107.42
10012018025098.72
Table A2. Numerical results—Series 1 (fc = 20 N/mm2).
c1
(mm)
hef
(mm)
h
(mm)
s
(mm)
Steel Deckingdw
(mm)
Nu
(kN)
Nu/Nu,Ref
(kN)
10091130250Ribdeck S601550.730.75
10091130250Ribdeck S603053.270.78
10091130250Ribdeck S604557.820.85
10091130250Ribdeck S606055.680.82
10091130250Ribdeck S6010059.300.87
10091180250Ribdeck S601562.390.83
10091180250Ribdeck S603064.200.86
10091180250Ribdeck S604564.200.86
10091180250Ribdeck S606066.770.89
10091180250Ribdeck S6010069.090.92
10091130250Superib1544.170.65
10091130250Superib3052.290.77
10091130250Superib4557.730.85
10091130250Superib6056.230.83
10091130250Superib10059.620.88
100106130250Ribdeck S601553.050.72
100106130250Ribdeck S603069.560.95
100106130250Ribdeck S604566.950.91
100106130250Ribdeck S606064.420.88
100106130250Ribdeck S6010065.690.89
100106180250Ribdeck S601569.180.79
100106180250Ribdeck S603070.990.81
100106180250Ribdeck S604572.950.84
100106180250Ribdeck S606074.540.85
100106180250Ribdeck S6010079.080.91
200106130250Ribdeck S601564.450.73
200106130250Ribdeck S603075.310.86
200106130250Ribdeck S604575.000.86
200106130250Ribdeck S606073.320.84
200106130250Ribdeck S6010076.220.87
100106130250Superib1543.490.59
100106130250Superib3065.190.89
100106130250Superib4570.030.95
100106130250Superib6067.090.91
100106130250Superib10064.060.87
100120130250Ribdeck S601568.840.86
100120130250Ribdeck S603076.490.95
100120130250Ribdeck S604577.250.96
100120130250Ribdeck S606073.160.91
100120130250Ribdeck S6010070.510.88
100120180250Ribdeck S601579.040.80
100120180250Ribdeck S603080.760.82
100120180250Ribdeck S604581.070.82
100120180250Ribdeck S606087.410.89
100120180250Ribdeck S6010087.410.89
100120130250Superib1544.560.56
100120130250Superib3059.640.74
100120130250Superib4571.920.90
100120130250Superib6081.221.01
100120130250Superib10069.580.87
Table A3. Numerical results—Series 2 (fc = 20 N/mm2).
c1
(mm)
hef
(mm)
h
(mm)
s
(mm)
Steel Deckingdw
(mm)
Nu
(kN)
Nu/Nu,Ref
(kN)
10091130250Ribdeck S601546.460.68
10091130250Ribdeck S603055.900.82
10091130250Ribdeck S604555.440.82
10091130250Ribdeck S606058.730.86
10091130250Ribdeck S6010060.410.89
100106130250Ribdeck S601542.410.58
100106130250Ribdeck S603064.610.88
100106130250Ribdeck S604570.030.95
100106130250Ribdeck S606066.630.91
100106130250Ribdeck S6010065.050.89
100120130250Ribdeck S601542.460.53
100120130250Ribdeck S603067.770.85
100120130250Ribdeck S604577.020.96
100120130250Ribdeck S606073.550.92
100120130250Ribdeck S6010074.350.93
Table A4. Numerical results—Series 3 (fc = 20 N/mm2).
c1
(mm)
hef
(mm)
h
(mm)
s
(mm)
Steel DeckingConfigurationNu
(kN)
Nu/Nu,Ref
(kN)
10091130250Ribdeck S60Asymmetric43.060.63
10091130250Ribdeck S60Symmetric41.140.61
10091130300Ribdeck S60Asymmetric44.310.60
10091130300Ribdeck S60Symmetric46.300.63
10091130150SuperibAsymmetric50.380.85
10091130150SuperibSymmetric51.350.87
10091130200SuperibSymmetric52.560.81
100106130250Ribdeck S60Asymmetric41.660.57
100106130250Ribdeck S60Symmetric42.820.58
100106130300Ribdeck S60Asymmetric39.380.50
100106130300Ribdeck S60Symmetric48.600.61
100106130150SuperibAsymmetric53.190.78
100106130150SuperibSymmetric56.180.82
100106130200SuperibSymmetric59.390.81
100120130250Ribdeck S60Asymmetric43.300.54
100120130250Ribdeck S60Symmetric44.000.55
100120130300Ribdeck S60Asymmetric37.340.43
100120130300Ribdeck S60Symmetric46.500.54
100120130150SuperibAsymmetric53.320.70
100120130150SuperibSymmetric61.210.80
100120130200SuperibSymmetric63.390.81
100120180250Ribdeck S60Asymmetric74.640.76
100120180250Ribdeck S60Symmetric74.920.76
100120180300Ribdeck S60Asymmetric77.870.72
100120180300Ribdeck S60Symmetric83.490.78

References

  1. Bogdanić, A.; Casucci, D.; Ožbolt, J. Numerical and Experimental Investigation of Anchor Channels Subjected to Shear Load in Composite Slabs with Profiled Steel Decking. Eng. Struct. 2021, 240, 112347. [Google Scholar] [CrossRef]
  2. Kraus, J. Tragverhalten und Bemessung von Ankerschienen unter Zentrischer Zugbelastung (Load-Bearing Behaviour and Design of Anchor Channels under Axial Tension). Ph.D. Thesis, University of Stuttgart, Stuttgart, Germany, 2003. (In German). [Google Scholar]
  3. EN 1992-4; Eurocode 2—Design of Concrete Structures—Part 4: Design of Fastenings for Use in Concrete (EN 1992-4:2018). European Committee for Standardization (CEN): Brussels, Belgium, 2018.
  4. ACI 318; Building Code Requirements for Structural Concrete (ACI 318-14) and Commentary (ACI 318R-14). American Concrete Institute: Farmington Hills, MI, USA, 2014.
  5. AC232; Acceptance Criteria for Anchor Channels in Concrete Elements. ICC-ES: Whittier, CA, USA, 2019.
  6. Bogdanić, A.; Casucci, D.; Ožbolt, J. Numerical and Experimental Investigation on Concrete Splitting Failure of Anchor Channels. CivilEng 2021, 2, 502–522. [Google Scholar] [CrossRef]
  7. Hüer, T. Tragverhalten von Randnahen Zugbeanspruchten Befestigungen bei der Versagensart “Spalten des Betons”, (Behavior of Tension Loaded Fasteners near the Edge for the Concrete Splitting Failure Mode). Ph.D. Thesis, University of Stuttgart, Stuttgart, Germany, 2014. (In German). [Google Scholar]
  8. Nilforoush, R. Numerical and Experimental Evaluations of Load-Carrying Capacity of Cast-in-Place Headed Anchors and Post-Installed Adhesive Anchors. Ph.D. Thesis, University of Lulea, Lulea, Sweden, 2017. [Google Scholar]
  9. Ožbolt, J.; Li, Y.; Kožar, I. Microplane model for concrete with relaxed kinematic constraints. Int. J. Solids Struct. 2001, 38, 2683–2711. [Google Scholar] [CrossRef]
  10. Bažant, Z.P.; Oh, B. Crack band theory for fracture of concrete. Mater. Struct. 1983, 16, 155–177. [Google Scholar] [CrossRef] [Green Version]
  11. Ožbolt, J.; Gambarelli, S. Microplane model with relaxed kinematic constraint in the framework of micro polar Cosserat continuum. Eng. Fract. Mech. 2018, 199, 476–488. [Google Scholar] [CrossRef]
  12. Jirásek, M.; Bauer, M. Numerical aspects of the crack band approach. Comput. Struct. 2012, 110, 60–78. [Google Scholar] [CrossRef]
  13. Ožbolt, J.; Sharma, A.; Reinhardt, H.W. Dynamic fracture of concrete compact tension specimen. Int. J. Solids Struct. 2011, 48, 1534–1543. [Google Scholar] [CrossRef]
  14. Ožbolt, J.; Bošnjak, J.; Sola, E. Dynamic Fracture of Concrete Compact Tension Specimen: Experimental and Numerical Study. Int. J. Solids Struct. 2013, 50, 4270–4278. [Google Scholar] [CrossRef] [Green Version]
  15. Ožbolt, J.; Oršanić, F.; Balabanić, G. Modeling pull-out resistance of corroded reinforcement in concrete: Coupled three-dimensional finite element model. Cem. Concr. Compos. 2014, 46, 41–55. [Google Scholar] [CrossRef]
  16. FEMAP®, version 11.2.2; Siemens PLM Software: Plano, TX, USA, 2015.
  17. EAD 330008-03-0601; Anchor Channels, European Assessment Document. EOTA: Brussels, Belgium, 2018.
  18. Jebara, K.; Ožbolt, J.; Hoffman, J. Pryout failure of single headed stud anchor: 3D numerical FE analysis. Mater. Struct. 2016, 49, 4551–4563. [Google Scholar] [CrossRef]
  19. Odenbreit, C.; Vigneri, V.; Amadio, C.; Bedon, C.; Braun, M. New mechanical model to predict the load bearing resistance of shear connectors with modern forms of profiled sheeting. In Proceedings of the 13th International Conference on Steel, Space and Composite Structures, Perth, Australia, 31 January–2 February 2018. [Google Scholar]
  20. Hilti Anchor Channels (HAC) with Channel Bolts (HBC); DIBt: Berlin, Germany, 2016.
  21. CEB-FIP Model Code 1990; Comité Euro-International du Béton and Fédération Internationale de la Précontrainte. Tomas Telford: London, UK, 1993.
  22. EN 1994-1-1; Eurocode 4–Design of Composite Steel and Concrete Structures–Part 1-1: General Rules and Rules for Buildings. European Committee for Standardization (CEN): Brussels, Belgium, 2004.
Figure 1. Typical edge configurations: (a) perpendicular orientation of the steel decking; and (b) parallel orientation of the steel decking [1].
Civileng 03 00018 g001
Figure 2. (a) Experimental setup; and (b) comparison between experimental and numerical breakout patterns [6].
Civileng 03 00018 g002
Figure 3. (a) FE discretization: 1—concrete slab, 2—anchor, 3—channel, 4—T-bolt with nut, 5—fixture, 6—anchor interface, 7—channel interface, 8—T-bolt interface, 9—PTFE sheet; (b) FE model and boundary conditions.
Civileng 03 00018 g003
Figure 4. Breakout patterns at the ultimate load for: (a) support span of 2.5hef; and (b) support span 4.5hef (symmetry was utilized).
Civileng 03 00018 g004
Figure 5. Geometry of steel decking profiles: (a) Ribdeck S60; and (b) Superib [1].
Civileng 03 00018 g005
Figure 6. Parameters of the numerical model.
Civileng 03 00018 g006
Figure 7. The geometry (model) representing: (a) Series 1; and (b) Series 2.
Civileng 03 00018 g007
Figure 8. Numerical results of Series 1 for: (a) the embedment depth hef = 106 mm; and (b) the overall member thickness h = 180 mm.
Civileng 03 00018 g008
Figure 9. Post-peak breakout patterns (section through the anchor for hef = 120 mm) for: (a) plain concrete slab; (b) composite slab—dw = 45 mm; and (c) composite slab—dw = 15 mm.
Civileng 03 00018 g009
Figure 10. Numerical results of Series 2.
Civileng 03 00018 g010
Figure 11. Numerical results of Series 3 for: (a) the trapezoidal profile; and (b) the re-entrant profile.
Civileng 03 00018 g011
Figure 12. Principal stress σ33 (N/mm2) at the ultimate load: (a) the trapezoidal profile; and (b) the re-entrant profile.
Civileng 03 00018 g012
Figure 13. Composite slab layout.
Civileng 03 00018 g013
Figure 14. Breakout patterns for: (a) configuration 1; (b) configuration 2; (c) configuration 3; and (d) configuration 4.
Civileng 03 00018 g014aCivileng 03 00018 g014b
Figure 15. Numerical results compared to the new design proposal: (a) Series 1 and Series 2; and (b) Series 3.
Civileng 03 00018 g015
Table 1. Comparison between experimental and numerical results—4 tests were performed for each configuration.
Slab Typec1
(mm)
hef
(mm)
h
(mm)
Nu,m
(kN)
σ
(kN)
CoV
(%)
Nu,sim
(kN)
Nu,sim/Nu,m
(-)
Plain10010613079.000.901.1474.480.94
Composite10010613052.222.955.6651.080.98
Table 2. The influence of support span.
Support SpanNu
(kN)
Nu/Nu,ref
(-)
2.5hef66.951.00
3.5hef58.820.88
4.5hef47.330.71
10hef26.570.40
Table 3. Series 1—anchor channel in the perimeter beam, parallel to the steel decking profile.
OrientationInstallationProfile Typec1
(mm)
h
(mm)
hef
(mm)
dw
(mm)
s
(mm)
ParallelPerimeter beamRibdeck S6010013091, 106, 12015, 30, 45, 60, 100250
10018091, 106, 12015, 30, 45, 60, 100250
20013010615, 30, 45, 60, 100250
Superib10013091, 106, 12015, 30, 45, 60, 100250
Table 4. Series 2—anchor channel in the perimeter beam perpendicular to the steel decking.
OrientationInstallationProfile Typec1
(mm)
H
(mm)
hef
(mm)
dw
(mm)
s
(mm)
PerpendicularPerimeter beamRibdeck S6010013091, 106, 12015, 30, 45, 60, 100250
Table 5. Series 3—anchor channel over the decking profile, perpendicular to the decking profile.
OrientationInstallationProfile Typec1
(mm)
h
(mm)
hef
(mm)
dw
(mm)
s
(mm)
PerpendicularOver the profileRibdeck S6010013091, 106, 120Depends on
configuration
250, 300
100180120250, 300
Superib10013091, 106, 120Depends on
configuration
150, 200
Table 6. Investigated configurations in Series 3 for the trapezoidal profile.
Configurations = 250 mms = 300 mm
Symmetric Civileng 03 00018 i001 Civileng 03 00018 i002
Asymmetric Civileng 03 00018 i003 Civileng 03 00018 i004
Table 7. Test results.
ConfigurationNu,m
(kN)
ntest
(-)
σ
(kN)
CoV
(%)
Nu,m/Nu,m,ref
(-)
Reference65.1841.872.861.00
146.3032.284.930.71
258.4032.394.090.90
343.2131.543.560.66
456.5933.606.350.87
Publisher’s Note: MDPI stays neutral with regard to jurisdictional claims in published maps and institutional affiliations.

