Article

Lateral Deformation Capacity and Plastic Hinge Length of RC Columns Confined with Textile Reinforced Mortar Jackets

Department of Civil and Environmental Engineering, The University of Toledo, Toledo, OH 43606, USA
*
Author to whom correspondence should be addressed.
CivilEng 2021, 2(3), 670-691; https://doi.org/10.3390/civileng2030037
Submission received: 8 July 2021 / Revised: 17 August 2021 / Accepted: 23 August 2021 / Published: 26 August 2021
(This article belongs to the Special Issue Advances in Civil Engineering)

Abstract

:
This paper presents a nonlinear finite element analysis (FEA) of textiles reinforced mortars (TRM)-confined reinforced concrete (RC) columns through jacketing, under combined axial and cyclic loadings. The FEA models were validated with an experimental study in the literature that was conducted on full-scale square columns reinforced with continuous steel bars (no lap splices). Subsequently, parametric study was performed on the validated FEA models. The parameters considered include various jacket’s lengths and mortar strengths. Moreover, semiempirical models were developed to evaluate the plastic hinge length (LP) and the ultimate drift ratio of RC columns confined with TRM and FRP jackets, while considering the jacket length effect. The FEA models and experimental results were in good agreement. The finite element results revealed that the increase in the jacket length improved the lateral deformation capacity and increased the plastic hinge length linearly up to a confinement ratio of 0.2. Beyond this point, the plastic hinge length shortened as the confinement ratio raised. Moreover, mortars with higher flexural strength resulted in a slightly higher deformation capacity. However, the difference in the mortar compressive strength did not affect the ultimate lateral deformation capacity. The semiempirical models show that the average difference in the predicted LP and the ultimate drift ratio values as compared to the experimental and simulated columns was 3.19 and 16.06%, respectively.

1. Introduction

Reinforced concrete (RC) columns subjected to seismic loading should be designed properly to satisfy the deformation demands in performance-based design [1]. The column’s lateral deformation capacity depends on the plastic hinge, which is defined as the physical region of the column that undergoes continuous plastic deformation and damage under repeated cyclic or earthquake loadings. The damage in the plastic hinge region can be lessened or even shifted to a less critical region by increasing the lateral strength of the column through confinement. Adequate lateral strength can be accomplished by providing sufficient lateral reinforcement such as internal steel stirrups or external composite jackets at the plastic hinge zone [2].
The design of RC columns confined with steel reinforcement has been extensively investigated and is currently used in design manuals [3]. Moreover, many analytical models have been proposed to compute the length of the plastic hinge zone of un-strengthened RC columns [4,5,6,7,8,9].
On the other hand, RC columns can be confined with external composite jackets to mitigate the failure in the plastic hinge zone. In the last decade, confining through composite jacketing of RC columns subjected to static or dynamic loadings has been employed in a large number of projects. Fiber reinforced polymer (FRP) took most of the attention among all jacketing techniques due to its advantageous properties such as its ease of application, high strength to weight ratio, and corrosion resistance [10,11,12]. Despite these advantages, the use of epoxy resins in the application of the FRP has some weaknesses, such as low resistance to high temperatures and inapplicability on wet surfaces. Therefore, a newer material called textile reinforced mortar (TRM) was found to be a promising alternative material to FRP. TRM is a composite material that includes fibers, made of glass, carbon, or basalt, as textiles (with open mesh geometry) attached to inorganic materials such as cement-based mortars. TRM, in general, has many advantages due to the use of the cement-based binder. These advantages include good resistance to high temperature, low cost, ability to be applied on wet surfaces or at a low temperature environment, and its compatibility with masonry and concrete substrates [13].
A limited number of studies was conducted on the confinement of RC columns with TRM under simulated seismic loading. Many of these studies involved experi-mentation [14,15,16,17,18,19,20,21,22], with very few numerical investigations [21,23]. Bournas [14] per-formed an experiment on the effectiveness of TRM and FRP jackets in terms of confin-ing RC columns under seismic loads. It was concluded that the TRM jacketing is as ef-fective as the FRP jacketing as a means of improving the lateral deformation capacity and energy dissipation by delaying the buckling of the bars. Bournas [15,16,17] investi-gated the use of TRM jackets in confining concrete columns with continuous or lap-spliced reinforcement. The results showed that as compared to FRP, TRM jackets were 50% more effective in increasing the cyclic deformation capacity and the energy dissipation in columns reinforced with continuous steel bars. This behavior is at-tributed to the ability of TRM to resist local stresses that are due to the low composite action between the fibers and the mortar [15]. It was also observed that the effective-ness of TRM jackets was slightly lower as compared to FRP jackets with equal strength and stiffness in columns with inadequate lap splices. However, in columns with longer lap lengths, the TRM has shown the same effect as the FRP. Yin et al. [18] and Yao et al. [19] investigated, experimentally, the seismic performance of RC columns with various corrosion ratios of steel reinforcement retrofitted with textile reinforced concrete (TRC) and exposed to a chloride environment. It was observed that the ductility was higher in specimens with lower corrosion ratios. Increasing the corrosion ratio from 5 to 10% resulted in a 64.5 and 49.5% increase in the ductility factor, defined as the ratio of the ultimate displacement to the yield displacement, respectively [18]. It was also found that TRC delayed the initiation and development of the cracks before and after corrosion exposure. Moreover, the yield and peak loads decreased by increasing the corrosion ratio. Ming, Yin, and Yao [21,22,23] studied the seismic performance of RC columns retrofitted with TRC under various axial load levels. The results revealed that the stiffness degradation rate and the energy dissipation capacity remained the same for all the axial load ratios up to the yield point. Thereafter, the stiffness degradation rate improved, and the energy dissipation and deformation capacities reduced as the axial load level increased. Experimental studies were also performed on the impact of shear span ratio [22,23]. It was concluded that the columns with a lower shear span ratios exhibited better behavior in terms of ductility and energy dissipation capacity. Furthermore, Yao [23] investigated the performance of TRM-confined RC columns with different concrete compressive strengths and concluded that the ductility and lateral deformation capacity enhanced with the increase in concrete strength. Dinh [20] tested the effect of the number of textile layers and the surface treatment methods in lap-spliced regions on TRM-strengthened RC columns. The results revealed that the strength and ductility of the columns improved as the number of TRM layers in-creased. Moreover, the strength of concrete columns retrofitted along the entire length was significantly enhanced as compared to the specimens retrofitted in the plastic hinge region only. In another study, the effect of the transverse reinforcement ratio on the seismic behavior of RC columns retrofitted with TRC showed that the columns with higher stirrups ratio had an improved ductility, bearing capacity, and energy dis-sipation [22]. Furthermore, after reaching the peak load, the rate of decrease in bearing capacity was lower in the columns with lower stirrups spacing.
On the other hand, many analytical and empirical models of the plastic hinge length in FRP-confined RC columns have been proposed [24,25,26,27]. Gu and Youssef [24,25] studied the plastic hinge length of FRP-confined circular RC columns. Gu [24] found that the plastic hinge length increased linearly with the confinement ratio less than 0.1 and decreased when the confinement ratio ranged between 0.1 and 0.5. A sim-ilar behavior was spotted in square columns (i.e., the plastic hinge length increased and then dropped to a lower value with a higher confinement ratio) [26,27]. Jiang [27] introduced a shape modification factor to the empirical model proposed by Gu [24] to account for the square columns, while Yuan [26] proposed a new formula for the plas-tic hinge length of FRP-confined square RC columns. However, Youssef [25] observed that the plastic hinge length increased with higher confinement ratio values. The rate of increase in the plastic hinge length was higher up to a confinement ratio of 0.4 and it reduced after this point.
From the reviewed literature, there are other significant parameters that have a direct relation to the lateral deformation capacity that have not been studied in RC columns confined with TRM and subjected to combined axial and lateral cyclic load-ings. These parameters include various jacket lengths and mortar strengths. In the present study, FEA models of RC columns confined with TRM jackets under combined axial and lateral cyclic loadings were developed and validated with an experimental study in the literature [17], which was performed on full-scale square concrete col-umns reinforced with continuous steel bars (no lap splices). Similar to the experiment, the bar splices effect was excluded, since it is out of the scope of the present study. Subsequently, a parametric study was carried out on the validated models considering various jacket lengths (in the range of 9.4 to 100% of the column length) and mortar strengths (flexural and compressive strengths ranging from 3.28 to 6.51 MPa and 8.56 to 30.61 MPa, respectively). The lateral deformation capacity and the plastic hinge length were evaluated based on the parameters studied. Moreover, to the best of the authors’ knowledge, there are neither analytical nor empirical models for the plastic hinge length of FRP or TRM-confined RC columns that include the effect of the jacket’s length. In contrast, two formulas were proposed to predict the plastic hinge length and the ultimate drift ratio of RC columns confined with TRM and FRP jackets with vari-ous lengths that would be useful for the designers and practitioners.

2. Experimental Tests Adopted for Validation of FEA Models

The finite element RC column models were validated with an existing experimental study by Bournas [17]. This study was selected since the longitudinal reinforcement in the columns had no lap-splices that resulted in the highest effectiveness of TRM jackets as compared to other studies that included lap-splices [14,15,16,17]. The test setup, dimensions, and reinforcement details of the control and strengthened specimens are shown in Figure 1. The columns were subjected to a constant axial load equivalent to 27.5% of its compressive strength (based on the cross-section dimensions and the concrete compressive strength, the axial load was 491.5 KN) combined with a lateral cyclic load with a displacement rate ranging from 0.2 to 1.1 mm/s. The columns were reinforced with four 14-mm diameter bars in the longitudinal direction and 8-mm diameter stirrups spaced at 200 mm to simulate older non-seismically detailed columns. One column was tested as a control specimen without any external strengthening. The second and third specimens were retrofitted with four layers of carbon-TRM and glass-TRM, respectively. The jackets were placed at the base section of the column, where the failure was predicted to occur, and extended to a height of 430 mm. The orientations of the textiles were in the axial and hoop directions of the columns.
The average concrete compressive strength of 28.6 MPa was measured using 150 × 150 mm cubes. The yield strength values of the 14-mm longitudinal bars’ diameters and 8-mm stirrups were 523 and 351 MPa with ultimate tensile strains of 12 and 19.5%, respectively. Furthermore, the tensile strength, the modulus of elasticity, and the nominal thickness of the carbon fibers were 3800 MPa, 225 GPa, and 0.095 mm, respectively. The corresponding values for the glass fibers were 1700 MPa, 70 GPa, and 0.089 mm. The mortar had compressive and flexural strengths of 20.8 MPa and 6.51 MPa, respectively.

3. Finite Element Analysis Modelling of RC and Retrofitted Columns

In the present study, the ANSYS APDL nonlinear finite element analysis software program was used to validate the reinforced concrete column models tested by Bournas [17]. Subsequently, a parametric study was performed on the validated model to investigate the effect of the length of jacket on the plastic hinge length. In the following sections, the nonlinear finite element analysis procedure is described in detail.

3.1. Element Types

To model the concrete and mortar, solid65, which is an 8-node solid element with a capability of cracking and crushing, was used. The reinforcements were modelled using Link180, a 3D uniaxial tension-compression spar element that is capable of inelastic deformation. Solid185 was used to model the steel plates at the loading and the support locations on the top and the bottom of the columns to provide more uniform stress distribution and avoid stress concentration problems at those locations. The Shell181 element was adopted to model the TRM jackets. The Shell181 element is appropriate to model thin structures and it is well-suited for linear and large strain [28]. Moreover, a shell section was adopted in the FEA models, which allows the use of multilayers with various thicknesses and orientations. Contact and Target elements were created to represent the bond between concrete and mortar. A unidirectional nonlinear spring element (COMBIN39) was used to model the interface between the longitudinal reinforcement and concrete.

3.2. Material Models

Concrete was defined as a linear-elastic and multilinear inelastic material. To model the elastic behavior, the modulus of elasticity (E) and Poisson’s ratio (γ) should be provided. The modulus of elasticity of concrete was obtained using the formula provided in ACI 318 [29]. For the inelastic behavior of the control model, multilinear stress–strain values were calculated using the Mander [30] model for the steel-confined concrete as follows:
f c c = f c o 1.254 + 2.254 1 + 7.94 f l f c o 2 f l f c o
where f’cc is the confined concrete compressive strength; fco is the unconfined concrete compressive strength; and fl is the effective lateral confining stress on the concrete and taken as the smallest of flx and fly, which are the effective confining stresses in x and y directions, respectively, and expressed by the following:
f l x = k e ρ x f y h
f l y = k e ρ y f y h
where ρx and ρy are the ratios of the volumes of transverse confining steel to the volume of confined concrete in x and y directions, respectively; fyh is the yield strength of stirrups; and ke is the confinement effectiveness coefficient.
For the TRM confined columns, the ACI549.4R-13 [31] stress–strain model was adopted in the present FEA study and is determined using the following expressions:
f c = E c ϵ c E c E 2 2 4 f c ϵ c 2   0 ϵ c ϵ t f c + E 2 ϵ c   ϵ t ϵ c ϵ c c u
ϵ t = 2 f c E c E 2
E 2 = f c c f c ϵ c c u
where E2 is the slope of linear portion of the stress–strain model for TRM-confined concrete; fcc′ is the maximum compressive strength of confined concrete; εccu is the ultimate axial compressive strain of confined concrete that corresponds to fcc′; and εt′ is the transition strain in the stress–strain curve of FRCM-confined concrete. fcc and εccu can be calculated according to ACI549.4R-13 Section 11.3 [31]. The stress–strain curves are shown in Figure 2.
The Williams and Warnke [32] model was adopted in this study along with the SOLID65 element for the triaxial behavior of concrete. This element has a smeared crack analogy for cracking in tension zones and crushing in compression zones. To ac-count for cracking and crushing, the following four properties were assigned to concrete: uniaxial tensile cracking stress (fr), uniaxial compressive crushing stress, and shear transfer coefficients for open and closed cracks (βt). The crushing of the concrete was deactivated by inserting a value of -1 for uniaxial compression stress to avoid the premature failure of the models, as recommended by ANSYS [28]. The failure of the validated models was either in the steel reinforcement (bar buckling) or TRM jacket rupture. Furthermore, the overall behavior of the FEA models was consistent with the behavior of the columns in the experiment [17]. Therefore, the assumption of excluding the concrete crushing had an insignificant impact on the behavior and modes of failure of the FEA models. The value of βt ranges from 0.0 to 1.0, with 0.0 representing a smooth crack and 1.0 representing a rough crack [28]. Based on a sensitivity study performed on the validated models, the βt values were assumed to be 0.1 for both open and closed cracks, noting that βt values for the closed cracks have an insignificant effect on the overall behavior of the models but play a major role in convergence achievement. However, higher values of βt for open cracks resulted in lower deflections and higher load capacities. When a concrete element is cracked, a small amount of stiffness is added to the element for numerical stability using a stiffness multiplier across the crack face [28]. Therefore, the stiffness of the cracked elements depends on the values of βt. On the other hand, steel was defined as a linear-elastic and bilinear in-elastic material. The steel reinforcement stress–strain curve for the finite element model was based on the modulus of elasticity (E), Poisson’s ratio (γ), and yield strength. The Bauschinger effect was included to account for the strain hardening in the steel reinforcement by adopting the kinematic hardening plasticity model. The modulus of elasticity and Poisson’s ratio values of the steel plates provided at the sup-port and loading locations were 200 GPa and 0.3, respectively. For the TRM jackets, the three material directions are perpendicular to each other. Therefore, TRM was as-sumed as a linear orthotropic material. Based on the selected textiles in the experiment, the values of the modulus of elasticity were taken to be 190, 20, and 20 GPa in the x, y, and z directions, respectively. The Poisson’s ratios νxy, νxz, and νyz were assumed to be 0.22, 0.22, and 0.3, respectively [33]. The shear modulus Gxy, Gyz, and Gxz were calcu-lated using elasticity relations. The Cohesive Zone Model (CZM), presented by ANSYS, was employed to model the contact interface between mortar and concrete. Bilinear behavior with traction and critical fracture energy option was selected in this study. The three required parameters to model the bonding were maximum equivalent tan-gential contact stress (τmax), critical fracture energy for tangential slip (Gct), and artifi-cial damping coefficient. The artificial damping coefficient was set to 0.1 to stabilize the model and to enhance the convergence of the model [28]. The maximum equiva-lent tangential contact stress (τmax) was obtained by the following equation:
τ m a x = 0.107 β L n E f f m t f
where βL is the bond length factor and taken as 1, n is the number of textile layers, Ef is the modulus of elasticity of the textiles, fm is the compressive strength of the mortar, and tf is the nominal thickness of each TRM layer.
The critical fracture energy for tangential slip (Gct) was calculated according to the model proposed by [34]. The values of maximum equivalent tangential contact stress (τmax) and the critical fracture energy for tangential slip (Gct) were 5.15 and 2.08 MPa, respectively.
For the spring element (COMBIN39), a bond-slip curve, based on the model pro-posed by Murcia-Delso and Shing [35], was defined as follows:
τ m a x , s p r i n g   e l e m e n t = 1.16 f c 0.75
s p e a k = 0.07   d P
K O = 4 τ m a x s p e a k
where f’c is the concrete compressive strength, dp is the longitudinal bars diameter, and Ko is the initial slope of the bond-slip curve.
To account for tension and compression under the loading and unloading effects in the FEA models, a force-slip relation including positive and negative values of bond forces was assigned by using the following relation:
F s = τ s . π . d . l
where d is the diameter of a bar (mm), and l is the distance between two adjacent spring elements (mm).

3.3. Mesh Generation and Boundary Conditions

Figure 3a,b show the developed geometry and reinforcement details of TRM-strengthened RC column models. The boundary conditions were similar to the experimental test setup. By taking advantage of the symmetry, only half of the column was modeled. Therefore, symmetrical boundary conditions were applied at the midpoint of the column width. Rollers were assigned to the nodes on the x–y plane of symmetry by restraining the displacement along the z axis. The axial load was applied first on the nodes of the steel plate at the top of the columns to avoid stress concentration. A lateral cyclic displacement-controlled load was applied to simulate the seismic excitation. In the case of cyclic loading, the typical load protocol consists of more than one cycle for each displacement value to capture the strength degradation more accurately. However, the load protocol adopted in the experiment used for validation [17] consisted of cycles successively increasing by 5 mm in amplitude in each direction (see Figure 4).
Large displacement static analysis was performed to account for the geometric nonlinearities. The applied loads were divided into a series of load increments called load steps. Each load step was applied gradually by specifying the maximum and minimum number of sub-steps. Automatic time stepping was set ON to obtain the convergence of the solution. In this study, the convergence criteria were based on force and displacement, and the default tolerance limits were selected using an ANSYS software program [28].

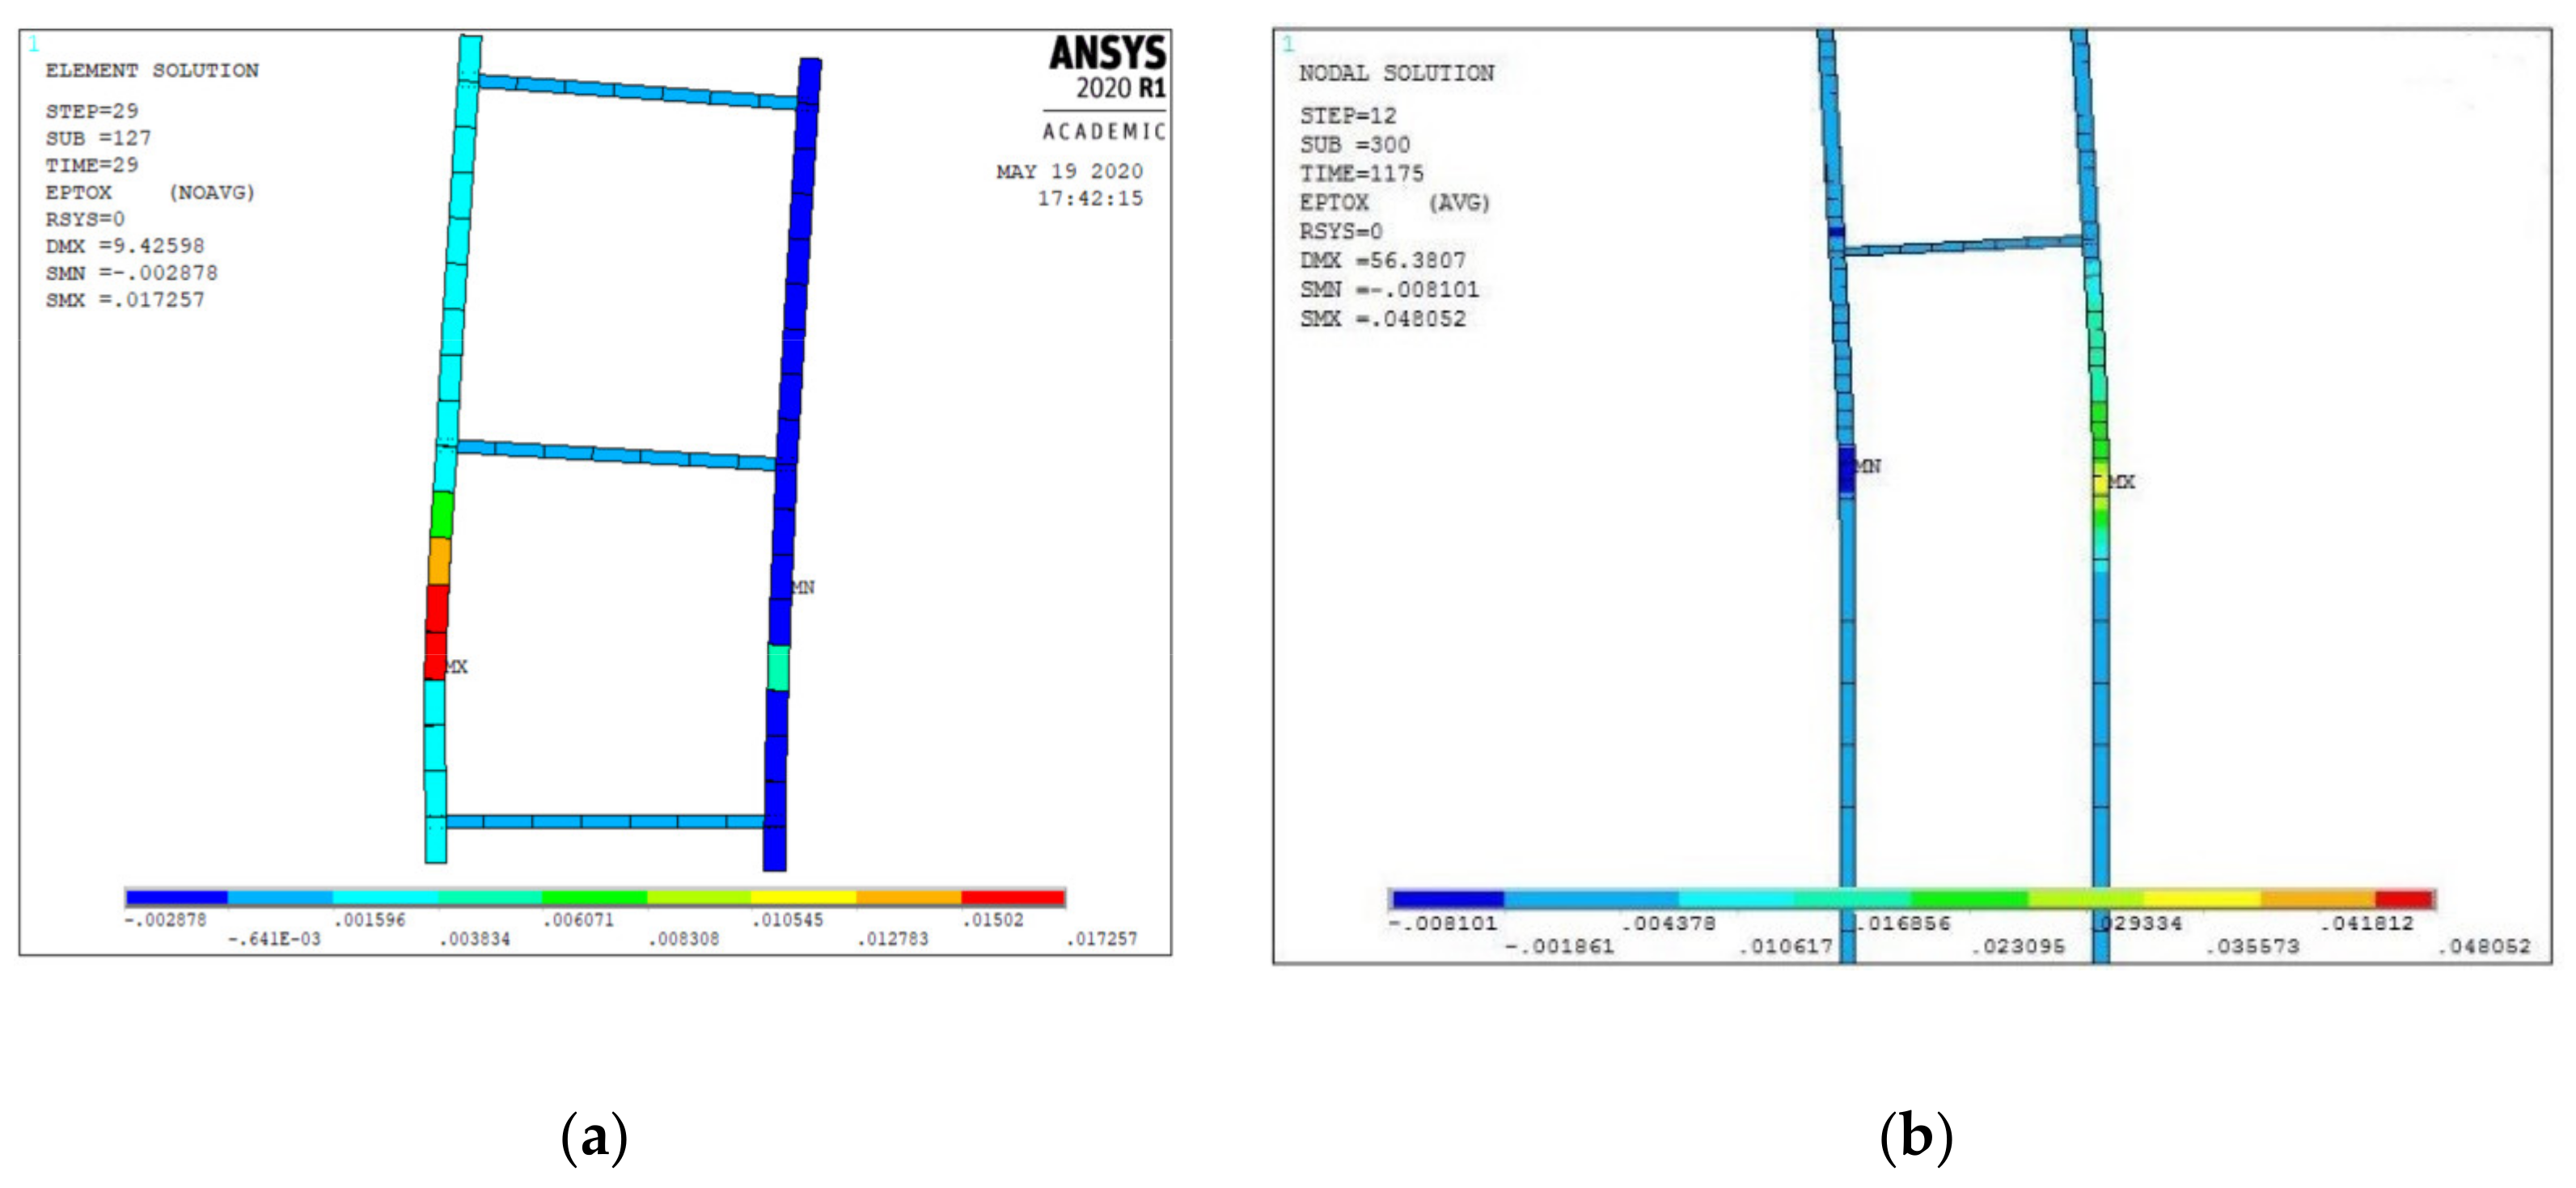
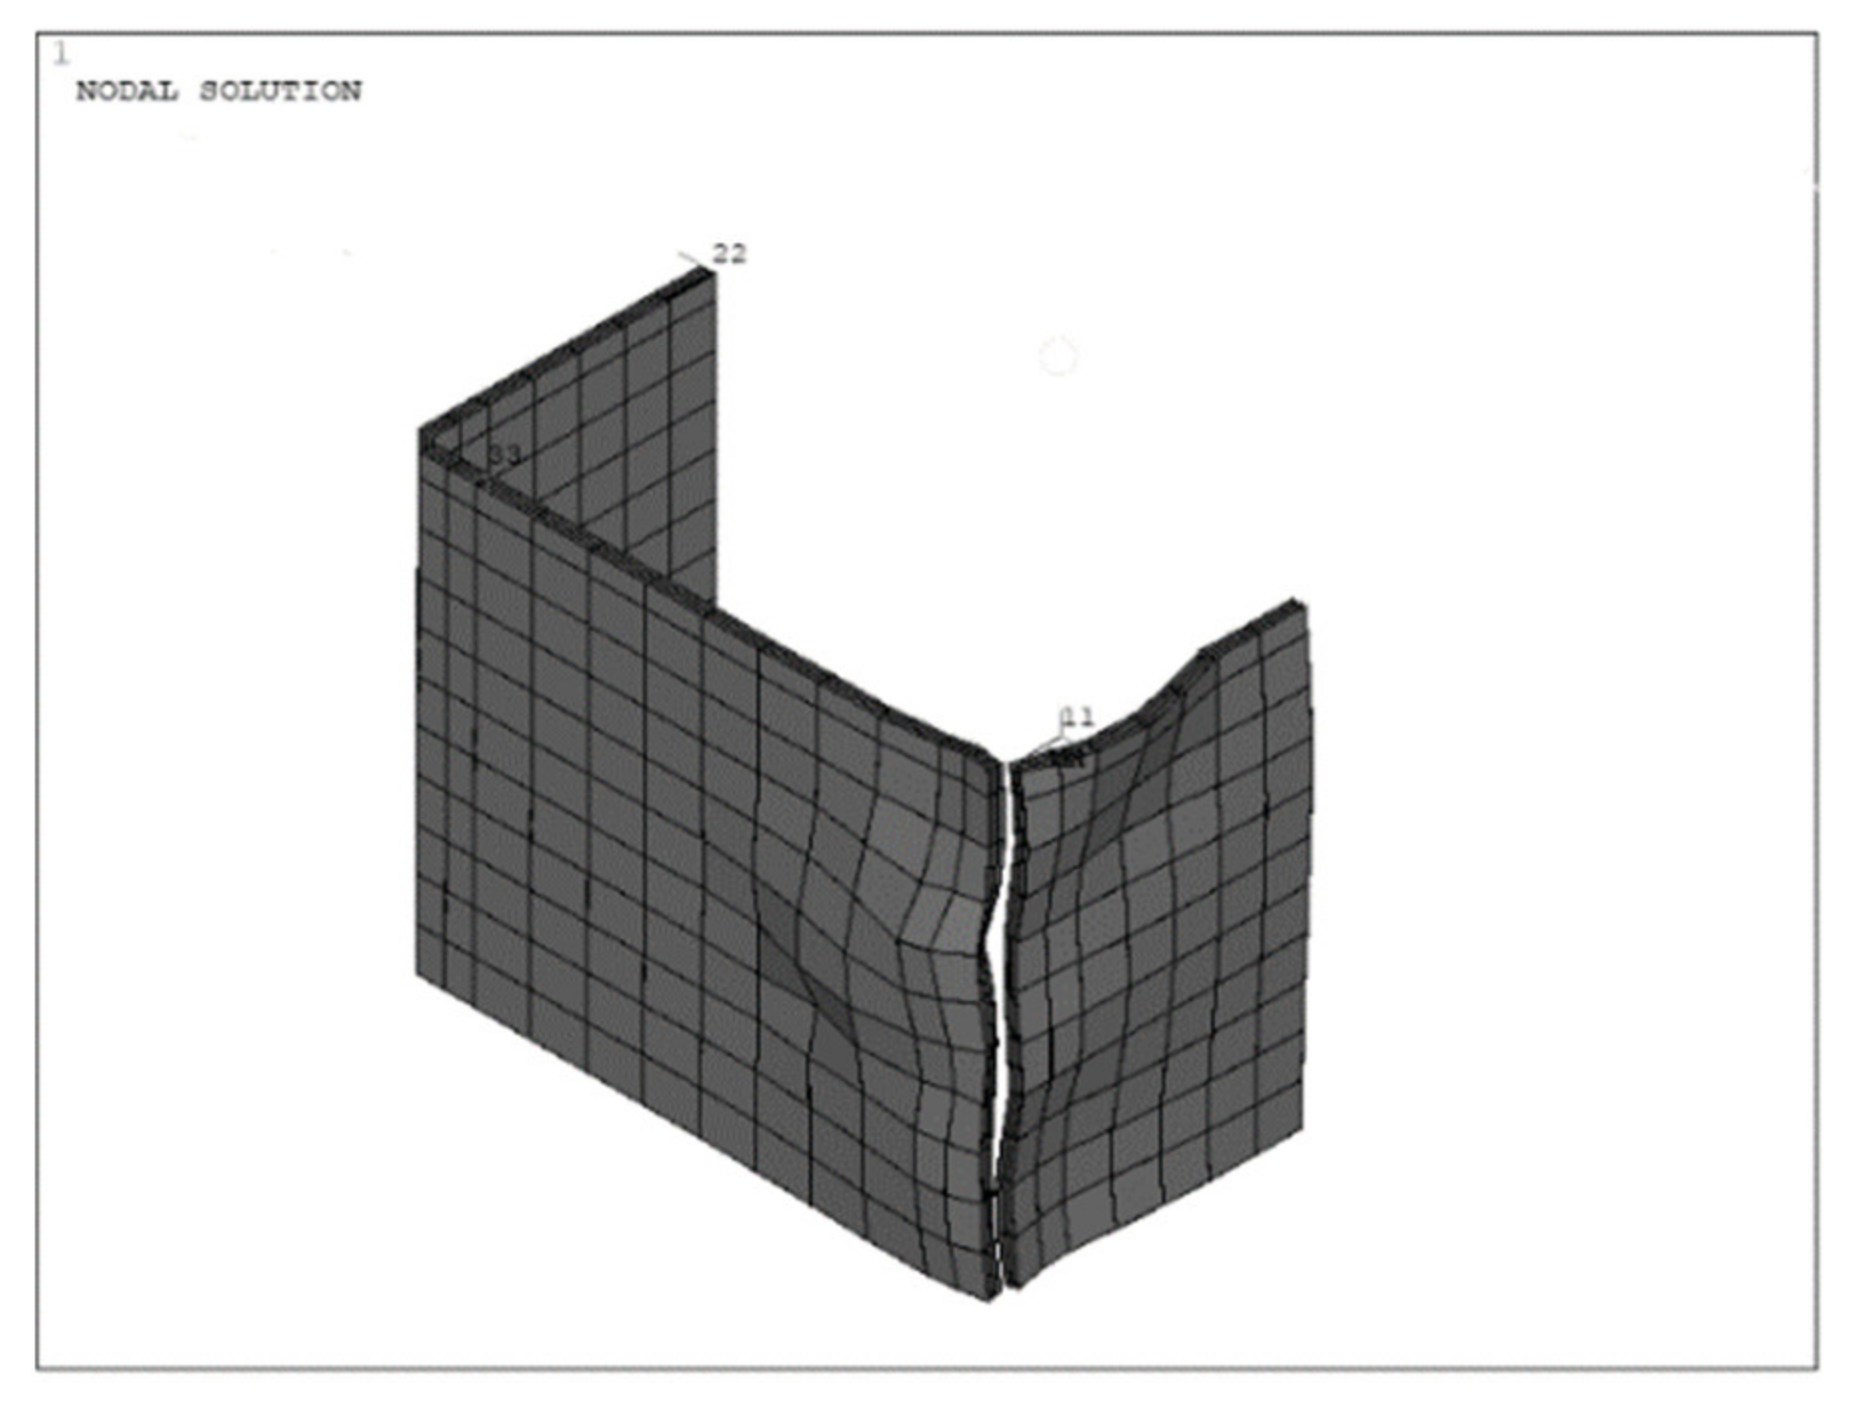
4. Validated Column Models Results

Table 1 shows the comparison of experimental and FEA column models’ results. The letters C and S refer to the control and strengthened columns, respectively; CL and G stand for light-weight carbon and glass fibers, respectively; and 430 refers to the length of the TRM jacket. In the experimental column notation, 0 presented the lap splice length of the longitudinal reinforcement; M refers to the mortar-based jackets; and four was the number of the TRM layers. The drift at failure and peak force of validated models and experiment were in good agreement with less than 10% difference.
Figure 5 illustrates the buckling of the longitudinal steel bars at the base section of the control column and concrete cracking at failure. The modes of failure were in good agreement with the experimental observation. TRM strengthening resulted in much more ductile behavior of the RC columns. Thus, as compared to the control column, the ultimate drift ratio of the strengthened columns was higher (Table 1). The envelope curves of L0_C and L0_M4 are shown in Figure 6.
On the other hand, the lateral load capacity of models S-CL-430 and S-G-430 was 48.4 and 49.3 KN resulting in a 10.25 and 12.3% improvement, respectively, as compared to the control model. In summary, confining RC columns with TRM jackets under combined axial and lateral cyclic loadings enhanced the behavior in terms of strength and ductility.

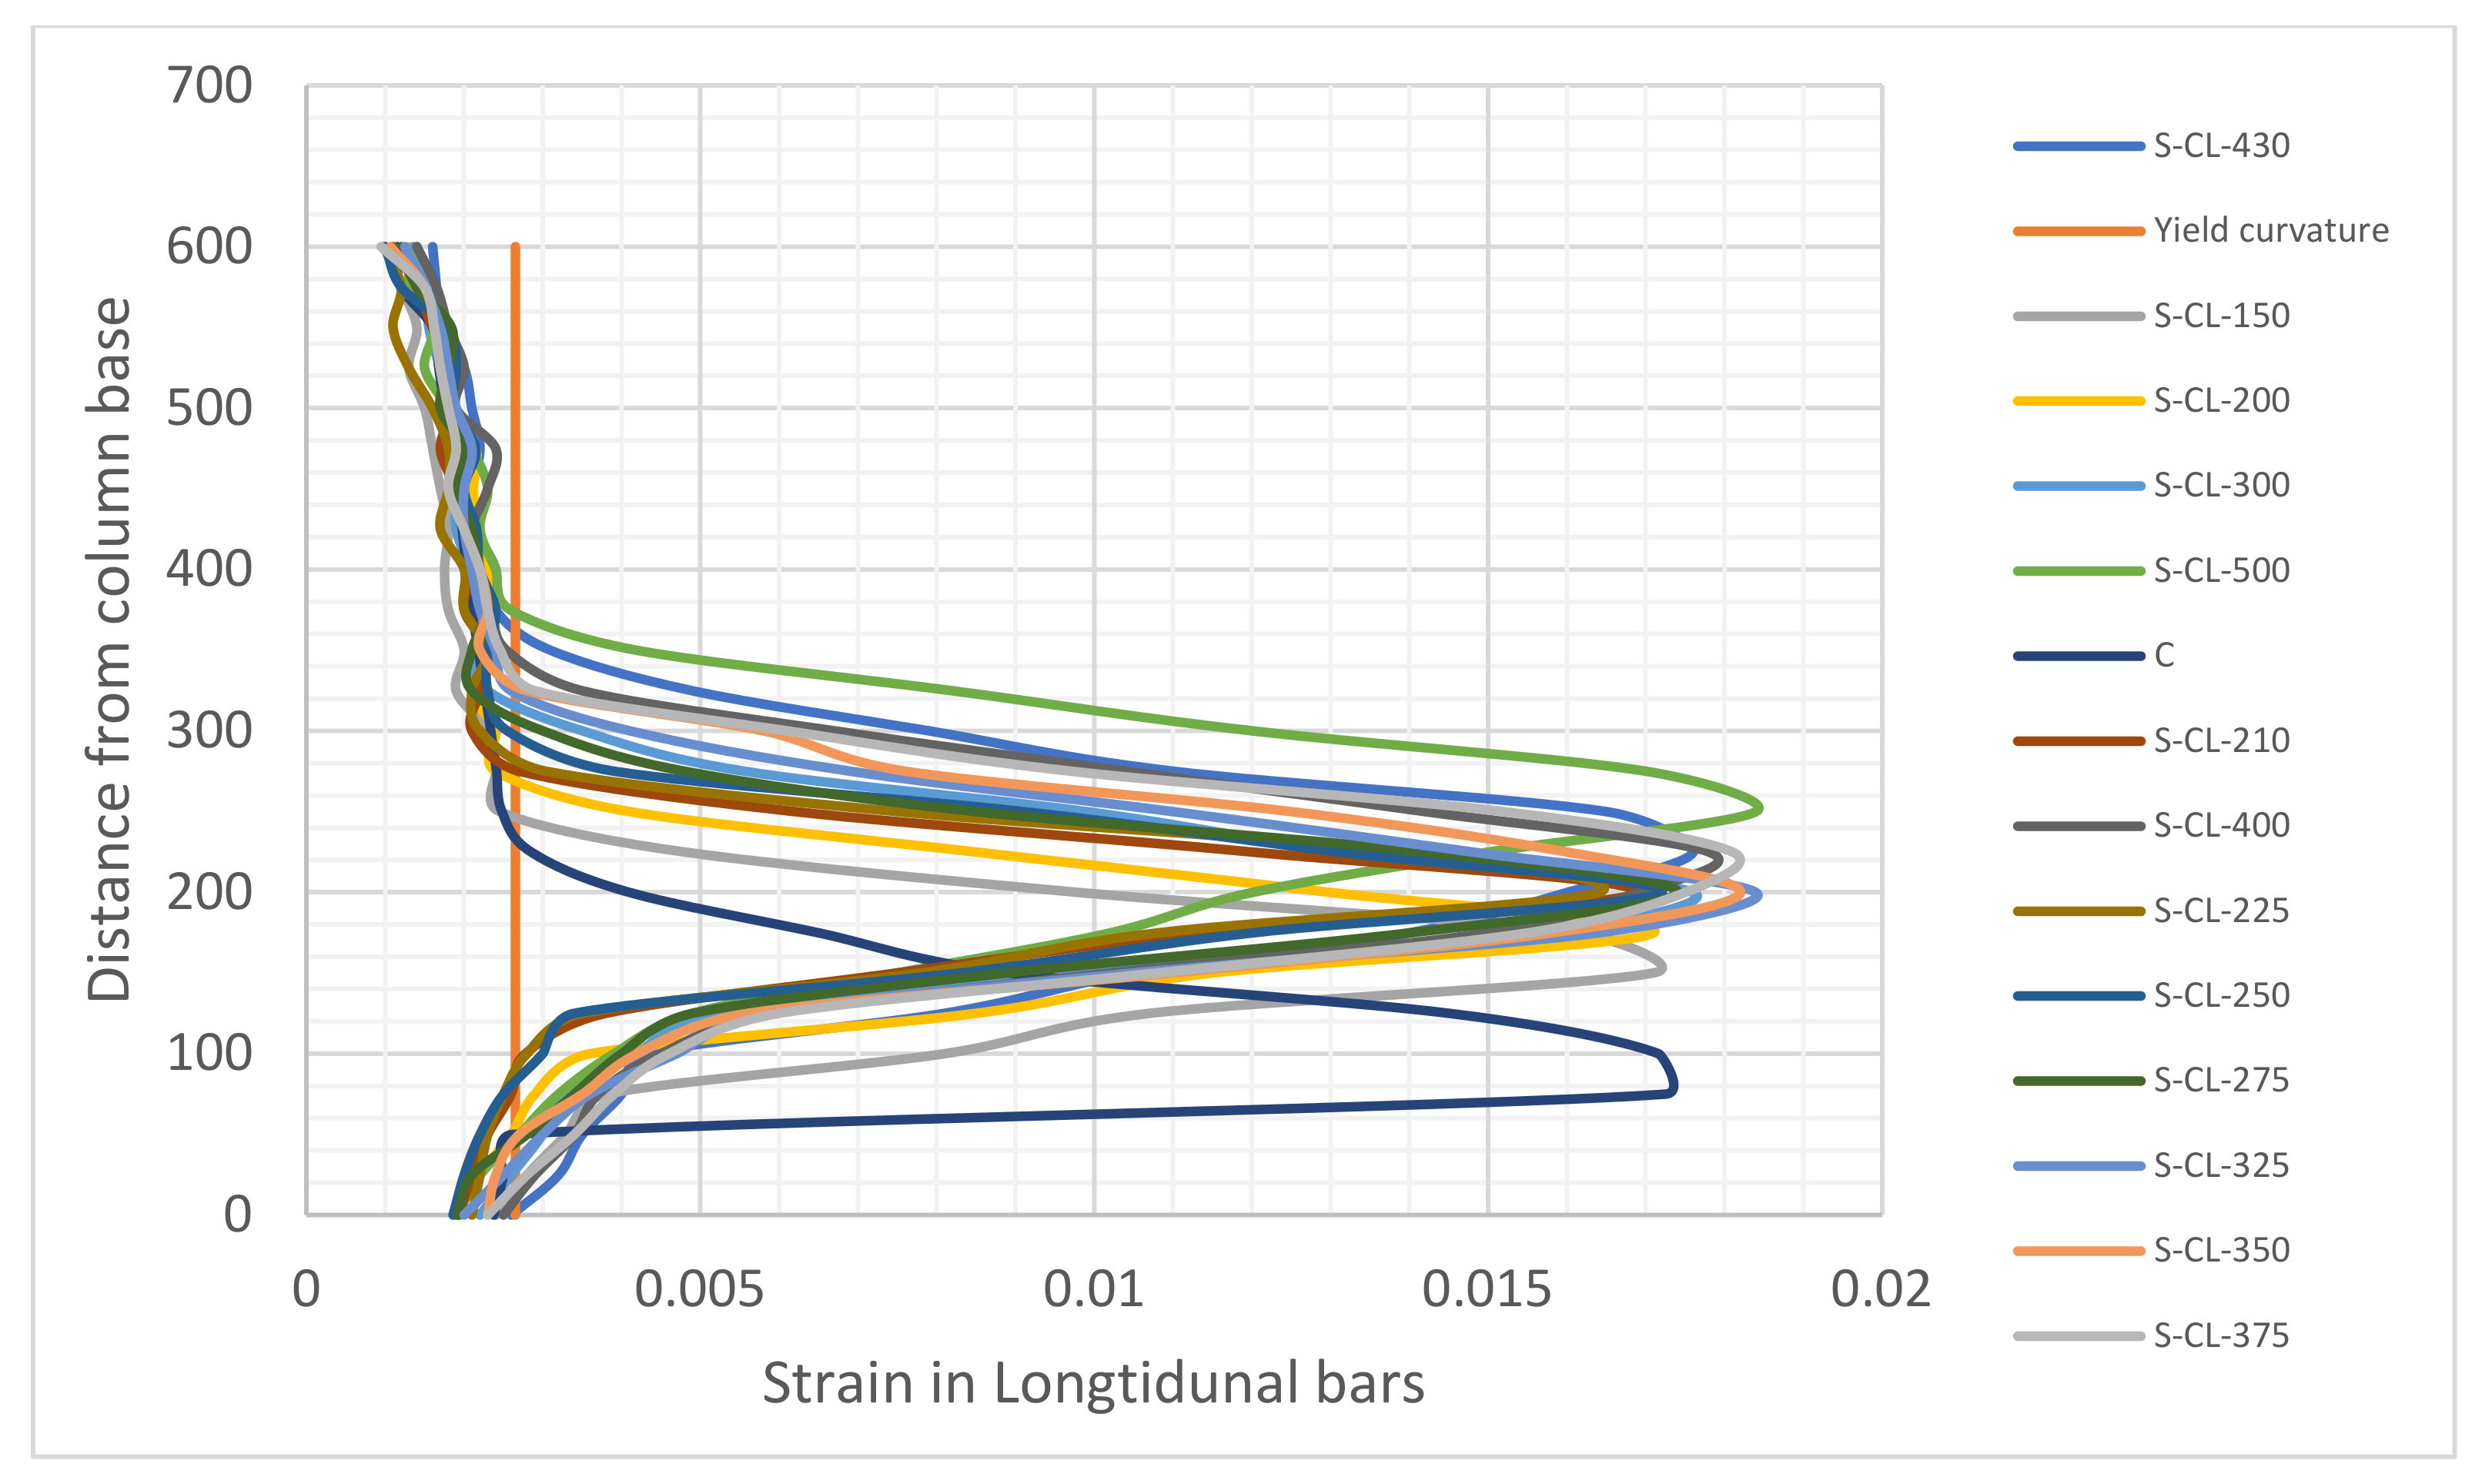
Strains in Longitudinal Bars at the Onset of Bar Buckling

Similarly, the predictions of the strains in the longitudinal reinforcement at the column’s base section at the onset of bars buckling were also in good agreement when compared to the corresponding data obtained from experimental results. The results are listed in Table 2.
The maximum difference in the strains did not exceed 10%. This confirms that the developed models could accurately predict the behavior of RC columns subjected to combined axial and cyclic lateral loadings. Figure 7a,b show the axial strain values in the control and strengthened columns with carbon-TRM, respectively.

5. Parametric Study

A parametric study was conducted to investigate the contribution of the jacket length and mortar strengths on the plastic hinge length and the ultimate drift ratio of TRM-confined RC columns under combined axial and cyclic loadings. The details of the parametric study results are discussed in the following sections.

5.1. The Effect of TRM Jacket Length

A total of nineteen FEA column models were developed. The height and cross-section of all the columns were the same as the validated columns. The details of these columns, including two of the validated column models, are presented in Table 3, where, again, the letters C, S, and CL refer to the control column, the strengthened column, and the carbon textiles, respectively. The last three numbers indicate the length of the TRM jacket measured from the base section of the column. The only variable changed was the length of the jacket.
The columns were designed such that flexural failure would be the expected dominant mode [17]. The ultimate drift ratio enhanced with the increase in the jacket length. As compared to the control model “C”, strengthening the columns enhanced the lateral drift capacity. Models S-CL-150 and S-CL-1600 failed at drift ratios of 5.94 and 12.5%, respectively, with a lateral deformation capacity improvement of 58.4 and 233.3% as compared to the control model (C). On the other hand, the ultimate drift ratio attained by the strengthened column S-CL-1600 yielded a 110% enhancement as compared to model S-CL-150. The relation between the ultimate drift ratio of the strengthened columns and the length of the TRM jackets was found to be proportional. In other words, the longer length of the TRM jackets resulted in an improvement in the ultimate drift ratio. On the other hand, the lateral load capacity was higher in the strengthened models as compared to the control one. Additionally, increasing the jacket length improved the lateral load capacity. The maximum improvement was in model S-CL-1600 (fully wrapped model), with 32.9% when compared with the control model. A similar effect was observed on the plastic hinge length as the ultimate drift ratio with the change in the TRM jacket length up to a certain point. Strengthening the columns with TRM increased the plastic hinge length up to a jacket length of 430, which corresponds to a confinement ratio of 0.2. Models S-CL-150 and S-CL-430 have a plastic hinge length of 248 and 341 mm, respectively, resulted in 3.77 and 42.7% increases as compared to the control model (C). On the other hand, the plastic hinge length in model S-CL-430 was 37.5% longer than that of the model S-CL-150. On the other hand, the plastic hinge length in model S-CL-500 and S-CL-1600 were 2.9 and 31% less than that of model S-CL-430, respectively. Model S-CL-1600, which represents a fully wrapped column, has the shortest plastic hinge length as compared to the other retrofitted column models. As a result, the plastic hinge length enlarged with the increase in the length of the TRM jacket up to a confinement ratio of 0.2. Beyond this point, the plastic hinge length reduced with the jacket length increase.
The length of the jacket has a significant impact on the mode of failure of the RC columns. The control column failed by the buckling of the longitudinal bars at the base, where the occurrence of maximum moment is expected. A similar failure mode was observed for models S-CL-150, S-CL-200, S-CL-210, S-CL-225, S-CL-250, and S-CL-275, except that the buckling of the reinforcement was above the jackets. On the other hand, models S-CL-300, S-CL-325, S-CL-350, S-CL-375, and S-CL-400, S-CL-430, S-CL-500, S-CL-600, S-CL-800, S-CL-1000, S-CL-1200, S-CL-1400, and S-CL-1600 failed by the fracture of the TRM jackets at the base section due to the buckling of the reinforcement and concrete spalling. In these models, the plastic hinge length was smaller than the length of the jacket except for S-CL-300. In this model, the jacket extended to the mid-height of the second successive stirrups from the base section of the column where the buckling is most likely to happen. The jacket rupture in model S-CL-300 is shown in Figure 8.

5.2. The Effect of Mortar Strengths

A total of three FEA column models were developed. The length and cross-section of all the columns as well as the TRM jacket’s length were the same as the validated models. The details of mortar strengths are presented in Table 4, where again the letter M stands for mortar, numbers one and two refer to the mechanical properties of mor-tar types obtained from Triantafillou [36], and three refers to the mortar strengths of the experimental study Bournas [17] used for the validation of FEA models. The only variable changed was the mortar type. Table 5 shows the results of the TRM-confined RC columns with various mortar strengths.
The effectiveness of TRM is slightly higher in models with a higher mortar flexural strength. The effectiveness of the TRM jackets herein is quantified by the ratio of the ultimate drift of the strengthened columns to the ultimate drift of the control one. In comparison to the control model “C”, strengthening the columns enhanced the lateral load capacity. Models S-CL-M1, S-CL-M2, and S-CL-M3 failed at a drift ratio of 8.75, 9.1, and 9.38%, respectively, with a lateral deformation capacity improvement of 133, 142, and 150% as compared to the control model (C). This indicates that mortars with higher flexural strengths resulted in an enhancement in the deformation capacity. On the other hand, the difference in the compressive strength of M2 and M3 did not affect the ultimate lateral deformation capacity as model S-CL-M3 resulted in a 6% improvement as compared to model S-CL-M2.
Furthermore, the mortar strengths have an insignificant impact on the plastic hinge lengths. The plastic hinge lengths in models S-CL-M1, S-CL-M2, and S-CL-M3 were 352, 363, and 356 mm, respectively, resulting in a 47.28, 47.7, and 48.95% increase in the plastic hinge length as compared to the control column.
The mode of failure of all the strengthened models was the rupture of the fibers at the base section. In column model S-CL-M1, the cracks in the mortar started to occur early as the tensile strength is relatively low. Therefore, it failed early as compared to the other two models. In models S-CL-M2 and S-CL-M3, the mortar resisted higher tensile stresses. Thus, the cracks’ development was delayed, and the columns failed at a higher ultimate drift ratio. On the other hand, the interlaminar shear strength of TRM was attributed to the compressive strength of the mortar. As the jacket is subjected to compressive forces due to the lateral cyclic loading, the shear forces between the layers are resisted by the mortar. Hence, no failure was observed within the mortar–textile interface. It may be concluded that the mortar tensile strength improved the lateral deformation capacity of the RC columns subjected to combined axial and lateral loads. Pertinent to the present study, the failure mechanism was independent of the tensile and compressive strengths of the mortar.

6. Semiempirical Modeling

As mentioned previously, neither analytical nor empirical models were found in the literature for the plastic hinge length and ultimate drift ratio of FRP or TRM-confined RC columns while considering the effect of the length of the jacket.
Consequently, the FEA results combined with the database collected from the literature were used and a semiempirical model was proposed to obtain the plastic hinge length of externally confined RC columns where the effect of the jacket’s length was also considered. Furthermore, a model was developed to calculate the ultimate drift ratio.
The equivalent plastic hinge length, the length over which the plastic curvature is considered to be constant, was reported in most of the analytical and empirical models in the literature [4,37]. Thus, the finite element results of plastic hinge lengths were used to calculate the equivalent plastic hinge length. The details are shown in the following sections.

6.1. Proposed Model for the Plastic Hinge Length (LP)

6.1.1. Plastic Hinge Length from FEA Models

According to Liang [38], two methods were used to predict the plastic hinge length from the numerical models. In the first method, the region where the tensile strain reached or exceeded the yielding strength of the longitudinal bars is defined as the plastic hinge zone. In the second approach, the curvature localization zone along the length of the column is used to define the plastic region. These two approaches are consistent [27]. In this paper, the first approach was used to determine the plastic hinge lengths from the numerical analysis. The distribution of the axial strains of the longitudinal bars at the ultimate drift ratios is shown in Figure 9.

6.1.2. Equivalent Plastic Hinge Length

The equivalent plastic hinge length can be computed by assuming a linear distribution of the inelastic curvature and the ultimate rotation occurring at the base section of the columns [37]. This assumption simplifies the calculations of the equivalent plastic hinge length and yields an accurate approximation of the physical behavior of the plastic hinge region. Many models for the plastic hinge length of RC columns retrofitted with composites were proposed based on this assumption [25,26,27]. Therefore, the plastic hinge lengths identified from the numerical analysis were compared to the equivalent plastic hinge length calculated from the following equation [37]:
L P = L P r 2 + L P b
where LPr is the plastic hinge zone extracted from the numerical models, and LPb is the length related to the strain penetration of longitudinal reinforcement into the base footing and is given by the following:
L P b = 0.022 f y × d P
where fy is the yield strength of the longitudinal reinforcement, and dP is the longitudinal bar diameter. Table 6 shows the numerical and equivalent plastic hinge length values of the simulated column models.

6.1.3. Proposed Equation for Lp

The model proposed by Jiang [27] (Equation (14)) that accounts for square columns was adopted and modified in this paper to account for the effect of external confinement length.
L P = 0.022 f y d P + 2 r b 0.72 a 0 λ f L   λ f 0.2   b 0 b 1 λ f + b 2 λ f 2 L   λ f 0.2
where fy is the yield strength of the longitudinal reinforcement; dP is the bar diameter; r is the radius of the corners; b is the width of the column; L is the column’s heights; the coefficients a0, b0, b1, b2 are to be determined; and the confinement ratio (λf) is as follows:
λ f = f L f c o
where fco is the compressive strength of the concrete, and the confining pressure produced by the external jacket (fL) is calculated by the following:
f L = 2   f f r p   t f b
where ffrp is the tensile strength of FRP jackets, and tf is the thickness of the jacket. By substituting Equation (16) in Equation (15), the confinement ratio can be expressed as follows:
λ f = f L f c o = 2 f f r p t f b   f c o
However, Jiang [27] did not specify the volumetric ratio of the jackets with respect to concrete (ρ). Therefore, the confinement ratio (λ) proposed by Benzaid [39] was used in the present study (Equation (18)) as follows:
λ f = f L f c o = ρ   f f r p 2 = 2 t f   f f r p   2   b   f c o
and the volumetric ratio of the jacket with respect to concrete in columns with square cross-section is calculated by the following:
ρ = 4 t f   2   b
Thereafter, a linear relation between the jacket length (Ljacket) and the column height (L) is included to address the effect of the jacket length and, thus, the following Equation (19) shown below is proposed in the present study:
ρ = 4 t f   L j a c k e t 2   b   L
and the confinement ratio can then be expressed by the following:
λ f = 2 n t f   f F R P   o r   T R M   2   b   f c o   . L J a c k e t L

6.1.4. Regression Analysis

A total of 33 confined square columns, 14 from the literature [40,41,42,43] combined with 19 models from the present study, were used to determine the coefficients in Equation (14). Table 7 shows the details of all the columns. The experiments used from the literature were carried out on the RC column confined with FRP since the data of the plastic hinge lengths in the TRM-confined columns are limited. Furthermore, all the columns in these experiments failed due to the jackets rupturing. By comparing the results of Lp and performing a regression analysis, the coefficients were calculated to be (a0 = 0.69, b0 = 0.367, b1 =-1.5, b2 = 1.38). Therefore, the modified plastic hinge length (Equation (22)) is proposed as follows:
L P = 0.08 L + 0.022 f y d P + 2 r b 0.72 0.69 λ f L   , | λ f < 0.2 0.367 1.5 λ f + 1.38 λ f 2 L   , | λ f 0.2
Subsequently, the Lp values obtained from the experimental studies from the literature and the finite element models of the present study were used to evaluate the accuracy of the proposed semiempirical model. Figure 10 shows good agreement between FEA and the experimental dataset and the proposed Lp.
The maximum difference between the Lp values calculated using the proposed equation (Equation (22)) and the values obtained from FEA and experimental studies was 8.96%, with an average of 3.52%. This indicates that the proposed model is in good agreement with the data collected from the literature and the present FEA study.

6.2. Proposed Model for Ultimate Drift Ratio

Park [44] proposed an expression for the ultimate displacement at the tip of the cantilever columns. This expression was adopted in this paper to calculate the ultimate drift in square RC column confined with TRM or FRP.
Δ u = Δ y + Δ p = φ y L 2 3 + φ u φ y L P L 0.5 L P
where Δy is the yield displacement, Δp is the plastic displacement, φu is the ultimate curvature at the column base, φy is the yield curvature, and L and Lp are the lengths of the cantilever column and the plastic hinge, respectively. The ultimate drift ratio, θu, can be expressed as follows:
θ u = Δ u L = φ y L 3 + φ u φ y L P L 0.5 L P L
The yield and ultimate curvatures can be calculated by performing a section analysis as follows:
φ y = λ ε y d
φ u = ε c u c
where εy is the yield strain of the longitudinal reinforcement, d is the effect depth of the cross section, εcu is the ultimate compressive strain in concrete, and c is the depth of the neutral axis. The λ value, according to Biskinis [45], was equal to 1.55. The depth of neutral axis was obtained based on the following model proposed by Yuan [26]:
c d = 0.14 + 0.65 0.67 λ f n
where n is the axial force ratio. The model proposed by Yuan [26] was used since it is the only model that is applicable for square sections and includes the effect of the external confinement.
A linear relationship between the ultimate concrete strain and the confinement ratio can be seen in Figure 11. By performing regression analysis using the numerical results of 19 FEA models, the ultimate concrete strain can be expressed as follows:
ε c u = 0.0061 + 0.038 λ f
By substituting Equations (27) and (28) into Equation (26), the ultimate curvature is then expressed as follows:
φ u = 0.0061 + 0.038 λ f 0.14 + 0.65 0.67 λ f n d
The ultimate drift ratio can now be obtained by substituting Equations (25) and (29) into Equation (24). Therefore, the ultimate drift ratio for square RC columns confined with FRP or TRM can be obtained by the following:
θ u = 1.55 ε y 3 d + 0.0061 + 0.038 λ f 0.14 + 0.65 0.67 λ f ×   n 1.55 ε y L P L 0.5 L P L × d
where Lp is calculated from the proposed model (Equation (22)) described in the previous section. The ultimate drift ratios obtained from the previous experiments, see (Table 8), and the present numerical analysis were compared to the proposed equation (Equation (30)) and another model developed by Yuan [26], which was selected since it was based on square columns. The comparison results are listed in Table 8. The average difference between the θu values calculated using the proposed model and the values obtained from Yuan [26] and FEA and the experimental studies was 15.23 and 23.9%, respectively.

7. Conclusions

TRM-confined RC columns subjected to combined axial and lateral cyclic loadings were modeled using the ANSYS nonlinear finite element software program. The developed FE models were validated using experimental results of three TRM-confined RC columns. Moreover, a parametric study was conducted to investigate the effect of various jacket lengths (which ranged between 9.4 and 100% of the column length) and mortar strengths (flexural strength ranged between 3.28 and 6.51 MPa, whereas the compressive strength ranged from 8.56 to 30.61 MPa) on the plastic hinge length and ultimate drift ratio of the columns. Subsequently, two semiempirical models were proposed to predict the plastic hinge length and ultimate drift ratio while considering the impact of the jacket length. The primary conclusions were as follows:
  • The ultimate drift ratio and lateral load capacity increase as the length of the TRM jackets increase. A fully wrapped column model with a jacket length of 1600 mm yielded a 110 and 32.9% enhancement in the ultimate drift ratio and lateral load capacity, respectively, as compared to column model with only a 150-mm jacket length.
  • The plastic hinge length enlarged with the increase in the length of the TRM jacket up to a confinement ratio of 0.2. Beyond this point, the plastic hinge length reduced.
  • Mortars with higher flexural strengths resulted in an enhancement in the deformation capacity. On the other hand, the difference in the compressive strength of M2 and M3 had an insignificant effect on the ultimate lateral deformation capacity as model S-CL-M3 resulted in a 6% improvement as compared to model S-CL-M2.
  • Mortar strengths have an insignificant impact on the plastic hinge length of the column. The maximum difference observed was 2.8%.
  • The failure mechanism was independent of the tensile and compressive strengths of the mortar as all the columns failed due to the fracture of the fibers at the base section. However, increasing the jacket’s length shifted the failure from the buckling of the longitudinal bars to the rupture of the textiles.
  • An equation for the plastic hinge length of TRM-confined RC columns, while considering the effect of the length of the jacket, was proposed. The results agreed well with the experimental and FEA models’ results with an average difference of 3.52%.
  • A semiempirical model was developed for the ultimate drift capacity of RC columns confined with TRM or FRP. The results were compared with experimental and FEA results, and the average difference was 15.23%. On the other hand, the average error of the Yuan [26] model was 23.9% as compared to the data collected from the literature, indicating that the proposed model in this study yielded relatively accurate results.

Author Contributions

Data curation, M.A.; investigation, A.P. and M.A.; conceptualization, A.P.; methodology, A.P.; project administration, A.P.; software, M.A.; validation, M.A., supervision, A.P.; writing—original draft, M.A.; writing—review and editing, A.P. Both authors have read and agreed to the published version of the manuscript.

Funding

This research received no external funding.

Data Availability Statement

Not applicable.

Conflicts of Interest

The authors declare no conflict of interest.

References

  1. Xue, Q.; Chen, C. Performance-based seismic design of structures: A direct displacement-based approach. Eng. Struct. 2003, 25, 1803–1813. [Google Scholar] [CrossRef]
  2. Sheikh, S.A.; Khoury, S.S. A performance-based approach for the design of confining steel in tied columns. ACI Struct. J. 1997, 94, 421–431. [Google Scholar]
  3. Paultre, P.; Légeron, F. Confinement reinforcement design for reinforced concrete columns. J. Struct. Eng. 2008, 134, 738–749. [Google Scholar] [CrossRef]
  4. Priestley, M.; Park, R. Strength and ductility of concrete bridge columns under seismic loading. ACI Struct. J. 1987, 84, 61–76. [Google Scholar]
  5. Paulay, T.; Priestley, M.J.N. Seismic Design of Reinforced Concrete and Masonry Buildings; Wiley: New York, NY, USA, 1992. [Google Scholar]
  6. Sheikh, S.A.; Khoury, S.S. Confined concrete columns with stubs. ACI Struct. J. 1993, 90, 414–431. [Google Scholar]
  7. Panagiotakos, T.B.; Fardis, M.N. Deformations of reinforced concrete members at yielding and ultimate. ACI Struct. J. 2001, 98, 135–148. [Google Scholar]
  8. Berry, M.P. Performance Modeling Strategies for Modern Reinforced Concrete Bridge Columns. Ph.D. Thesis, University of Washington, Seattle, WA, USA, 2006. [Google Scholar]
  9. Biskinis, D.; Fardis, M.N. Models for FRP-wrapped rectangular RC columns with continuous or lap-spliced bars under cyclic lateral loading. Eng. Struct. 2013, 57, 199–212. [Google Scholar] [CrossRef]
  10. ElGawady, M.; Booker, A.; Dawood, H. Seismic behavior of posttensioned concrete-filled fiber tubes. J. Compos. Constr. 2010, 14, 616–628. [Google Scholar] [CrossRef]
  11. Ozbakkaloglu, T.; Idris, Y. Seismic behavior of FRP-high-strength concrete-steel double-skin tubular columns. J. Struct. Eng. 2014, 140, 4014–4019. [Google Scholar] [CrossRef]
  12. Youssf, O.; ElGawady, M.; Mills, J.; Ma, X. Finite element modelling and dilation of FRP-confined concrete columns. Eng. Struct. 2014, 79, 70–85. [Google Scholar] [CrossRef]
  13. Tetta, Z.; Koutas, L.; Bournas, D. Shear strengthening of concrete members with TRM jackets: Effect of shear span-to-depth ratio, material and amount of external reinforcement. Compos. Part B Eng. 2018, 137, 184–201. [Google Scholar] [CrossRef]
  14. Bournas, D.A.; Lontou, P.V.; Papanicolaou, C.G.; Triantafillou, T.C. Textile-reinforced mortar (TRM) versus FRP confinement in reinforced concrete columns. ACI Struct. J. 2007, 104, 740–748. [Google Scholar]
  15. Bournas, D.A.; Triantafillou, T.C.; Zygouris, K.; Stavropoulos, F. Textile-reinforced mortar (TRM) versus FRP jacketing in seismic retrofitting of RC columns with continuous or lap-spliced deformed bars. J. Compos. Constr. 2009, 13, 360–371. [Google Scholar] [CrossRef]
  16. Bournas, D.A.; Triantafillou, T.C. Innovative Seismic Retrofitting of RC Columns Using Advanced Composites, Advances in Performance-Based Earthquake Engineering; Springer: Amsterdam, The Netherlands, 2010. [Google Scholar]
  17. Bournas, D.A.; Triantafillou, T.C. Bar buckling in RC columns confined with composite materials. J. Compos. Constr. 2011, 15, 393–403. [Google Scholar] [CrossRef]
  18. Yin, S.P.; Peng, C.; Jin, Z.Y. Research on mechanical properties of axial-compressive concrete columns strengthened with TRC under a conventional and chloride wet-dry cycle environment. J. Compos. Constr. 2016, 21, 1–11. [Google Scholar] [CrossRef]
  19. Yao, L.; Shi-ping, Y.; Wen-jie, C. Seismic behavior of corrosion-damaged RC columns strengthened with TRC under a chloride environment. Constr. Build. Mater. 2019, 201, 736–745. [Google Scholar] [CrossRef]
  20. Dinh, N.H.; Park, S.H.; Choi, K.K. Seismic performance of reinforced concrete columns retrofitted by textile-reinforced mortar jackets. Struct. Infrastruct. Eng. 2020, 16, 1364–1381. [Google Scholar] [CrossRef]
  21. Ming, L.; Shi-Ping, Y.; Xi, C. Seismic behavior of textile-reinforced concrete–strengthened RC columns under different axial compression ratios. J. Eng. Fibers Fabr. 2019, 14, 1–11. [Google Scholar] [CrossRef]
  22. Yin, S.; Li, Y.; Li, S.; Yang, Y. Seismic performance of RC columns strengthened with textile-reinforced concrete in chloride environment. J. Compos. Constr. 2020, 24, 1–13. [Google Scholar] [CrossRef]
  23. Li, Y.; Yin, S.; Dai, J.; Liu, M. Numerical investigation on the influences of different factors on the seismic performance of TRC-strengthened RC columns. J. Build. Eng. 2020, 30, 101245. [Google Scholar] [CrossRef]
  24. Gu, D.; Wu, Y.; Wu, G.; Wu, Z. Plastic hinge analysis of FRP confined circular concrete columns. Constr. Build. Mater. 2012, 27, 223–233. [Google Scholar] [CrossRef]
  25. Youssf, O.; ElGawady, M.; Mills, J. Displacement and plastic hinge length of FRP-confined circular reinforced concrete columns. Eng. Struct. 2015, 101, 465–476. [Google Scholar] [CrossRef]
  26. Yuan, F.; Wu, Y.; Li, C. Modelling plastic hinge of FRP-confined RC columns. Eng. Struct. 2017, 131, 651–668. [Google Scholar] [CrossRef]
  27. Jiang, C.; Wu, Y.; Wu, G. Plastic Hinge Length of FRP-Confined Square RC Columns. J. Compos. Constr. 2014, 18, 04014003. [Google Scholar] [CrossRef]
  28. ANSYS® Academic Research Mechanical Release 17; Help System: ANSYS, Inc. 2017. Available online: http://www.ansys.com/ (accessed on 27 September 2017).
  29. ACI 318. Building Code Requirements for Structural Concrete (ACI 318–19) and Commentary (ACI 318R–19); American Concrete Institute (ACI): Farmington Hills, MI, USA, 2019. [Google Scholar]
  30. Mander, J.B.; Priestly, M.J.N.; Park, R. Theoretical stress-strain model for confined concrete. ASCE J. Struct. Eng. 1988, 114, 1804–1826. [Google Scholar] [CrossRef] [Green Version]
  31. American Concrete Institute. ACI 549.4R–13: Guide to Design and Construction of Externally Bonded Fabric-Reinforced Cementitious Matrix (FRCM) Systems for Repair and Strengthening Concrete and Masonry Structures; American Concrete Institute: Farmington Hills, MI, USA, 2013; p. 74. [Google Scholar]
  32. William, K.J.; Warnke, E.P. Constitutive Model for the Triaxial Behavior of Concrete; International Association for Bridge and Structural Engineering: Zürich, Switzerland; ISMES: Bergamo, Italy, 1975; Volume 19, p. 174. [Google Scholar]
  33. Alhaddad, M.; Siddiqui, N.; Abadel, A.; Alsayed, S.; Al-salloum, Y. Numerical investigations on the seismic behavior of FRP and TRM upgraded RC exterior beam-column joints. J. Compos. Constr. 2012, 16, 308–321. [Google Scholar] [CrossRef]
  34. Lu, X.; Teng, J.; Ye, L.; Jiang, J. Bond-slip models for FRP sheets/plates bonded to concrete. Eng. Struct. 2005, 27, 920–937. [Google Scholar] [CrossRef]
  35. Murcia-Delso, J.; Shing, P.B. Bond-slip model for detailed finite-element analysis of reinforced concrete structures. J. Struct. Eng. 2014, 141, 04014125. [Google Scholar] [CrossRef]
  36. Triantafillou, T.C.; Papanicolaou, C.G.; Zissimopoulos, P.; Laourdekis, T. Concrete confinement with textile-reinforced mortar jackets. ACI Struct. J. 2006, 103, 28–37. [Google Scholar]
  37. Hines, E.M.; Restrepo, J.I.; Seible, F. Force-displacement characterization of well-confined bridge piers. ACI Struct. J. 2004, 101, 537–548. [Google Scholar]
  38. Liang, R.; Fang, B.; Wang, K.; Yuan, F. Numerical investigation on plastic hinge length of ultra-high performance concrete column under cyclic load. J. Earthq. Eng. 2020, 1–19. [Google Scholar] [CrossRef]
  39. Benzaid, R.; Mesbah, H. Strength model for square concrete columns confined by external CFRP sheets. Struct. Eng. Mech. 2013, 46, 111–135. [Google Scholar] [CrossRef]
  40. Wang, J.; Yang, J.; Cheng, L. Experimental study of seismic behavior of high-strength RC columns strengthened with CFRP subjected to cyclic loading. J. Struct. Eng. 2019, 145, 04018240. [Google Scholar] [CrossRef]
  41. Del Zoppo, M.; Di Ludovico, M.; Balsamo, A.; Prota, A. Comparative analysis of existing RC columns jacketed with CFRP or FRCC. Polymers 2018, 10, 361. [Google Scholar] [CrossRef] [Green Version]
  42. Ouyang, L.; Gao, W.; Zhen, B.; Lu, Z. Seismic retrofit of square reinforced concrete columns using basalt and carbon fiber-reinforced polymer sheets: A comparative study. Compos. Struct. 2017, 162, 294–307. [Google Scholar] [CrossRef]
  43. Wang, D.; Huang, L.; Yu, T.; Wang, Z. Seismic performance of CFRP-retrofitted large-scale square RC columns with high axial compression ratios. J. Compos. Constr. 2017, 21, 04017031. [Google Scholar] [CrossRef]
  44. Park, R.; Paulay, T. Reinforced Concrete Structures; John Wiley & Sons: Hoboken, NJ, USA, 1975. [Google Scholar]
  45. Biskinis, D.E. Deformations of Concrete Members at Yielding and Ultimate. Ph.D. Thesis, University of Patras, Patras, Greece, 2007. (In Greek). [Google Scholar]
Figure 1. (a) Schematic of test set-up; (b) cross-section and textiles orientation. Bournas [17].
Civileng 02 00037 g001
Figure 2. Stress–strain relationships of confined and unconfined concrete.
Civileng 02 00037 g002
Figure 3. (a) Geometry of the strengthened models; (b) reinforcement details.
Civileng 02 00037 g003
Figure 4. Representation of the cyclic displacement-controlled load.
Civileng 02 00037 g004
Figure 5. (a) Reinforcement buckling of the control column at failure; (b) cracks in the concrete at failure.
Civileng 02 00037 g005
Figure 6. Load versus drift ratio envelopes: (a) L0_C, (b) L_M4.
Civileng 02 00037 g006
Figure 7. Strains in longitudinal bar: (a) control column, (b) strengthened with carbon TRM.
Civileng 02 00037 g007
Figure 8. Fracture of TRM jacket in model S-CL-300.
Civileng 02 00037 g008
Figure 9. Distribution of axial strain in the longitudinal reinforcement.
Civileng 02 00037 g009
Figure 10. Comparison of FEA and experimental dataset and the proposed Lp.
Civileng 02 00037 g010
Figure 11. The relation between the ultimate strain in concrete and confinement ratio.
Civileng 02 00037 g011
Table 1. Results of the Experiment and the FEM Models.
Drift at Failure (%)Peak Force (KN)
ExperimentFEADifference (%)ExperimentFEADifference (%)
Experiment IDFEA model IDPushPullPushPullPushPullPushPullPushPullPushPull
L0_CC3.433.433.753.759.39.341.63−42.543.7−43.94.973.34
L0_M4S-CL-430>7.8>7.89.389.1--45.77−49.248.1−48.45.11.6
L0_M4GS-G-4307.56.98.17.588.748.82−45.349.5−49.31.48.9
Table 2. Strains in Longitudinal Bars.
Compressive Axial Strain in Longitudinal Bars
Column IDDrift Ratio (%)ExperimentalNumerical (ANSYS)Exp./Num. (%)
C3.1−0.0077−0.00743.9
S-CL-4304.3−0.0082−0.00811.22
S-G-4305.3−0.0063−0.005827.62
Table 3. Results of TRM Strengthened Column Models with Various Jacket Lengths.
Column IDJacket Length (mm)Θu
(%)
Difference of Strengthened and Control (%)Lpr
(mm)
Difference of Strengthened and Control (%)Mode of Failure
C-3.75-239-Buckling of longitudinal bars at the base section
S-CL-1501505.9458.42483.77Buckling of longitudinal bars above the jacket
S-CL-2002006.5674.927113.4Buckling of longitudinal bars above the jacket
S-CL-2102106.5674.927715.9Buckling of longitudinal bars above the jacket
S-CL-2252256.8783.228720.1Buckling of longitudinal bars above the jacket
S-CL-2502507.1891.529623.8Buckling of longitudinal bars above the jacket
S-CL-2752757.1891.530226.4Buckling of longitudinal bars above the jacket
S-CL-3003007.510030628Rupture of the jacket
S-CL-3253257.81108.331431.4Rupture of the jacket
S-CL-3503508.13116.831933.5Rupture of the jacket
S-CL-3753758.43124.832837.2Rupture of the jacket
S-CL-4004008.75133.333540.2Rupture of the jacket
S-CL-4304309.3815034142.7Rupture of the jacket
S-CL-50050010.0166.733238.9Rupture of the jacket
S-CL-60060010.6182.731431.4Rupture of the jacket
S-CL-80080010.9190.729121.8Rupture of the jacket
S-CL-1000100011.2520027113.4Rupture of the jacket
S-CL-1200120011.252002587.9Rupture of the jacket
S-CL-1400140011.56208.72462.9Rupture of the jacket
S-CL-1600160012.5233.3235−1.7Rupture of the jacket
Note: θu = ultimate drift ratio, LPr = plastic hinge length extracted from the numerical models.
Table 4. Flexural and Compressive Strengths of Mortars.
MortarFlexural Strength (MPa)Compressive Strength (MPa)
M13.288.56
M24.2430.61
M36.5120.8
Table 5. Results of TRM Strengthened Column Models with Various Mortar Strengths.
Column Notationθu
(%)
Diff. between Strengthened and Control (%)Lpr (mm)Mode of Failure
C3.75-239Buckling of longitudinal bars at the base section
S-CL-M18.75133352Rupture of the jacket
S-CL-M29.1142363Rupture of the jacket
S-CL-M39.38150356Rupture of the jacket
Table 6. Physical and Equivalent Plastic Hinge Lengths of the Simulated Models.
ModelLpr (mm)Lp (mm)
C239280
S-CL-150248285
S-CL-200271296
S-CL-210277300
S-CL-225287305
S-CL-250296309
S-CL-275302312
S-CL-300306314
S-CL-325314318
S-CL-350319320
S-CL-375328325
S-CL-400335328
S-CL-430341332
S-CL-500332331
S-CL-600314318
S-CL-800291306
S-CL-1000271296
S-CL-1200258290
S-CL-1400246284
S-CL-1600235278
Table 7. Results of Columns from Experimental Work in the Literature [40,41,42,43] and Present Numerical Study.
StudyIDLjacket (mm)Lc (mm)dP (mm)fy (Mpa)fco (Mpa)tf (mm)fFRP (Mpa)λfLp (mm)
Experiments
Lp (mm)FEALp (mm) PredictedDifference (%)
Wang [40]LA250065016362.850.40.22234000.20216 1978.96
Zoppo [41]CL_FRPa50015001852514.90.3329900.22370 3602.57
CL_FRPb500150018525160.3347880.32330 3434.01
CM_FRPa50015001852529.10.6629900.22367 3601.96
CM_FRPb50015001852533.30.6647880.31333 3473.94
Ouyang [42]C-B2100011751838629.60.3421000.20285 2724.63
C-B3100011751838629.60.5121000.30253 2633.95
C-BC100011751838629.60.33721000.20286 2724.87
C-C2100011751838629.60.33431000.29256 2653.63
C-C3100011751838629.60.50131000.44230 2156.59
Wang [43]N4C3A7550014002043727.40.50143400.22372 3583.64
N4C4A4550014002043727.40.66843400.29323 3436.2
N3C2A5545010501635827.40.33443400.23252 2501.08
N3C3A4545010501635827.40.50143400.35203 2166.62
FEAS-CL-15015016001452324.30.3838000.07 2852902.12
S-CL-20020016001452324.30.3838000.09 2963032.18
S-CL-21021016001452324.30.3838000.09 3003051.9
S-CL-22522516001452324.30.3838000.10 3053090.95
S-CL-25025016001452324.30.3838000.11 3093141.57
S-CL-27527516001452324.30.3838000.12 3123182
S-CL-30030016001452324.30.3838000.13 3143222.61
S-CL-32532516001452324.30.3838000.15 3183262.38
S-CL-35035016001452324.30.3838000.16 3203292.64
S-CL-37537516001452324.30.3838000.17 3253311.8
S-CL-40040016001452324.30.3838000.18 3283331.43
S-CL-43043016001452324.30.3838000.19 3323350.68
S-CL-50050016001452324.30.3838000.22 3313413.16
S-CL-60060016001452324.30.3838000.27 3183232.57
S-CL-80080016001452324.30.3838000.36 3062953.4
S-CL-1000100016001452324.30.3838000.45 2962776.62
S-CL-1200120016001452324.30.3838000.54 2902716.52
S-CL-1400140016001452324.30.3838000.62 2842672.49
S-CL-1600160016001452324.30.3838000.71 2782646.54
Average 3.52
Table 8. Comparison of FEA and experimental dataset [37,38,39,40] and the proposed θu.
StudyIDθu ExperimentΘu Proposed
Equation (30)
Error (%)Θu
Yuan [26]
Error (%)
WangLA23.403.1415.73.147.65
ZoppoCL_FRPa10.407.6623.678.6616.73
CL_FRPb9.608.956.768.956.77
CM_FRPa9.607.7215.967.7219.58
CM_FRPb9.608.794.388.798.44
OuyangC-B23.153.022.753.024.13
C-B33.113.6734.693.6718.01
C-BC3.683.0117.273.0118.21
C-C23.743.609.233.63.74
C-C33.074.8368.54.8357.33
WangN4C3A752.482.31142.316.85
N4C4A454.513.6616.453.6618.85
N3C2A553.842.8130.72.8126.82
N3C3A454.863.6920.123.6924.07
FEAS-CL-1505.942.3916.973.3942.93
S-CL-2006.563.437.84.4332.47
S-CL-2106.563.8110.124.8126.68
S-CL-2256.873.8911.364.6931.73
S-CL-2507.184.016.884.8133.01
S-CL-2757.184.226.455.0230.08
S-CL-3007.504.435.825.2330.27
S-CL-3257.814.655.255.4430.35
S-CL-3508.134.874.395.6730.26
S-CL-3758.435.093.715.9928.94
S-CL-4008.755.336.196.4326.51
S-CL-4309.385.577.386.4731.02
S-CL-50010.005.8628.86.7632.40
S-CL-60010.606.3424.97.4329.91
S-CL-80010.906.820.16.837.61
S-CL-100011.257.9318.97.9329.51
S-CL-120011.259.275.219.5215.38
S-CL-140011.5611.0610.310.0612.98
S-CL-160012.5013.5721.814.7518.00
15.23 23.9
Publisher’s Note: MDPI stays neutral with regard to jurisdictional claims in published maps and institutional affiliations.

