Article

Bond Modelling for the Assessment of Transmission Length in Prestressed-Concrete Members

Department of Civil, Environmental and Architectural Engineering, University of Padova, via Marzolo 9, 35131 Padova, Italy
*
Author to whom correspondence should be addressed.
CivilEng 2020, 1(2), 75-92; https://doi.org/10.3390/civileng1020006
Submission received: 20 May 2020 / Revised: 24 June 2020 / Accepted: 25 June 2020 / Published: 30 June 2020
(This article belongs to the Special Issue Connections in Concrete)

Abstract

:
Transmission of the prestressing force to concrete by prestressing tendons is a topic of discussion within the fib Task Group 2.5: Bond and Material Models. Particularly, the extensive use of pretensioned prestressed-concrete (PC) requires adequate knowledge of bond development at the steel–concrete interface after prestress release. The transmission length, representing the distance from the free-end of the beam necessary to transmit the fully effective prestressing-force to the surrounding concrete, is a design parameter of paramount importance for PC members detailing. This contribution presents the analytical modelling of the transmission length based on the thick-walled cylinders (TWC) theory, considering anisotropic behaviour of the concrete. To derive the optimal friction coefficient between steel and concrete, the theoretical model has been calibrated according to an experimental database of transmission lengths collected from the literature, encompassing 130 data points from 7 different campaigns. Additionally, local behaviour has been analysed by assessing radial cracking and bond stress development along the transmission length.

1. Introduction

Bond in prestressed-concrete (PC) members is responsible for the correct transmission of the prestressing force from steel to concrete within the so-called transmission length (fib MC2010 [1]) or transfer length (ACI 318-14 [2]), as described in Figure 1. Additionally, bond also plays a significant role during the service life of the beam, when it is loaded to flexure, contributing to its general integrity. In this situation, the tendon stress at the nominal flexural strength is assumed to be anchored to the concrete within the anchorage length (fib MC2010 [1]) or development length (ACI 318-14 [2]). Such two situations are commonly known as “push-in” and “pull-out”, respectively. Therefore, the correct evaluation of the transmission length is of paramount importance for both service (SLS) and ultimate (ULS) limit state verification of PC members. Indeed, the knowledge of the transmission length is necessary for checking allowable stresses at the release of prestressing strands, as well as for determining the anchorage capacity of the element.
Three main mechanisms are commonly recognised as contributing to bond development between prestressing tendons and concrete: adhesion, mechanical interlocking and friction. Such mechanisms develop subsequently, with increasing slip values. The first, adhesion, refers to the elastic deformation of the cementitious layer around the tendon due to its chemical and physical properties, as well as interlocking between cement-matrix particles and microscopic roughness of the steel surface. However, relative displacements take place between steel and concrete, as a result of the steel stress gradient along the transmission length. This breaks the adhesive effect, which can actually be neglected [3,4]. The second mechanism, mechanical interlocking, depends significantly on the shape, indentation and surface characteristics of the tendon. For individual clean wires, it is reasonable to assume that mechanical anchorage plays a minimal role in governing the whole bond behaviour, because of the smooth texture of the outer surface of the wire. Conversely, seven-wire strands exhibit helical patterns of the individual wires that are expected to offer significantly higher mechanical resistance and bond capacity, unavailable to straight wires. The third mechanism is represented by friction, which is considered to be the major contribution to the whole bond between prestressing steel and concrete. In fact, in addition to frictional contribution offered similarly to that in conventional ribbed bars [5], in a PC member the strand diameter tends to increase at the release of the prestressing-force, as a result of the recovery of the longitudinal contraction. As long as the surrounding concrete remains uncracked, such radial expansion of the strand results in a wedging action between the two materials, leading to an enhanced frictional bond capacity in the transmission zone (known as the Hoyer effect).
The evaluation of the transmission length is still a matter of discussion, particularly within the fib Task Group 2.5: Bond and Material Models. Existing design codes for concrete structures provide simplified formulations, with disagreeing predictions [6,7]. It is recognised that many primary factors influence the bond mechanisms at prestressing-force release. However, a model accounting for different concrete and steel properties as a closed-form expression to predict the transmission length has not been developed yet. Some recent advances in this field have been reached by Abdelatif et al. (2015) [8] and Ramirez-Garcia et al. (2017) [9], who used dedicated theoretical models to predict bond behaviour of PC members along the transmission length. Particularly, the thick-walled cylinders (TWC) theory, applied to this specific problem, has allowed reaching promising results, even though existing studies are generally calibrated on a limited number of experimental results. Moreover, the local bond behaviour has not been analysed in detail. In this contribution, the analytical modelling of the transmission length based on the TWC theory is presented, considering anisotropic properties for the concrete in tension. In order to derive the optimal friction coefficient between steel and concrete, the model has been calibrated according to a comprehensive experimental dataset of transmission lengths collected from the literature, containing 130 data points from 7 different campaigns. Finally, the local behaviour at the steel–concrete interface has been analysed in detail for some indicative PC specimens, aiming at assessing radial cracking and bond stress development along the transmission length. The average value of the bond strength arising from the proposed model has been computed and compared to that provided by current design codes.

2. Roles of the Major Parameters Affecting the Transmission Length

The transmission of the prestressing force from steel to concrete is typically influenced by many important variables, both quantitative and qualitative parameters. However, only some of them are actually taken into account within the principal design codes (fib MC2010 [1]; ACI 318-14 [2]; Eurocode 2 [10]) for the transmission length calculation. Many investigations were carried out in literature about the role of the tendon diameter on the transmission length of PC members, with little uncertainties in it. Particularly, it is commonly accepted that the transmission length linearly increases with the nominal tendon diameter. Adhesion, friction and mechanical interlock are influenced in different ways by this parameter. Oh and Kim (2000) [11] studied the role of the strand size on transmission length by analysing PC specimens with same characteristics, but equipped with strands of two different diameters, i.e., 12.7 and 15.2 mm. Experimental results clearly demonstrated an average increase of 25% in the measured transmission lengths for a 15.2 mm strand compared with those for a 12.7 mm strand, which is approximately the ratio between the two diameters. A recent work by Dang et al. (2018) [12] extended the study on 18-mm-diameter strands in self-consolidating concrete (SCC), which has extensive advances in bridge engineering. Furthermore, there is not much uncertainty about a linear correlation between the transmission length and the initial prestress level, within the limited range of initial stresses used in PC applications. This behaviour is also accepted by current codes as they are based on uniform distribution of bond stresses along the transmission length.
The transmission length has also been investigated with respect to concrete strength, concrete cover and tendon spacing, which should be considered as primary quantitative factors. In fact, it is widely recognised that the larger modulus of elasticity and smaller shrinkage strains after release, associated with higher concrete compressive strength, improve bond characteristics and result in smaller transmission length values. Zia et al. (1977) [13] derived an inverse proportional relation between transmission length and concrete strength, which was confirmed by Martí-Vargas et al. (2012) [14] on a study about concrete composition effects on the anchorage length. Mitchell et al. (1993) [15] suggested a dependence of the transmission length upon the inverse of the square root of concrete compressive strength at release. Then, the effect of concrete cover and tendon spacing on the transmission length has been examined only more recently by researchers. These parameters should be such as to avoid cracking and localised bond failures at release. It is recalled that concrete cover and tendon spacing are not explicitly taken into account in the design code formulations. Oh et al. (2006) [16] carried out an extensive experimental campaign to understand the role of these variables. They tested twin-strand specimens with three different tendon spacings (equal to 2, 3 and 4 times the nominal strand diameter, respectively) and mono-strand specimens characterised by three different concrete covers (30, 40 and 50 mm, respectively). The transmission length was found to decrease quadratically as strand spacing and concrete cover increase, due to the larger confining stresses provided by the surrounding concrete on the tendons.
The most important qualitative variables having influence on the transmission length are the type of prestress release and the tendon surface condition. Several studies investigating the effect of prestress release method on the nature of bond have shown that a sudden flame-cutting of the tendons often results in longer transmission lengths than a gradual release process [17,18]. This phenomenon is generally attributed to the dynamic effects associated with the transfer of energy from the tendon to the concrete. Kaar and Hanson (1975) [19] and Cousins et al. (1990) [20] found that sudden release by flame-cutting the tendons gives transmission lengths of 8 to 22 percent longer than those determined for similar tendons gradually released. An additional distinction about release method has been recently highlighted by Pellegrino et al. (2018) [21], who showed that transmission length also depends on the considered free-end of the member, i.e., the “cut-end” or the “dead-end”. Such terms refer to the side of the specimen where strands are actually cut and its opposite, where stresses are released. Based on the experimental tests carried out in [11], Pellegrino et al. (2018) [21] demonstrated that transmission lengths at the cut end are, on average, up to 16% longer than those at the dead end, when sudden release is applied. Lastly, the influence of the tendon surface condition on the transmission length has been examined by Cousins et al (1990) [20]. In fact, to provide corrosion protection of tendons in PC members located in aggressive environments, it can be useful using an epoxy-coating as a corrosion-inhibiting barrier. In this case, the epoxy-coating should be impregnated e.g., with grit (crushed glass) to improve its bond characteristics with concrete. It was observed that increasing grit density results in shorter transmission length values. Other studies [22], reference [23] analysed instead the effect of the potential presence of rust onto the strands, in small amounts, for promoting the roughness of the steel surface. Rusted tendons were found to give shorter transmission lengths than smooth ones.

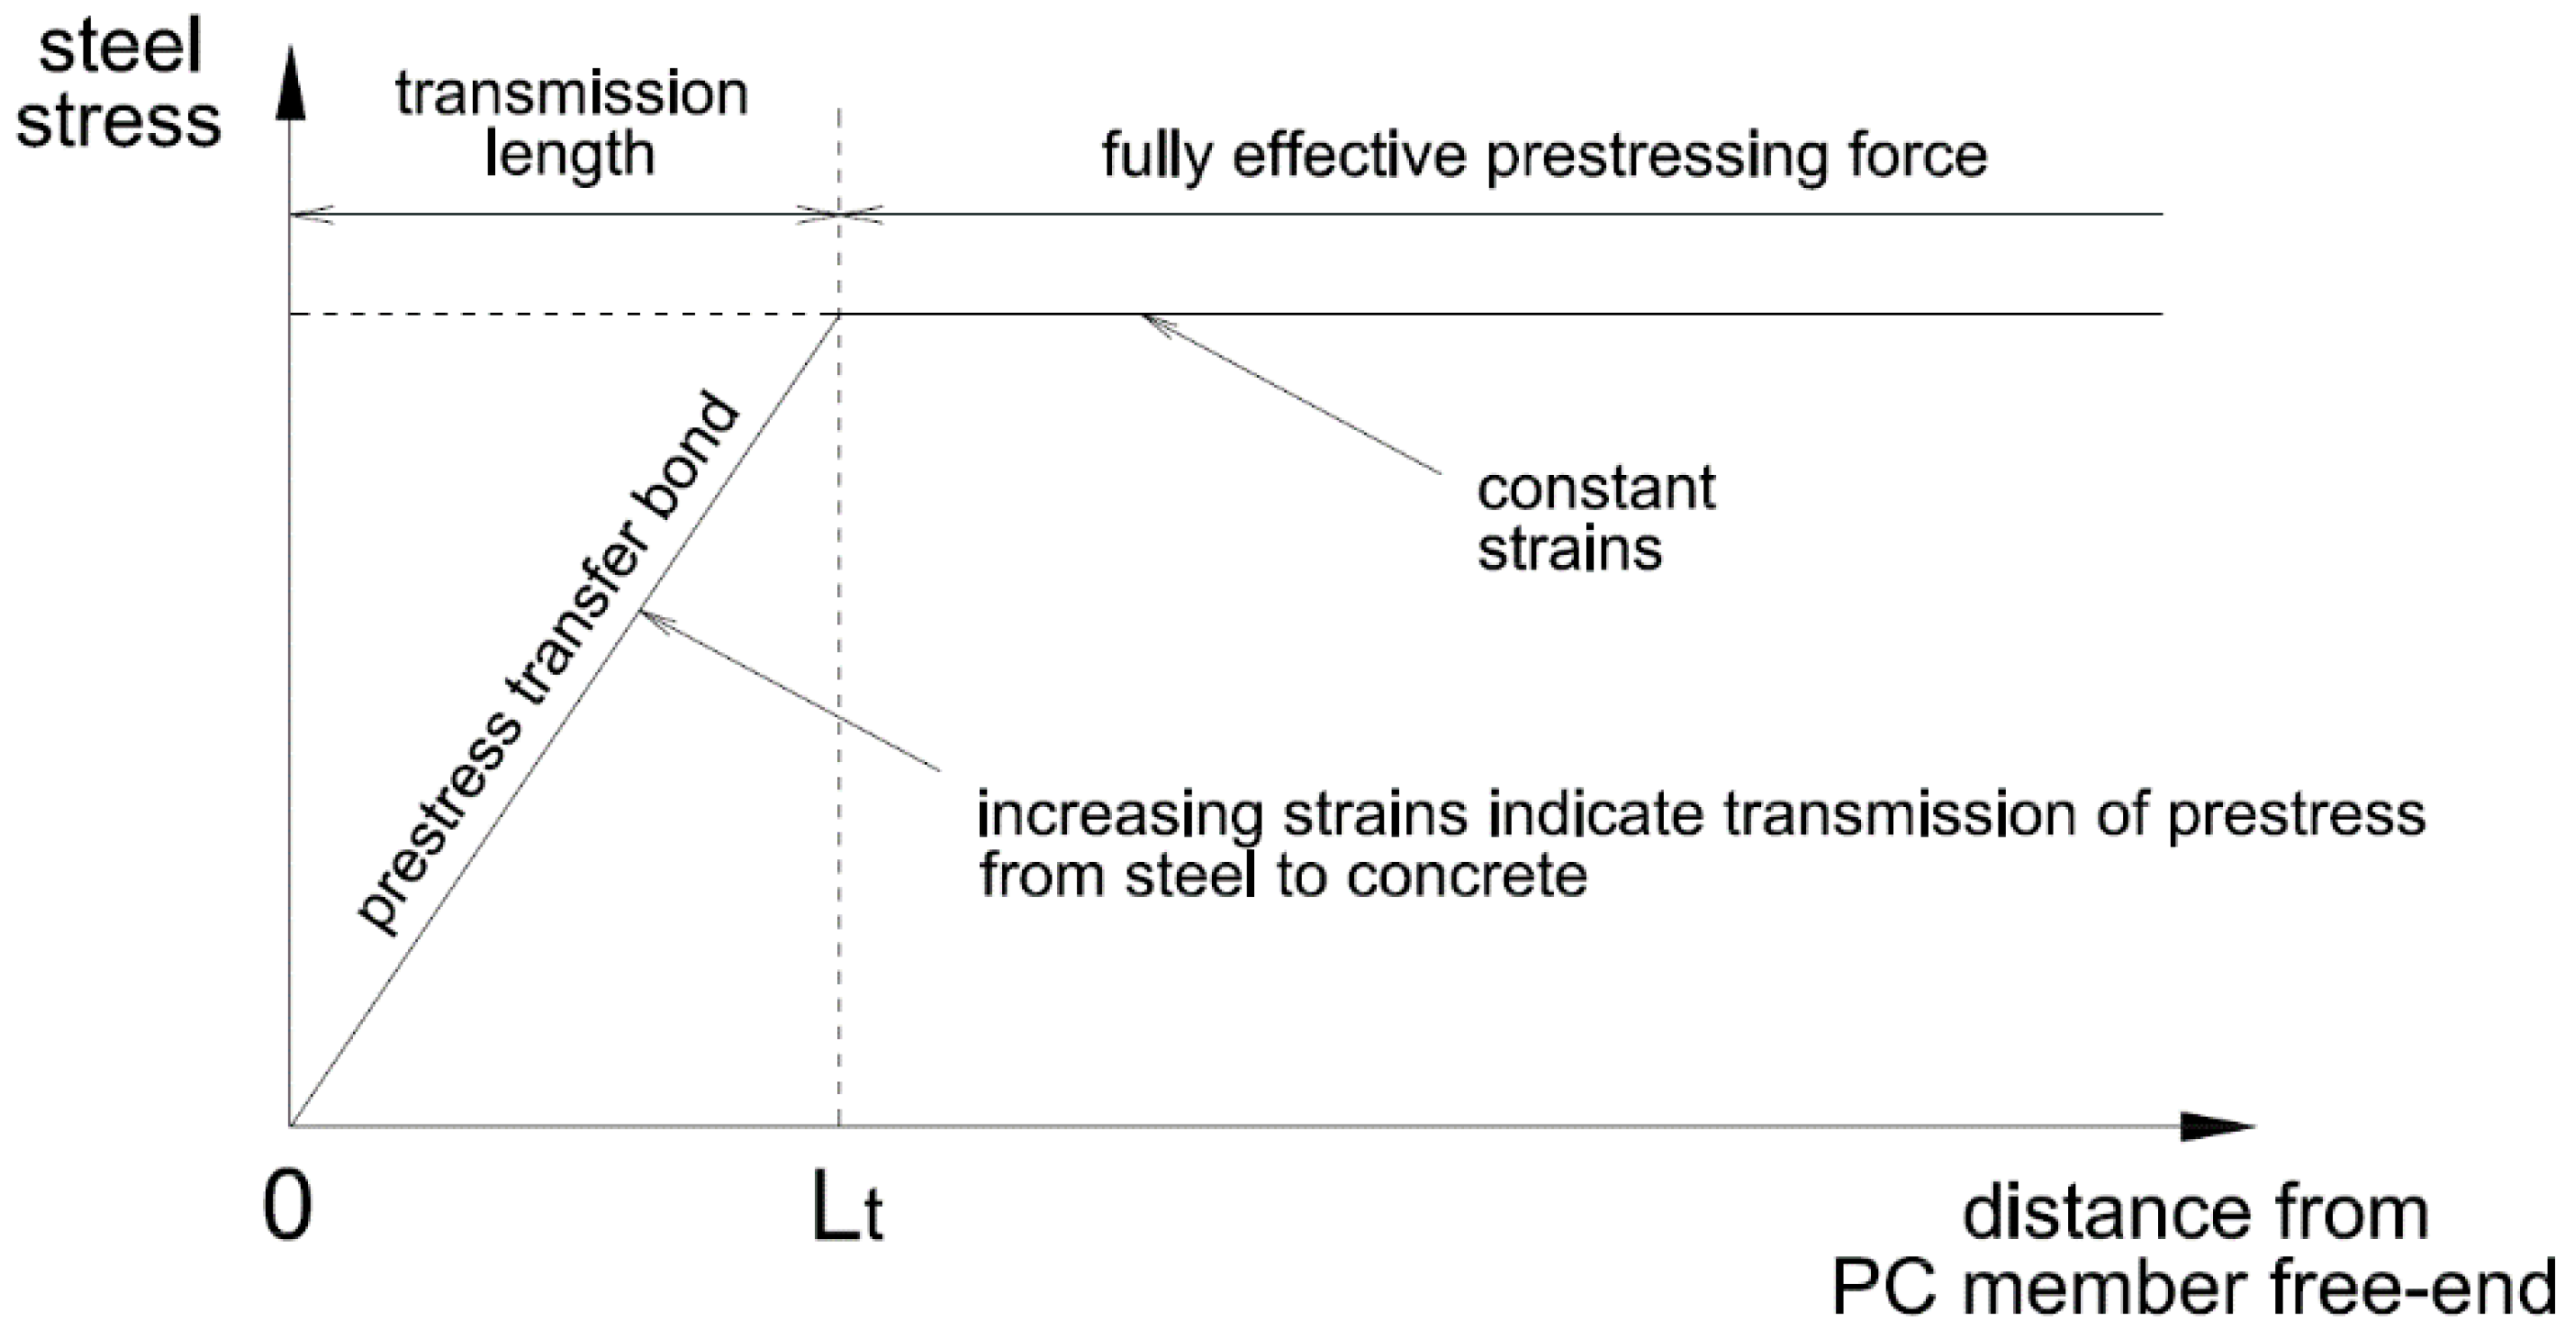
3. Analytical Modelling of the Transmission Length

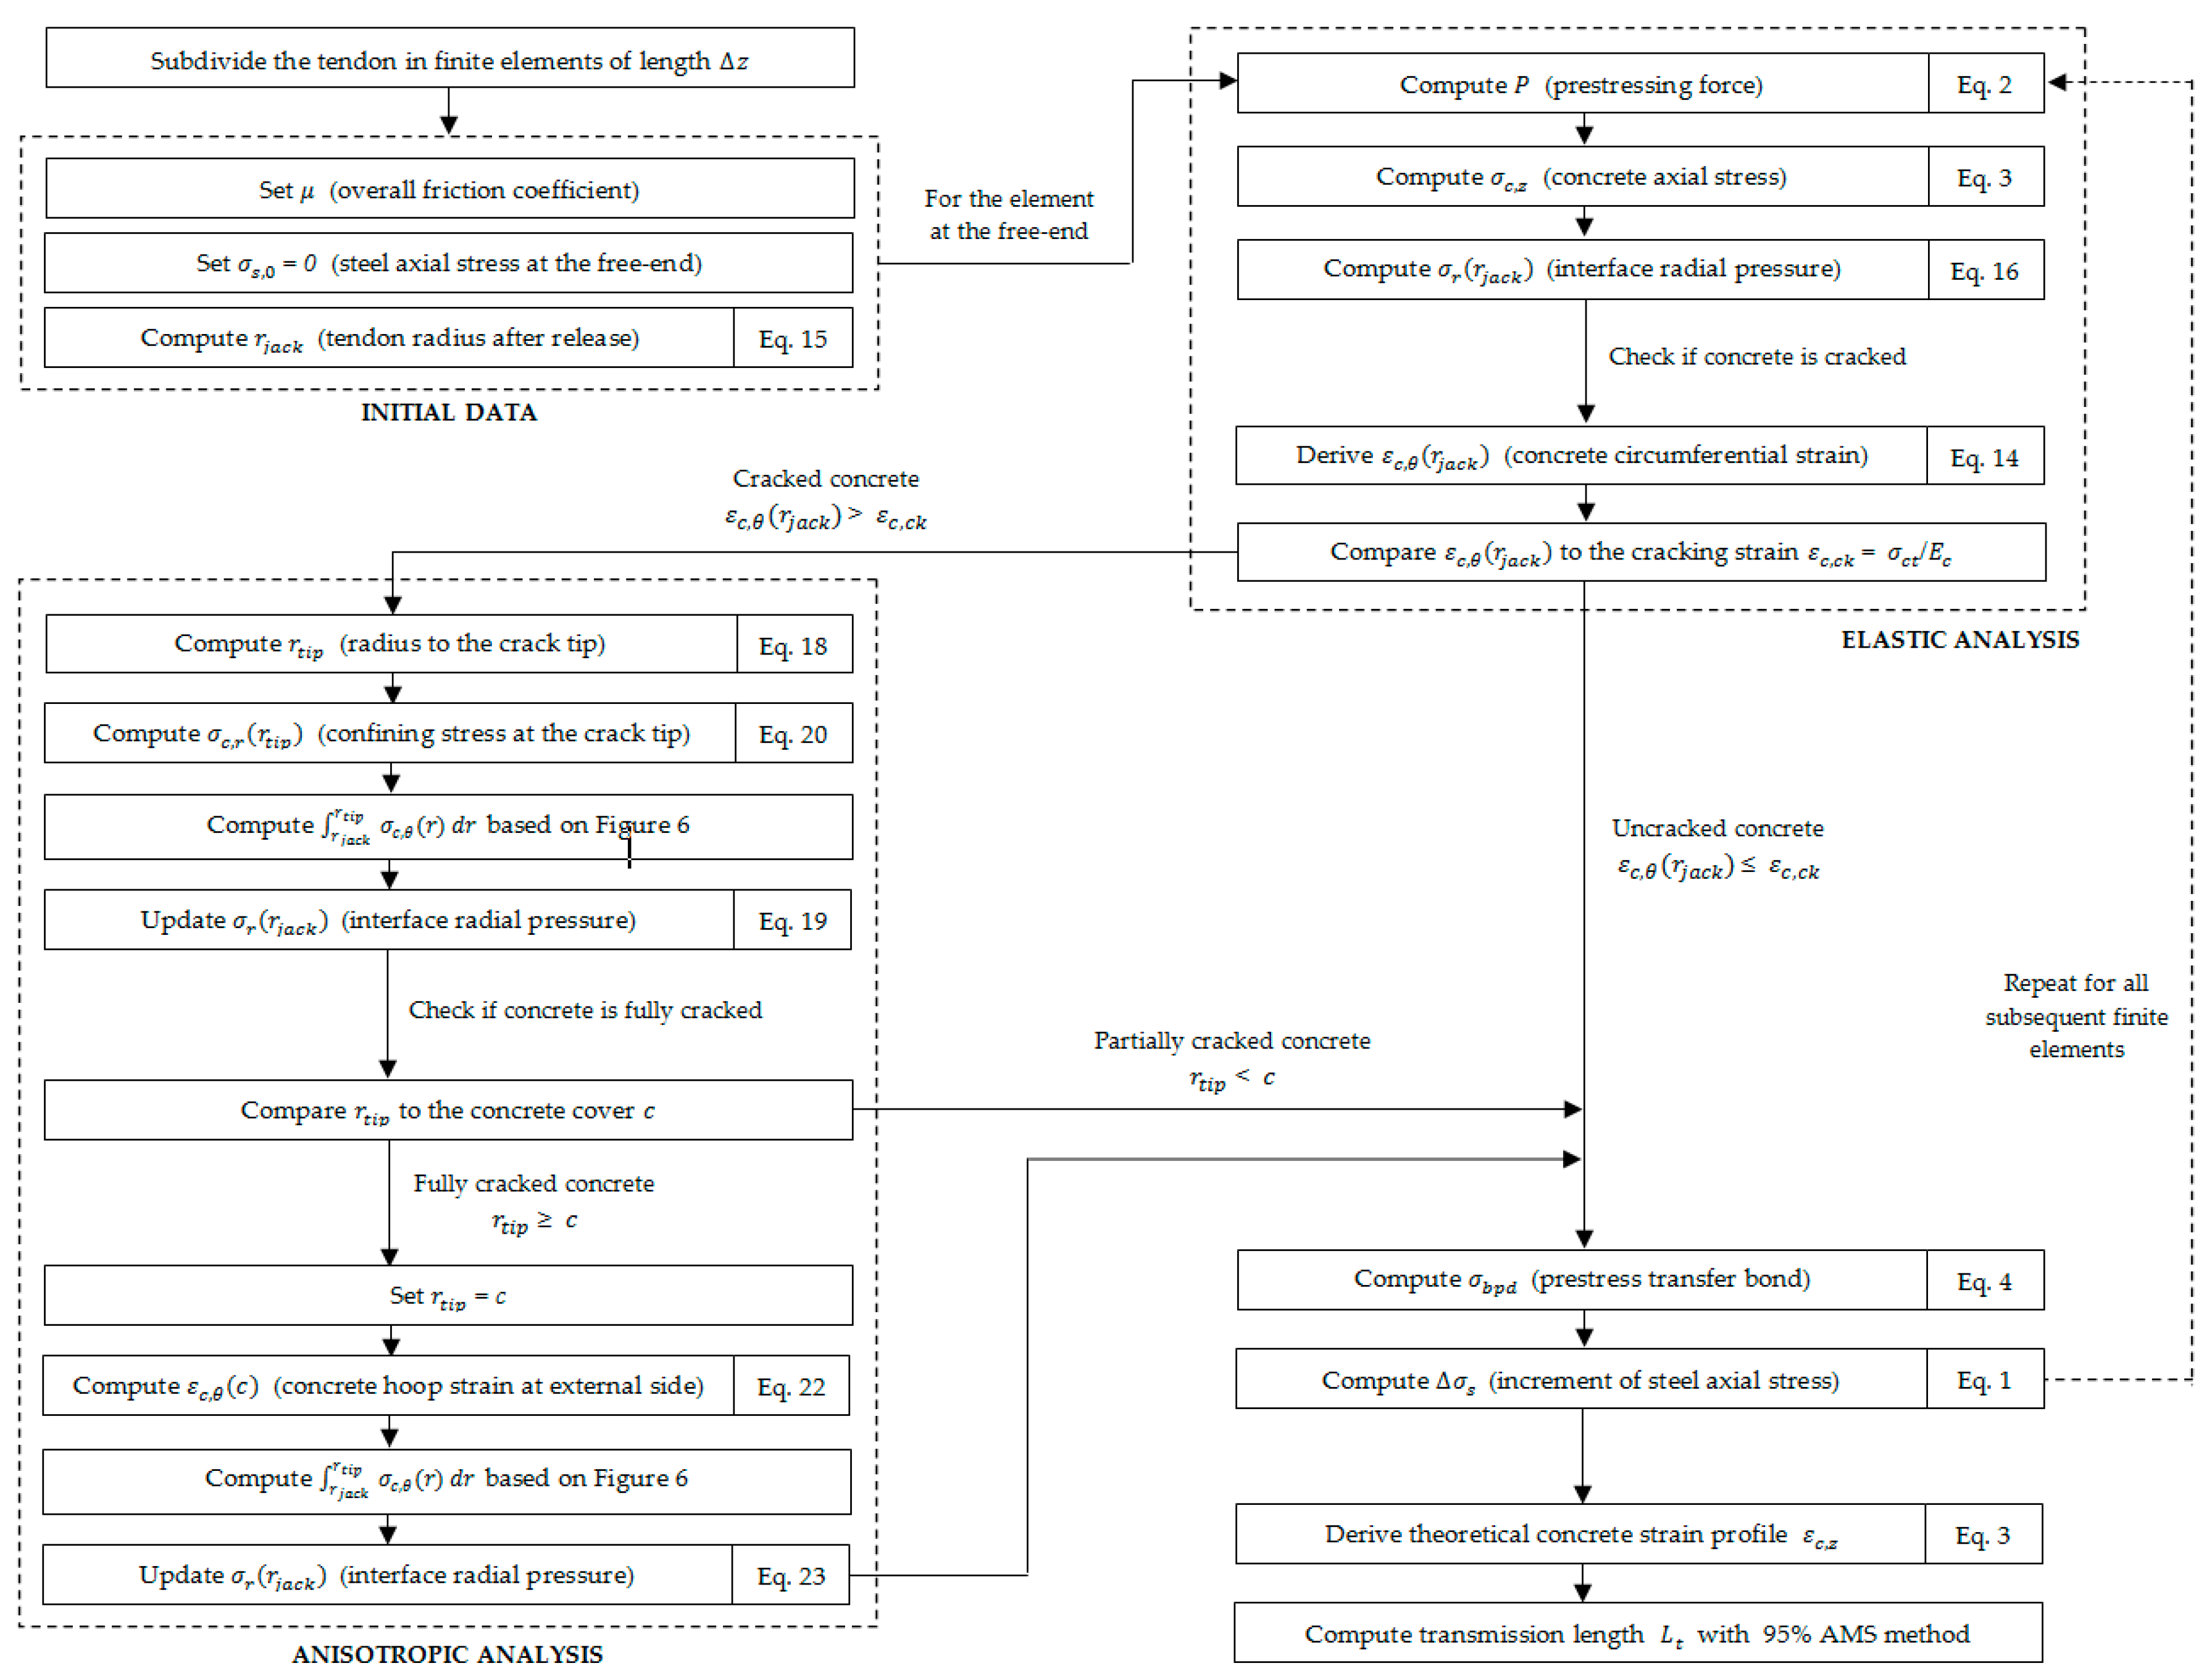
3.1. General Calculation Procedure

To obtain an accurate evaluation of the transmission length, the analysed prestressing tendon can be subdivided into a number of finite elements of small length Δ z , as shown in Figure 2. Starting from the element at the free-end of the PC member, where the prestress is zero ( σ s , 0 = 0), the increment of axial stress in the tendon Δ σ s due to bond development within the element can be calculated from the force equilibrium along the tendon longitudinal axis:
Δ σ s =   π     Δ z   σ b p d A s p
where φ is the nominal tendon diameter, σ bpd is the bond stress along the considered element and Asp is the tendon cross-sectional area. This implies knowledge of the bond stress distribution along the transmission zone: the matter will be addressed in the next sections.
The prestressing-force ( P i + 1 ) and the concrete axial stress at the level of the tendon ( σ c , z , i + 1 ) in the successive finite elements can be obtained as follows:
P i + 1 =   σ s , i + 1   A s p   n = 1 i + 1   [ Δ σ s , n   A s p ]
σ c , z , i + 1 =   P i + 1 ( 1 A c + e J x y )
where A c and J x are the cross-sectional area and the moment of inertia of the concrete section, respectively, while e represents the vertical eccentricity of the tendon with respect to the centroid of the concrete section and y is the vertical reference axis.
By repeating the mentioned procedure for each subsequent finite element, from the free-end to the mid-span, the theoretical concrete strain profile ( ε c , z ) due to transmission of the prestressing-force can be derived from Equation 3 at any point along the beam. Thus, as commonly adopted in the literature, the transmission length of the considered tendon is easily identified as the distance from the free-end to the point where concrete axial strain reaches 95% of the maximum strain (95% AMS method, as in [11,24]). However, the analytical model should also consider the type of prestress release (i.e., sudden or gradual) and the free-end location (i.e., “cut” or “dead” end), which can affect significantly the actual transmission length. This is accomplished by multiplying the obtained transmission length value by a coefficient α r e l , which is assumed to be 1.0 for a gradual release of the tendons or 1.3 when a sudden flame-cutting process is employed. The latter value is taken as the average between the two increasing factors associated with the “dead” and the “cut” end (i.e., α r e l = 1.25 and α r e l = 1.35, respectively, as estimated in Pellegrino et al., 2018 [21]), in order to achieve a better comparison with experimental data.

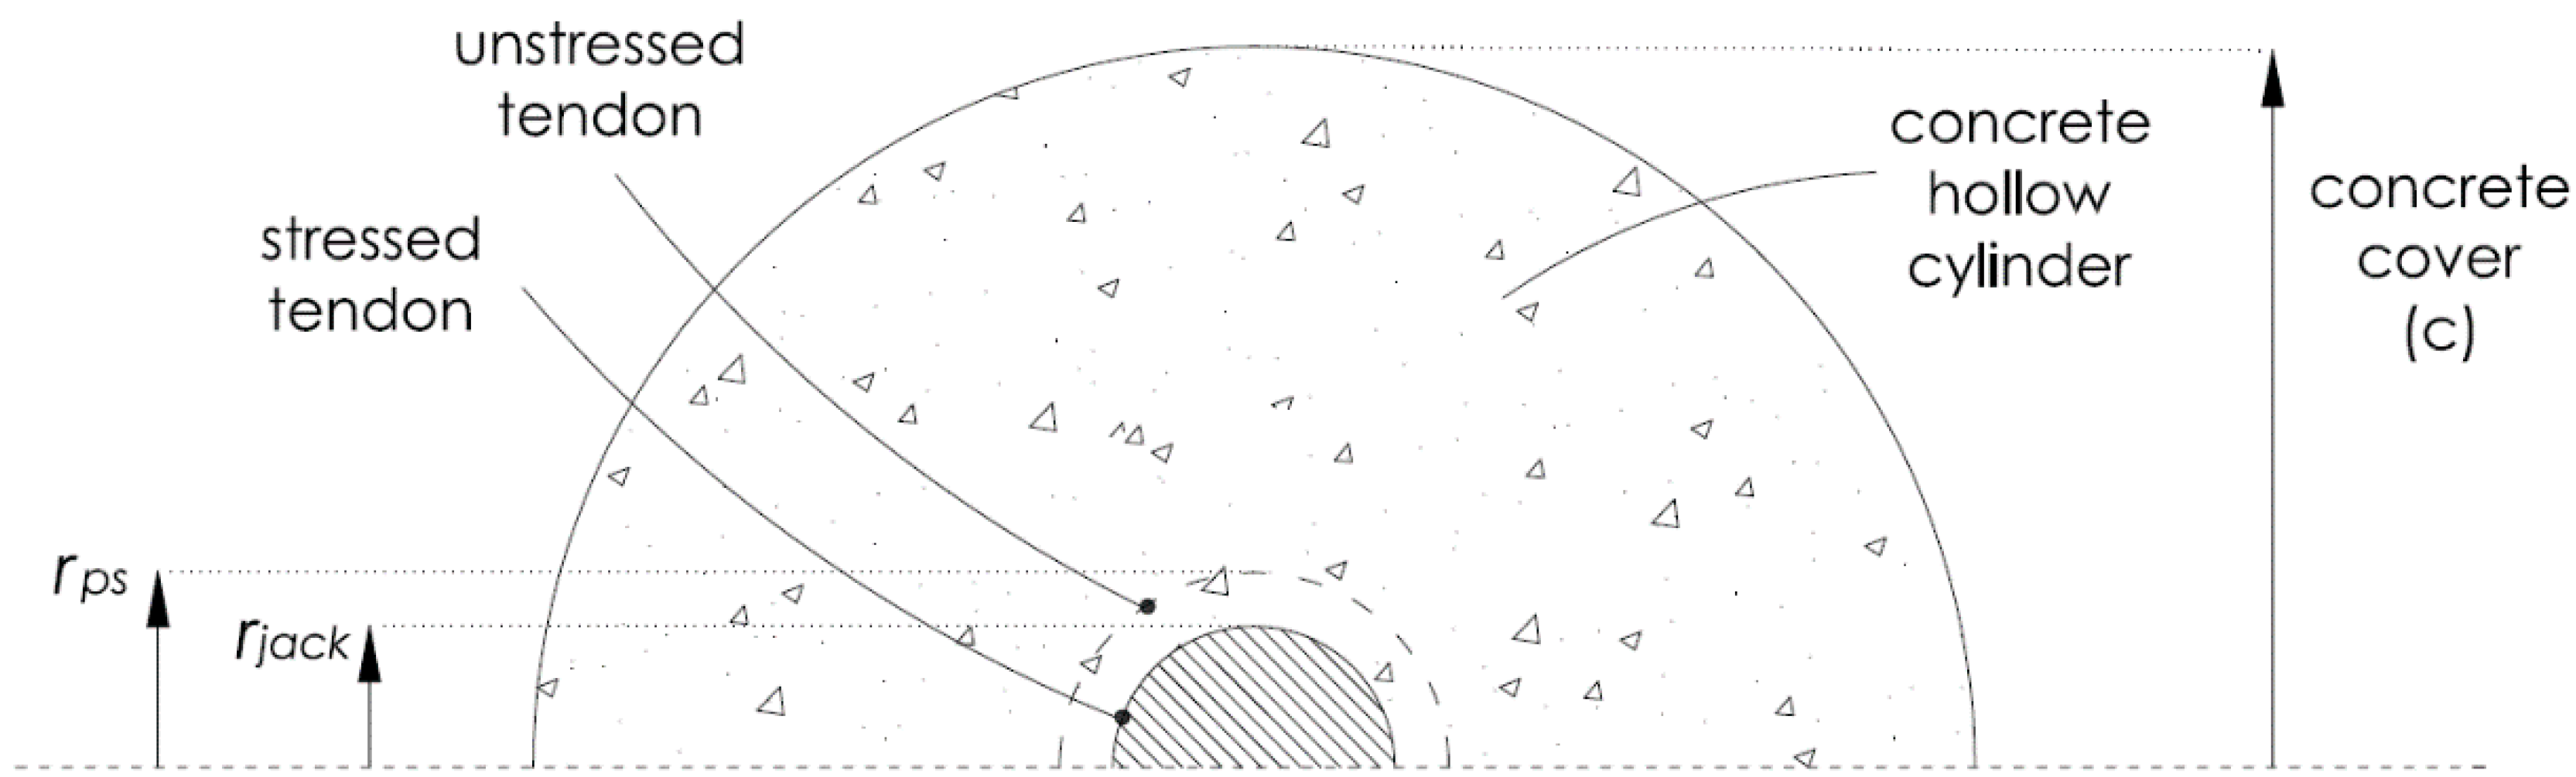
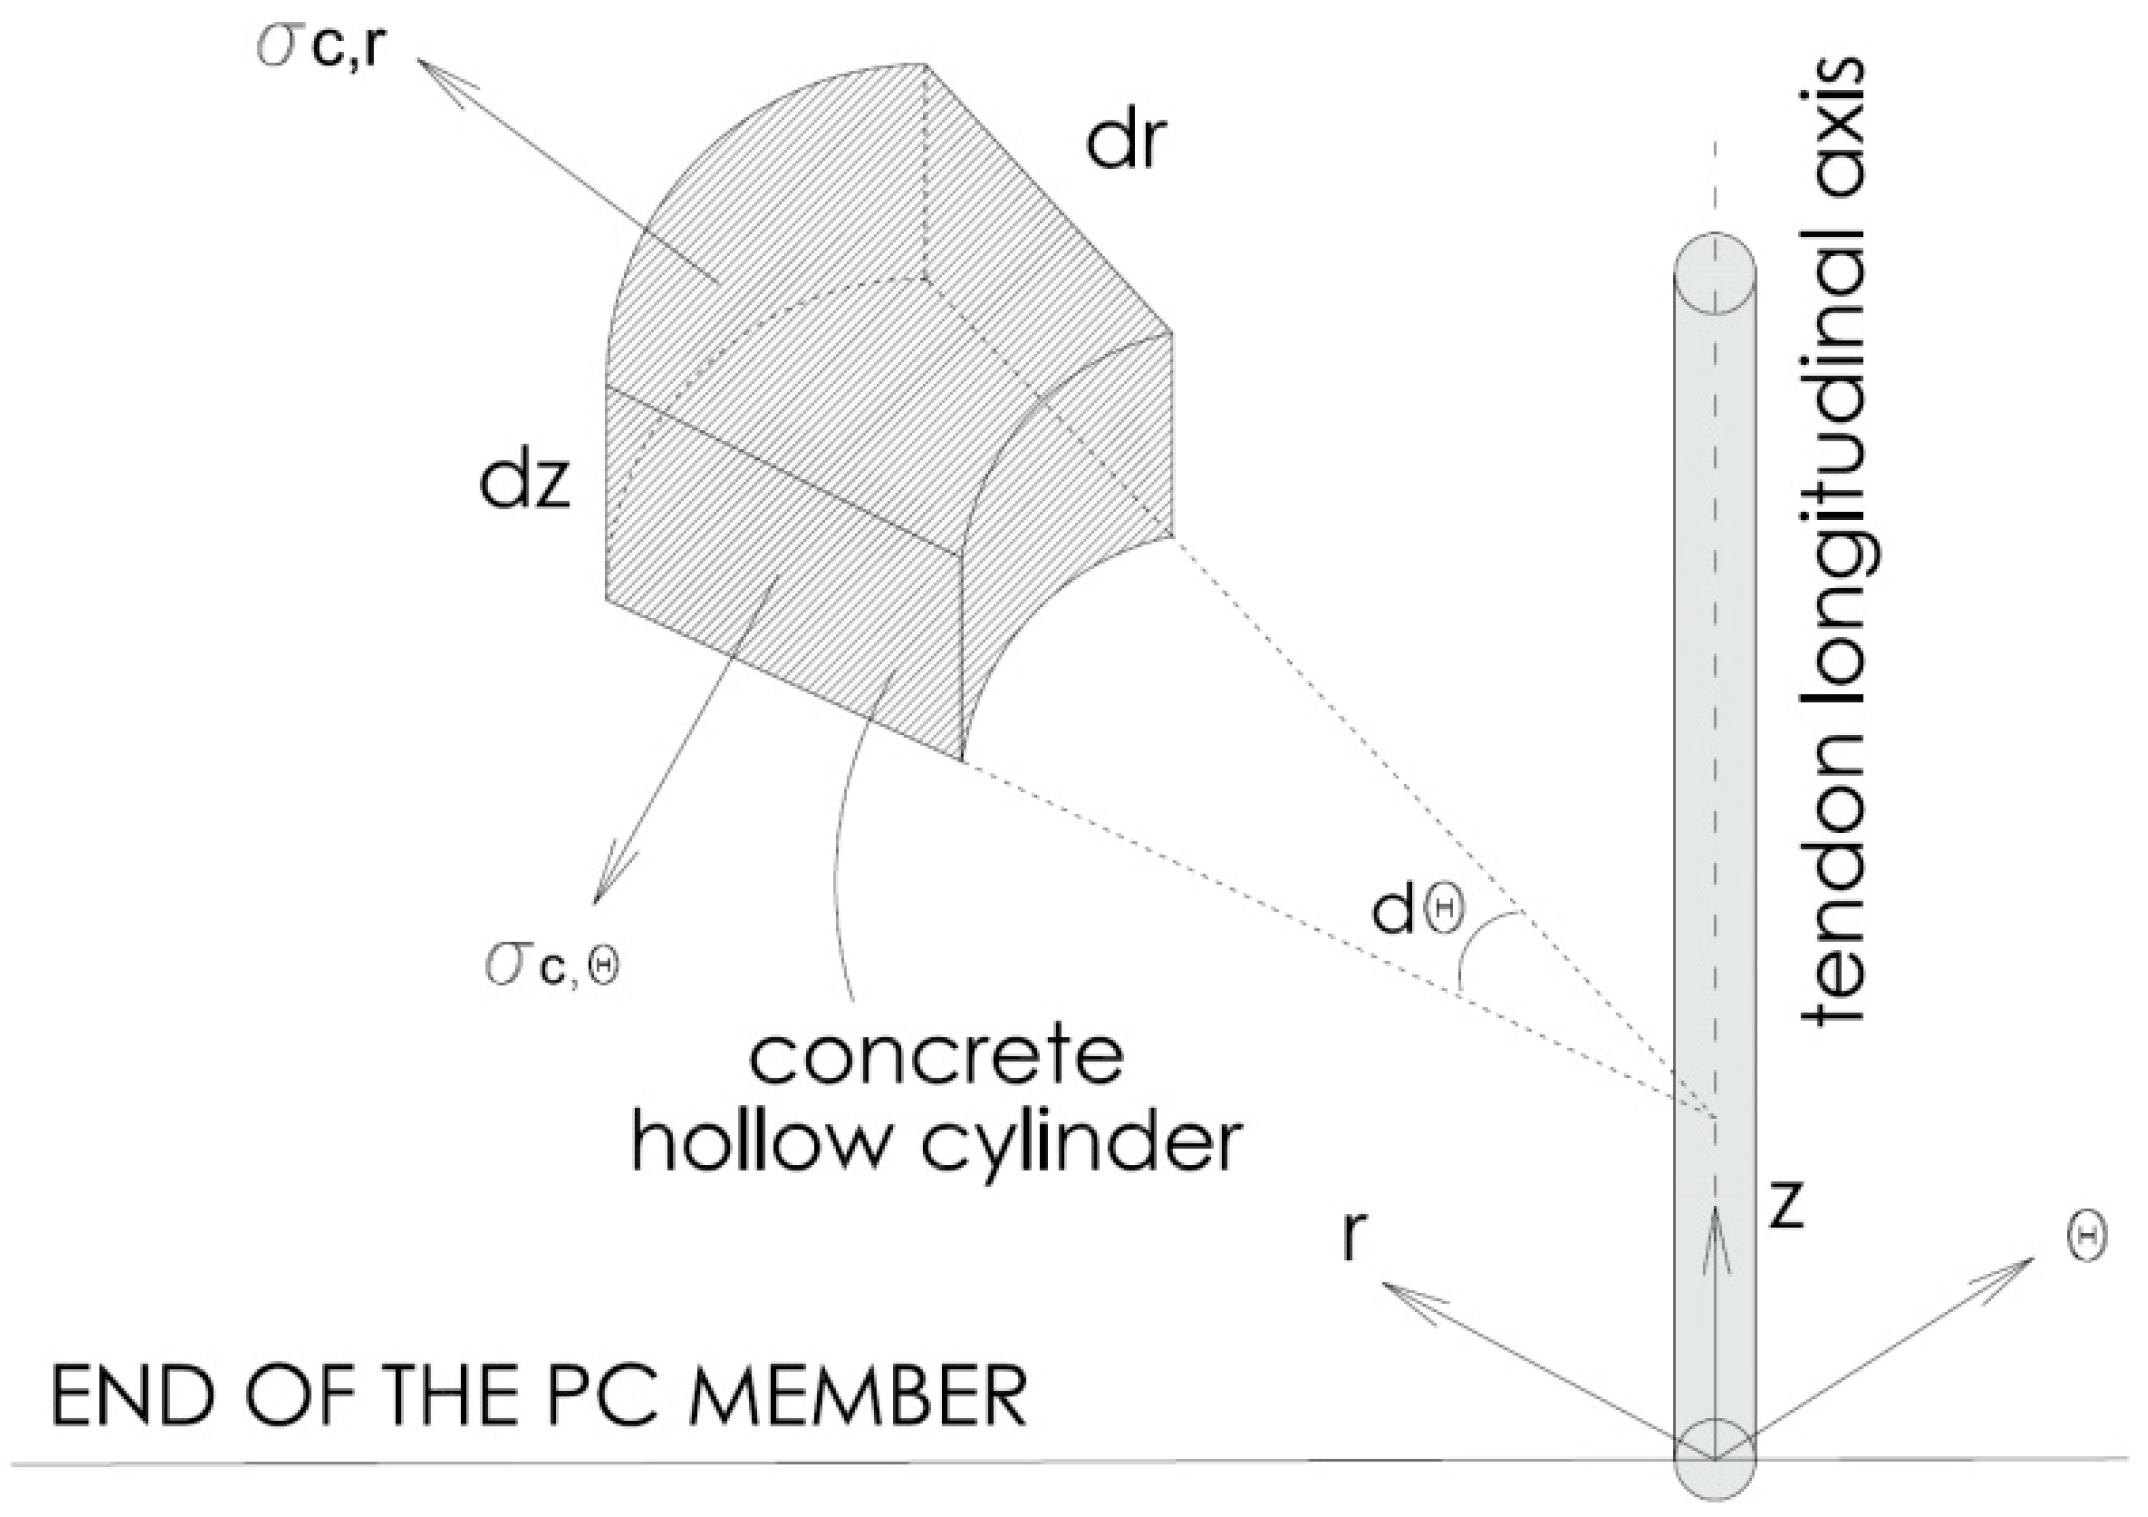
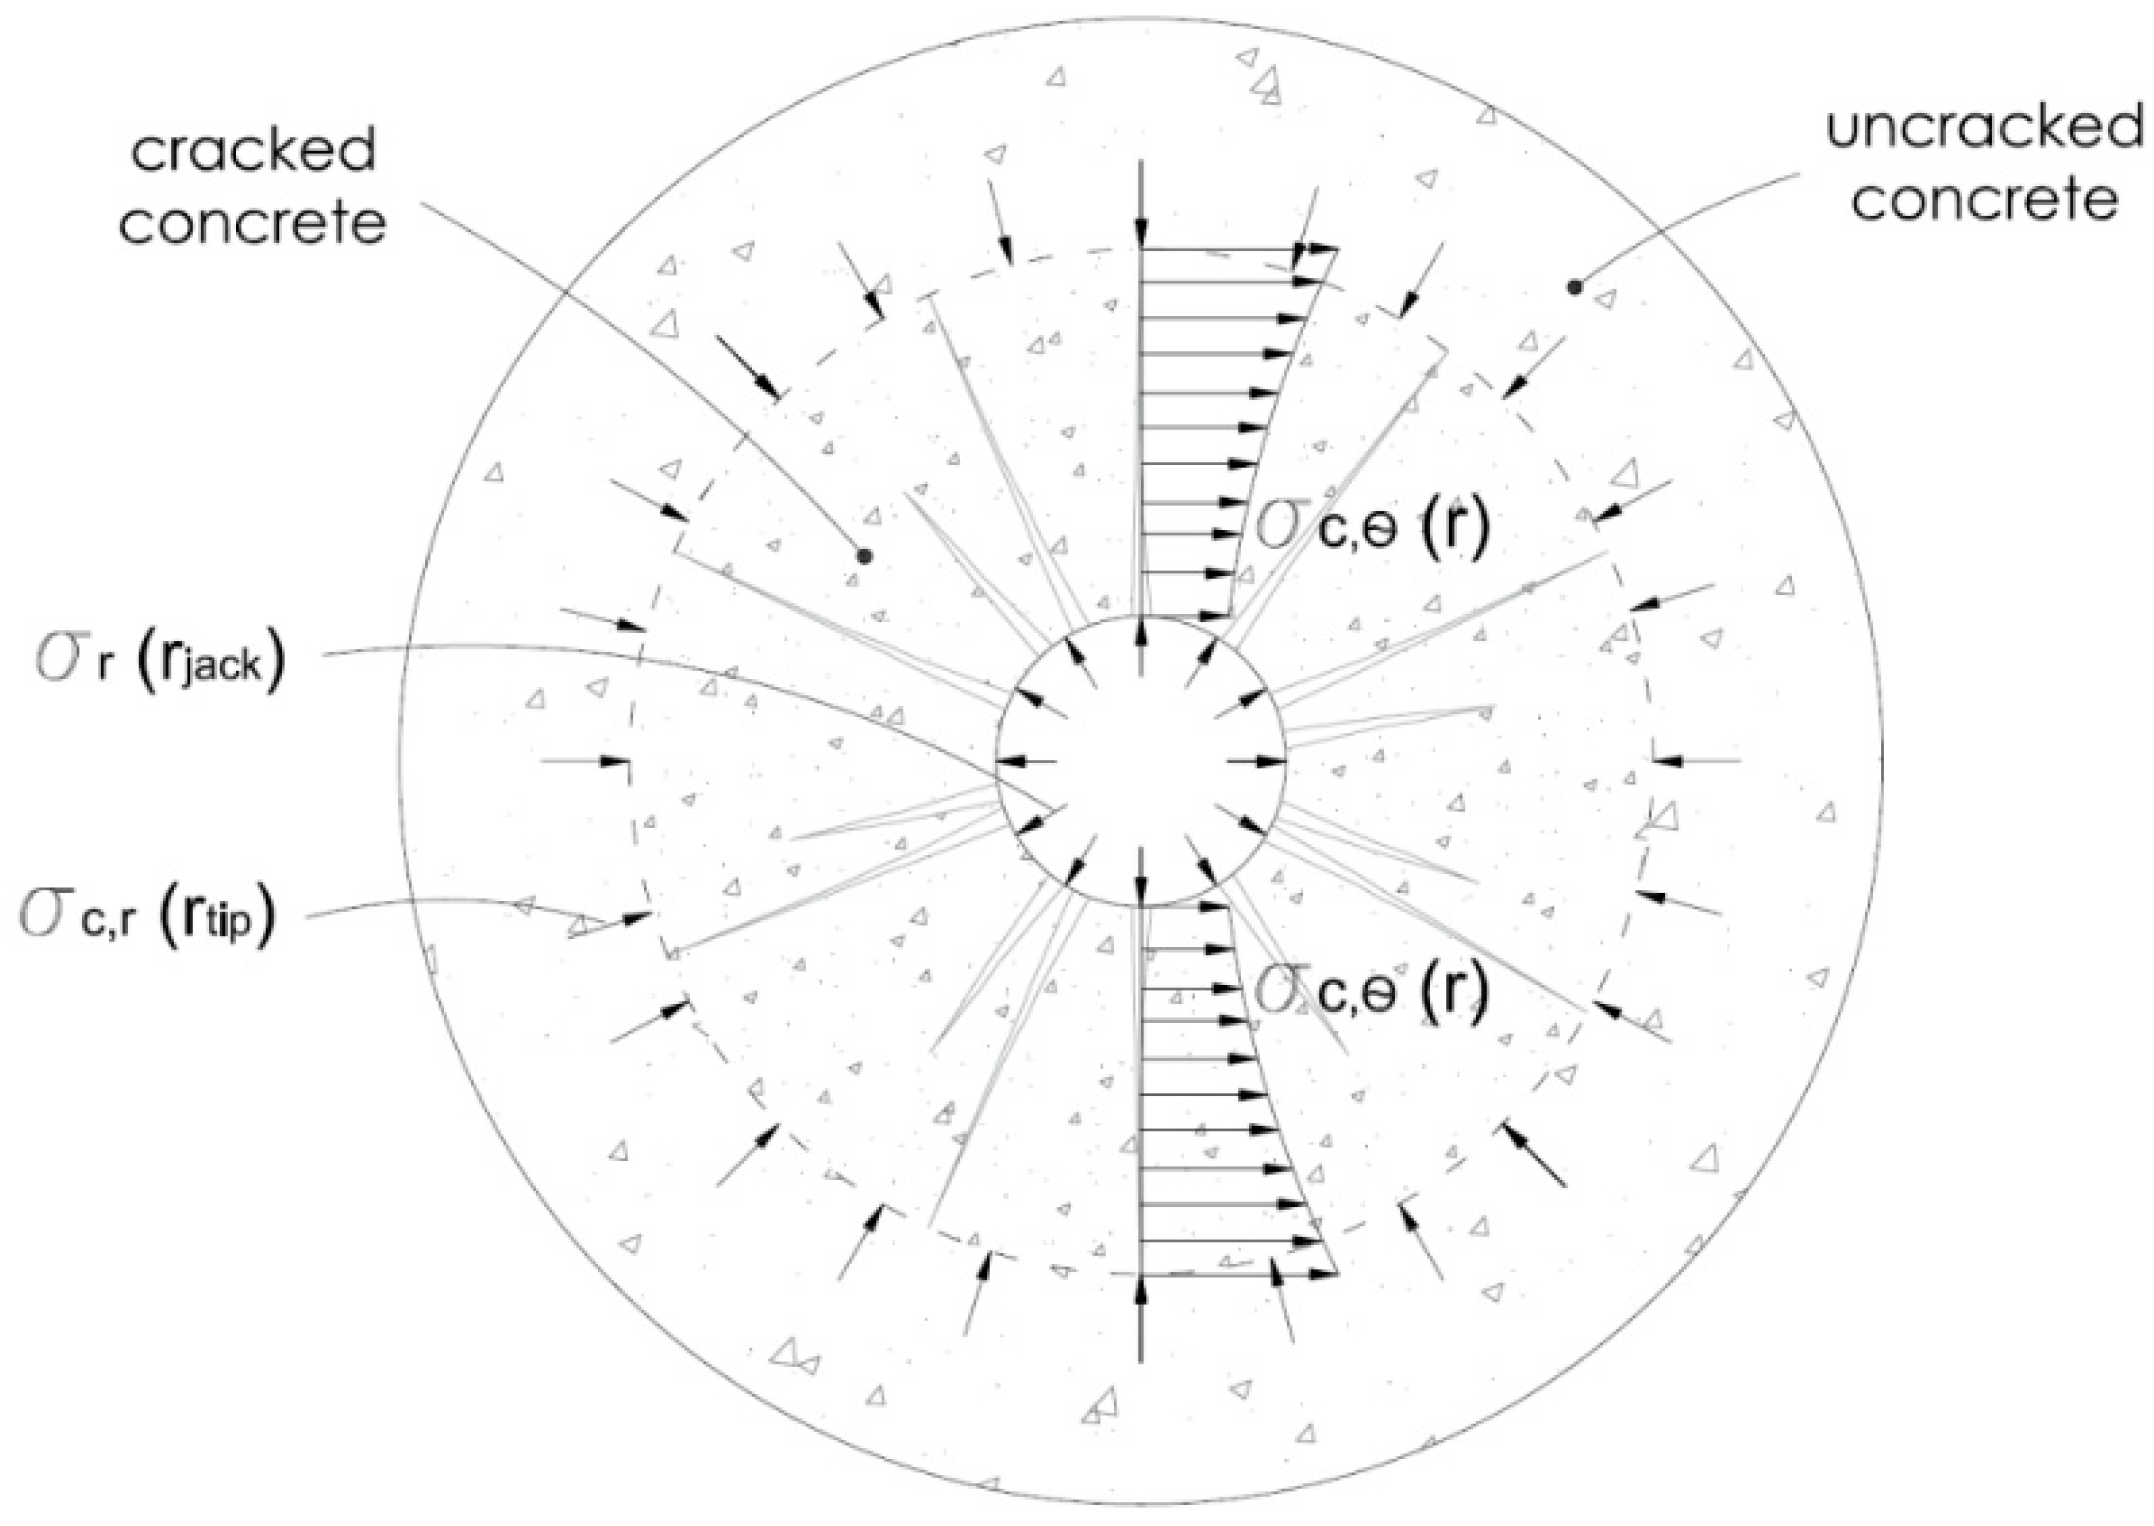
3.2. Elastic Analysis Based on the Thick-walled Cylinders Theory

Design formulations provided by standard codes usually assume constant distribution of prestress transfer bond σ b p d along the transmission length. Generally, bond stress is expressed through the fundamental equation:
σ b p d = μ   σ r ( r j a c k )
In this expression μ is the overall friction coefficient between tendon and concrete, combining actual frictional and mechanical bond. Typically, it is assumed to be between 0.3 and 0.8 [8,25]. Instead, σ r ( r j a c k ) is the radial compressive stress arising at the steel–concrete interface as a result of the Hoyer effect, where r j a c k identifies the radius of the tendon after prestressing. Many rational approaches have been proposed in the literature for determining the magnitude of the interface pressure. Most of these are based on the TWC theory, i.e., considering the steel tendon as a solid cylinder and the surrounding concrete as an external hollow cylinder [16,26]. Figure 3 shows how the problem is idealised.
If an infinitesimal slice of the concrete cylinder of thickness dz is selected at a distance z from the free-end of the PC member, the equilibrium in the radial direction can be written as in Equation (5), neglecting terms containing higher-order infinitesimal and assuming z-independency of all the variables (Figure 4):
σ c , r   + d σ c , r d r   r   σ c , θ = 0
where σ c , r and σ c , θ are the stresses in the radial and circumferential direction, respectively, while r is the radial distance.
At the same time, compatibility of displacements at the interface between steel and concrete must be satisfied after release, and gives Equation (6), where r p s and r j a c k are the tendon radius before and after prestressing, while u p s and u c are the radial displacements of tendon surface and concrete, respectively.
r p s + u p s = r j a c k + u c
In addition, the radial and circumferential stresses σ c , r and σ c , θ can be expressed according to the constitutive equations of the infinitesimal element of the concrete cylinder (Equations (7) and (8)), being σ c , z the concrete axial stress, E c and υ c the elastic modulus and Poisson’s coefficient of concrete, ε c , r and ε c , θ the concrete strain in the radial and circumferential direction, respectively:
σ c , r = E c 1 υ c 2   ( ε c , r + υ c   ε c , θ ) + υ c   ( 1 + υ c )   σ c , z 1 υ c 2
σ c , θ = E c 1 υ c 2   ( ε c , θ + υ c   ε c , r ) + υ c   ( 1 + υ c )   σ c , z 1 υ c 2
By substituting Equations (7) and (8) in the equilibrium equation, Equation (5), it is possible to obtain:
r   d 2 u d r 2 + d u d r u r   = 0
whose solution, the radial displacement u, can be written in the following form:
u = c 1 r + c 2 / r
It can be noted that, combining Equation (10) with Equations (7) and (8), the radial and circumferential stresses can also be connected to the constants of integration, c 1 and c 2 :
σ c , r = E c   [   c 1 1 υ c c 2 r 2   ( 1 + υ c )   ]   +   υ c   σ c , z ( 1 υ c )
σ c , θ = E c   [   c 1 1 υ c + c 2 r 2   ( 1 + υ c )   ]   +   υ c   σ c , z ( 1 υ c )
Two different boundary conditions can be set separately for steel and concrete to derive the constants of integration c 1 and c 2 , and thus the radial displacement u (Equation (10)) and the stresses in the radial and circumferential direction (Equations (11) and (12)). For steel cylinder, u must be zero at the tendon centroid, i.e., at r = 0. Therefore, being σ c , r = σ r ( r j a c k ) at r = r j a c k (where r j a c k is the radial distance to the outer surface of the stressed tendon and σ r ( r j a c k ) is the corresponding radial pressure at the interface), the field of the radial displacement can be expressed as in Equation (13). On the other hand, for concrete, the two boundary conditions are σ c , r = σ r ( r j a c k ) at r = r j a c k and σ c , r = 0 at the outer surface of the concrete hollow cylinder, i.e., at r = c, so that the radial displacement can be obtained as in Equation (14).
u ( r )   =   [ σ r ( r j a c k )     ( 1 υ c ) υ c   σ c , z E c ]   r
u ( r )   =   σ r ( r j a c k )   r E c   ( 1 / c 2 1 / r )   [ ( 1 υ c ) c 2 + ( 1 + υ c ) r 2 ]     υ c   σ c , z   r E c
Particularly, the reduced tendon radius after prestressing ( r j a c k ) is obtained when considering the Poisson’s effect on the longitudinal strain:
r j a c k   =   ( 1 σ s i E p s   υ p s   ) r p s
where σ s i is the stress in the strand just after release, while E p s and υ p s are the elastic modulus and Poisson’s coefficient of concrete, respectively. The radial pressure at the tendon-concrete interface can finally be derived from the compatibility condition (Equation (6)). In fact, by substituting the displacement at the tendon outer surface ( u p s , from Equation (13)) and the displacement at the inner surface of the concrete hollow cylinder ( u c , as given by Equation (14)):
σ r ( r j a c k ) =   r p s   ( 1 υ p s   σ s   / E p s ) r j a c k   ( 1 υ c   σ c , z   / E c   ) ( 1 υ p s )   r p s / E p s   + [ υ c ( r j a c k 2 + c 2 ) / ( r j a c k 2 c 2 ) ]   r j a c k / E c
where σ s   and σ c , z   are the axial stresses into the steel and concrete for the finite element at a generic distance z from the PC member free-end, respectively. However, with commonly used materials and under standard conditions, the actual concrete tensile strength is easily exceeded in the vicinity of the tendon, especially near the free-end of the PC member, where the Hoyer effect is maximum. Therefore, more refined theoretical models incorporating anisotropic concrete properties should be required to better describe the bond phenomenon in the presence of cracking of the material.

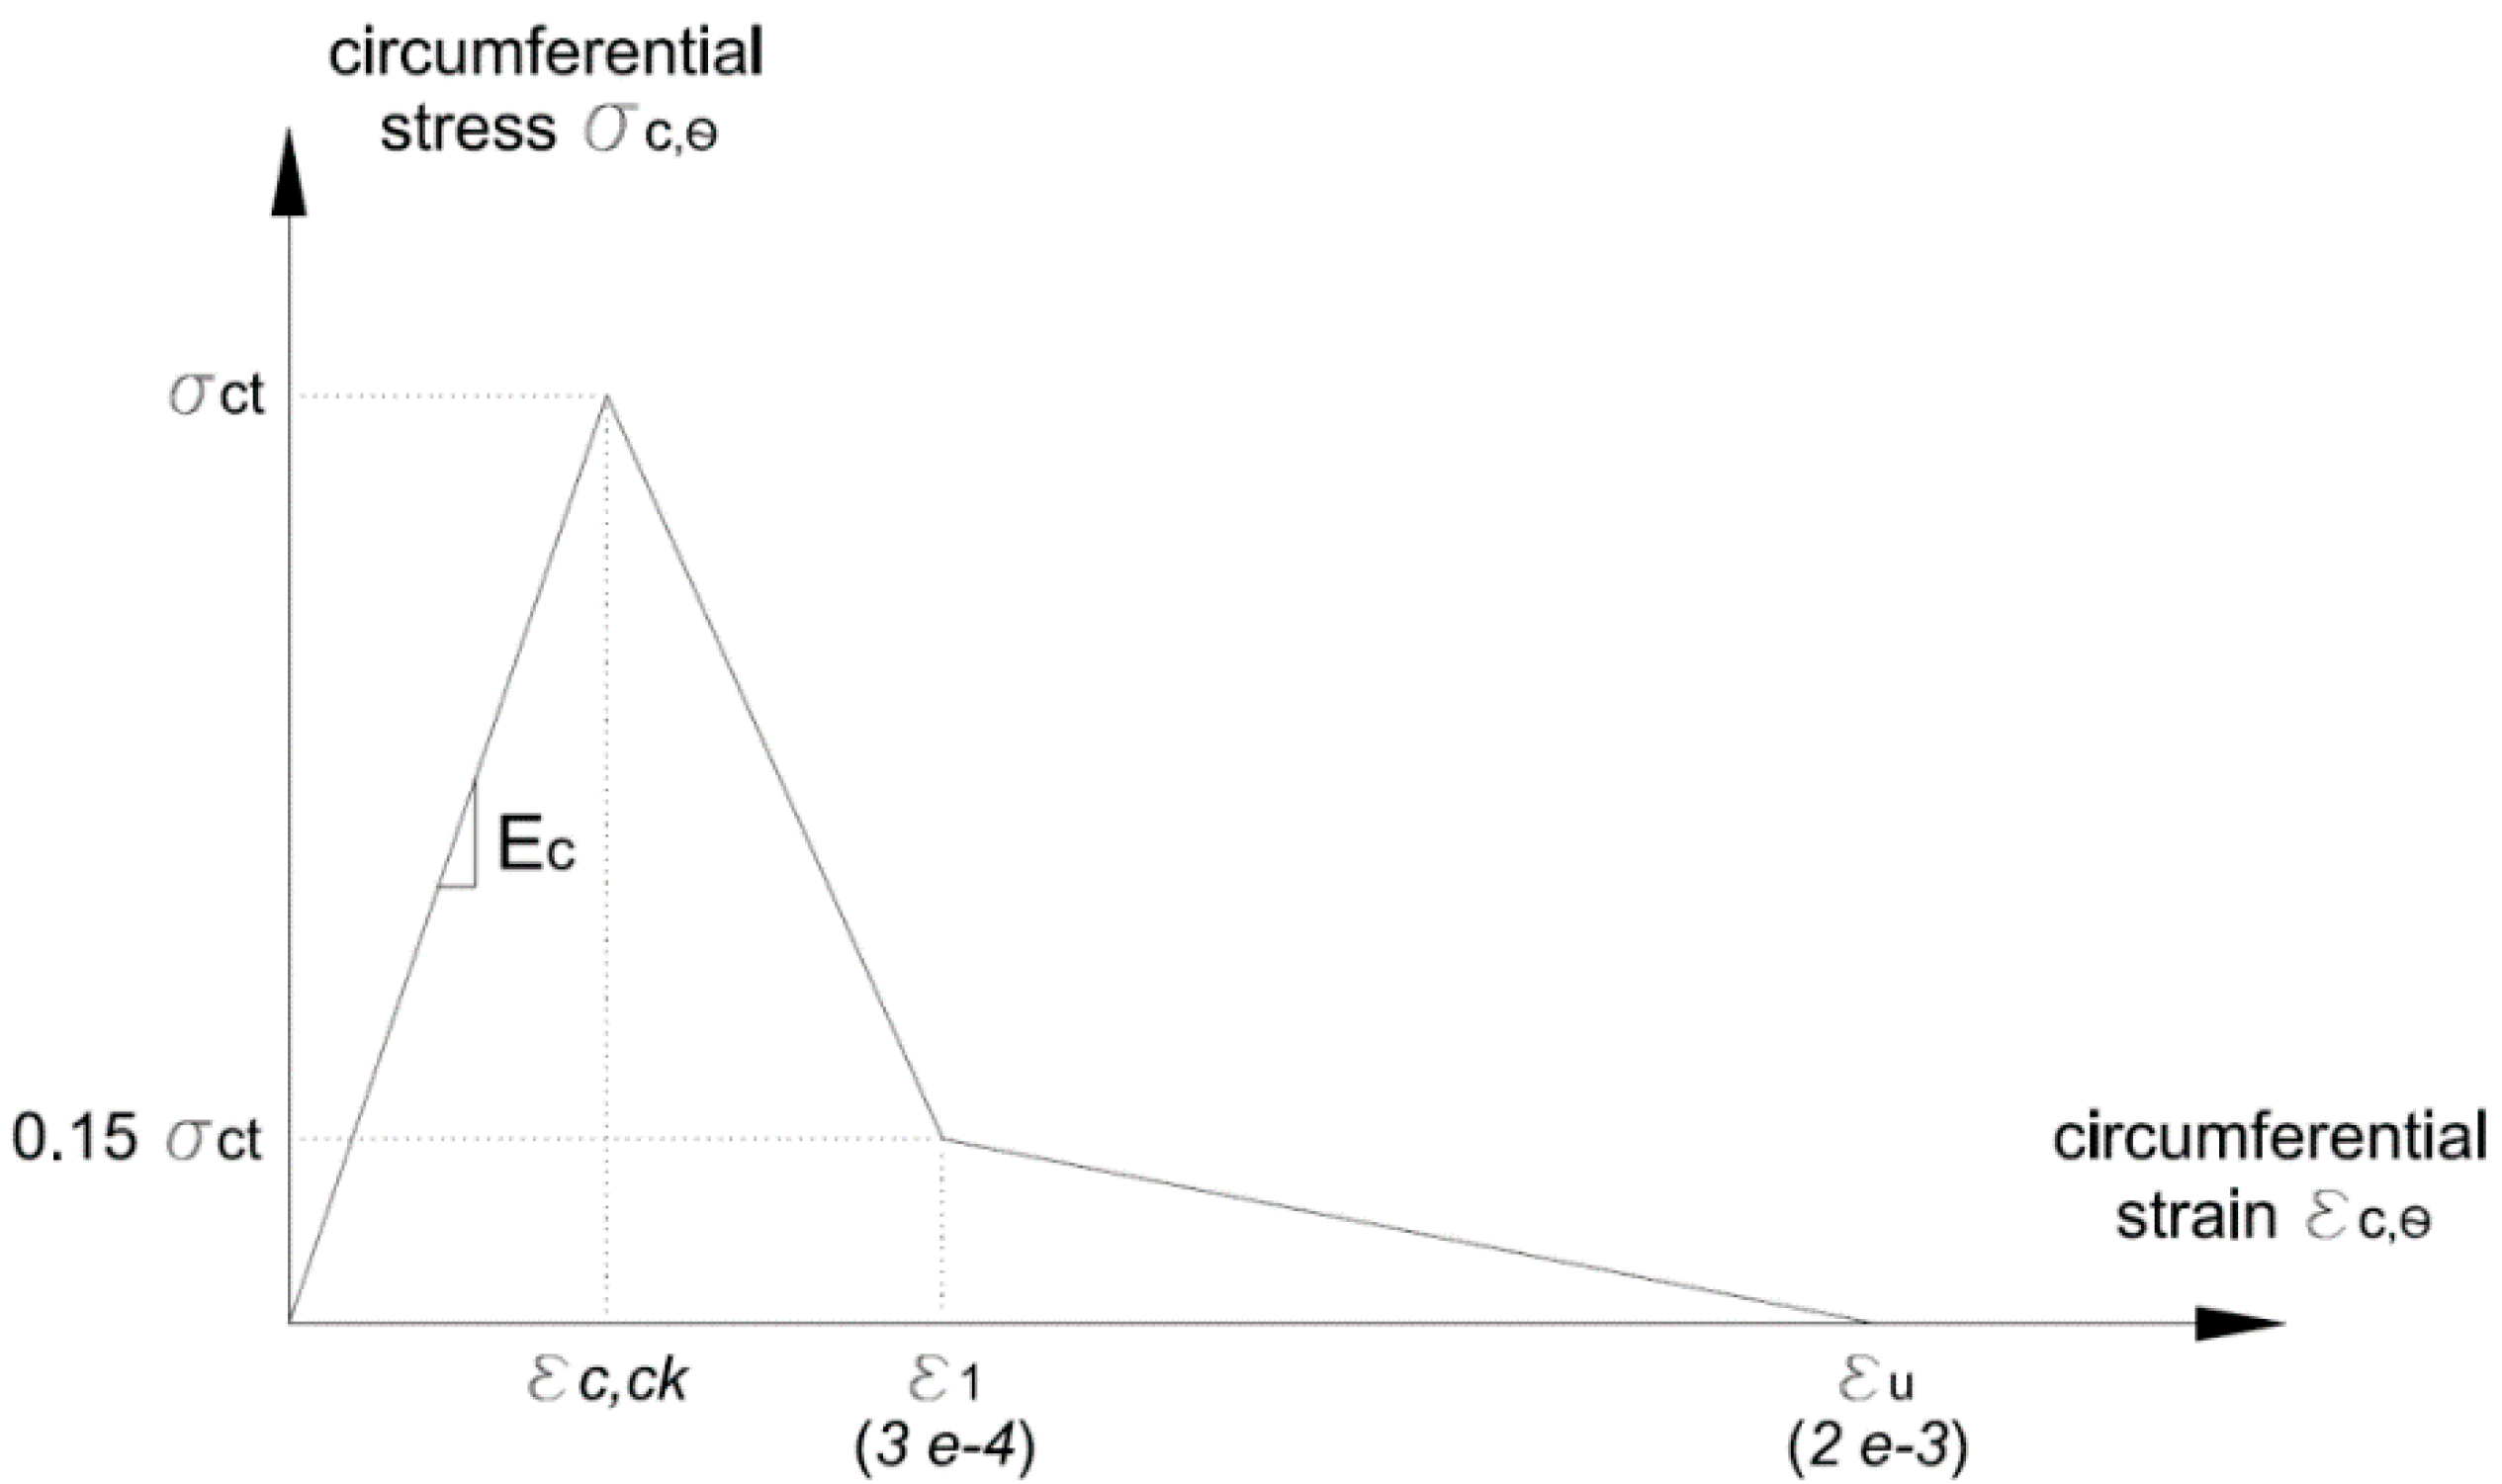
3.3. Anisotropic Analysis for Cracked Concrete

After prestress release operation, concrete may experience three different configurations along the transmission length, depending on the confining pressure at the interface surface. Concrete, indeed, can be fully cracked near the free-end, only partially cracked at a certain distance from the free-end and it might be intact and uncracked at a further distance (where the Hoyer effect is very small or negligible, see Figure 5).
Similarly to Han et al. (2016) [26], a linear elastic field of displacement for the concrete cylinder can be assumed, resulting in the following relationship for the radial displacement u(r):
u ( r )   =   σ c t E c   r   ( c / r ) 2 + 1 ( c / r t i p ) 2 + 1
where σ c t is the tensile strength of concrete and r t i p is the distance from tendon centroid to the crack tip (see Figure 5). To determine the state of the concrete around the tendon, its circumferential strain at the interface with the strand, i.e., ε c , θ ( r j a c k ) , can be easily calculated from Equation (14), and compared with the cracking strain, ε c , c k . The condition ε c , θ ( r j a c k ) > ε c , c k means that concrete surrounding the tendon is cracked. In this case, the radius from the tendon centroid to the crack tip, r t i p , can be estimated as follows by combining Equation (14) and Equation (17):
σ r ( r j a c k )   r j a c k E c   ( 1 / c 2 1 / r j a c k 2 )   [ ( 1 υ c ) c 2 + ( 1 + υ c ) r j a c k 2 ]     υ c   σ c , z   r j a c k E c   =   σ c t E c   r j a c k   ( c / r j a c k ) 2 + 1 ( c / r t i p ) 2 + 1
The influence of concrete radial cracking on the magnitude of bond can be taken into account through an appropriate softening model. For this purpose, the tri-linear model suggested by Han et al. (2014) [27] can be adopted to represent the behaviour of concrete in tension, as depicted in Figure 6.
From the equilibrium of the cracked concrete section (Figure 7), the interface pressure σ r ( r j a c k ) can be related to the confining pressure at the crack tip σ c , r ( r t i p ) and the residual circumferential stress in the cracked portion of the section σ c , θ ( r ) :
σ r ( r j a c k )   r j a c k   =   σ c , r ( r t i p ) r t i p   +   r j a c k r t i p   σ c , θ ( r )   d r
The confining pressure at the crack tip σ c , r ( r t i p ) can be derived as in Equation (20), considering that the hoop stress at the crack tip σ c , θ ( r t i p ) is equal to the tensile strength of concrete σ c t . This enables the determination of the interface pressure σ r ( r j a c k ) from Equation (19).
σ c , r ( r t i p )   =   σ c t   c 2   r t i p 2 c 2 +   r t i p 2
When radial cracking extends until reaching the external side of the concrete section, i.e., for fully cracked concrete section, the field of the radial displacement results from Equation (17) by taking c instead of r t i p :
u ( r )   =   ε c , θ ( c )   r ( c / r ) 2 + 1 2
where the circumferential strain at the external side of concrete ε c , θ ( c ) is derived from the following Equation (22), which arises from Equations (14) and (21):
σ r ( r j a c k )   r j a c k E c   ( 1 / c 2 1 / r j a c k 2 )   [ ( 1 υ c ) c 2 + ( 1 + υ c ) r j a c k 2 ]     υ c   σ c , z   r j a c k E c   =   ε c , θ ( c )   r j a c k   ( c / r j a c k ) 2 + 1 2
Therefore, for a fully cracked concrete section, the pressure at the interface between the tendon and the surrounding concrete is still calculated from Equation (19), considering that no confining stress is provided by the concrete (i.e., σ c , r ( r t i p ) must be zero):
σ r ( r j a c k )   r j a c k   =   r j a c k r t i p   σ c , θ ( r )   d r
The whole procedure for calculating the transmission length of a generic prestressed-concrete member according to the implemented analytical model can be summarised as in the flowchart of Figure 8.

4. Model Calibration and Results

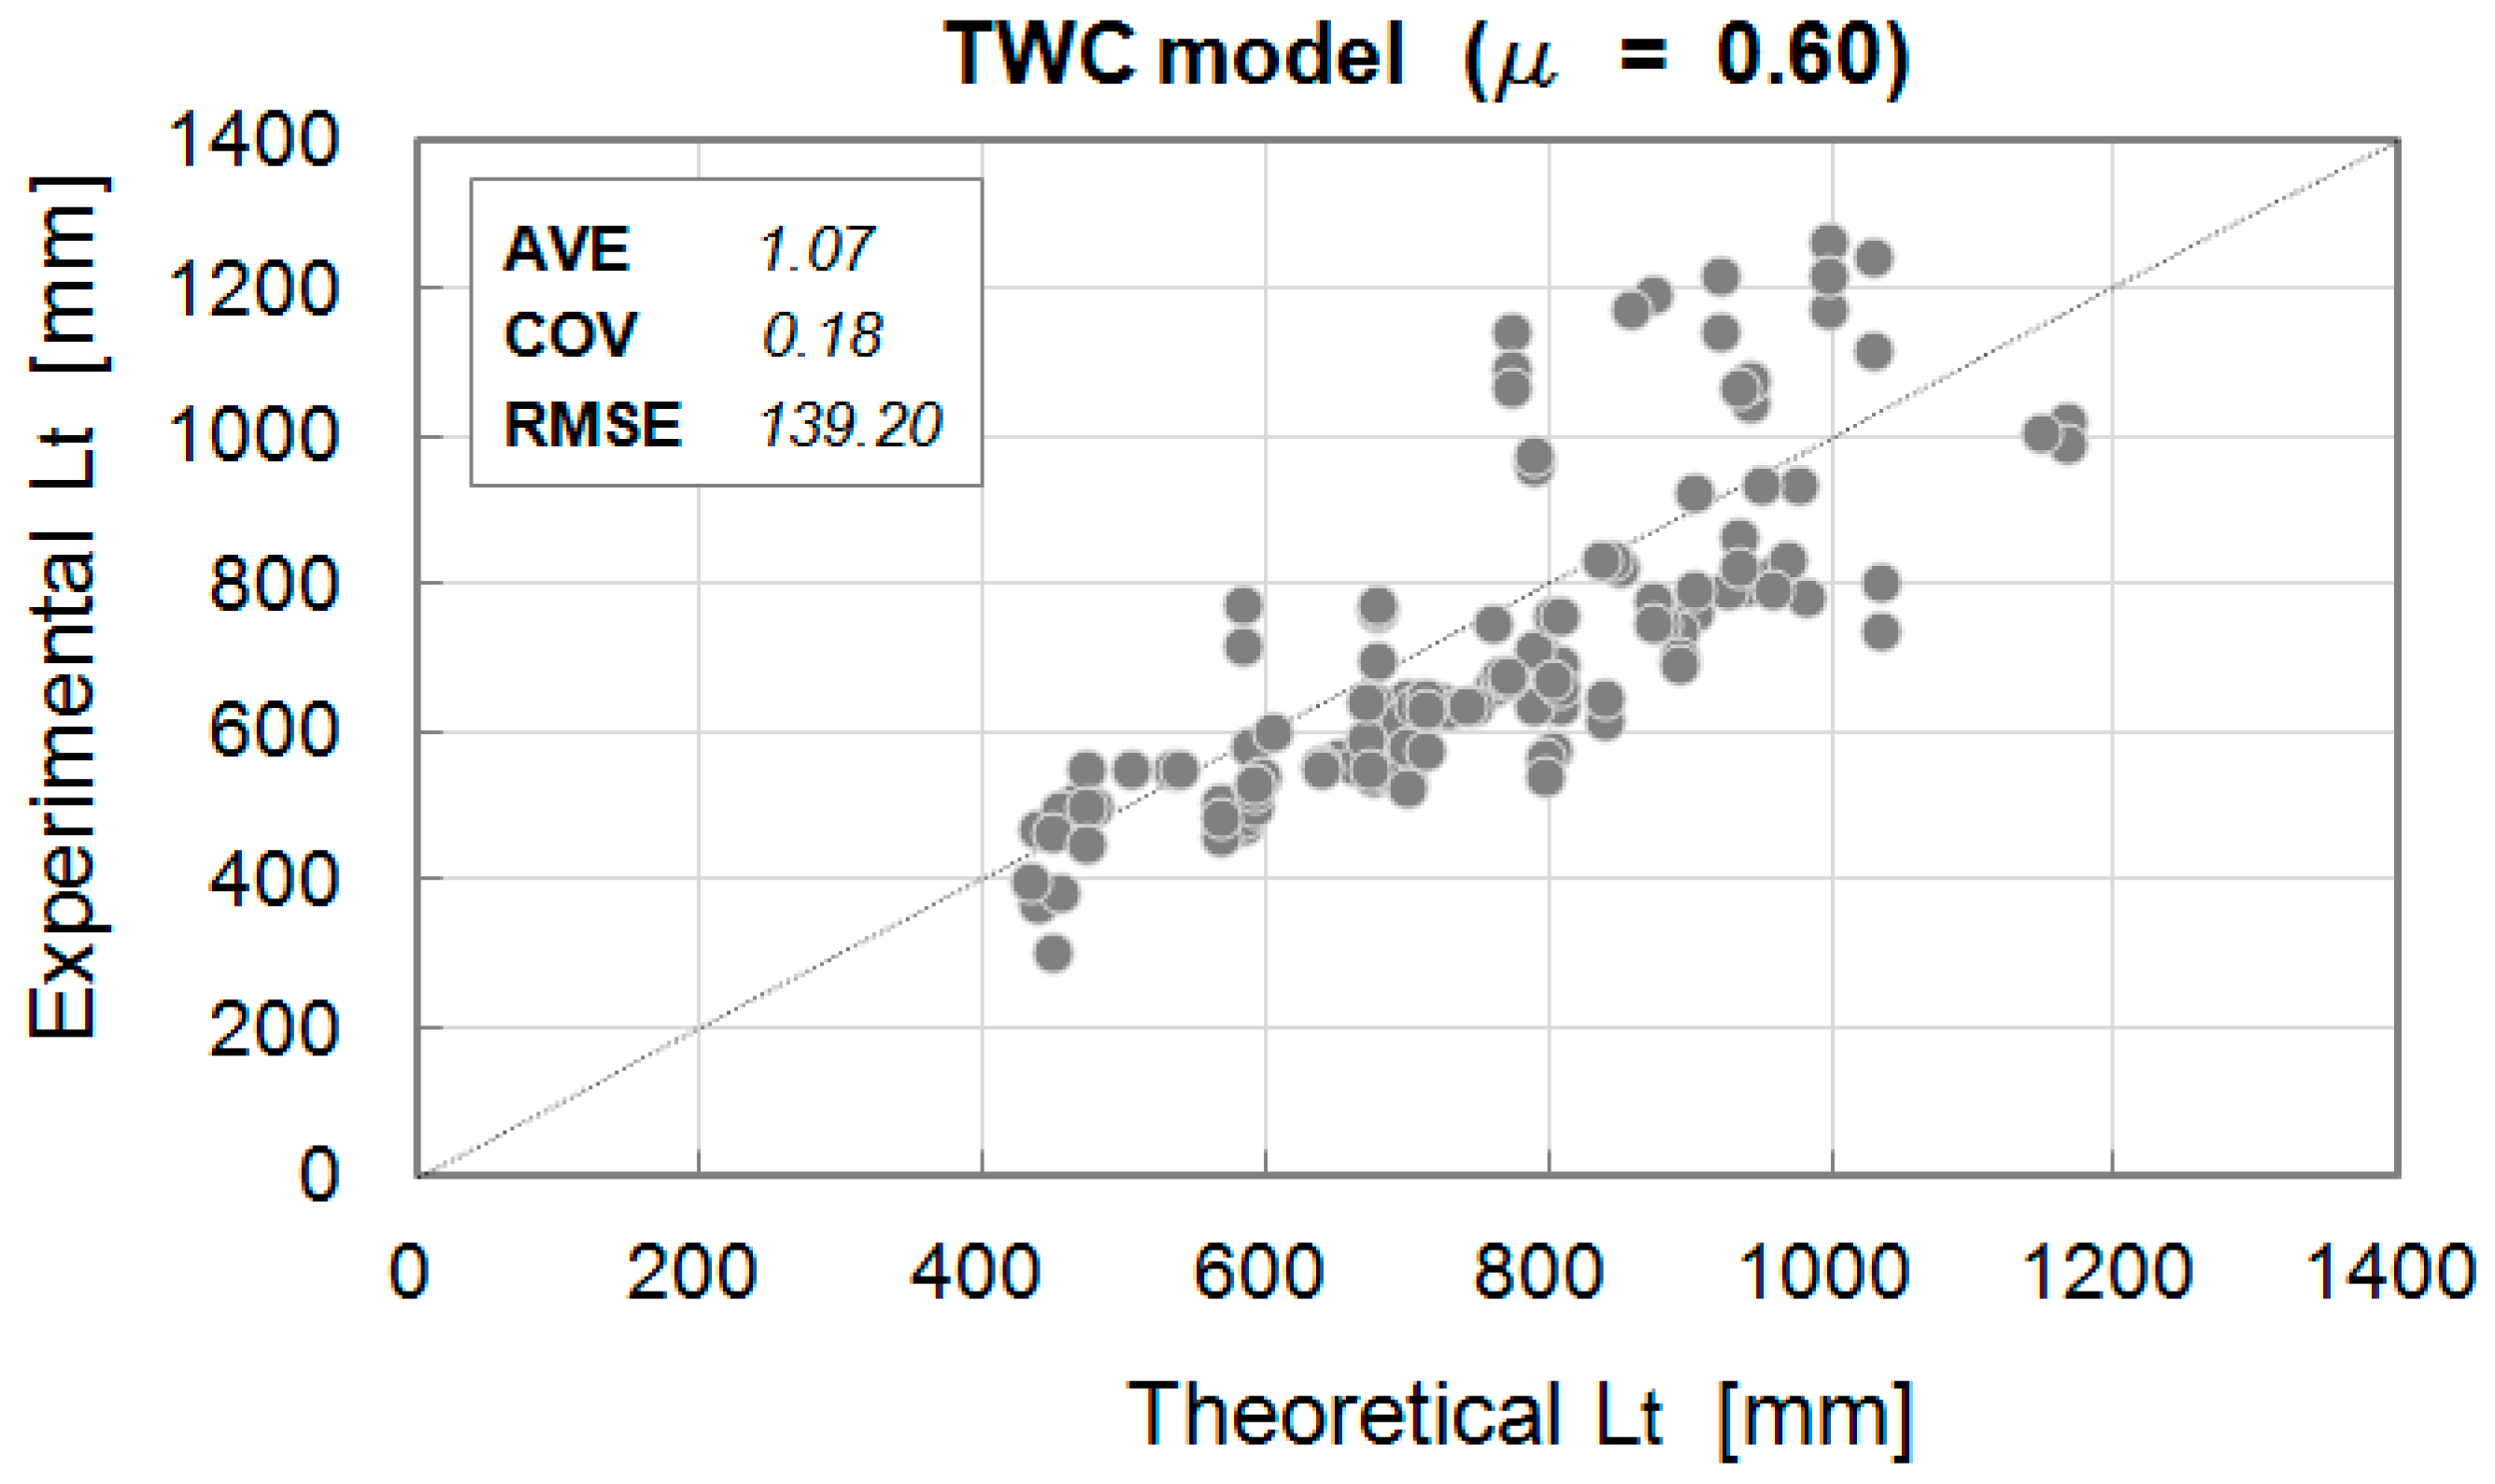
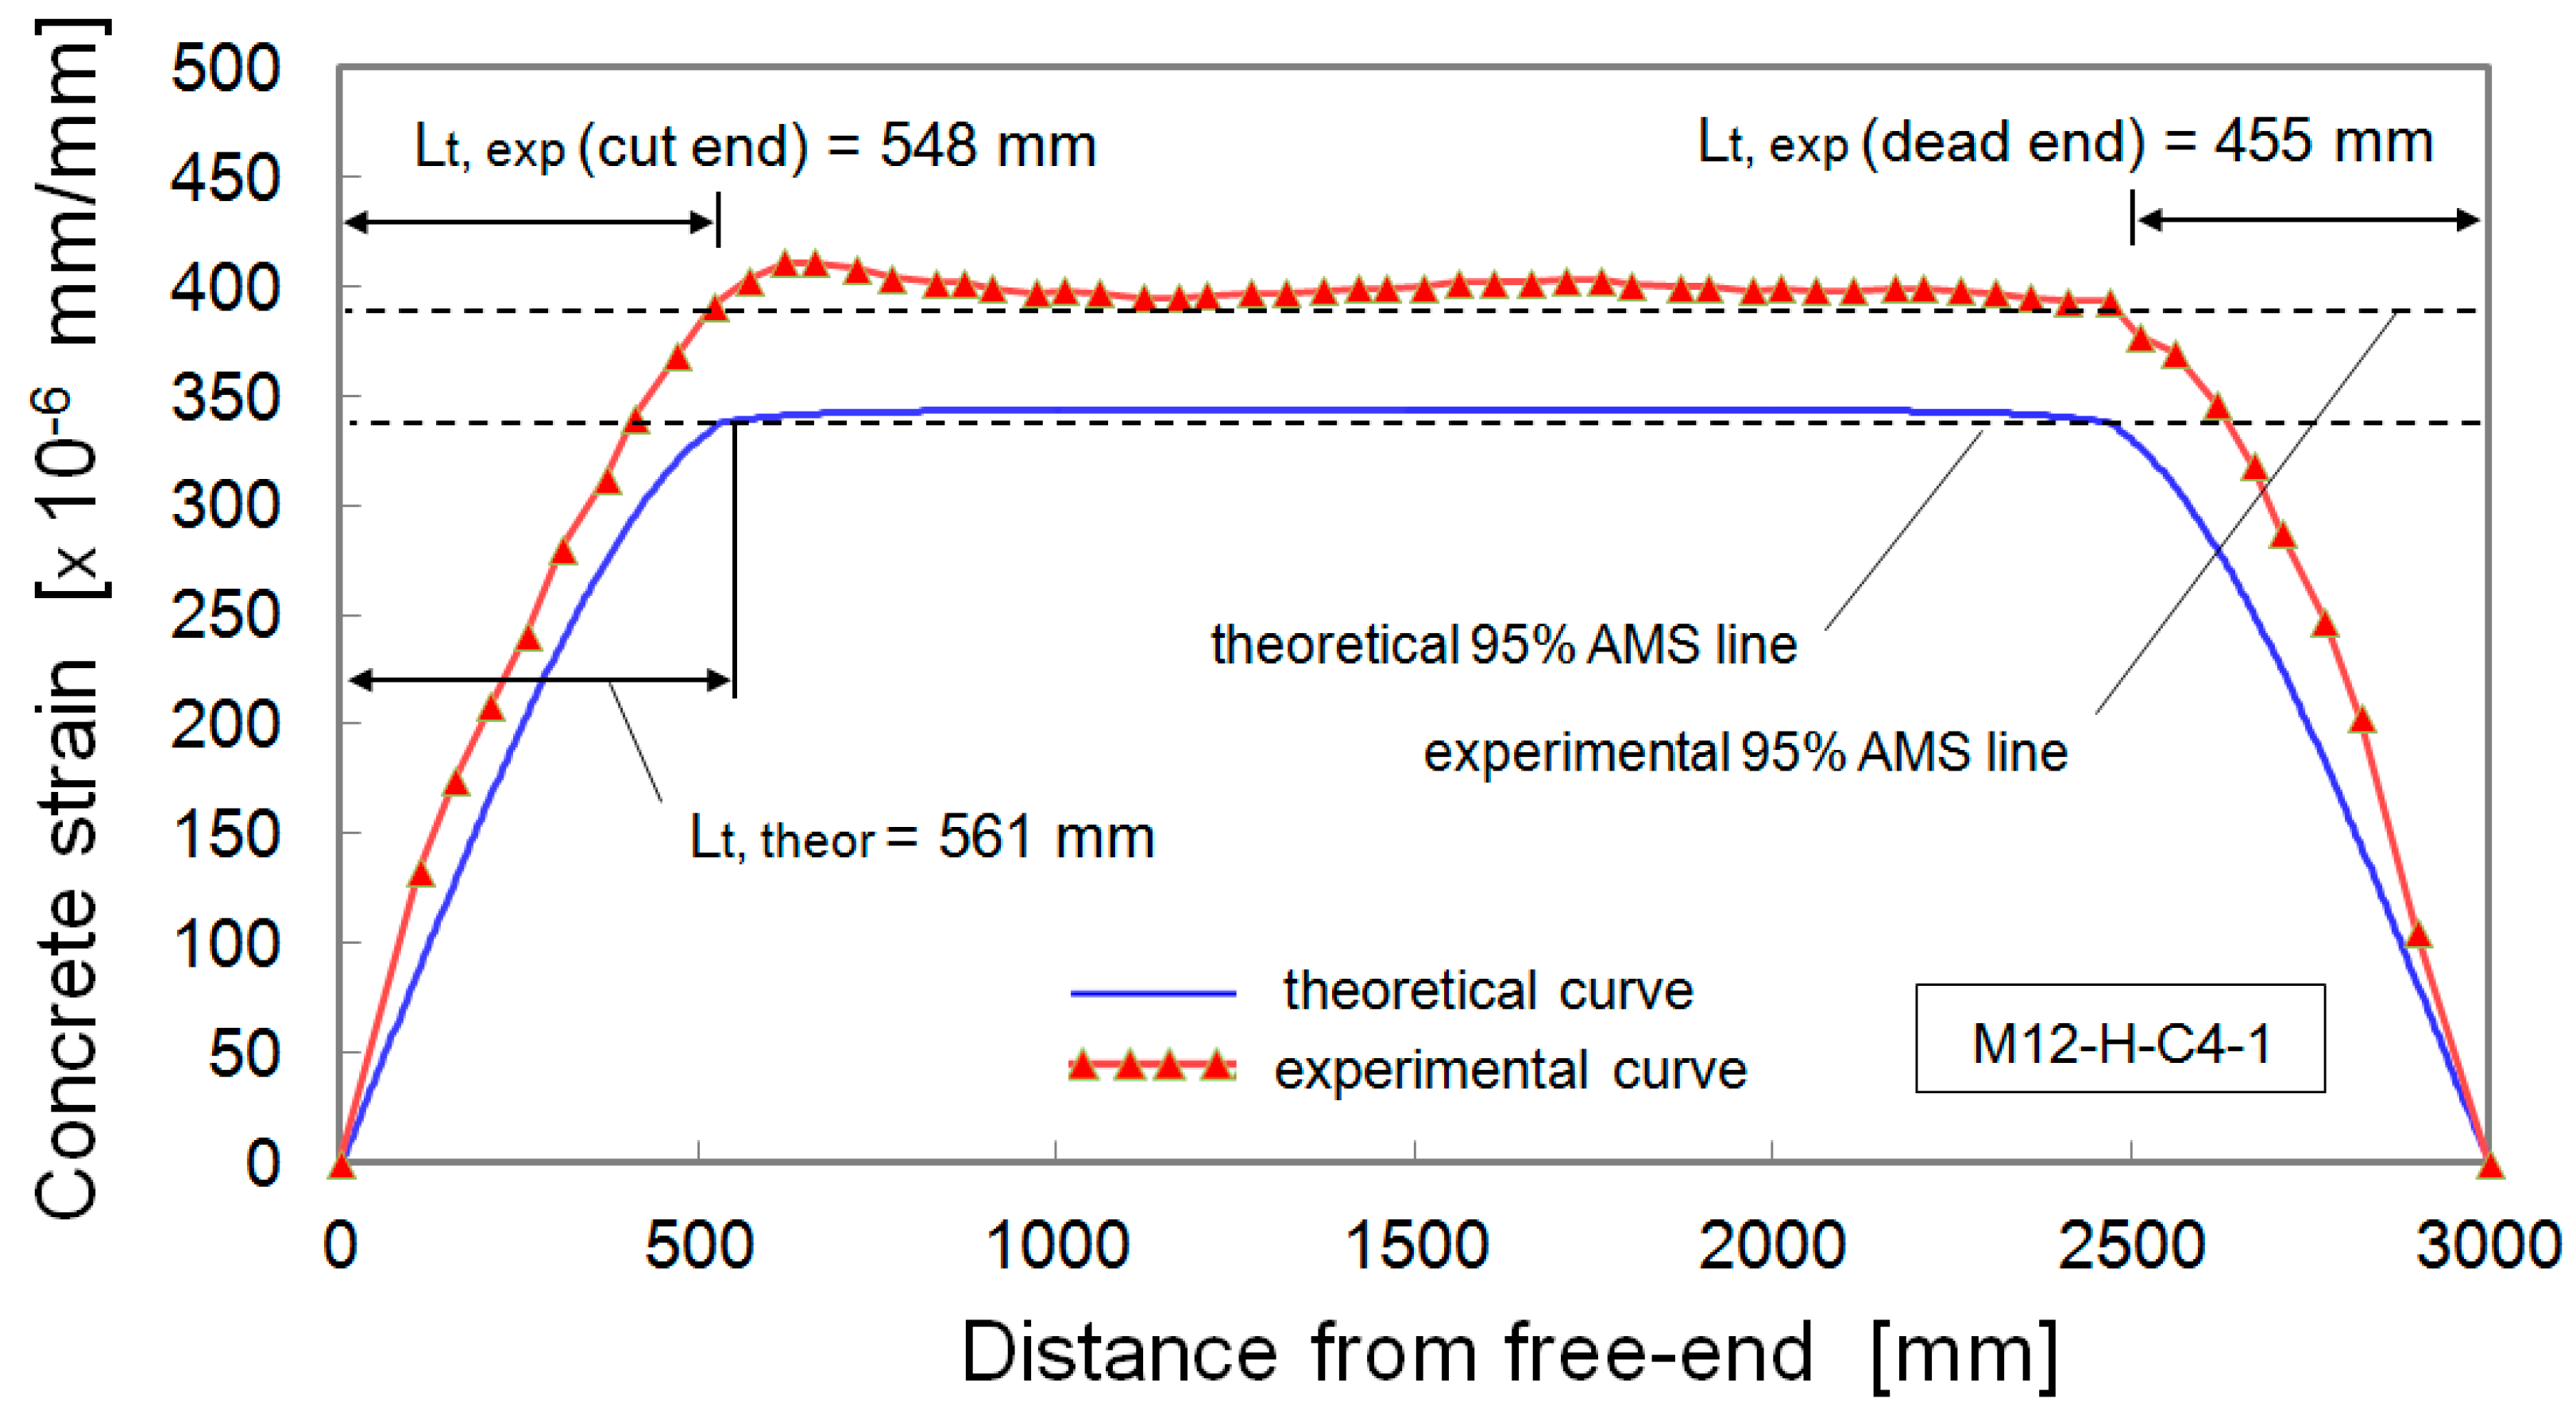
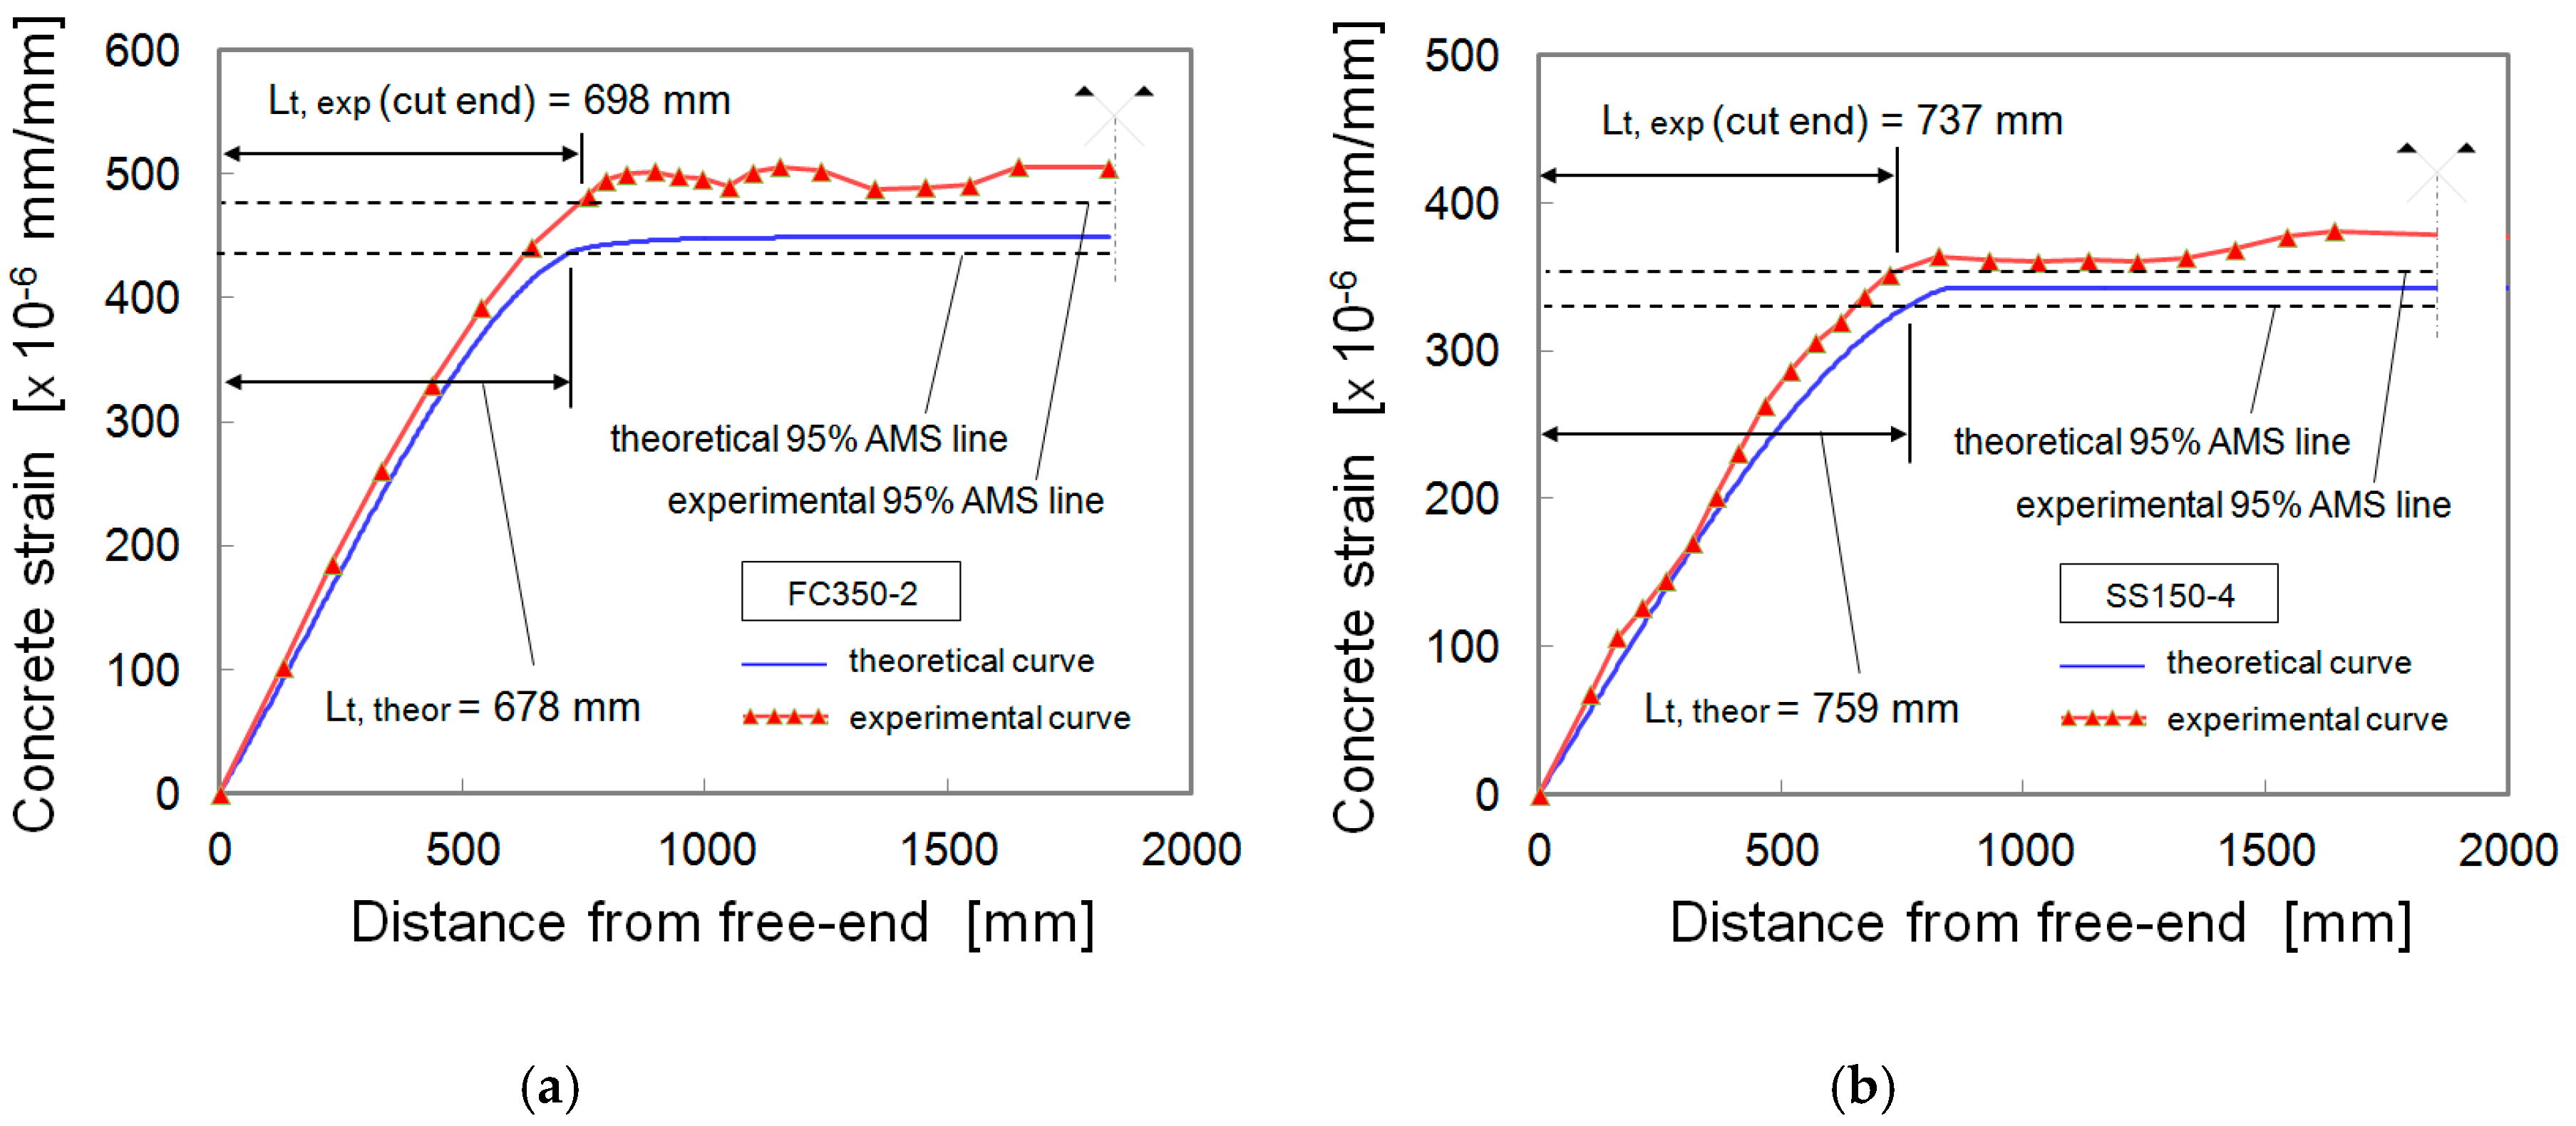
4.1. Global Behaviour: Transmission Length Assessment

The presented analytical model has been implemented with Matlab®, and then calibrated in order to evaluate the optimal friction coefficient μ , as introduced in Equation (4). The model calibration has been addressed based on a comprehensive dataset of experimental transmission length values measured in PC small-scale specimens, collected from an extensive review of the literature. The overall database, as reported in Table 1, comprises 130 data points from [11,15,16,24,28,29,30]. The extended version can be consulted at request by contacting the authors.
The collected dataset spans over a great variety of influencing parameters related to both geometrical features and material properties. Four different strand diameters (12.7, 15.2, 15.7, 18.0 mm), strand stress at release ranging from 871 to 1418 MPa, concrete compressive strength at release covering a range from 19.2 to 68.1 MPa, concrete cover from 36.4 to 63.5 mm and strand clear spacing up to 60.8 mm have been considered as quantitative variables. The small-scale specimens are equipped with up to five uncoated strands. Additionally, the type of prestressing-force release (i.e., sudden or gradual) has also been included in the study, as a qualitative factor. However, it should be noted that two different experimental transmission length values are usually derived from the same PC specimen, depending on the considered free-end. In fact, the most used method for prestress release entails flame-cutting all the strands at one location between two beams, cast simultaneously in the prestressing bed. In this way, for a single beam, the two opposite free-ends are affected by a different amount of released energy. The interior side between two successive beams is named “cut end”, subject to direct flame-cutting of the strands and experiencing a higher amount of energy as a result of the cutting process. The other free-end is the “dead end”, which is at the opposite side of the member, and thus not subject to a direct flame-cutting of the tendons (a shorter transmission length is commonly registered here). Therefore, in order to better compare experimental and theoretical results, the average value of the transmission length between those measured at the “cut end” and at the “dead end” is taken for each specimen, since the analytical model itself can not consider these situations at the release.
It is worth recalling that the accuracy of the TWC model is highly dependent on the adopted coefficient of friction between the strand and the surrounded concrete. The role of friction between the two materials was experimentally analysed in several previous studies ([31,32]), suggesting values of the friction coefficient from 0.3 to 0.8. Thus, a parametric analysis has been carried out in this work to evaluate the optimal friction coefficient, i.e., the value that gives the best fit with the experimental results collected in the dataset. Table 2 highlights the overall performance of the analytical TWC model when compared to the results of the experimental tests collected in the database, for different values of the friction coefficient ranging from 0.3 to 0.8.
Results are presented according to commonly used statistical indicators: the average ratio between theoretical and experimental values (AVE), the coefficient of variation (COV) and the root mean square error (RMSE). Accordingly, it can be noted that the best accuracy of the analytical model, both in terms of AVE and RMSE, is provided when a coefficient of friction equal to 0.6 is selected. Instead, the lower COV is achieved with a friction coefficient of 0.7 (even though the coefficient of variation for μ = 0.6 is very similar). It is recalled that such a value is intended as the overall friction coefficient, combining actual frictional bond and mechanical bond. Note also that for the lowest values of μ , the performance of the model decreases significantly. This might be due to the fact that shrinkage effect has not been separately accounted here and it is instead included in the overall friction coefficient. Indeed, shrinkage impact on radial compressive stresses connected to friction contribution on bond mechanism is well-known and could have a relevant impact when comparing different types of concrete [8,33]. Figure 9 shows the graphical comparison between the theoretical values of the transmission length obtained with the TWC model, using a coefficient of friction μ = 0.6, and the corresponding experimental results. It can be seen that most of the data points are very close to the diagonal ideal line “experimental vs. predicted Lt”. This demonstrates the effectiveness of the analytical model in replicating the measured transmission length values.
As an example, the comparison of the experimental concrete strain profile registered for specimen “M12-H-C4-1” in [16] with the theoretical curve obtained from the proposed model ( μ = 0.6) is depicted in Figure 10. The test setup involves a 12.7 mm mono-strand rectangular specimen (b = 112.7 mm; h = 200 mm), characterised by a strand stress at release of 1396.5 MPa, a concrete compressive strength at release of 46.7 MPa and a concrete cover thickness of 46.4 mm. Moreover, a sudden release of the prestressing force has been implemented. Minor differences are present between concrete strain values, but the general development of the experimental curve is well captured by the theoretical one. Particularly, the transmission lengths in the two cases are very similar: the experimental reference value is equal to 502 mm, determined through the 95% AMS method as the average between the “cut” and the “dead” end transmission length, while the analytical value is 561 mm.
An additional comparison between experimental and predicted values of the concrete strain after release is highlighted in Figure 11 for specimens of different properties. Here, test beams “FC350-2” by [24] and “SS150-4” by [28] are considered, respectively, also equipped with tendons of 12.7 mm diameter. In particular, the first specimen (Figure 11 on the left) presents three tendons with clear spacing of 38.1 mm, embedded in concrete characterised by a compressive strength at release of 29.8 MPa and a cover thickness of 63.5 mm. Tendons are gradually released at 1365.2 MPa. Instead, the second specimen (Figure 11 on the right) is mono-strand with concrete compressive strength at release of 26 MPa and lateral cover of 51 mm. In this case, the tendon stress at sudden release is 1299.0 MPa. It can be noted that some slight discrepancy between the experimental and theoretical concrete strain profiles is still present, especially in the plateau of the curves. For both the analysed configuration, the horizontal branch of the predicted curve (i.e., the blue plots in Figure 11) is below that of the experimental curve (i.e., the red plots). However, the general shape of the concrete strain build-up profiles is very similar. This is also confirmed by the predicted transmission length values, which are close to the measured ones. In Figure 11, the cut end of the described test members is shown, where the difference between experimental and theoretical transmission lengths is equal to 3% for both specimens “FC350-2” and “SS150-4”.

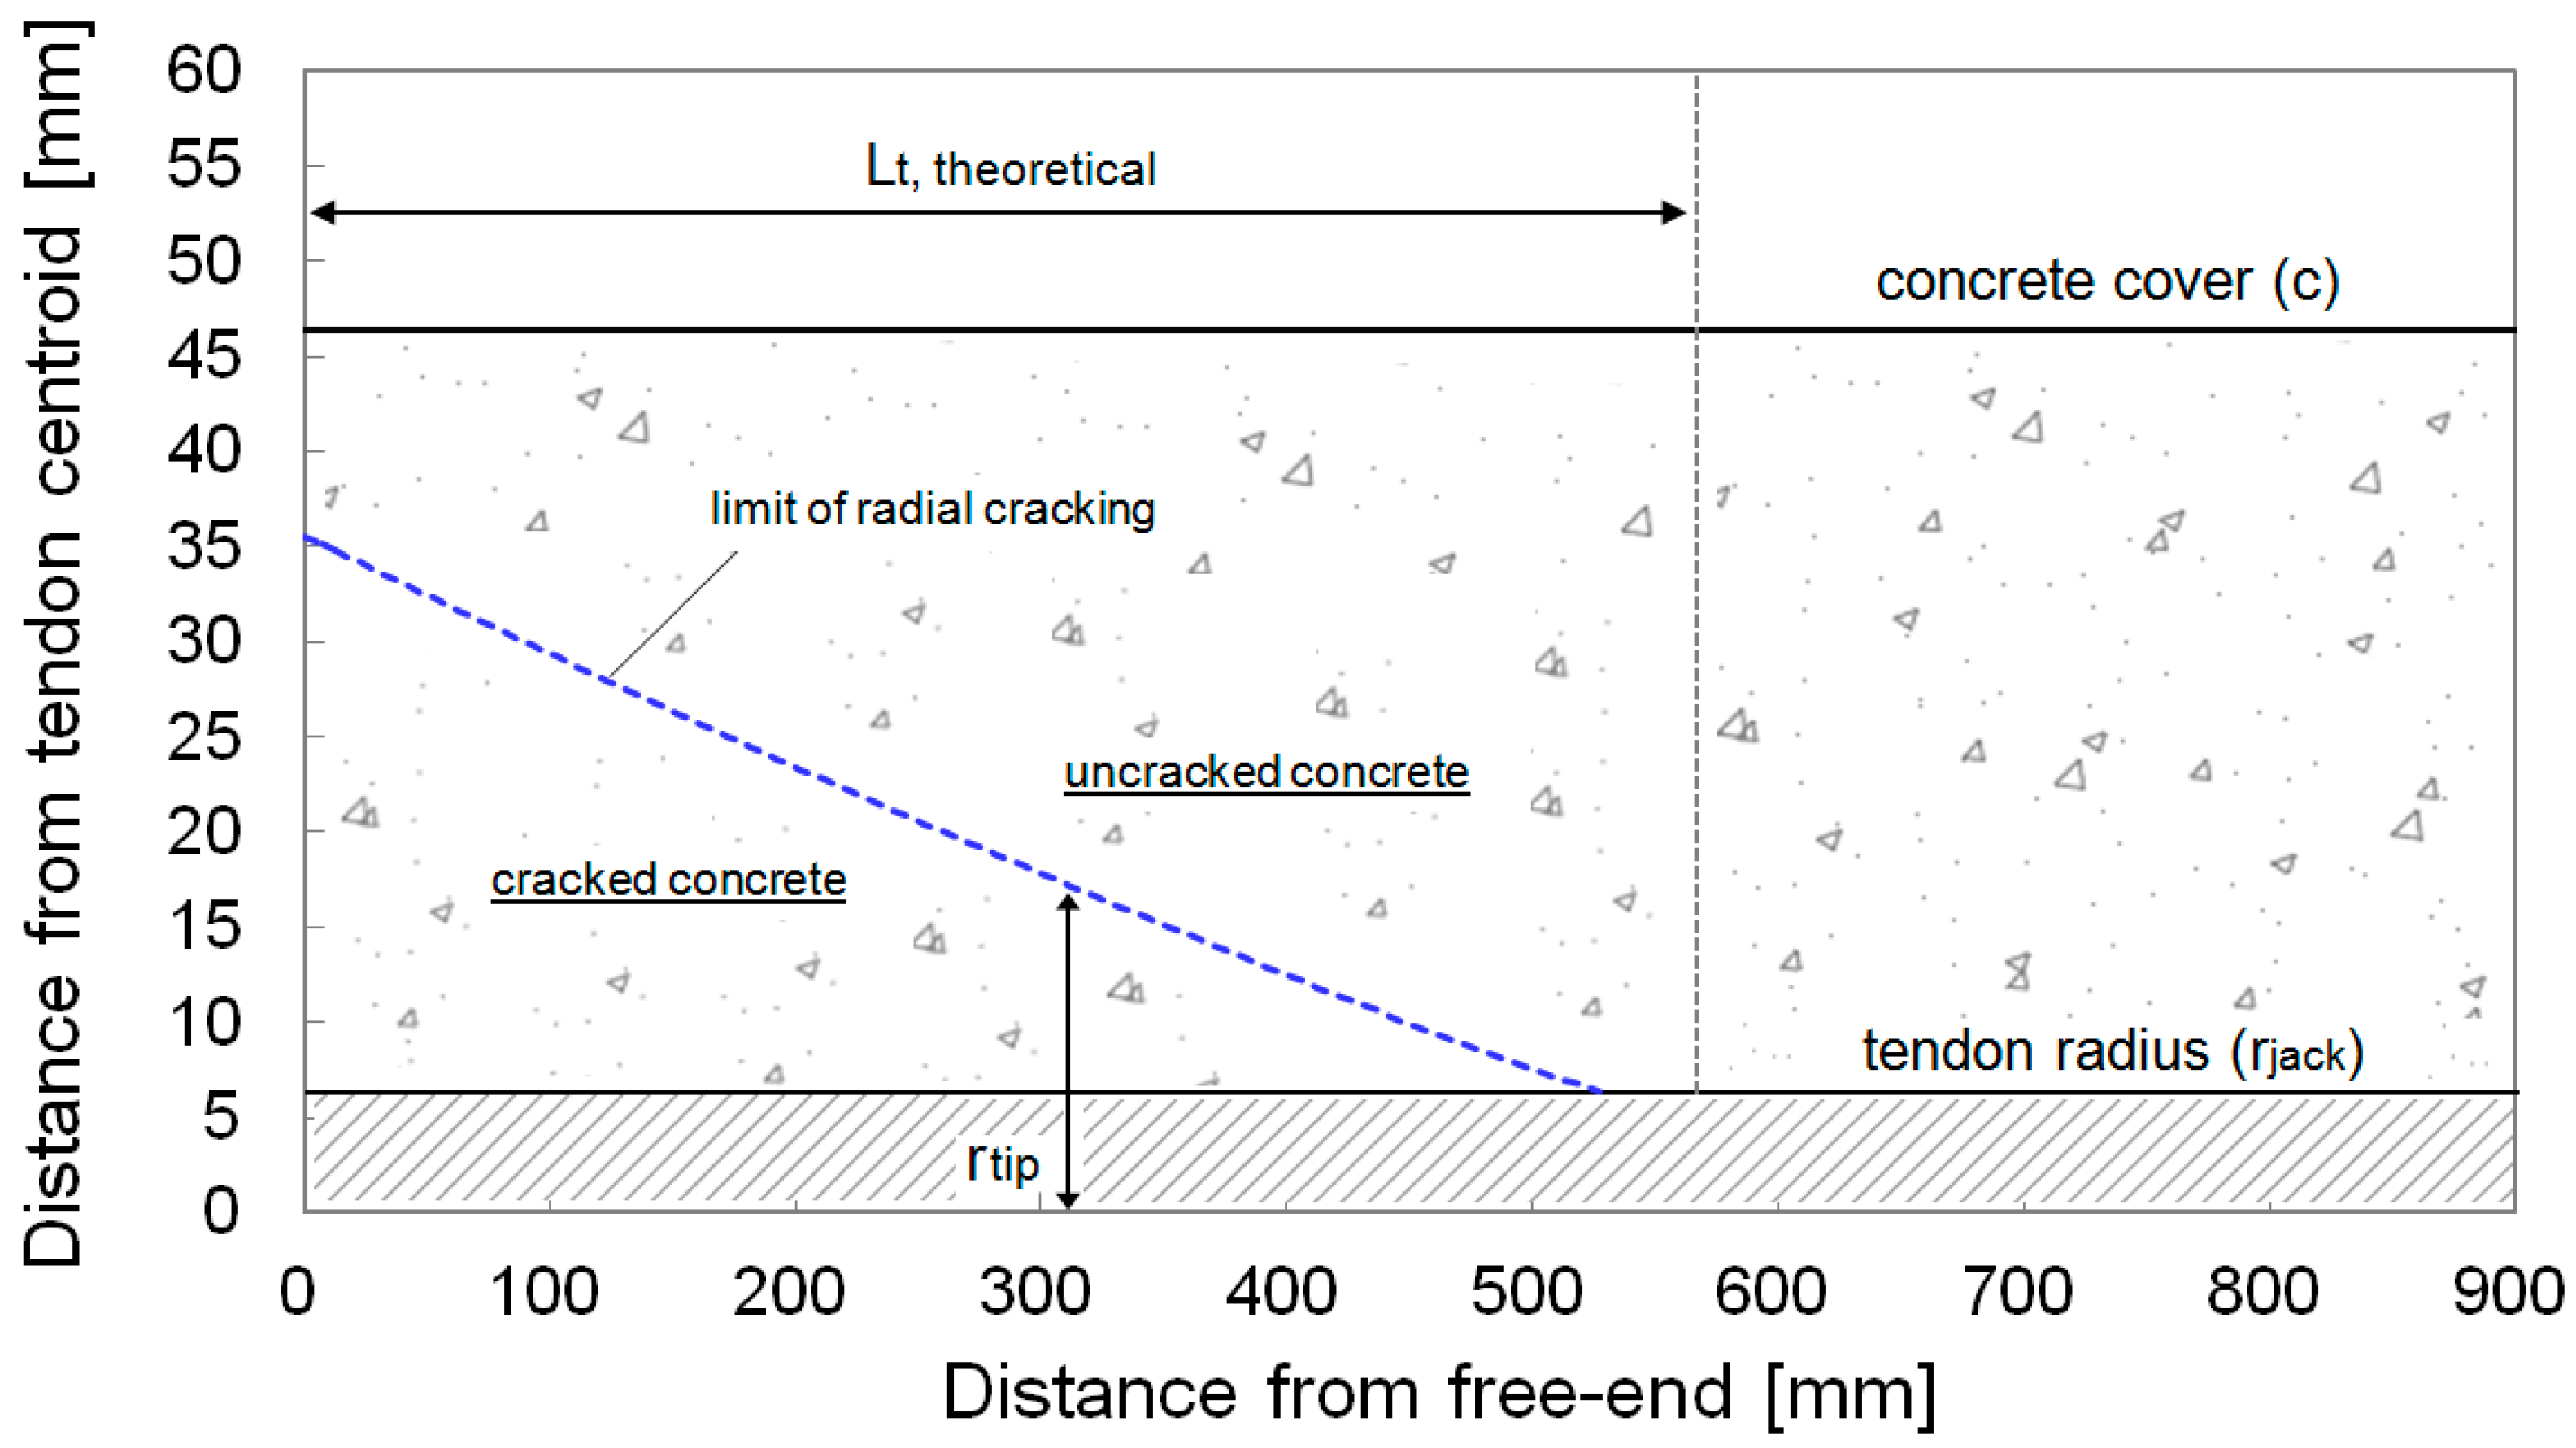
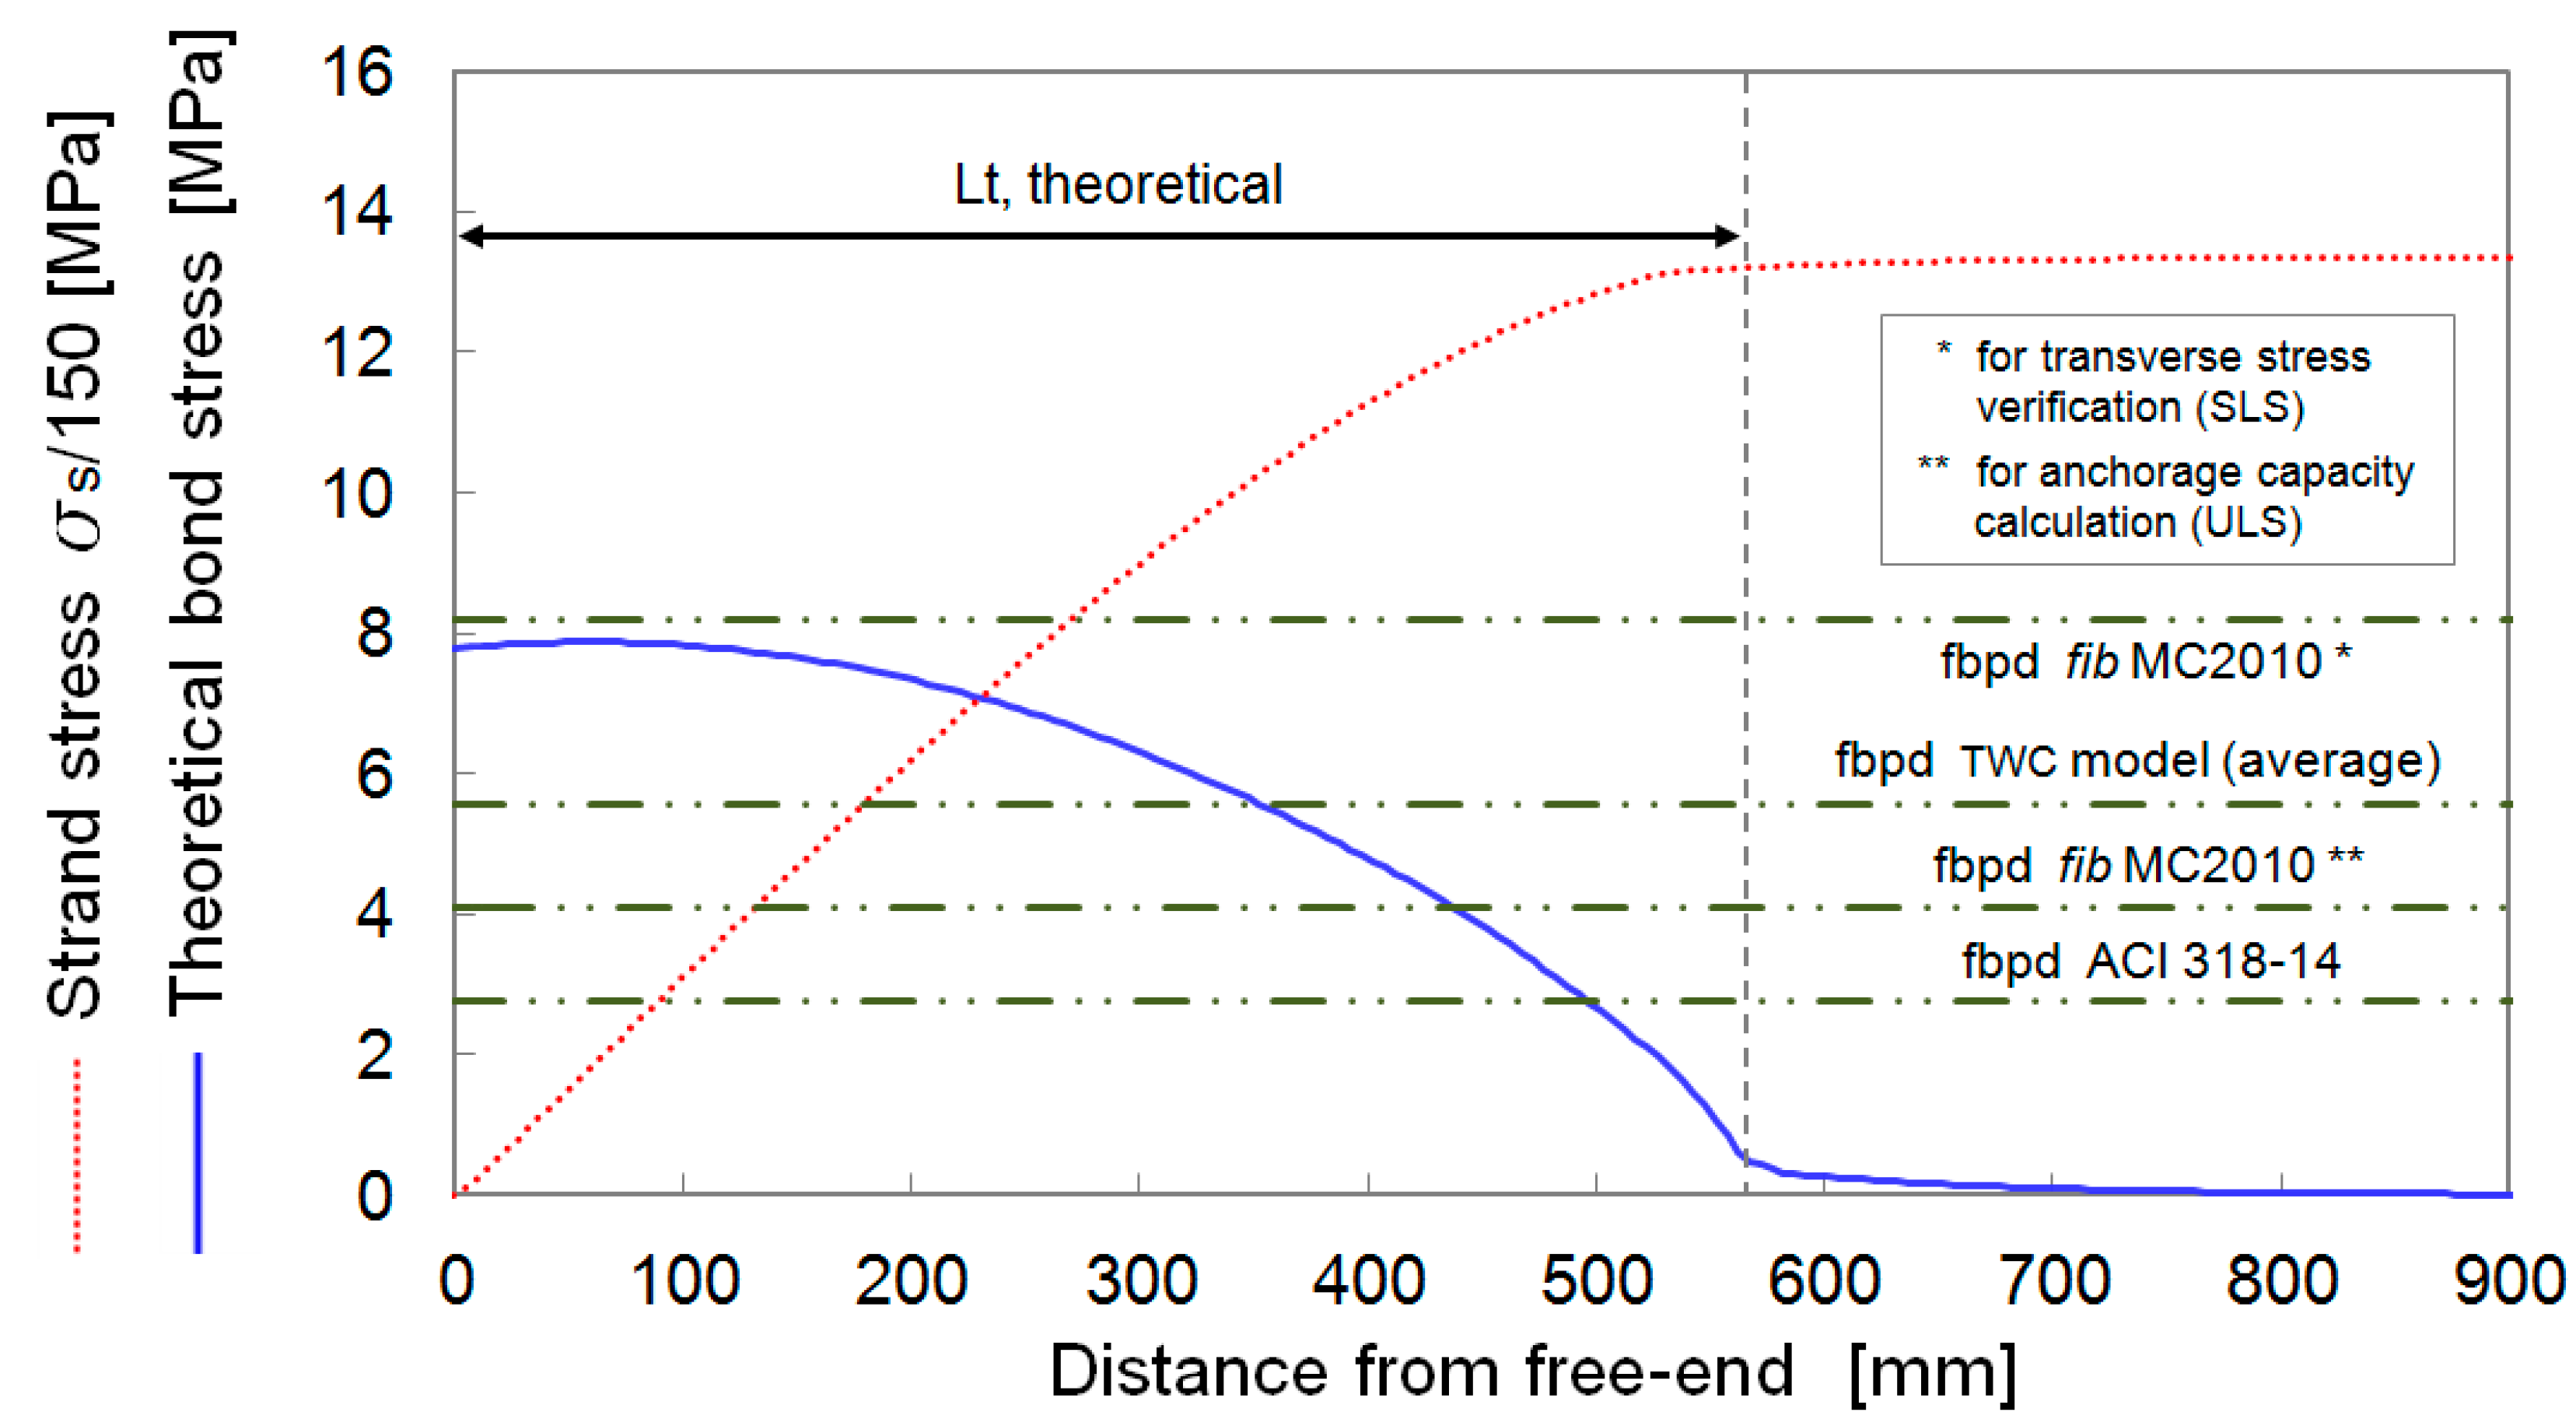
4.2. Local Behaviour: Radial Cracking and Bond Stress Development

The evolution of radial cracking along the transmission length of the same specimen “M12-H-C4-1”, evaluated through the TWC model, is shown in Figure 12. At the free-end section of the beam, the compressive stress σ r ( r j a c k ) at the interface between concrete and prestressing tendon is calculated to be around 55 MPa, when the elastic case is considered (Equation (16)). As a result, the circumferential tensile stress at the inner side of the concrete hollow cylinder, σ c , θ ( r j a c k ) , is estimated in approximately 57 MPa. For the analysed specimen, such a value is about 16 times larger than the concrete tensile strength at release, whose average value is equal to 3.43 MPa. Consequently, the concrete around the prestressing tendon experiences cracking in the radial direction.
However, the magnitude of the strand expansion due to the Hoyer effect is not sufficient to allow radial cracking to reach the free outer surface of the concrete section. In fact, at the free-end of the specimen, the distance from the centroid of the tendon to the crack tip ( r t i p , derived from Equation (18)) is calculated to be 35.5 mm, lower than the concrete cover thickness, equal to 46.4 mm. Then, moving towards the mid-span of the PC member, the increase in the tendon diameter due to release of the prestressing-force becomes less significant, so that the interface pressure, the hoop stress and the extent of the radial cracking diminish progressively. At a certain distance from the free-end, i.e., just after 500 mm, the whole concrete section becomes uncracked and the transmission length is rapidly reached (561 mm) as a consequence of the larger confining stresses exerted by the surrounding concrete on the strand in the central region of the PC member.
In Figure 13, the theoretical bond stress distribution along the transmission length is also shown for the considered specimen. It can be seen that the maximum value of the bond strength at the interface surface between the strand and the surrounding concrete, evaluated in nearly 8 MPa, is registered in the proximity of the free-end of the member. Here, the compressive stresses on the concrete, triggered by the increase in the tendon diameter, are relatively high. The bond stress value at any point along the tendon is proportional to the slope of the steel stress build-up curve, depicted in red in Figure 13. Accordingly, bond decreases non-linearly as the transmission length is approached. Then, once the transmission length is fully developed, the bond stress remains negligible.
Finally, a comparison with the bond strength values suggested by fib MC2010 [1] and ACI 318-14 [2] is presented. According to the formulation of fib MC2010, the uniform bond stress at the interface steel–concrete after release (considering average material properties) can be estimated as in Equation (24):
σ b p d = η p 1   η p 2   σ c t ( t )
where η p 1 is a coefficient which takes into account the type of tendon ( η p 1 = 1.2 in the present case, i.e., for seven-wire strands) and η p 2 is a factor that considers the position of the tendon during concreting ( η p 2 = 1.0 is selected for good bond conditions, i.e., for horizontal tendons which are up to 250 mm from the bottom or at least 300 mm below the top of the concrete section during casting). The average tensile strength of concrete at the time of prestressing force release σ c t ( t ) , as mentioned, is equal to 3.43 MPa for specimen M12-H-C4-1. Thus, for fib MC2010, the prestressing-force is assumed to be transferred to the concrete by a constant bond strength equal to σ b p d = 4.12 MPa. However, a consideration on such bond strength formulation is worth mentioning. Based on fib MC2010, the distinction between the transmission length L t calculated for transverse stress verification at release and that evaluated for anchorage length determination at ULS is accomplished by considering a coefficient α p 2 , as in Equation (25):
L t = α p 1   α p 2   α p 3   σ s i σ p t d   l b p
where α p 1 is a coefficient that considers the type of release, α p 3 a factor that accounts for the influence of bond situation, σ s i the tendon stress at release, σ p t d the design tensile strength of the prestressing steel and l b p the basic anchorage length of the tendon (which in turn depends on the inverse of the interface bond strength σ b p d ). The parameter α p 2 , taking into account the action effect to be verified, is prescribed to be 0.50 for stress check at release and 1.00 for calculation of the anchorage length at ULS. Nevertheless, such coefficient α p 2 should directly affect the bond strength value, as the other variables in Equation (25) (i.e., α p 1 , α p 3 , σ s i and σ p t d ) represent test conditions or material strengths, and they do not change between the two mentioned design situations. According to this consideration, the actual bond strength should be computed as σ b p d / α p 2 , with α p 2 equal to 0.50 (immediately after release) or 1.00 (at the Ultimate Limit State). This means that the constant bond stress at the tendon–concrete interface would be doubled when calculating the transmission length for stress check at prestress release, i.e., equal to 8.24 MPa in the analysed case.
Conversely, according to the simple model of ACI 318-14, the value of the constant bond strength along the transmission length is fixed, and equal to 2.76 MPa (400 psi), which represents the average value obtained by the Portland Cement Association (PCA), using steel Grade 250 for the seven-wire strands. On the other hand, if the area under the theoretical bond stress curve in Figure 13 is computed and divided by the analytical transmission length, an equivalent constant bond strength can also be derived from the TWC model. This value results to be 5.55 MPa, which is about 48% smaller than the bond strength provided by fib MC2010 for SLS verification, 35% greater than that provided by fib MC2010 for ULS calculation and about 100% greater than the value suggested by ACI 318-14. In particular, with respect to stress verification after release, the value of the bond strength prescribed by fib MC2010 for the considered PC specimen seems to over-estimate the effective interface bond stress (resulting in shorter transmission lengths), while the value suggested by ACI 318-14 seems to under-estimate it (resulting in longer transmission lengths).

5. Conclusions

In this paper, the analytical modelling of the transmission length in prestressed-concrete members has been addressed. Particularly, a theoretical bond model based on the thick-wall cylinders theory has been implemented, considering anisotropic properties of the concrete in tension. The overall friction coefficient between the tendon and the surrounding concrete has been calibrated on a database of 130 experimental transmission length values measured in the literature. Comparisons with experimental results have shown that the capability of the developed model to accurately simulate the introduction of the prestressing force to the concrete highly depends on the selected coefficient of friction. Specifically, a friction coefficient of μ = 0.6 was found to give the best accuracy of the model in terms of the principal statistical indicators (AVE, COV, RMSE). With this parameter value, concerning the local behaviour, the model is able to capture well the development of concrete strain, concrete radial cracking and bond stress along the transmission length. For the analysed case, used as an indicative example, the average bond strength computed from the TWC model was 48% smaller than the value provided by fib MC2010 for SLS verification, 35% greater than that provided by the same code for ULS verification and about 100% greater than that suggested by ACI 318-14.

Author Contributions

Conceptualization, F.F. and C.P.; methodology, N.F. and F.F.; software, N.F.; validation, N.F.; formal analysis, N.F. and F.F.; investigation, N.F and F.F.; resources, C.P.; data curation, N.F. and F.F.; writing—original draft preparation, N.F. and F.F.; writing—review and editing, N.F. and F.F; visualization, N.F.; supervision, F.F. and C.P.; project administration, C.P.; funding acquisition, C.P. All authors have read and agreed to the published version of the manuscript.

Funding

This research received no external funding.

Acknowledgments

This work is part of the collaborative activity developed by the authors within the framework of the Task Group 2.5: “Bond and Material Models” of the International Federation for Structural Concrete (fib).

Conflicts of Interest

The authors declare that the research was conducted in the absence of any commercial or financial relationships that could be construed as a potential conflict of interest.

Statement of Data Availability

The dataset and the Matlab® code will be available at request to the authors.

Nomenclature

AcCross-sectional area of concrete
AspCross-sectional area of prestressing tendon
bWidth of the concrete section
cConcrete cover thickness
c 1 , c 2 Constants of integration for the solution of u
EcElastic modulus of concrete
EpsElastic modulus of prestressing steel
eVertical eccentricity of the considered tendon with respect to the centre of gravity of the concrete section
hHeight of the concrete section
JxMoment of inertia of the concrete section
LtTransmission length of the prestressing tendon
Lt, experimentalExperimental value of the transmission length
Lt, theoreticalTheoretical value of the transmission length
lbpBasic anchorage length according to fib MC2010
PInitial prestressing-force in the tendon
rRadial distance from the tendon centroid
rjackRadius of the tendon after release
rpsRadius of the unstressed tendon
rtipDistance from the tendon centroid to the crack tip
uRadial displacement
ucRadial displacement of the concrete
upsRadial displacement of the tendon outer surface
yVertical distance from the centre of gravity of the concrete section
Δ zLength of the single finite element in which the prestressing tendon is subdivided
zLongitudinal distance from the free-end of the PC member
αp1Coefficient which takes into account the prestress release method, according to fib MC2010
αp2Coefficient which takes into account the action effect to be verified, according to fib MC2010
αp3Coefficient which takes into account the influence of bond situation, according to fib MC2010
αrelCoefficient which takes into account the prestress release method, according to the findings proposed by the authors
ε 1 Concrete strain (assumed as 0.0003) corresponding to concrete tensile stress equal to 0.15 f t , according to Han’s softening model
ε c , ck Cracking strain of concrete
ε c , r Concrete strain in the radial direction
ε c , θ Concrete strain in the circumferential direction
ε c , z Concrete axial strain at the level of the tendon centroid
ε u Ultimate concrete strain (assumed as 0.002) corresponding to concrete tensile stress equal to zero, according to Han’s softening model
ηp1Coefficient which takes into account the type of tendon, according to fib MC2010
ηp2Coefficient which takes into account the position of the tendon, according to fib MC2010
μ Overall friction coefficient between the tendon and the surrounding concrete, combining actual frictional and mechanical bond
υ c Poisson’s ratio of the concrete
υ ps Poisson’s ratio of the prestressing steel
σ bpd   Prestress transfer bond at the interface tendon-concrete
σ c , r Concrete radial stress
σ c , θ Concrete circumferential stress
σ c , z   Concrete axial stress
σ ct   Tensile strength of concrete
σ ptd Design tensile strength of the prestressing steel
σ r Tendon radial stress
σ r (rjack)Radial compressive stress at the interface between steel and concrete, arising from the Hoyer effect
Δ σ s Increment in tendon stress resulting from the development of bond stress along the finite element
σ s Tendon stress at the considered point along the length of the member
σ si Jacking stress of the tendon at prestressing-force release
φNominal tendon diameter

References

  1. fib Model Code 2010. fib Model Code for Concrete Structures; International Federation for Structural Concrete (fib): Lausanne, Switzerland, 2013. [Google Scholar]
  2. ACI Committee 318. Building Code Requirements for Structural Concrete (ACI 318-14) and Commentary (ACI 318R-14); American Concrete Institute: Farmington Hills, MI, USA, 2014. [Google Scholar]
  3. Janney, J.R. Nature of bond in pretensioned prestressed concrete. ACI J. 1954, 50, 717–736. [Google Scholar]
  4. Hanson, N.W.; Kaar, P.H. Flexural bond of pretensioned prestressed beams. ACI J. 1959, 55, 783–802. [Google Scholar]
  5. Metelli, G.; Plizzari, G.A. Influence of the relative rib area on bond behaviour. Mag. Concr. Res. 2014, 66, 277–294. [Google Scholar] [CrossRef] [Green Version]
  6. Pellegrino, C.; Zanini, M.A.; Faleschini, F.; Corain, L. Predicting bond formulations for prestressed concrete elements. Eng. Struct. 2015, 97, 105–117. [Google Scholar] [CrossRef]
  7. Mohandoss, P.; Pillai, R.G.; Sengupta, A.K. Transmission length of pretensioned concrete systems - comparison of codes and test data. Mag. Concr. Res. 2018, 71, 1–13. [Google Scholar] [CrossRef]
  8. Abdelatif, A.O.; Owen, J.S.; Hussein, M.F. Modelling the prestress transfer in pre-tensioned concrete elements. Finite Elem. Anal. Des. 2015, 94, 47–63. [Google Scholar] [CrossRef]
  9. Ramirez-Garcia, A.T.; Dang, C.N.; Hale, W.M.; Martí-Vargas, J.R. A higher-order equation for modeling strand bond in pretensioned concrete beams. Eng. Struct. 2017, 131, 345–361. [Google Scholar] [CrossRef]
  10. Eurocode 2. Design of Concrete Structures-Part 1-1: General Rules and Rules for Buildings; Comitè Europèen de Normalisation: Brussels, Belgium, 2004. [Google Scholar]
  11. Oh, B.H.; Kim, E.S. Realistic evaluation of transfer lengths in pretensioned prestressed concrete members. ACI Struct. J. 2000, 97, 821–830. [Google Scholar]
  12. Dang, C.N.; Hale, W.M.; Martì-Vargas, J.R. Quantification of bond performance of 18-mm prestressing steel. Constr. Build. Mater. 2018, 159, 451–462. [Google Scholar] [CrossRef]
  13. Zia, P.; Mostafa, T. Development length of prestressing strands. PCI J. 1977, 22, 54–65. [Google Scholar]
  14. Martí-Vargas, J.R.; Serna-Ros, P.; Navarro-Gregori, J.; Bonet, J.L. Effects of concrete composition on transmission length of prestressing strands. Constr. Build. Mater. 2012, 27, 350–356. [Google Scholar] [CrossRef]
  15. Mitchell, D.; Cook, W.D.; Kahn, A.A.; Tham, T. Influence of High-Strength concrete on transfer and development length of pretensioning strand. PCI J. 1993, 38, 52–66. [Google Scholar] [CrossRef]
  16. Oh, B.H.; Kim, E.S.; Choi, Y.C. Theoretical analysis of transfer lengths in pretensioned prestressed concrete members. J. Eng. Mech. 2006, 132, 1057–1066. [Google Scholar]
  17. Base, G.D. An Investigation of Transmission Length in Pretensioned Concrete. In Proceedings of the Third Congress of FIP-Session III, Brussels, Belgium, 1958; pp. 603–623. [Google Scholar]
  18. Holmberg, A.; Lindgren, S. Anchorage and Prestress Transmission; Document D1; National Swedish Institute for Building Research: Stockholm, Sweden, 1970. [Google Scholar]
  19. Kaar, P.H.; Hanson, N.W. Bond fatigue tests of beams simulating pretensioned concrete crossties. J. Prestress. Concr. Inst. 1975, 20, 65–80. [Google Scholar] [CrossRef]
  20. Cousins, T.E.; Johnston, D.W.; Zia, P. Transfer and development length of epoxy-coated and uncoated prestressing strand. PCI J. 1990, 35, 92–103. [Google Scholar] [CrossRef]
  21. Pellegrino, C.; Faleschini, F.; Fabris, N.; Zanini, M.A. Bond of Prestressing Tendons; Internal report, Submitted to: Fib Bulletin on “Advances on Bond in Concrete”; University of Padova: Padua, Italy, 2018. [Google Scholar]
  22. Deatherage, J.H.; Burdette, E.G.; Chew, C.K. Development length and lateral spacing requirements of prestressing strand for prestress concrete bridge girders. PCI J. 1994, 39, 70–83. [Google Scholar] [CrossRef]
  23. Barnes, R.W.; Groove, J.W.; Burns, N.H. Experimental assessment of factors affecting transfer length. ACI Struct. J. 2003, 100, 740–748. [Google Scholar]
  24. Russell, B.W.; Burns, N.H. Measured transfer lengths of 0.5 and 0.6 in. Strands in pretensioned concrete. J. Struct. Eng. 1996, 123, 44–65. [Google Scholar] [CrossRef]
  25. Tepfers, R. Cracking of concrete cover along anchored deformed reinforcing bars. Mag. Concr. Res. 1979, 31, 3–12. [Google Scholar] [CrossRef]
  26. Han, S.J.; Lee, D.H.; Cho, S.H.; Ka, S.B.; Kim, K.S. Estimation of transfer lengths in precast pretensioned concrete members based on a modified thick-walled cylinder model. Struct. Concr. 2016, 17, 52–62. [Google Scholar] [CrossRef]
  27. Han, S.J.; Lee, D.H.; Kim, K.S.; Seo, S.Y.; Moon, J.; Monteiro, P.J. Degradation of flexural strength in reinforced concrete members caused by steel corrosion. Constr. Build. Mater. 2014, 54, 572–583. [Google Scholar] [CrossRef]
  28. Russell, B.W.; Burns, N.H. Measurement of transfer lengths on pretensioned concrete elements. PCI J. 1997, 41, 541–549. [Google Scholar] [CrossRef]
  29. Martì-Vargas, J.R.; Arbeláez, C.A.; Serna-Ros, P.; Castro-Bugallo, C. Reliability of transfer length estimation from strand end slip. ACI Struct. J. 2007, 104, 487–494. [Google Scholar]
  30. Dang, C.N.; Hale, W.M.; Martì-Vargas, J.R. Assessment of transmission length of prestressing strands according to fib Model Code 2010. Eng. Struct. 2017, 147, 425–433. [Google Scholar] [CrossRef]
  31. Martins, J.A.C.; Oden, J.T. Interface models, variational principles and numerical solutions for dynamic friction problems. In Mechanics of Material Interfaces, Proceedings of ASCE/ASME Mechanics Conference, Albuquerque, NM, USA, 23–26 June 1985; Elsevier: Amsterdam, The Netherlands, 1985. [Google Scholar]
  32. Olofsson, U.; Holmgren, M. Friction Measurement at Low Sliding Speed Using a Servo-Hydraulic Tension-Torsion Machine; Report SP AR 1992:51; Swedish National Testing Institute-Building Structures Section: Stockholm, Sweden, 1992. [Google Scholar]
  33. den Uijl, J.A. Bond modelling of prestressing strand. ACI Spec. Publ. 1998, 180, 145–170. [Google Scholar]
Figure 1. Idealised steel stress development in a prestressed-concrete member after release.
Civileng 01 00006 g001
Figure 2. Discretisation of the prestressing strand and equilibrium of forces.
Civileng 01 00006 g002
Figure 3. Geometry of the idealised steel and concrete cylinders for the application of the thick-walled cylinders (TWC) theory.
Civileng 01 00006 g003
Figure 4. Selection of an infinitesimal element of the concrete hollow cylinder.
Civileng 01 00006 g004
Figure 5. Radial cracking of the concrete around the prestressing tendon.
Civileng 01 00006 g005
Figure 6. Tri-linear softening model for concrete in tension.
Civileng 01 00006 g006
Figure 7. Internal equilibrium of the partially cracked concrete section.
Civileng 01 00006 g007
Figure 8. Calculation procedure of the transmission length according to the implemented model.
Civileng 01 00006 g008
Figure 9. Experimental vs. theoretical transmission lengths for μ = 0.6.
Civileng 01 00006 g009
Figure 10. Comparison between experimental and theoretical concrete strain build-up profiles ( μ = 0.6) for specimen M12-H-C4-1; experimental results are derived from Oh et al., 2006.
Civileng 01 00006 g010
Figure 11. Analysis of the transmission length at the cut end of specimens “FC350-2” from Russell and Burns, 1996 (a) and “SS150-4” from Russell and Burns, 1997 (b) with μ = 0.6.
Civileng 01 00006 g011
Figure 12. Development of the radial cracking along the length of specimen M12-H-C4-1, μ = 0.6.
Civileng 01 00006 g012
Figure 13. Bond stress distribution along the transmission length of specimen M12-H-C4-1, evaluated with the TWC model ( μ = 0.6) and principal design codes.
Civileng 01 00006 g013
Table 1. Detail of the dataset of experimental transmission length values for model calibration: test specimens and authors.
Reference CitationNo. of Experimental Tests
Mitchell et al. (1993) [15]14
Russell and Burns (1996) [24]20
Russell and Burns (1997) [28]12
Oh and Kim (2000) [11]36
Oh et al. (2006) [16]24
Martì-Vargas et al. (2007) [29]12
Dang et al. (2017) [30]12
Table 2. Performance of the analytical TWC model for different friction coefficient values.
Friction CoefficientAVECOVRMSE
μ = 0.32.101.15755.57
μ = 0.41.620.67439.31
μ = 0.51.300.36232.72
μ = 0.61.070.18139.20
μ = 0.70.920.16154.16
μ = 0.80.810.23207.22
AVE = average ratio between theoretical and experimental values; COV = coefficient of variation; RMSE = root mean square error.

