Article

A Multipurpose Wearable Sensor-Based System for Weight Training

School of Mechatronic Systems Engineering, Simon Fraser University, Surrey, BC V3T 0A3, Canada
*
Author to whom correspondence should be addressed.
Automation 2022, 3(1), 132-152; https://doi.org/10.3390/automation3010007
Submission received: 10 December 2021 / Revised: 6 February 2022 / Accepted: 10 February 2022 / Published: 16 February 2022

Abstract

:
In recent years, there has been growing interest in automated tracking and detection of sports activities. Researchers have shown that providing activity information to individuals during their exercise routines can greatly help them in achieving their exercise goals. In particular, such information would help them to maximize workout efficiency and prevent overreaching and overtraining. This paper presents the development of a novel multipurpose wearable device for automatic weight detection, activity type recognition, and count repetition in sports activities such as weight training. The device monitors weights and activities by using an inertial measurement unit (IMU), an accelerometer, and three force sensors mounted in a glove, and classifies them by utilizing developed machine learning models. For weight detection purposes, different classifiers including Linear Discriminant Analysis (LDA), Support Vector Machine (SVM), and Multi-layer Perceptron Neural Networks (MLP) were investigated. For activity recognition, the K nearest neighbor (KNN), Decision Tree (DT), Random Forest (RF), and SVM models were trained and examined. Experimental results indicate that the SVM classifier can achieve the highest accuracy for weight detection whereas RF can outperform other classifiers for activity recognition. The results indicate feasibility of developing a wearable device that can provide in-situ accurate information regarding the lifted weight and activity type with minimum physical intervention.

1. Introduction

Weight training has been among the top 10 activities in fitness activities surveys since 2016 [1]. Researchers have demonstrated the extensive health benefits of weight training related to movement control, functional independence, increasing the cross-sectional areas of muscles and connective tissues [2,3,4], prevention and management of type 2 diabetes [5], and emotional well-being [6]. Advancements in network and sensor technologies have led to the emergence of sophisticated and user-friendly smart devices and wearables. Wearable devices in physical activity tracking are utilized for heart rate monitoring, measurement of calories, counting reps and sets, and activity recognition. Activity tracker devices such as bracelets, watches, and armbands assist trainees to achieve their goals by enabling the users to analyze and evaluate their daily performances.
Despite the benefits of weight training activities, many individuals do not adhere to the recommended levels of activities due to lack of motivation after a certain time from the starting of the exercise. Researchers have shown that automatic exercise tracking can significantly improve an individual’s motivation in maintaining their activity program [7,8]. Beside activity tracking, it is also critical to have control over the weights lifted during a workout session. The free weights carried by a user during weight training exercises exert certain forces on their palm, which can affect the musculature near the elbow, down to the fingertips. The imposed pressure can cause a variety of injuries when the weight is beyond the user’s fitness level. Thus, there is an essential need to develop a wearable platform that can autonomously recognize the type of activity and estimate the carried weight and number of repetitions.
Inertial measurement units (IMU) and force sensors have been utilized in recognizing and measuring activities such as walking, sleeping, standing, and cycling. However, weight training has received less attention. This may be partially due to the requirement for a large dataset, and a relatively smaller number of people doing weight training, in comparison to activities such as walking and running. In [9], the researchers explored different machine learning methods using smartwatch sensor data attached to participants’ arms to recognize and characterize cardio and weightlifting workouts along with non-workout activities and counting repetition. They utilized a two-stage classifier which automatically segments user’s activities, distinguishes workout activity from non-workout activity, and ultimately detects the type of workout. They used the naive peak detection algorithm to count repetitions. In another study conducted by Qi et al. [10], the authors utilized two accelerometers on the wrist and chest and an ECG electrode on the chest to gather data during three types of activities including aerobics, static postures, and 10 types of typical free weight movements. The framework is divided into two layers as follows: The first layer is based on the free weight, which is any weight that one can hold in their hand and work against gravity, such as dumbbells. The second layer is non-free weight, for instance an exercise machine. In the aforementioned study, a type of binary SVM, called OC-SVM, was applied in the first layer to separate free weight and non-free weight activities, whereas in the second layer, a Neural Network and Hidden Markov Model was adopted to classify the non-free-weight and free-weight activities, respectively. Their proposed system reached an accuracy of 90% in predicting the activity type. In the study conducted by Akpa et al. [11], a glove prototype was developed using 16 force-sensitive resistor (FSR) sensors on the palm to classify 10 types of gym activities and count repetitions. They developed decision tree, random forest, SVM, and KNN models for the classification study and assessed their performances with the common metrics. Their developed model demonstrated an average accuracy of 82% for activity tracking. An average counting error of 9.85% with a standard deviation of 1.38% with peak detection and elimination algorithm was the result of their developed solution for counting sport activities’ repetitions problem. Certain commercial products have appeared in the market for mobile health devices such as the “Apple HealthKit” and “Fitbit”, which exploit both wearable devices and smartphones. However, users have to start and stop activities manually since they are not able to segment and identify activities automatically. Other commercial products include ‘‘Strenx” by GymWatch, ‘‘PushBand” by PUSH, and ‘‘Wristband 2” by Atlas that provide feedback about used free weights; however, they require users to manually enter the weight they pick up. Entering weights manually is inconvenient. For instance, forgetting to change the weight for each exercise can result in inaccurate feedback. There exists a wide range of force transducers to extract information about force in different wearable device applications. Most of the sensors found in the literature belong to a sensor group which employs resistive polymer-thick-film (RPTF) technology such as force sensing resistors (FSR), Flexiforce® sensors, and other customized RPTF sensor arrays and matrixes [12]. For instance, in [13], an arm brace with eight FSR sensors was developed for a wearable to model gripping forces between zero to 20   N . The device identifies physiological changes that happen when weak muscular contractions take place. They achieved an average RMSE of 5.48   N with a deviation of 2.17   N . In [14], the authors introduced a new methodology using FSR sensors for controlling robotic prosthesis in practical settings such as Cybathlon competition. The accuracy improvement technique was based on dividing 11 different force grips. The final precision was reported as 89%. In [15], the researchers assessed lower limb movement such as thigh or ankle for gait detection using FSR technology. They were able to predict different walking modes and gait events from the thigh with high accuracy. FSR sensors have also been utilized in the study of automatic detection of dumbbell weights. In [16], a wristband was reported using piezoresistive sensors and an IMU sensor along with machine learning for the detection of three dumbbell weights 0.2 Ib , 3 Ib and 8 Ib . Participants were recruited and asked to perform bicep curl and hammer curl activities and their data were collected while performing those activities. An LDA classifier was used to detect the dumbbells’ weights while performing the activities. The model reached an average validation accuracy of 88%.
Although there have been several studies in the field of activity recognition and weight detection, there is a significant lack of capability for simultaneous recognition of weight and activity during exercise using a single smart device. Performing multiple analysis on a single glove reduces any discomfort due to using multiple wearable devices while providing more information for the user throughout the exercise without hindering activities. The repetition counting model uses the output of the activity recognition model and counts the peaks of the activities based on signals characteristics with high accuracy. The proposed platform consists of three integrated Flexiforce force sensors, an accelerometer, and an IMU mounted in the glove. Several mainstream machine learning methods were investigated, and their performances were assessed by evaluation metrics to obtain the most practical models for the designated applications. The automatic detection of free weights and activities can be a part of an advanced smart personal training system which can guide and monitor the trainees to pick up appropriate activities and dumbbell weights in the gym based on the skill levels and physical ability of their bodies. The system can also assist a personal trainer to monitor the trainee’s activities to prevent overreaching and any injuries caused by them. The latter is the main contribution of our work, where we developed a multitask wearable device, capable of identifying nine common weight training activities, counting the repetition of each activity, and detecting the weight lifted by the user. A block diagram of the developed system is represented in Figure 1. The system can instantly detect the magnitude of a weight that a user can hold in different orientations. The detection is not restricted to performing a specific activity, as required in other studies such as [16,17]. In particular, the activity recognition method can accurately recognize nine most common exercise types, including machine-based, upper body, and leg exercises, by using only a single IMU mounted in the wrist of a wearable glove. The recognition system is not restricted to upper body activities, which is a limitation of other studies (e.g., [18,19]).
The organization of this paper is as follows. In Section 2, the electrical components of the system are presented. Next, the sensor fabrication process including mechanical analysis and material selection is discussed, followed by experimental studies, data collection, processing, and feature extraction. Section 3 presents evaluation results. In Section 4, the results and achievements are discussed. Conclusions are presented in Section 5.

2. Methodology and System Description

2.1. Smart Glove Platform

Due to their low cost and compactness, we utilized force resistive sensors (FSR) for the measurement of grip force, pressure distribution, and weight detection in the proposed smart glove device. To this end, three FSR sensors (Flexiforce A401) were mounted on the glove’s palm, ring, and middle fingertips. Each sensor has an active sensing area with a diameter of 2.5   cm and thickness of 0.203   mm , which can sense forces up to 111   N . Depending on the orientation of the glove, the value of resistance corresponding to a given applied force varies considerably. An accelerometer (ADXL335) was utilized to measure hand orientations along with the force sensory data. An IMU unit (MPU 6050: low power/cost motion tracking device) was also placed in the glove to measure the wrist’s Euler angles for the activity recognition purpose. The data sampling and communication process was performed through Arduino Nano. An Adafruit Bluefruit LE module was utilized to transfer sensory data to BlufruitConnect mobile application developed by Adafruit. The Arduino board was powered up by a rechargeable 400 mA/h Li-Po battery. The proposed system is depicted in Figure 2.

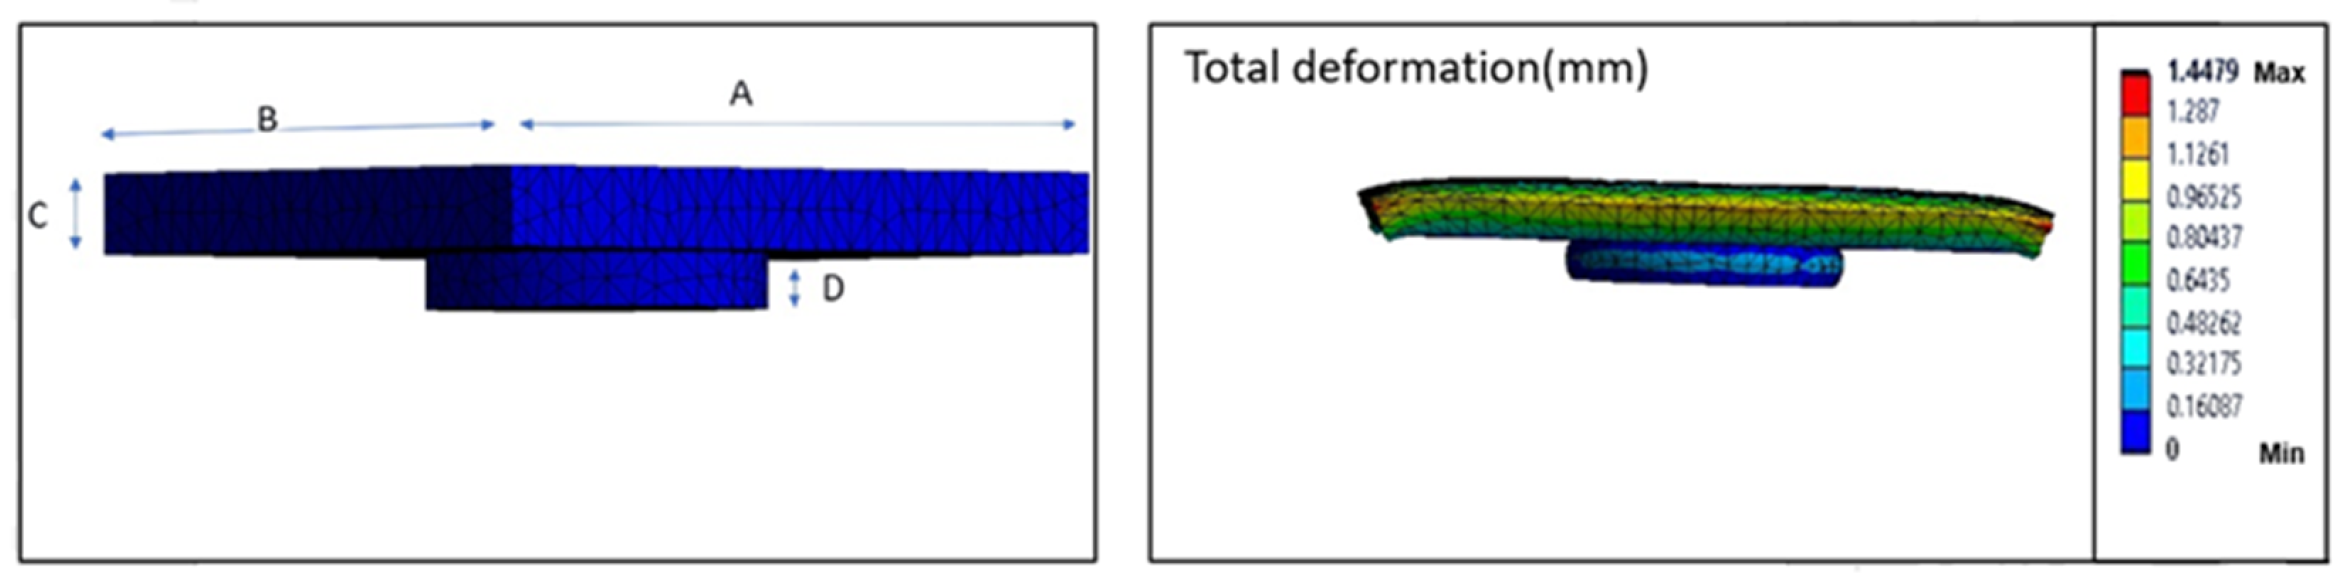
2.2. Sensor Fabrication

Placing the pressure sensor directly on the glove palm can flex the sensor and create certain problems, such as early failure. Thus, a silicon rubber substrate, built out of ECOFLEX 00-30, was utilized. A Finite Element Method (FEM) was used to find a practical size as depicted in Figure 3. The pressure sensor was then embedded inside, at the bottom of the substrate. The design contains an upper rectangular part and a lower base cylindrical part, as demonstrated in Figure 3. The substrate would allow forces to be distributed uniformly on the sensitive area of the sensor. When a dumbbell is placed on the rectangular part, force will be transferred through the cylindrical base to the active sensor area shown in Figure 4C. To meet the two major critical design factors for the substrate in terms of comfort and elasticity, the ECOFLEX 00-30 silicon rubber was utilized due to its hyper-elastic characteristic and widespread utilization in biomedical applications [20]. According to [21], inserting a tiny disc at the bottom of the sensor (in the body and device interface) can increase the accuracy of the sensor because the contact surface area will be increased. Thus, a tiny rubber disc with the same diameter as the sensor sensitive area was placed below the sensor to increase its accuracy. Prototype layers are illustrated in Figure 4.

2.3. Experimental Section

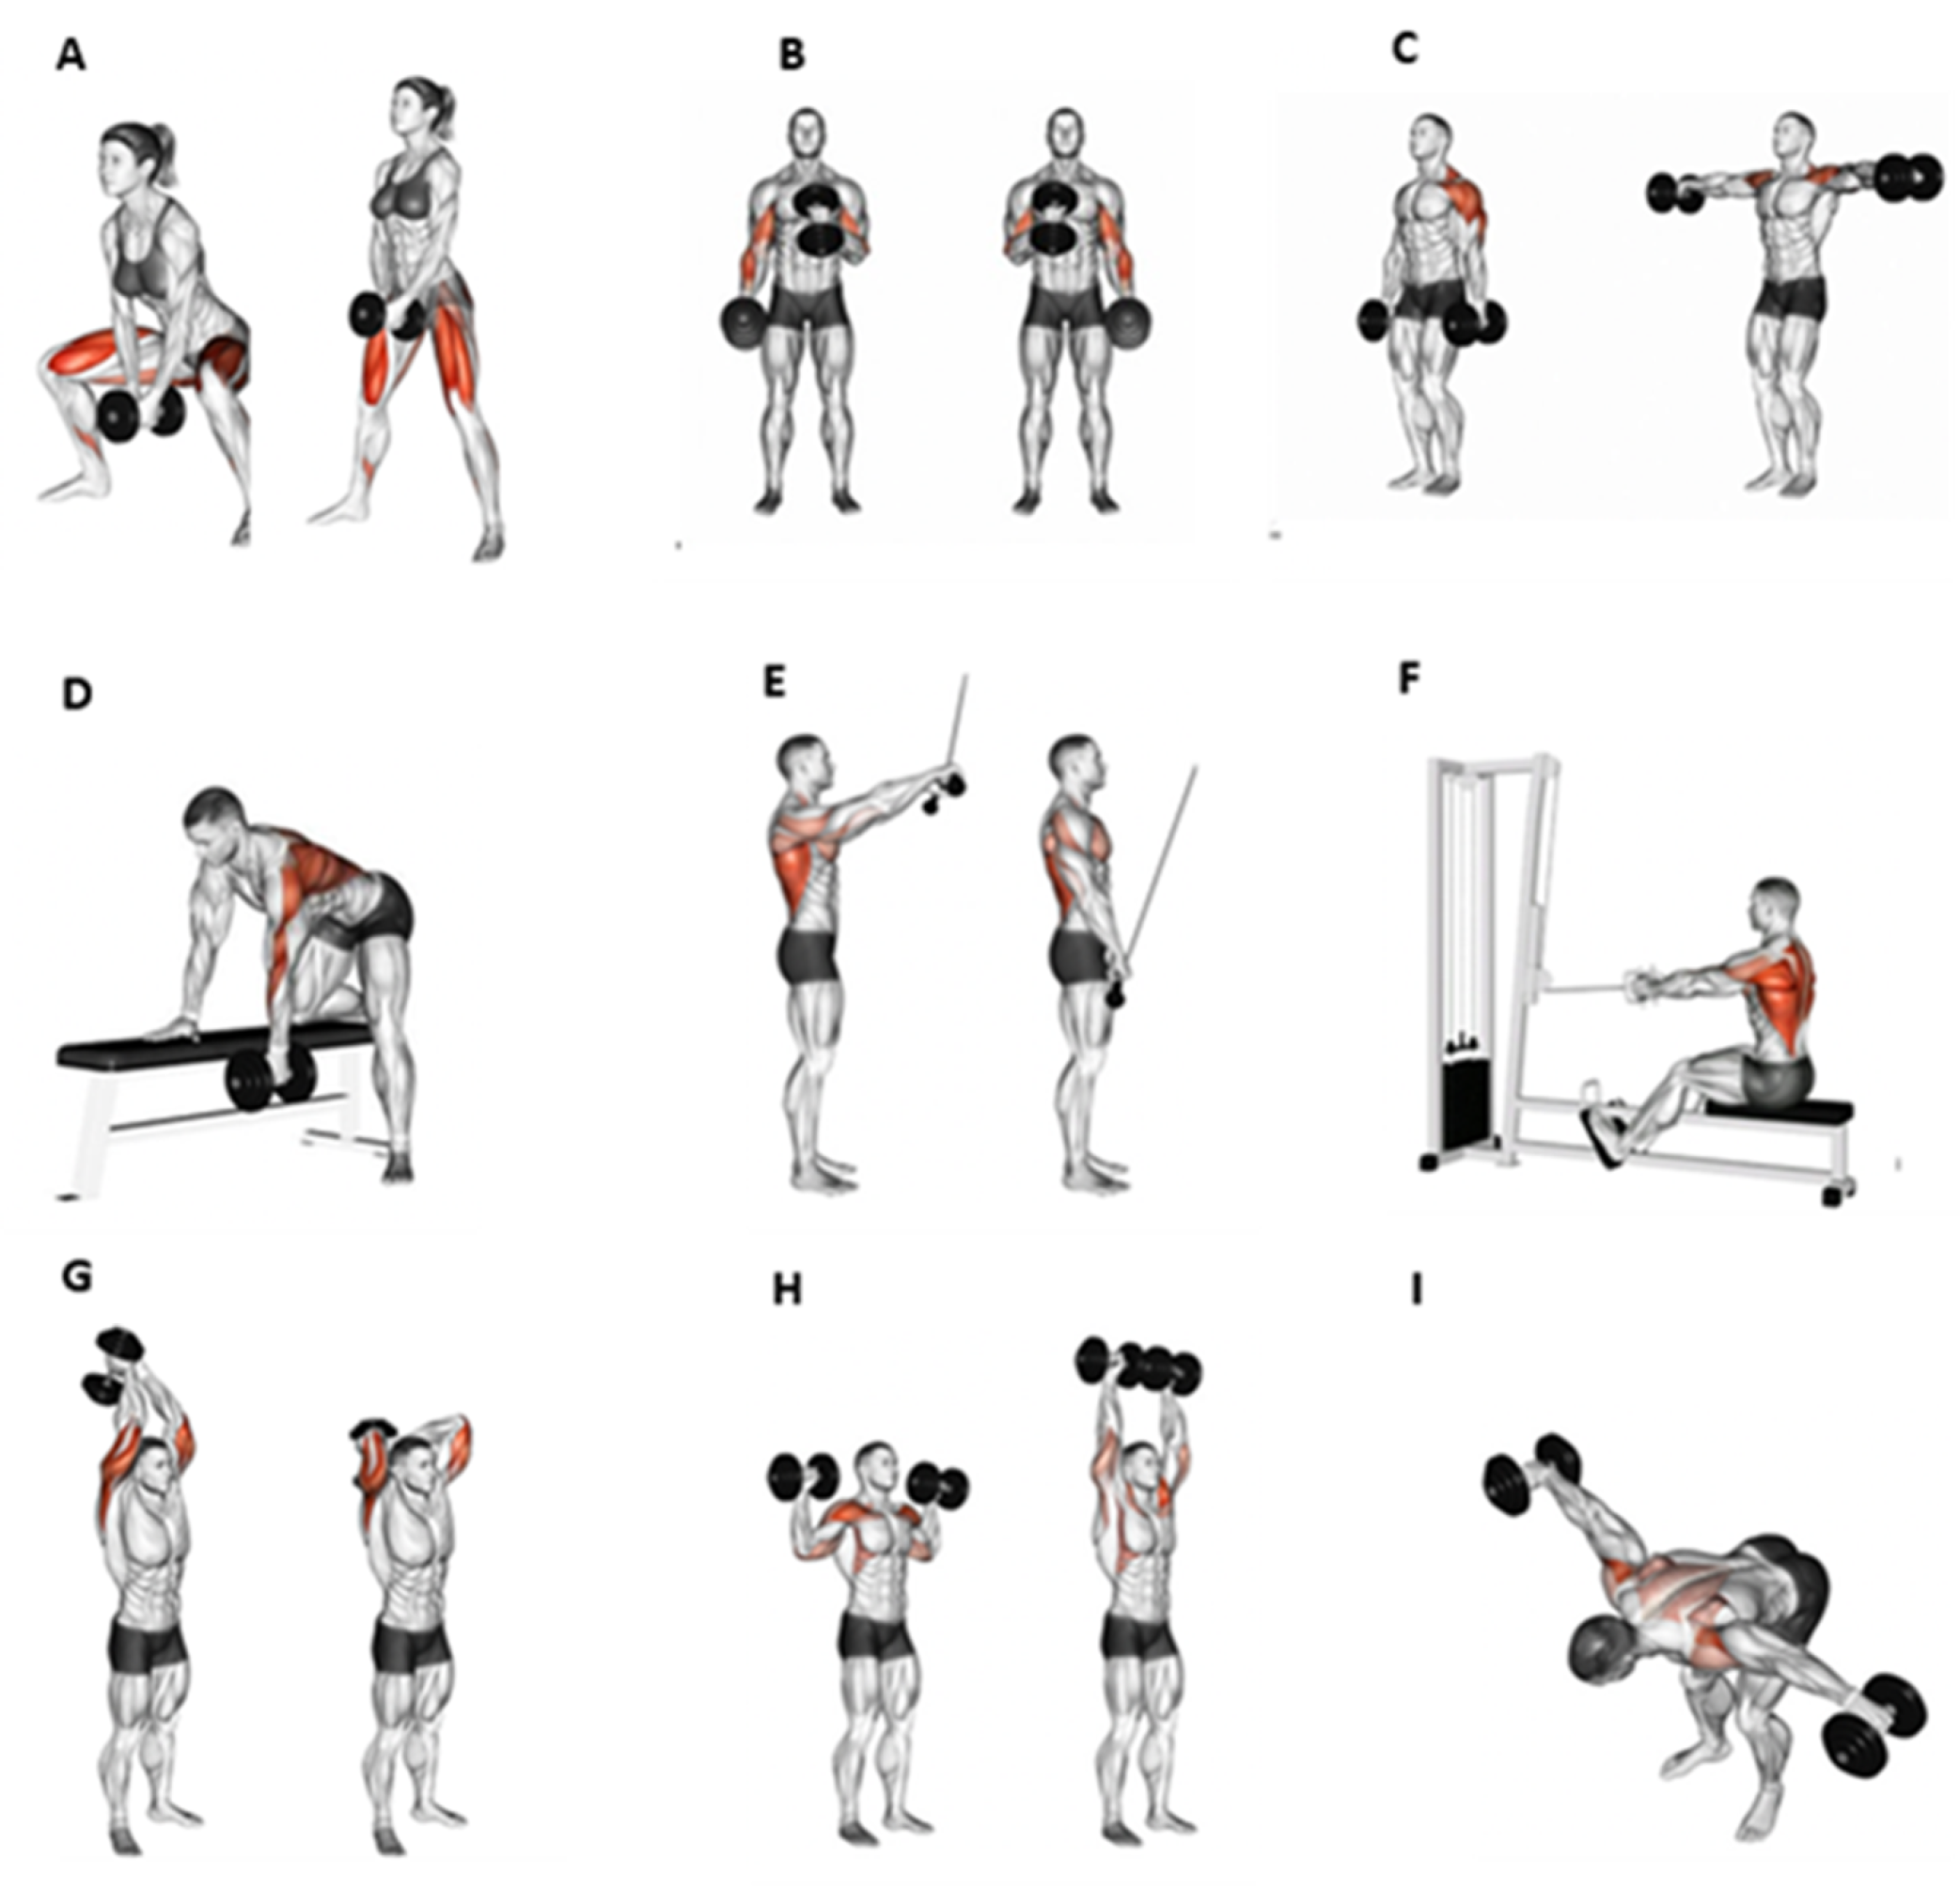
2.3.1. Experiments Overview

Two separate experiments were designed to acquire force and orientation data. The objective was to classify the activities, determine dumbbell weights, and obtain the counts for activity repetitions. A 1.5 h workout session experiment was considered for weight detection and activity recognition. Twelve healthy participants for the activity recognition study (five men and seven women) and six healthy participants for the weight detection study (two men and four women), in the 20–35 years old age group, were recruited to perform the designated activities. The activities for activity recognition were selected based on a personal trainer’s suggestion. These activities include common workouts targeting muscles, including shoulders, forearms, triceps, chest, legs, and abs, as depicted in Figure 5. Activities for weight detection were selected in a manner that could include most possible hand orientations, when using a dumbbell, to instantly detect a weight in motion (e.g., Figure 6). In both studies, activities with minimum possible of injuries are prioritized.

2.3.2. Experimental Procedure

Before starting any experiments, the participants were asked to provide an informed consent form. Next, the nine activities for the activity recognition and the two activities for weight detection were introduced to each group of the participants. Activity recognition tasks include standing triceps extension, standing dumbbell hammer curls, seated cable back rows, wide stance squat, overhead shoulder press, straight arm pullover, single arm dumbbell bench rows, dumbbell bent over raise, and side shoulder dumbbell raises (see Figure 5). The weight detection activities involved holding different dumbbells and rotating the hand in a way that roll and pitch angles vary from 0° to 180°. Three dumbbell weights were selected for the weight detection study, 2 Ib , 5 Ib and 8 Ib . By considering the capability of all the participants who were not experts in weight training exercises, a weight of 8 Ib was selected as the heaviest dumbbell. All the activities were performed for three sets of fifteen repetitions. The data corresponding to wrist and hand Euler angles and force sensors data were collected for activity detection and weight prediction, respectively, with sampling rate of 100   Hz through a mobile app. The data were then sent to the researcher’s computer after the experiment session was finished. All the experiments were performed based on a right-hand glove.

2.4. Fitness Activity Recognition Data Processing Methods

2.4.1. Preprocessing

Preprocessing of raw data is required to minimize the noise effects due to changes in the users’ behavior, movement, and environmental conditions [22,23]. Common noise-filtering methods include lowpass, moving average, and Kalman filters [24]. In our study, we utilized a Gaussian-smoothing filter for time series data, which is a slight variation of the moving average filter. In our study, the Gaussian-smoothing filter outperformed conventional moving average filter in reducing the effect of noise. The Gaussian smoothing filter is described by the following equations [25]:
      y t = i = t k t + k x i   g i
g = e 4 l n ( 2 ) t 2 w 2
In Equation (1), k is the number of data points in the filter kernel, t is time, x is the data point, and g is the Gaussian function. The w term shown in g (Equation (2)) is called full width at half maximum (FWHM). Considering the filter kernel as a gain function, this term shows the width of the function when gain is equal to half of the maximum. This parameter is particularly important when designing a Gaussian filter because it defines how much smoothing has to be applied to the signal. Another important factor in designing this filter is the number of data points in the filter kernel represented by k . Choosing an appropriate value for k requires two considerations: First, k should be sufficiently large so that the Gaussian function is close to zero on both sides and, secondly, k should be set to a value that does not make the filter kernel go too far from zero. This is because a too long filter can cause edge effects. In this research, the values of k and w were set to 40 and 25, respectively. The next step is to normalize g function values. Due to the high levels of noise in the Yaw sensor signals, this signal was taken away from the dataset and the designed noise elimination filter was just applied on Roll and Pitch sensor signals.

2.4.2. Segmentation

The reason for performing segmentation was to divide data into segments that share the same characteristics, known as time windows or sliding windows. Sliding window-based segmentation is often used to separate sensor signal data into meaningful subsequences over time. This process is a prerequisite for the feature extraction process. Each segment is analyzed over a time interval, or a sliding window, which can be fixed or variable in size. The window size should be set in a way to contain sufficient characteristics for recognition of a human activity at a given moment. Time windows can also be overlapping or non-overlapping. Overlapping means segments from the previous window intersect the samples from the next window. However, in non-overlapping segments, there is no intersection between each data subgroup. In this study, a non-overlapping sliding window with a fixed window size interval (2.5 s) was obtained empirically and further applied to the data for splitting into respective segments.

2.4.3. Feature Extraction

A feature is referred to as useful information that each data segment can provide. Features are quantitative measures which are extracted through the feature extraction process in either time or frequency domain. In this research, the feature extraction process was executed in the time domain with eight types of statistical features derived from both angles data segments, including the mean, root mean square, maximum, minimum, standard deviation, variance, skewness, and kurtosis. Sixteen different features were gathered in total from the two sensor signals for each workout.

2.4.4. Feature Selection

According to [26], feature selection is a more important step than classifier selection since choosing irrelevant and low-quality features can reduce the accuracy of the classifier. Moreover, having many features will increase the processing cost. To this end, the univariate feature selection algorithm from scikit-learn Python package was applied to the data to find the most relevant and high-quality features. The algorithm ranked the features based on the highest F-scores. Then, the top 10 features were selected to be fed into the machine learning classifiers.

2.5. Weight Prediction Data Processing Methods

Data Preprocessing and Feature Extraction

In the study of weight detection, the goal is to find the associated force sensor values with hand orientation. Once the sensors’ signals were collected, a moving average filter with a window size of 50 was applied to the data to smoothen the signals and eliminate noise. The magnitudes of force signals associated with each hand orientation were then identified and stored in a data frame (see Figure 7). The mean values of all the three force sensors were computed and added to the data frame to contain more features for the machine learning models. The final data frame consisted of the magnitude of the three sensors, their mean value, and their corresponding pitch and roll angles, which were fed into the models.

2.6. Classification

2.6.1. Activity Recognition

Four mostly used supervised classification models in activity recognition problems, the k-nearest neighbours (KNN), decision tree (DT), support vector machine (SVM), and random forest (RF) [24,27,28], were generated using Sklearn package in Python and their performances were investigated. The decision tree model creates a tree-like structure for prediction purposes. A decision tree starts by analyzing the whole dataset and then it splits it into subgroups, or features, called nodes. The algorithm splits the nodes with the most informative features using a measure. The Gini index measure was used to develop the algorithm in this study. The internal hyperparameters of the model such as minimum number of split and the maximum depth of the tree were gained by grid search method. The k-nearest neighbours is a simple machine learning method that does not require any learning. This model stores all the dataset and classifies a new observation based on a similarity measure between the new observed data and its k-nearest neighbors. The Euclidean distance based KNN model was trained to determine the similarity of the data points and the k hyperparameter was obtained empirically. The SVM algorithm is based on defining optimal hyperplanes, called decision boundaries, among classes of features to make them separable so that future observations can be identified along with their respective classes. The SVM method uses kernel tricks to create decision boundaries among classes. In this study, the Radial Basis Gaussian (RBF) kernel function was chosen for the SVM. The internal parameters of the SVM (i.e., C and Gamma) were optimized using grid search. The Random Forest machine learning method is an ensemble learning method based on bootstrap aggregating, or bagging, to a set of weak learners to achieve better predictive performance. The weak, or base, learners that RF utilizes is based on decision tree models, which can suffer from overfitting. In the bagging technique, random samples of data with replacement were selected repeatedly from the training set and the decision tree model are fitted to these samples. After training the classification model, a new observant is classified by taking a majority vote from the outputs generated from the trees. The optimal number of trees, maximum depth of the tress, and the number of splits were obtained empirically for this model.
About 70% of the data was considered as the training set and the remaining 30% as a test set. A 10-fold cross validation method was used, in which data was split into 90% for the training set, and 10% as the validation set. A 10-fold cross validation method was applied to avoid overfitting and to assess the performance of the developed machine learning on new subsets of data. The averaged accuracy of cross validation method indicated the overall accuracy of the model. The classifiers performances were also compared and assessed using precision, recall, and f scores to find the most practical model in this application.

2.6.2. Weight Prediction

Three mainstream classification algorithms, Linear Discriminant Analysis (LDA), Support Vector Machine (SVM), and Multilayer Perceptron Neural Network (MLP) have been widely used in force study analysis to classify dumbbell’s weights [29,30,31]. Some 70% of the data were used as the training set to develop the models and the remaining 30% as the test set for investigating the models’ performances. The LDA classifier, based on Fisher discriminant criterion, was developed by using the Sklearn package in Python. This classifier seeks a linear combination of inputs to characterize different classes based on different distributions and form a decision boundary between them. The SVM classifier and MLP were also developed with the Sklearn package in Python. The Radial Basis Gaussian (RBF) kernel function was chosen again to develop an SVM model. The internal parameters of the SVM (i.e., C and Gamma) were optimized by performing grid search. Due to the superiority of artificial neural networks in modeling the extremely complex functions and data relationships, the MLP consisted of two hidden layers with 10 and 4 neurons, respectively, with the Relu activation function and ADAM solver. A 10-fold cross validation method was applied to the data that was split into 90% for training and 10% for validation. The accuracy of the model was then determined out of the average of accuracies of the 10-fold cross validated models. Evaluation metrics such as precision, recall, and f-score were determined to select the feasible classifier in this application.

2.7. Evaluation Metrics

To assess a machine learning model functionality, evaluation metrics are required to quantify its predictive performance. Selecting a practical model for an application is highly dependent on these quantities. There are standard evaluation metrics that are utilized widely to evaluate classifiers such as accuracy, precision, recall, and F-score. Referring to Equation (3), accuracy is a measurement that determines the number of correct predictions out of the total number of the predictions. Two other important factors besides accuracy are precision and recall. Precision (Equation (4)) measures the fraction of samples assigned to the positive class that belong to the positive class while recall (Equation (5)) represents how well the prediction of positive class has been performed. In addition, these two factors reflect the performance of the model in false positive and false negative predictions. It can be seen from Equation (4) that the smaller number of false positive predictions results in the higher value of the precision metric and Equation (5) shows that a smaller number of false negative predictions results in a higher value of recall metric. Precision and recall metrics can be combined together to make a single metric that can balance both scores. This single metric is called F-score. Equation (6) indicates that a higher value of recall and precision will lead to a higher value of F-score. It can be concluded that a model which has the highest values of evaluation metrics can be selected for prediction application. The Confusion Matrix is another type of evaluation metrics which compares the real target values with the predicted target values by the ML model in a N × N matrix, where N is the number of classes. The performance of the developed models in this study are evaluated in the following section.
    A c c u r a c y = N u m b e r   o f   c o r r e c t   p r e d i c t i o n s   T o t a l   n u m b e r   o f   p r e d i c t i o n s
P r e c i s i o n = T r u e   p o s i t i v e   T r u e   p o s i t i v e + F a l s e   p o s i t i v e
R e c a l l = T r u e   P o s i t i v e T r u e   P o s i t i v e + F a l s e   n e g a t i v e
F 1 = 2 × P r e c i s i o n ×   R e c a l l P r e c i s i o n + R e c a l l  

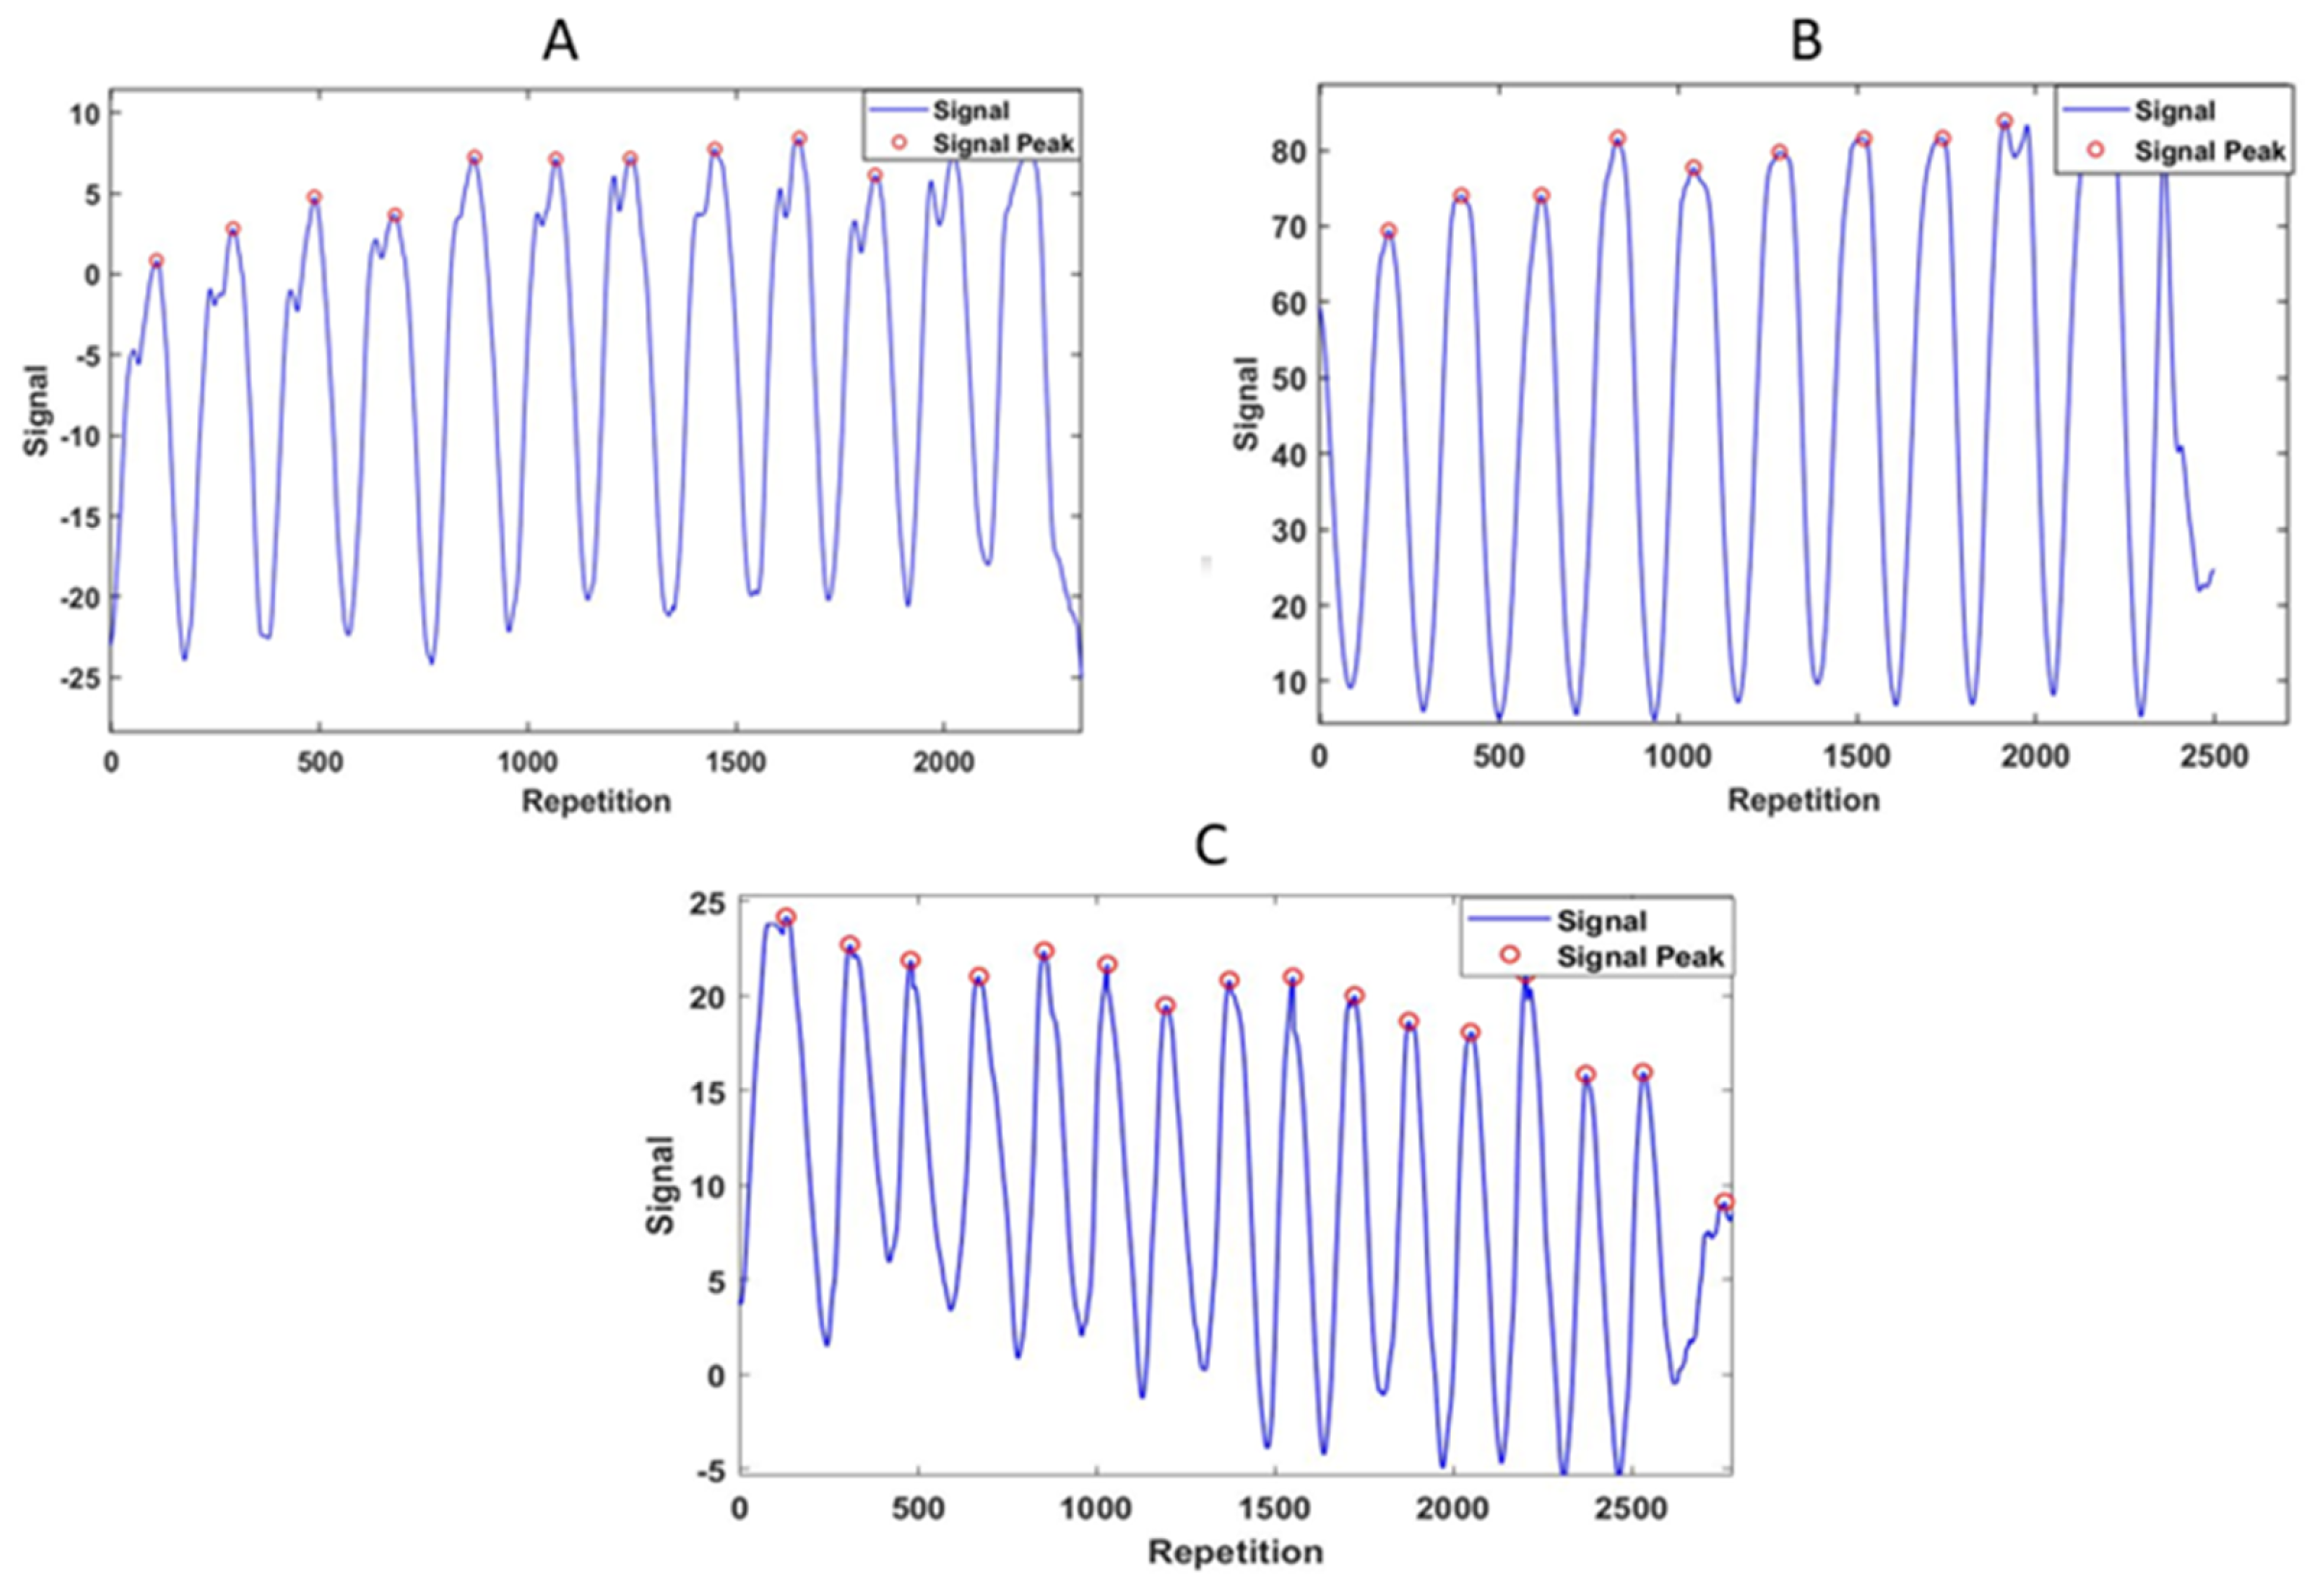
2.8. Count Repetition Algorithm

For precise repetition counting, the peak detection algorithm was used in which initially the type of sport activity was detected from the ML model. The signal peak values of each activity were counted based on their minimum peak height, minimum peak distance, and signal width and height range characteristics. The plots for the repetition counting model for certain sports repetitions are presented in Figure 8.

3. Results

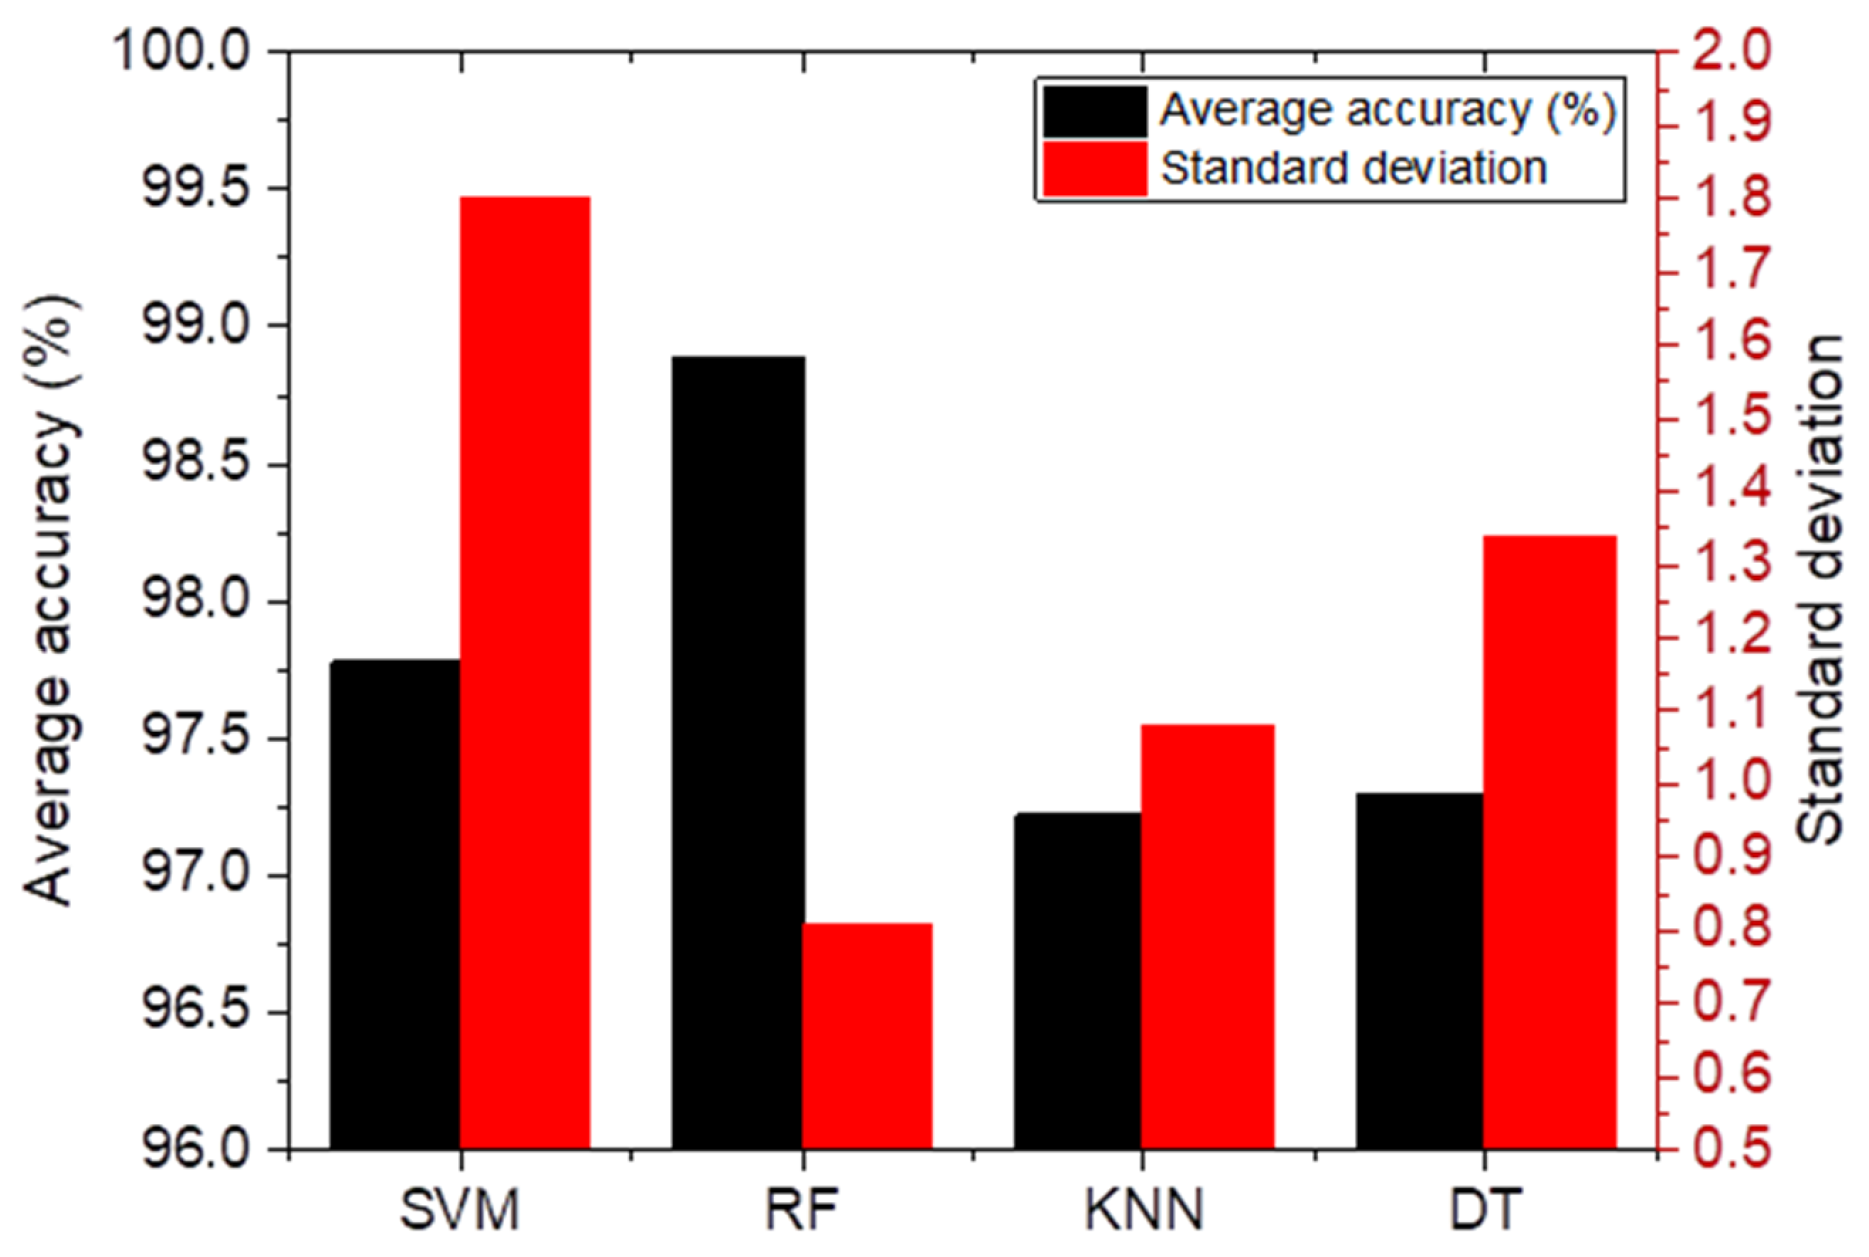
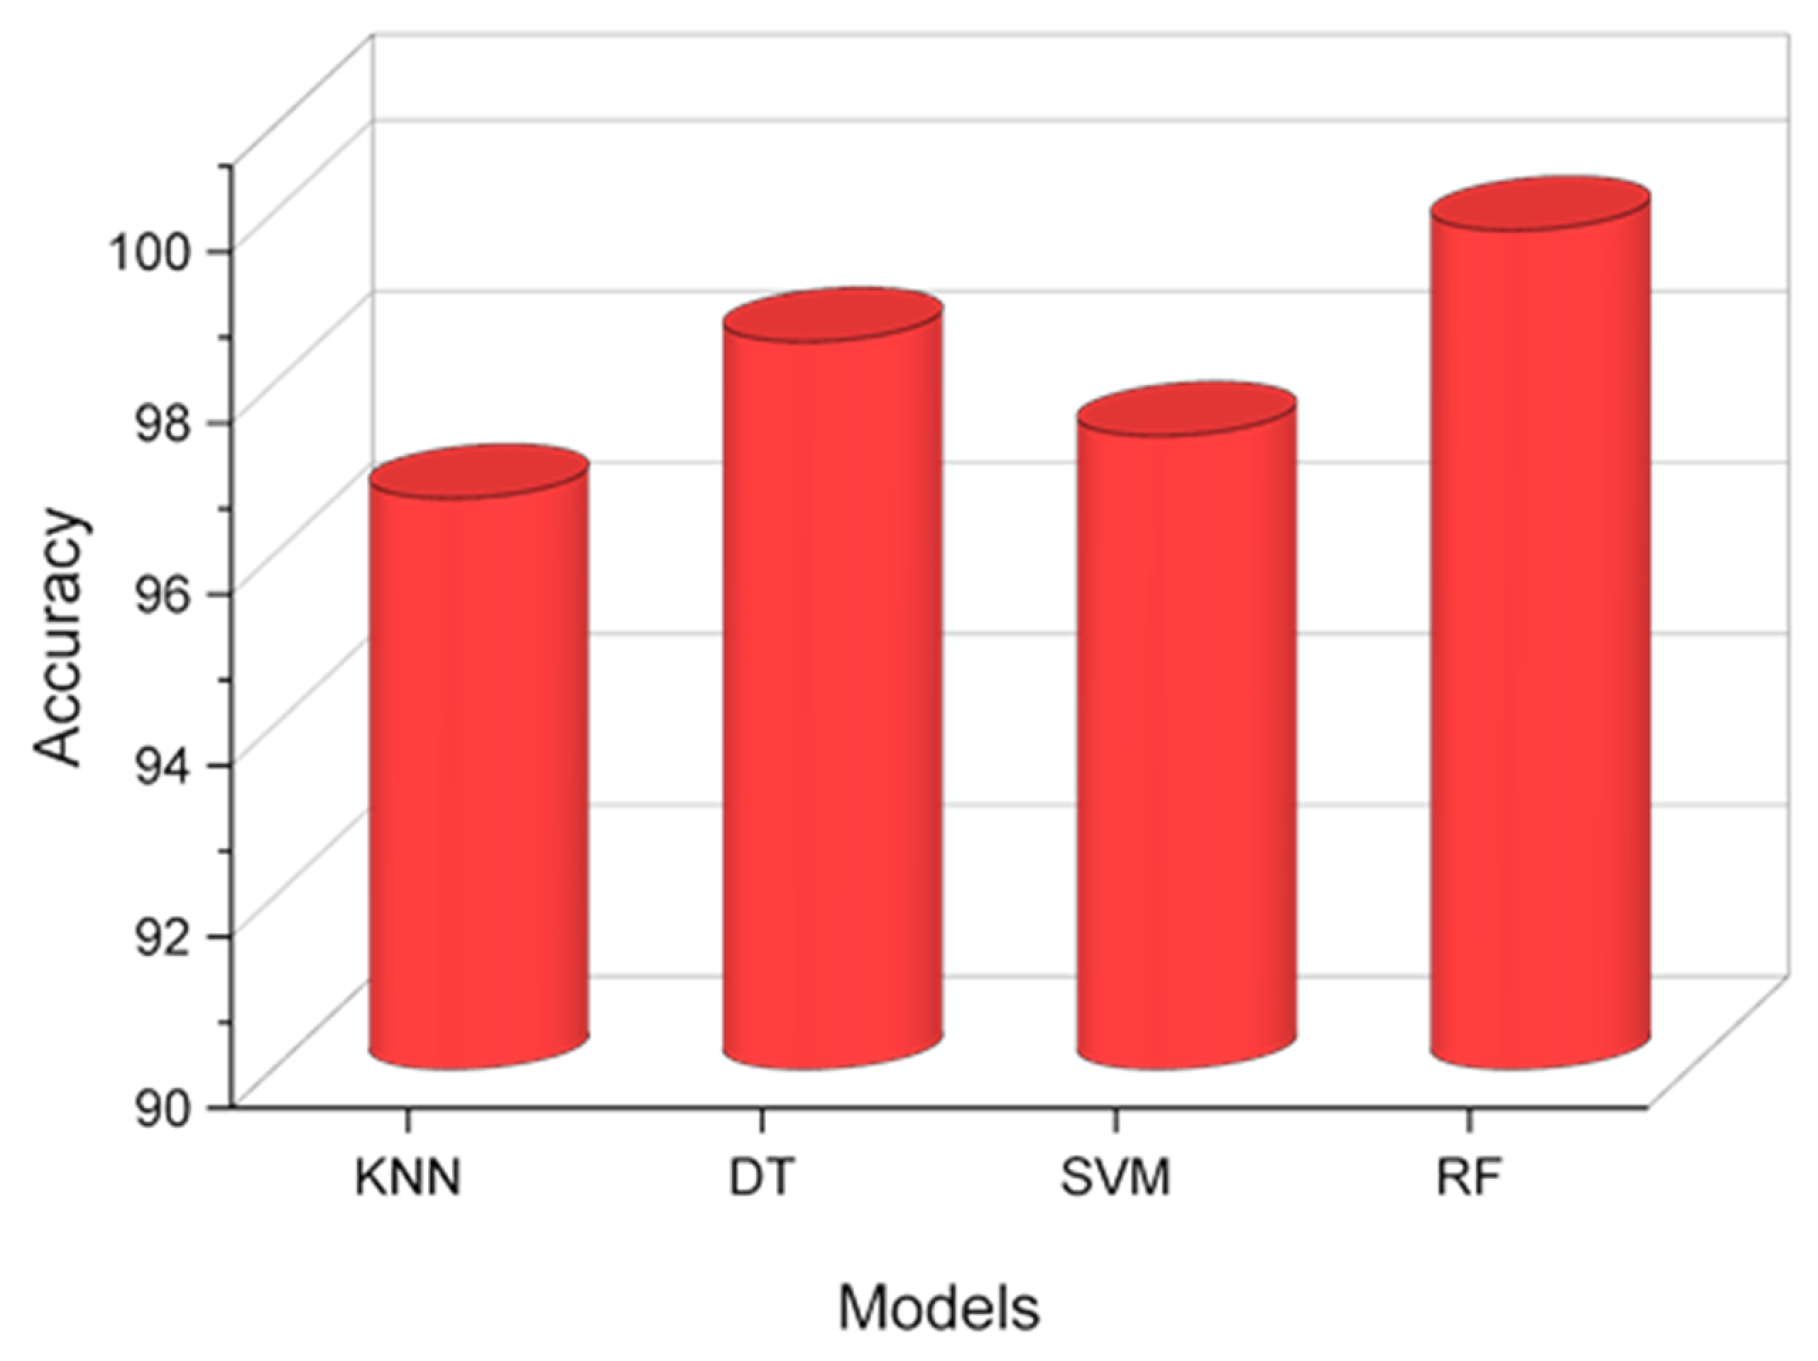
3.1. Activity Recognition

The performance of classifiers was evaluated and validated using a 10-fold cross validation algorithm. The average values of accuracies, precisions, recalls, and F-scores were determined from cross validated models. As represented in Figure 9 and Figure 10, the random forest model can make the most accurate prediction with the highest values of accuracy, precision, recall, and F-score. It can be observed that, although SVM and DT classifiers have reached higher accuracies than the KNN model, these models have lower recall values. This results in higher numbers of false negative predictions. The high value of false negative can have a significant negative influence on machine learning performance and should be considered as one of the major criteria in model selection.
Figure 11 shows that certain sports such as seated cable back rows, shoulder press, and triceps can be recognized by all the developed models accurately while an activity such as pullover is not easy to be identified, even with the most accurately developed models such as random forest. Moreover, it can be observed that SVM, KNN, and DT models have difficulties in distinguishing two similar activities, dumbbell bent over, and side shoulder raises. However, the random forest model can recognize dumbbell bent over and side shoulder raises without any error. The overall accuracies of the models over test data are illustrated in Figure 12. As this figure expresses, the KNN model demonstrated the least accuracy, while Rf reached the highest score.

3.2. Repetition Counting

By selecting the RF model for activity recognition application, repetition counting was developed in the next step. This algorithm finds the signal peaks based on the signal characteristics of a specific sport activity. In the first step, RF detects the activity type and sends the class label of the activity to the repetition counting algorithm. Then the algorithm searches for the peaks. This technique was able to find activity repetitions with overall average accuracy of 96% over all types of sports. As illustrated in Figure 13, the algorithm has a weak performance in finding the repetitions of arm bench rows and pullover and great performance in finding the peaks of the other sport activities.

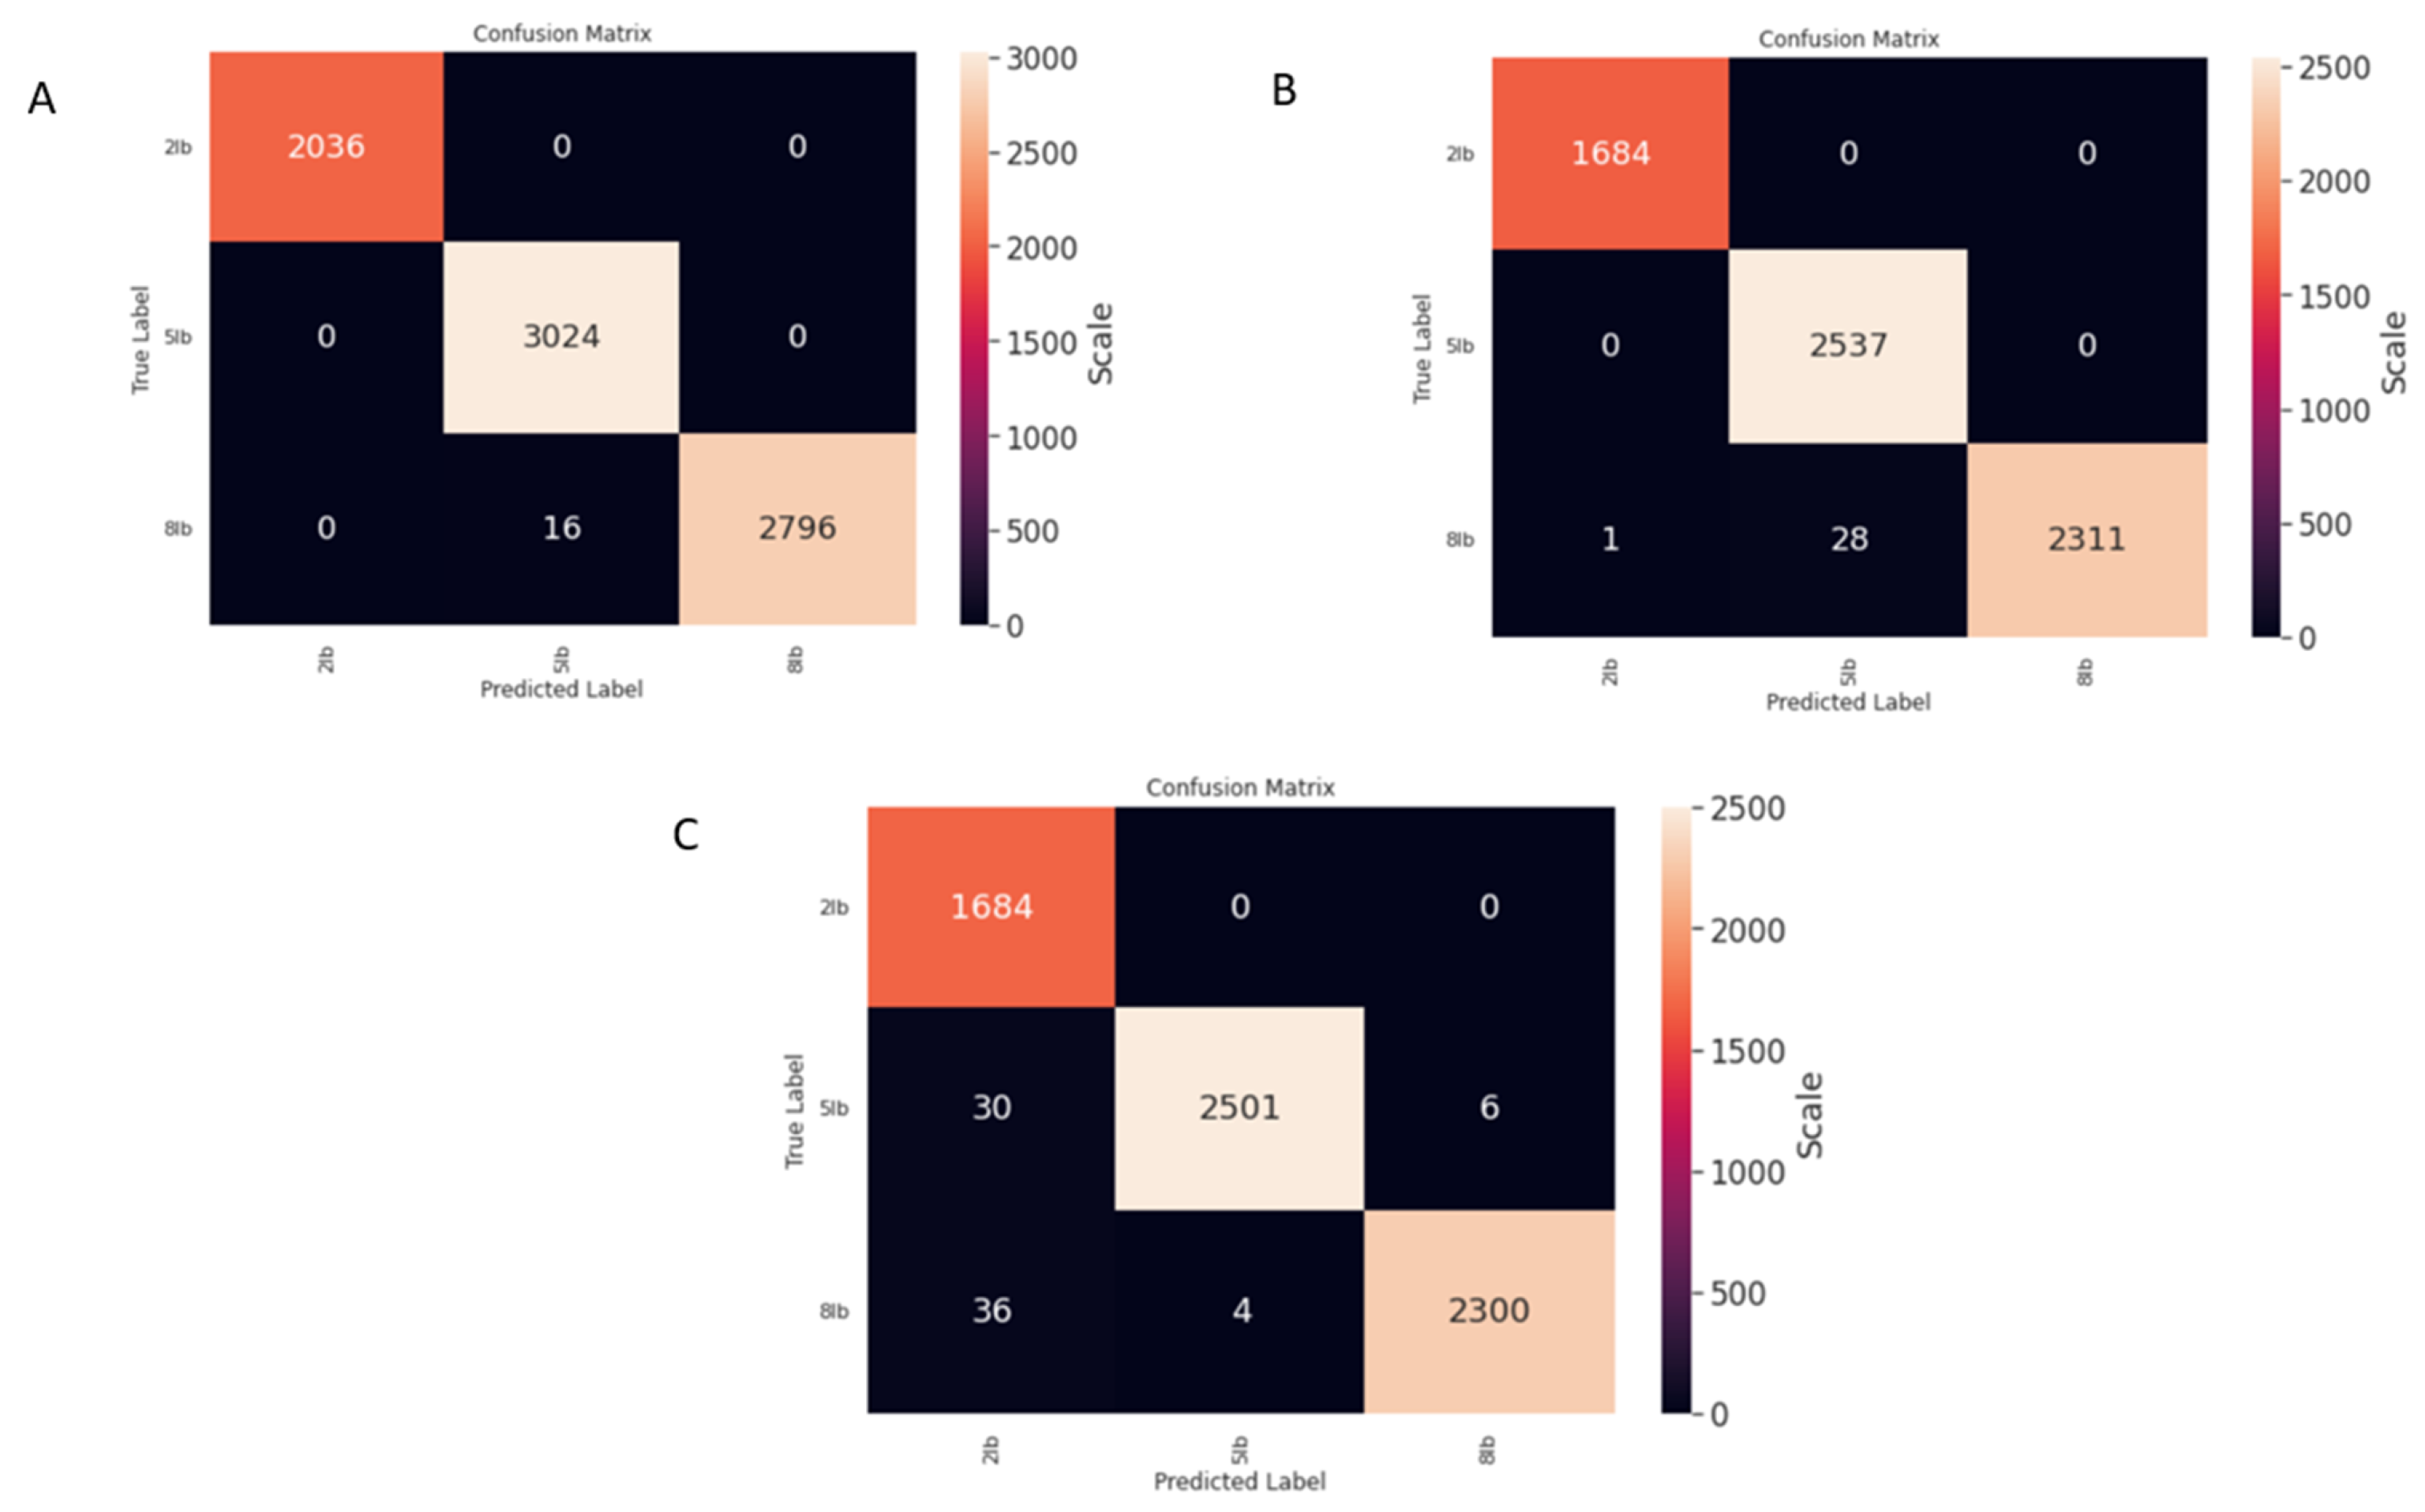
3.3. Weight Prediction

The average of accuracy, recall, precision, and F-score of the models obtained from the 10-fold cross validation method over training data are represented in Figure 14 and Figure 15. As demonstrated in Figure 14, all of the models reached high accuracies with low standard deviations. The averaged accuracy of the MLP and SVM models over training data are quite the same but they have slightly higher accuracies in recognition of the different free weights than the LDA model. As Figure 15 illustrates, all of the models have high values of precisions, recalls, and f-scores. Since all the models can perform well in this study, we observed the performances of the models on a test set to assess if our models overfit.
The performances of different methods over test data are shown in Figure 16 and Figure 17. The MLP and SVM models have reached higher accuracies when compared to the LDA model over the test dataset. It can also be seen that the SVM model accuracy of 99.8% is slightly higher than MLP model accuracy of 99.6%. The confusion matrices of the models show that all the models have difficulties in recognizing 8   Ib dumbbell. The LDA confusion matrix illustrates that this model has the highest misclassification error in detecting 2   Ib in comparison with other weights. Overall, all the performances of all models in this study were significant and did not have considerable differences in detecting any weights. As a result, the LDA model was selected for this part of study since it is very simple and computationally efficient when compared to models such as SVM and MLP.

4. Discussion

The proposed device utilizes two machine learning models, namely LDA and RF, for automatic weight detection and activity recognition applications. These models achieved high accuracy and promising results. In this section, we provide suggestions for improvements of the feedback and sensory system in future works.

4.1. Sensing Scope and System Generalization

Although the proposed glove system can detect diverse types of workouts for upper bodies, back, chest, and leg, certain exercises cannot be sensed on using a single IMU on the wrist. We argue that incorporating the employed force sensors for the activity recognition problem can be utilized in a variety of workouts. The developed system can very well distinguish between the selected weights. However, to expand the range of the study and include more types of free weights, other types of sensors may be used (e.g., EMG) to increase the amount of useful data. To increase the sample size and include more data for real-life scenario applications, an incremental learning algorithm can be utilized in which the learning processes is continuously taking place. This algorithm can compensate the small number of samples in the training process. This device can be generalized to detect activities and weights in other sport applications, such as rock climbing, racket sports, and rehabilitation activities.

4.2. User Feedback System

A mobile application with an interactive GUI for the proposed wearable is required that can obtain information from users about their fitness level, body mass index (BMI), and any injuries. Based on the information, the application would prepare a personalized workout plan. This system will then monitor users to check if they are following their plans and provide feedback accordingly. For example, if someone is lifting a dumbbell weight which is beyond their level of readiness, the system notifies them about the consequences. With this mobile application, users are also able to check out their performances and maintain their workout routines. Having this type of system will eventually reduce the risk of injuries, avoid overtraining, and increase efficiency.

4.3. Quality Assesment

Studies have shown that incorrect ways to perform weight training activities can be ineffective, or cause injuries in some cases. There exist different metrics for assessment of the workout’s quality [32]. These assessments have been excluded in this study due to the scope of the project.

5. Conclusions

Current wearable devices mostly focus on daily activities for monitoring and caloric measurement. They cannot provide information and feedback regarding weights lifted during the workouts or monitor activities throughout the exercise automatically. In this study, we introduced a novel multifunctional wearable sensor-based platform for automatic recognition of weight training activities, weights lifted during training, and the number of repetitions of different activities. The main goal of this paper is to assist individuals in maximizing performance progress, efficiency, and avoid overtraining and overreaching by providing feedback in weight training activity. To this end, machine learning algorithms were studied, including random forest, k-nearest neighbors, support vector machine, and decision tree. Three classifiers, including support vector machine, neural network, and linear discriminant analysis were assessed for the weight detection objective. The classifiers were compared and evaluated by evaluation metrics, accuracy, recall, precision and f-score, for both the training and test data. In the activity recognition study, the random forest method outperformed other classifiers with an average accuracy of 98.89% over 10-fold cross validated models, and 99.8% accuracy over test data. In the weight detection study, all the developed models performed with high accuracies of around 98%. Although the SVM model outperformed other classifiers, we selected the LDA model for this application with 98.6% accuracy, over 10-fold cross validated models, and 98.8% accuracy, over test data, due to its simplicity and low computation cost, compared to the rest of the classifiers. The repetitions counting model based on peak finding algorithm reached an average accuracy of 96% over all the exercises.

Author Contributions

Data curation, P.B.; Funding acquisition, M.M.; Investigation, P.B.; Methodology, P.B.; Project administration, M.M.; Software, P.B.; Supervision, M.M. All authors have read and agreed to the published version of the manuscript.

Funding

This research was funded by MITACS under the Accelerate program.

Institutional Review Board Statement

The study was conducted according to the guidelines of the Simon Fraser University and approved by the Ethics Committee of the Simon Fraser University (Ethics number 30000458).

Informed Consent Statement

Informed consent was obtained from all subjects involved in this study.

Data Availability Statement

Datasets and original images are available from the corresponding author on request.

Conflicts of Interest

The authors declare no conflict of interest.

References

  1. Thompson, W.R. Worldwide Survey of Fitness Trends for 2021 Apply It! 2020. Available online: www.acsm-healthfitness.org(accessed on 9 December 2021).
  2. Bennie, J.A.; Shakespear-Druery, J.; de Cocker, K. Muscle-strengthening Exercise Epidemiology: A New Frontier in Chronic Disease Prevention. Sports Med. Open 2020, 6, 1. [Google Scholar] [CrossRef] [PubMed]
  3. Kraemer, W.J.; Ratamess, N.A.; French, D.N. Resistance Training for Health and Performance. Curr. Sports Med. Rep. 2002, 1, 165–171. [Google Scholar] [CrossRef]
  4. Winett, R.A.; Carpinelli, R.N. Potential health-related benefits of resistance training. Prev. Med. 2001, 33, 503–513. [Google Scholar] [CrossRef] [PubMed]
  5. Westcott, W.L. Resistance Training is Medicine: Effects of Strength Training on Health. 2012. Available online: http://journals.lww.com/acsm-csmr (accessed on 9 December 2021).
  6. Tucker, L.A.; Maxwell, K. Effects of Weight Training on the Emotional Well-Being and Body Image of Females: Predictors of Greatest Benefit. Am. J. Health Promot. 1992, 6, 5. [Google Scholar] [CrossRef] [PubMed]
  7. Bravata, D.M.; Smith-Spangler, C.; Sundaram, V.; Gienger, A.L.; Lin, N.; Lewis, R.; Stave, C.D.; Olkin, I.; Sirard, J.R. Using Pedometers to Increase Physical Activity and Improve Health: A systematic review. J. Am. Med. Assoc. 2007, 298, 2296–2304. [Google Scholar] [CrossRef] [PubMed]
  8. Merom, D.; Rissel, C.; Phongsavan, P.; Smith, B.J.; Van Kemenade, C.; Brown, W.J.; Bauman, A.E.; Smith, B. Promoting Walking with Pedometers in the Community The Step-by-Step Trial. Am. J. Prev. Med. 2007, 32, 290–297. [Google Scholar] [CrossRef]
  9. Shen, C.; Ho, B.-J.; Srivastava, M. MiLift: Efficient Smartwatch-Based Workout Tracking Using Automatic Segmentation. IEEE Trans. Mob. Comput. 2017, 17, 1609–1622. [Google Scholar] [CrossRef]
  10. Qi, J.; Yang, P.; Hanneghan, M.; Tang, S.; Zhou, B. A Hybrid Hierarchical Framework for Gym Physical Activity Recognition and Measurement Using Wearable Sensors. IEEE Internet Things J. 2019, 6, 1384–1393. [Google Scholar] [CrossRef] [Green Version]
  11. Akpa, A.H.E.; Fujiwara, M.; Suwa, H.; Arakawa, Y.; Yasumoto, K. A Smart Glove to Track Fitness Exercises by Reading Hand Palm. J. Sens. 2019, 2019, 1–19. [Google Scholar] [CrossRef] [Green Version]
  12. Xiao, Z.G.; Menon, C. A Review of Force Myography Research and Development. Sensors 2019, 19, 4557. [Google Scholar] [CrossRef] [Green Version]
  13. Stefanou, T.; Chance, G.; Assaf, T.; Lenz, A.; Dogramadzi, S. Wearable Tactile Sensor Brace for Motion Intent Recognition in Upper-Limb Rehabilitation. In Proceedings of the 2018 7th IEEE International Conference on Biomedical Robotics and Biomechatronics, Enschede, The Netherlands, 26–29 August 2018. [Google Scholar]
  14. Ahmadizadeh, C.; Merhi, L.-K.; Pousett, B.; Sangha, S.; Menon, C. Toward Intuitive Prosthetic Control: Solving Common Issues Using Force Myography, Surface Electromyography, and Pattern Recognition in a Pilot Case Study. IEEE Robot. Autom. Mag. 2017, 24, 102–111. [Google Scholar] [CrossRef]
  15. Godiyal, A.K.; Mondal, M.; Joshi, S.D.; Joshi, D. Force Myography Based Novel Strategy for Locomotion Classification. IEEE Trans. Hum. Mach. Syst. 2018, 48, 648–657. [Google Scholar] [CrossRef]
  16. Xiao, Z.G.; Menon, C. Does force myography recorded at the wrist correlate to resistance load levels during bicep curls? J. Biomech. 2018, 83, 310–314. [Google Scholar] [CrossRef] [PubMed]
  17. Lim, C.G.; Tsai, C.Y.; Chen, M.Y. MuscleSense: Exploring weight sensing using wearable surface electromyography (sEMG). In Proceedings of the TEI 2020—Proceedings of the 14th International Conference on Tangible, Embedded, and Embodied Interaction, New York, NY, USA, 9–12 February 2020; pp. 255–263. [Google Scholar] [CrossRef] [Green Version]
  18. Farrokhi, A.; Rezazadeh, J.; Farahbakhsh, R.; Ayoade, J. A Decision Tree-Based Smart Fitness Framework in IoT. SN Comput. Sci. 2021, 3, 1–10. [Google Scholar] [CrossRef]
  19. Velloso, E.; Bulling, A.; Gellersen, H.; Ugulino, W.; Fuks, H. Qualitative Activity Recognition of Weight Lifting Exercises. In Proceedings of the AH’13: 4th Augmented Human International Conference, Stuttgart, Germany, 7–8 March 2013. [Google Scholar]
  20. Wang, X.; Liu, Z.; Zhang, T. Flexible Sensing Electronics for Wearable/Attachable Health Monitoring. Small 2017, 13, 2790. [Google Scholar] [CrossRef]
  21. Likitlersuang, J.; Leineweber, M.J.; Andrysek, J. Evaluating and improving the performance of thin film force sensors within body and device interfaces. Med. Eng. Phys. 2017, 48, 206–211. [Google Scholar] [CrossRef]
  22. Bashar, S.K.; Al Fahim, A.; Chon, K.H. Smartphone Based Human Activity Recognition with Feature Selection and Dense Neural Network. In Proceedings of the 2020 42nd Annual International Conference of the IEEE Engineering in Medicine & Biology Society (EMBC), Montreal, QC, Canada, 20–24 July 2020. [Google Scholar] [CrossRef]
  23. Lima, W.S.; Souto, E.; El-Khatib, K.; Jalali, R.; Gama, J. Human activity recognition using inertial sensors in a smartphone: An overview. Sensors 2019, 19, 3213. [Google Scholar] [CrossRef] [Green Version]
  24. Figo, D.; Diniz, P.C.; Ferreira, D.R.; Cardoso, J.M.P. Preprocessing techniques for context recognition from accelerometer data. Pers. Ubiquitous Comput. 2010, 14, 645–662. [Google Scholar] [CrossRef]
  25. Chatfield, C. The Analysis of Time Series: An Introduction, 6th ed.; CRC Press: New York, NY, USA, 2003. [Google Scholar]
  26. Khusainov, R.; Azzi, D.; Achumba, I.E.; Bersch, S.D. Real-Time Human Ambulation, Activity, and Physiological Monitoring: Taxonomy of Issues, Techniques, Applications, Challenges and Limitations. Sensors 2013, 13, 12852–12902. [Google Scholar] [CrossRef] [Green Version]
  27. Das, D.; Busetty, S.M.; Bharti, V.; Hegde, P.K. Strength training: A fitness application for indoor based exercise recognition and comfort analysis. In Proceedings of the 16th IEEE International Conference on Machine Learning and Applications, Cancun, Mexico, 18–21 December 2017. [Google Scholar]
  28. Ishii, S.; Yokokubo, A.; Luimula, M.; Lopez, G. ExerSense: Physical Exercise Recognition and Counting Algorithm from Wearables Robust to Positioning. Sensors 2020, 21, 91. [Google Scholar] [CrossRef]
  29. Fang, P.; Ma, X.; Li, X.; Qiu, X.; Gerhard, R.; Zhang, X.; Li, G. Fabrication, Structure Characterization, and Performance Testing of Piezoelectret-Film Sensors for Recording Body Motion. IEEE Sens. J. 2018, 18, 401–412. [Google Scholar] [CrossRef]
  30. Jiang, X.; Merhi, L.-K.; Menon, C. Force Exertion Affects Grasp Classification Using Force Myography. IEEE Trans. Human-Mach. Syst. 2017, 48, 219–226. [Google Scholar] [CrossRef]
  31. Sadarangani, G.P.; Jiang, X.; Simpson, L.A.; Eng, J.J.; Menon, C. Force Myography for Monitoring Grasping in Individuals with Stroke with Mild to Moderate Upper-Extremity Impairments: A Preliminary Investigation in a Controlled Environment. Front. Bioeng. Biotechnol. 2017, 5, 42. [Google Scholar] [CrossRef] [PubMed] [Green Version]
  32. Müller, P.N.; Rauterberg, F.; Achenbach, P.; Tregel, T.; Göbel, S. Physical Exercise Quality Assessment Using Wearable Sensors; Springer: Berlin/Heidelberg, Germany, 2021; pp. 229–243. [Google Scholar]
Figure 1. Block diagram of the proposed system.
Automation 03 00007 g001
Figure 2. Smart glove prototype with mounted electronic components.
Automation 03 00007 g002
Figure 3. Silicon rubber substrate and its total displacement(deformation) under maximum force ( 10   Ib based on the weight of the heaviest dumbbell). Results of the FEM are as follows: (A) 6 cm, (B) 4.3 cm, (C) 0.6 cm, (D) 0.4 cm.
Automation 03 00007 g003
Figure 4. (A) Glove prototype, (B) Flexiforce force sensors, (C) Layers of prototype in the glove (shown with gray as tiny rubbery disk, light blue as substrate, black as fabric, and dark blue as sensor).
Automation 03 00007 g004
Figure 5. (A) Squat, (B) Hammer curl, (C) Side shoulder dumbbell raises, (D) Single arm dumbbell bench rows, (E) Straight arm pullover, (F) Seated cable back rows, (G) Standing triceps extension, (H) Shoulder press, (I) Dumbbell bent-over raise.
Automation 03 00007 g005
Figure 6. (A) Rotating hand when roll angle changes from 0 to 180, (B) rotating hand when pitch angle changes from 0 to 180.
Automation 03 00007 g006
Figure 7. An example of one repetition of three force sensors with their corresponding pitch and roll angles during the second data collection step: (A) Force sensor and orientation signals for 2 Ib weight, (B) Force sensor and orientation signals for 5 Ib weight, (C) Force sensor and orientation signals for 8 Ib weight.
Automation 03 00007 g007
Figure 8. Sample repetition counting models: (A) Hammer Curl, (B) Squat, (C) Pullove.
Automation 03 00007 g008
Figure 9. Average accuracies of 10-fold cross validation over training data and their standard deviation for the four developed models.
Automation 03 00007 g009
Figure 10. Average precision, recalls, and fscores of 10-fold cross validation over training data and their standard deviation for the four developed models.
Automation 03 00007 g010
Figure 11. Evaluation metrics for all the developed models: (A) DT, (B) KNN, (C) SVM, and (D) RF.
Automation 03 00007 g011
Figure 12. Accuracy of the models over test data.
Automation 03 00007 g012
Figure 13. Accuracy of repetition counting algorithm for each sport type.
Automation 03 00007 g013
Figure 14. Average accuracies of 10-fold cross validation over training data and their standard deviation for three developed models.
Automation 03 00007 g014
Figure 15. Average precisions, recalls, and fscores of 10-fold cross validation over training data and their standard deviation for three developed models.
Automation 03 00007 g015
Figure 16. Evaluation metrics for all the developed models: (A) SVM, (B) MLP, (C) LDA.
Automation 03 00007 g016
Figure 17. Accuracy of the models over test data.
Automation 03 00007 g017
Publisher’s Note: MDPI stays neutral with regard to jurisdictional claims in published maps and institutional affiliations.

