1. Introduction
In recent years, autonomous solutions in the multidisciplinary field of mining engineering have been an extremely popular applied research topic. The increasing demands of society on mineral resources, along with the accelerating exploitation of the currently economically viable resources, have led the mining sector to turn to deeper, more-difficult-to-mine orebodies. To achieve this, the mining industry needs to continue to modernize and advance mining technology. One of the trends is the integration of autonomous vehicles and solutions into the mining cycle [
1].
The increasing appeal of integrating autonomous vehicles into the mining cycle lies primarily on two aspects that need to be optimized in every mine: safety and productivity. A significant improvement of the health and safety of the miners can be achieved by relocating equipment operators and other miners to a safer and healthier environment. Equipment operators are inherently exposed to numerous occupational hazards: noise; dust; vibration; thermal stress; inclement weather; slips, trips, and falls from climbing on and off equipment; crushes by heavy equipment; injuries by roof and rib falls; and fatigue-related accidents. Relocation of the operators from an active mine setting to a safer environment of a control room, even kilometers away, can effectively reduce accidents and exposure to unhealthy and unsafe conditions. At the same time, delegating tasks from humans to machines can potentially increase the productivity of the mining cycle. The inherent accuracy and efficiency of autonomous solutions are the main advantages over the human operator, especially for repetitive tasks. In some cases, advantages in terms of safety and productivity are reported where mining can continue when health risks would normally prohibit personnel from working, such as shortly after a blast before noxious gases have been diluted by the ventilation system. Optimizing energy and fuel consumption, regulating the flow of traffic with efficient fleet management, and reducing damage to equipment are a few other advantages that autonomous solutions can offer, leading to uninterrupted mining operations, as well as reduced production and maintenance costs.
The integration of autonomous vehicles into the underground mining cycle requires a multidisciplinary approach that will help resolve the various technical, safety, and human resource challenges that may arise. This is not a trivial task because many aspects affect such an endeavor: automation technology, systems engineering and management processes around automation, human factors engineering in automated and semiautomated systems, and social and political risks of automation in terms of shared value and sustainable development [
2,
3,
4].
An appropriate data management system (DMS) comprises a crucial aspect of the designing and the engineering of an autonomous or semiautonomous system. The vast volume of data collected from onboard sensors or from a potential Internet of Things (IoT) network dispersed around a smart mine necessitates the development of a reliable data management strategy. Ideally, this strategy will allow for fast and asynchronous access to the data with respect to real-time processing and decision-making purposes, as well as for visualization through a corresponding human–machine interface.
This paper presents the data management system implemented when integrating an autonomous shuttle car into the room and pillar underground coal mining cycle. More specifically, it discusses an asynchronous data collection and management system that facilitates the development and testing of a 1/6th scale shuttle car prototype. The laboratory setup and the approach followed for the data management and the workflow of the processes that enable the prototype to navigate autonomously around the pillars are described in detail.
Section 2 discusses the current trends of commercial implementation of autonomous solutions within mining operations and describes associated data management paradigms.
Section 3 presents a brief description of the constructed lab-scale shuttle car and the data collection approach.
Section 4 describes the workflow of the developed software stack that helps the lab-scale prototype navigate autonomously.
Section 5 discusses the advantages and disadvantages of the proposed data management system. Finally,
Section 6 presents a summary and the conclusion of this study.
It should also be noted that both the physical simulation environment (described in
Section 3) and the developed software (described in
Section 4) consider only simplified conditions. Since the main aim of this ongoing research is to determine the feasibility of autonomous navigation around pillars in underground mines and provide a simplified real-scale demonstration, an exhaustive consideration of industrial safety protocols and regulations or complex interactions between the various equipment operating in the working environment was deemed to be beyond the scope of this study. Despite these simplifications, the authors believe that useful insights can be conveyed by this study.
2. Autonomous Vehicles for Mining Applications
Several mining companies around the world have combined forces with mining equipment manufacturers and autonomous solutions companies towards implementing automated vehicles for the tasks of cutting, drilling, loading, and materials haulage.
The common target for implementing autonomous solutions in surface mines is the control of haul trucks and surface dozers. Haul trucks, wheel loaders, and load–haul–dump (LHD) equipment attract great interest for automation projects in underground mines as well. The longwall shearer system is widely used. In addition, drilling and cutting equipment for both surface and underground environments present attractive autonomous solutions for mining companies. Moreover, as the employment of autonomous vehicles and equipment in mining environments leads to the need for collecting and processing vast amounts of data, several companies have started developing data management systems, mining and mineral processing monitoring systems, and big data analytics solutions [
5].
The longwall shearer for underground coalmines is one of the first pieces of mining equipment to be automated to protect workers from roof caving in relatively soft formations where longwalls are commonly employed. Nowadays, these systems exhibit centimeter precision and are still continuously being advanced [
6]. In the last few decades, extensive research and experimentation have been conducted with teleoperated LHD equipment in various mines around the world [
2,
3,
7,
8]. Autonomous haulage systems that deploy fleets of wheel trucks and wheel loaders have gained great interest as well among leading companies, such as Komatsu America Corp.; Hitachi Construction Machinery Co., Ltd.; and Caterpillar, Inc., that have commercially implemented such systems [
9,
10,
11]. Other mining equipment targeted for autonomous operation include drills, roof bolters, and continuous miners [
12,
13,
14,
15]. Artificial intelligence, data management, network efficiency, and human factors are a few additional aspects that complement autonomous solutions in the mining sector that the research community strives to address [
16,
17,
18].
The level of advancement in the operation and management of autonomous machinery in the abovementioned cases varies with regard to three main aspects: (a) autonomy level (i.e., teleoperated to fully autonomous), (b) vehicle management (i.e., single-machine operation to fleet management), and (c) operation environment (i.e., surface-only operation to hybrid (surface and underground) operation). A common point is the preference of the industry for automating haulage trucks. Considering that the operation of this machinery consists of one of the most time-consuming parts of the mining cycle, as well as the necessity of navigating long distances through a constantly changing environment, both on the surface and underground, this choice becomes clear.
On the other hand, the prevalent equipment used for material haulage in underground coal mines, the shuttle car, has not been a popular choice for conversion to autonomous operation. There are several reasons for this, one of which is the small market size. Another is the lack of industrial or academic research published on this topic.
However, in all these cases, the operation of autonomous machinery in an underground environment imposes significant complexities to the development of reliable systems. Some of these challenges include the continuously changing and confined space of the working environment, the human machine interaction, the lack of the Global Positioning System (GPS), the limitations in wireless communications, the limitations in movement imposed by the presence of power cables and ventilation controls, and the occlusion in the sensor data caused by suspended dust and ventilation curtains [
19].
An automation system of this type is inevitably accompanied by an appropriate data management system (DMS). The design of a DMS is imperative because the reliable collection of, and access to, the sensor data is the cornerstone of an autonomous system. The performance of the DMS, in terms of speed and reliability, directly determines the speed and reliability of the update rate of the machine’s situational awareness. Consequently, the validity and reliability of any real-time decision making are defined by the DMS. The publicly available information in the literature about the specific DMS utilized in commercial applications, such as those described above, is expectedly limited. The different cooperative schemes between mining companies and autonomous solutions providers develop custom-built software stacks depending on the nature of the mining operation and the vehicle and sensors employed. Therefore, the DMS that accompanies these systems is highly customized. Moreover, the automation systems, as well as the DMSs, continuously evolve based on the performance of the systems in the field. Data collected through experimentation and feedback from operators significantly contribute to the advancement of the system and the DMS.
Data management systems are used for storing data that are to be analyzed either in real time or retrospectively. In recent years, advancements in network efficiency, data storage, and processing speed enable more and more systems to store and analyze data in real time. Big data management is becoming a critical aspect of the mining industry, where the amount of information that needs to be collected, stored, and analyzed increases daily [
20].
All of the autonomous haulage systems (AHSs) (e.g., Komatsu’s FrontRunner AHS [
21,
22], Caterpillar’s Cat
® MineStar™ Command [
11], Sandvik’s AutoMine
® umbrella [
23], and Hitachi’s AHS [
10]) that are developed by coalitions of mining companies, mining equipment manufacturers, and autonomous solutions companies and are currently used commercially fall into the category of real-time applications. As an example, the OptiMine
® Analytics suite, developed by Sandvik AB, comprises a set of tools that collect, analyze, and visualize data from a variety of IoT devices, providing a real-time overview of the mining operations [
24]. The suite provides tools and features for (i) scheduling of mine development, production, and maintenance; (ii) task management; (iii) real-time equipment, personnel, and asset tracking in the mine; (iv) drill planning and visualization; and (v) real-time equipment health monitoring and productivity information.
Data management systems are also developed for mining applications unrelated to autonomous haulage systems. For example, a real-time, event-driven database is used in surface lignite mines in Northern Greece to support a productivity and maintenance planning software application. The DMS collects and analyzes data through a SCADA (supervisory control and data acquisition) system, which interfaces with PLCs (programmable logic controllers) installed on multiple bucket wheel excavators, belt conveyors, spreaders, and stackers in the field [
25]. Similar control systems paired with OPC (Open Platform Communications) tools in a SCADA–PLC–OPC interface are commonly used for advanced monitoring of industrial processes [
26,
27,
28,
29,
30]. Geotechnical monitoring applications are typically heavily supported by DMSs as well. Monitoring the large-scale movement of slopes and assessing slope stability inside and outside of mines can be significantly facilitated by integrating wireless sensor networks, web services, and GIS (geographic information system) tools [
31,
32,
33].
Although literature sources with a detailed discussion on the DMSs implemented for self-driving vehicles are scarce, there are references on the topic of efficient data storage and management in the context of wireless sensor networks (WSNs). In general, the data management systems that are deployed for storage and querying data collected by WSNs in real time can be divided into two main categories: warehousing and distributed. The former category provides a centralized data management system where the datastream is accumulated in a database and the clients can query that database. On the other side, the latter category stores data into both, a central database, and the sensors themselves (local databases), enabling clients to query both. Each approach exhibits advantages and disadvantages, and different management systems have been proposed to optimize their performance [
34,
35]. The decision-making processes for an autonomous vehicle can further be enhanced with the integration of historical data (e.g., maps of intersections and traffic rules), an approach that is very common in the self-driving car industry [
36,
37]. Another critical factor for real-time sensing and processing is the problem of managing and updating sensor data, as well as the highly time-varying inquiry requests on sensor data. A variety of approaches have been proposed for efficiently tackling the timely refresh of such real-time systems, with a common solution to be deep reinforcement learning (DRL) in real-time databases [
38].
4. Data Management, Decision Making, and Control
The general data workflow, as well as the relevant data management subsystem, for the laboratory-scale shuttle car prototype is described in Androulakis et al. [
19]. The data management approach selected belongs to the warehousing category [
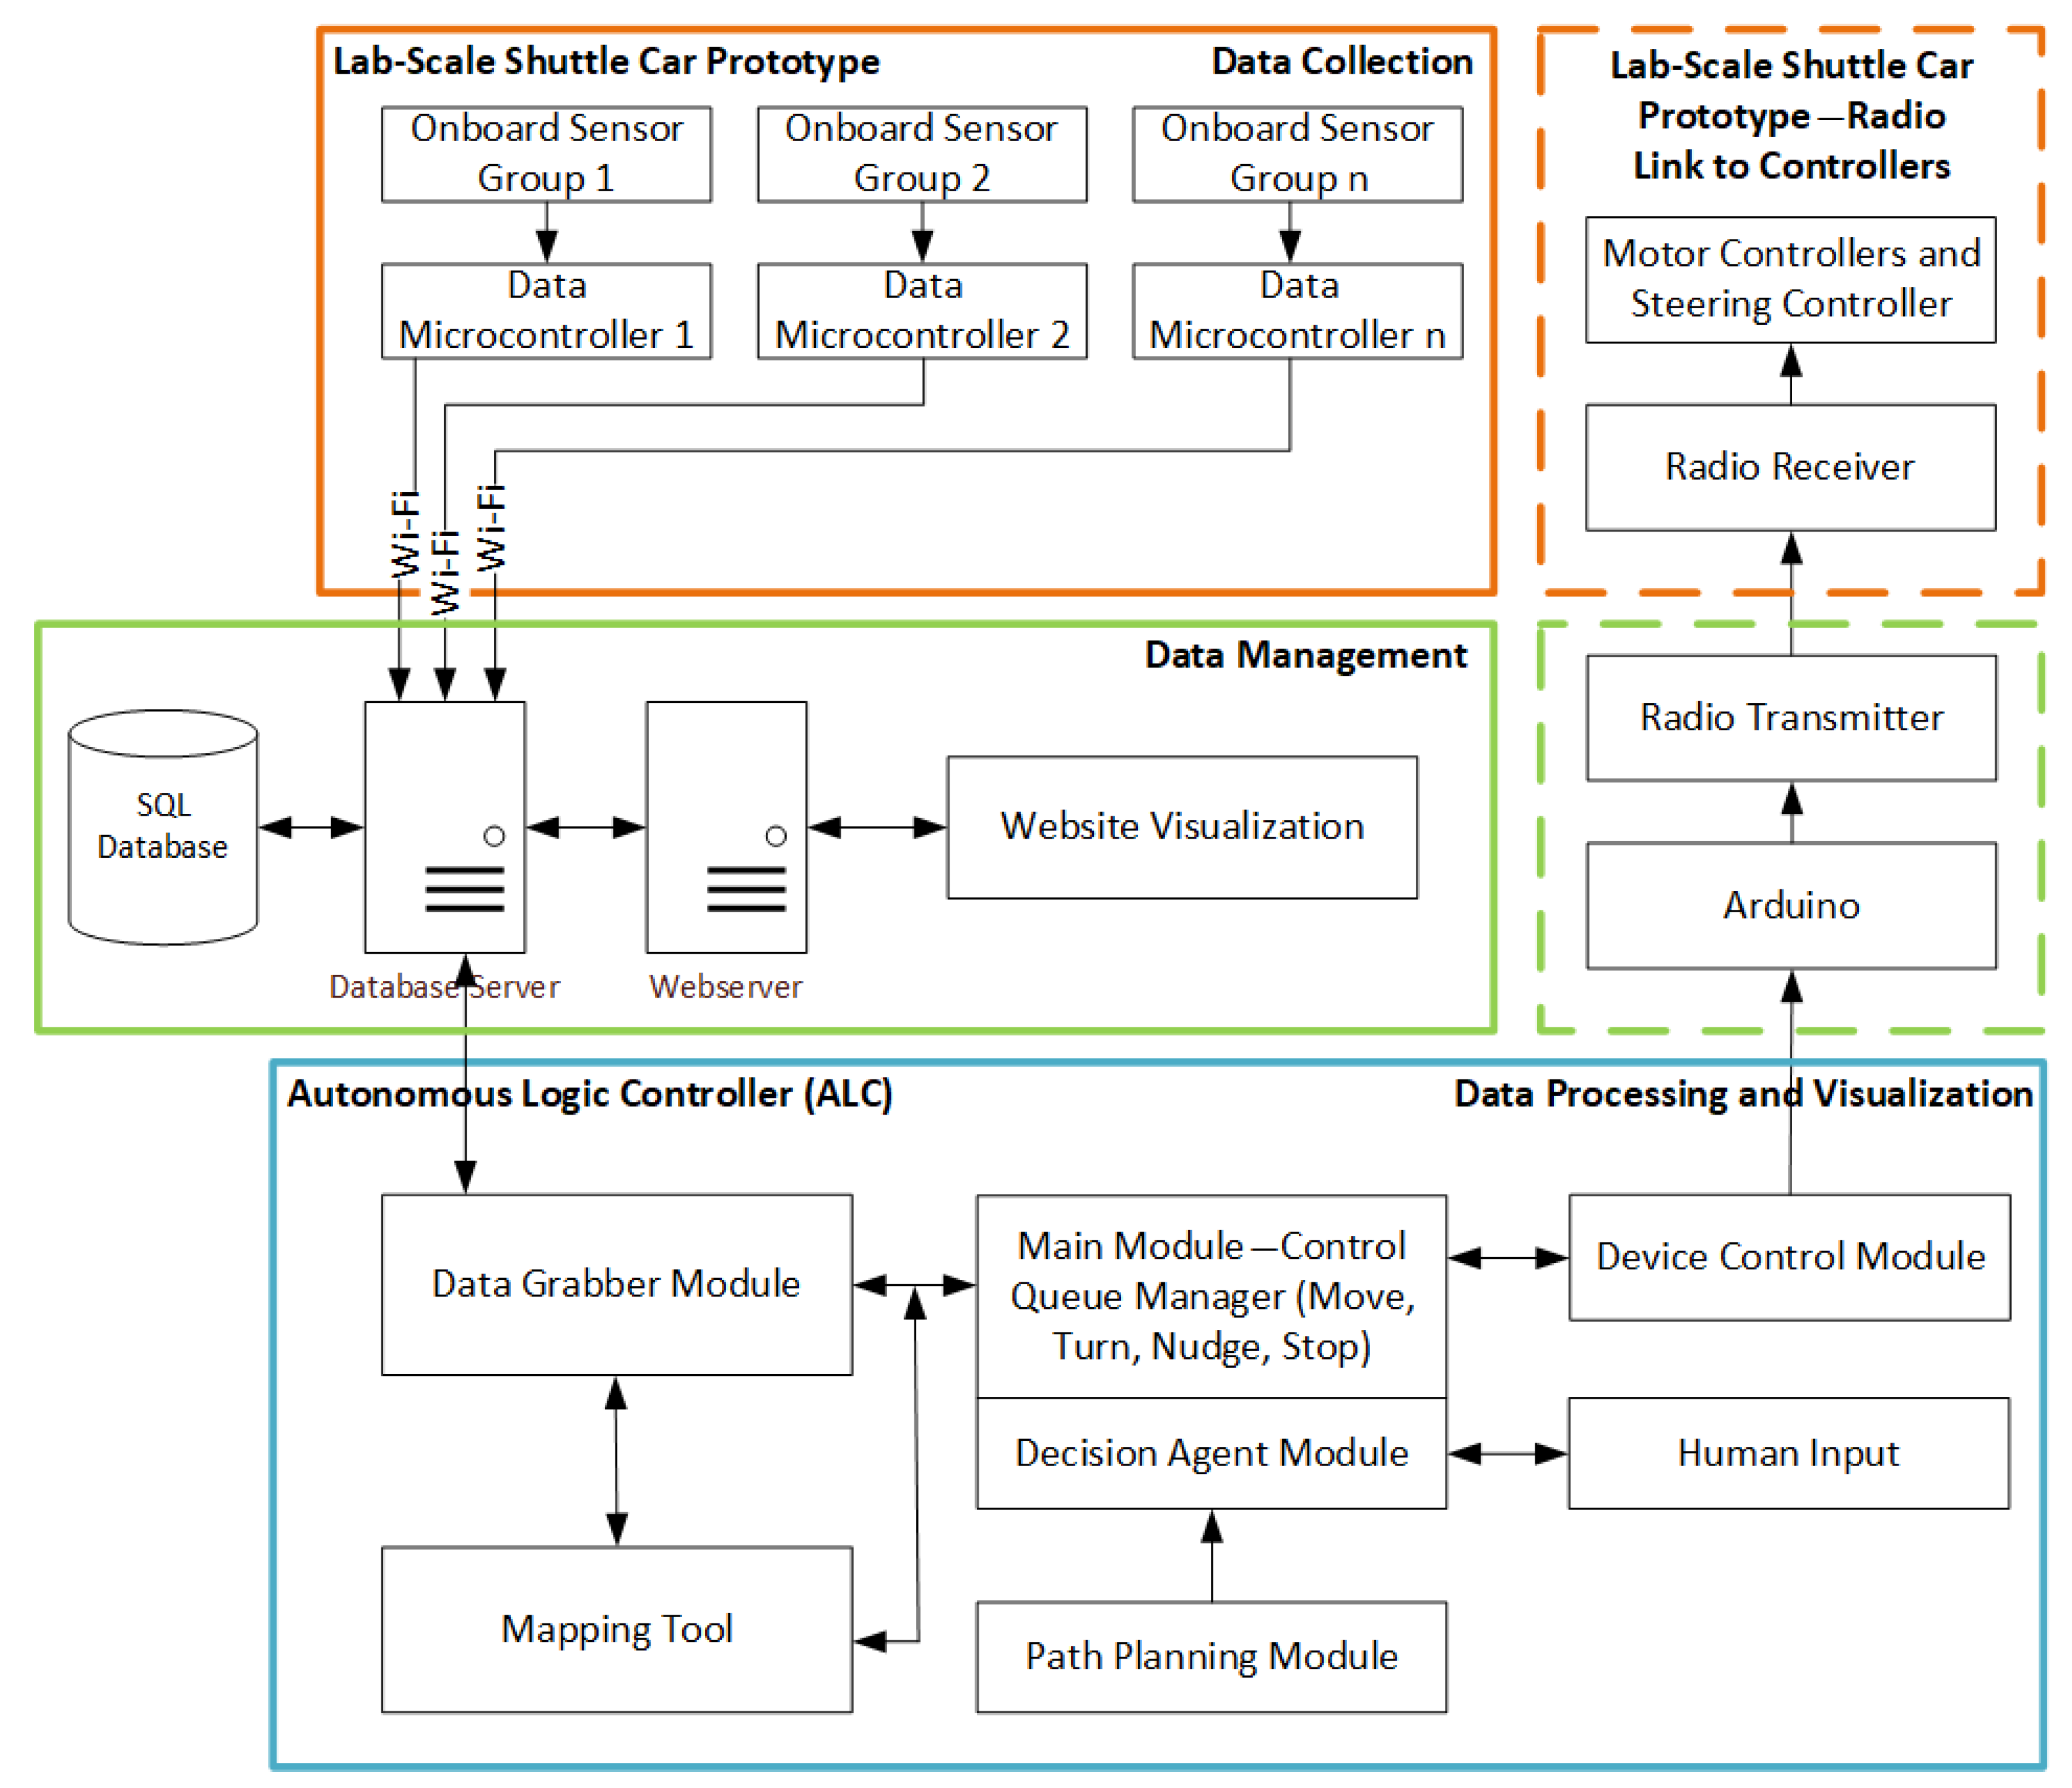
34] due to the inefficient memory and processing capabilities of the microcontrollers responsible for collecting the sensor data. Moreover, a centralized data storage system was deemed most appropriate for the application under investigation since the individual sensor data need to be combined to extract useful information about the vehicle’s surroundings. The relatively small operational environment, as well as the reduced amount of data collected due to the 2-D approach, and the constricted space of the typical underground coal mines have enabled the authors to conduct the laboratory-scale simulations without the need for integrating historical data or building routines for monitoring the refreshing of the datastream. In summary, the system utilizes simultaneous processes and is divided into three main parts or nodes, as shown in
Figure 7.
Data collection (onboard sensors): The data collection node includes the onboard hardware that is responsible for collecting the sensor data by onboard microcontrollers and for transmitting the data via Wi-Fi to an SQL database. This part is represented by the upper-left (orange) solid box of the schematic.
Data management (servers for data storage): The data management node consists of an SQL (Structured Query Language) database server and a webserver that facilitate the storage of the sensor data. This part is represented by the middle (green) solid box of the schematic.
Data processing and visualization (autonomous logic controller, mapping tool, path planning module, etc.): The data processing and visualization node is implemented as a Windows application that analyzes the datastream and generates the PWM signals that control the movement of the shuttle car in real time. This part is represented by the lower (blue) box of the schematic and includes the multimodular interface developed for decision making and for communication to the shuttle car traction motors and steering servomotors. Human input is also required for setting parameters and assigning missions.
4.1. Data Collection
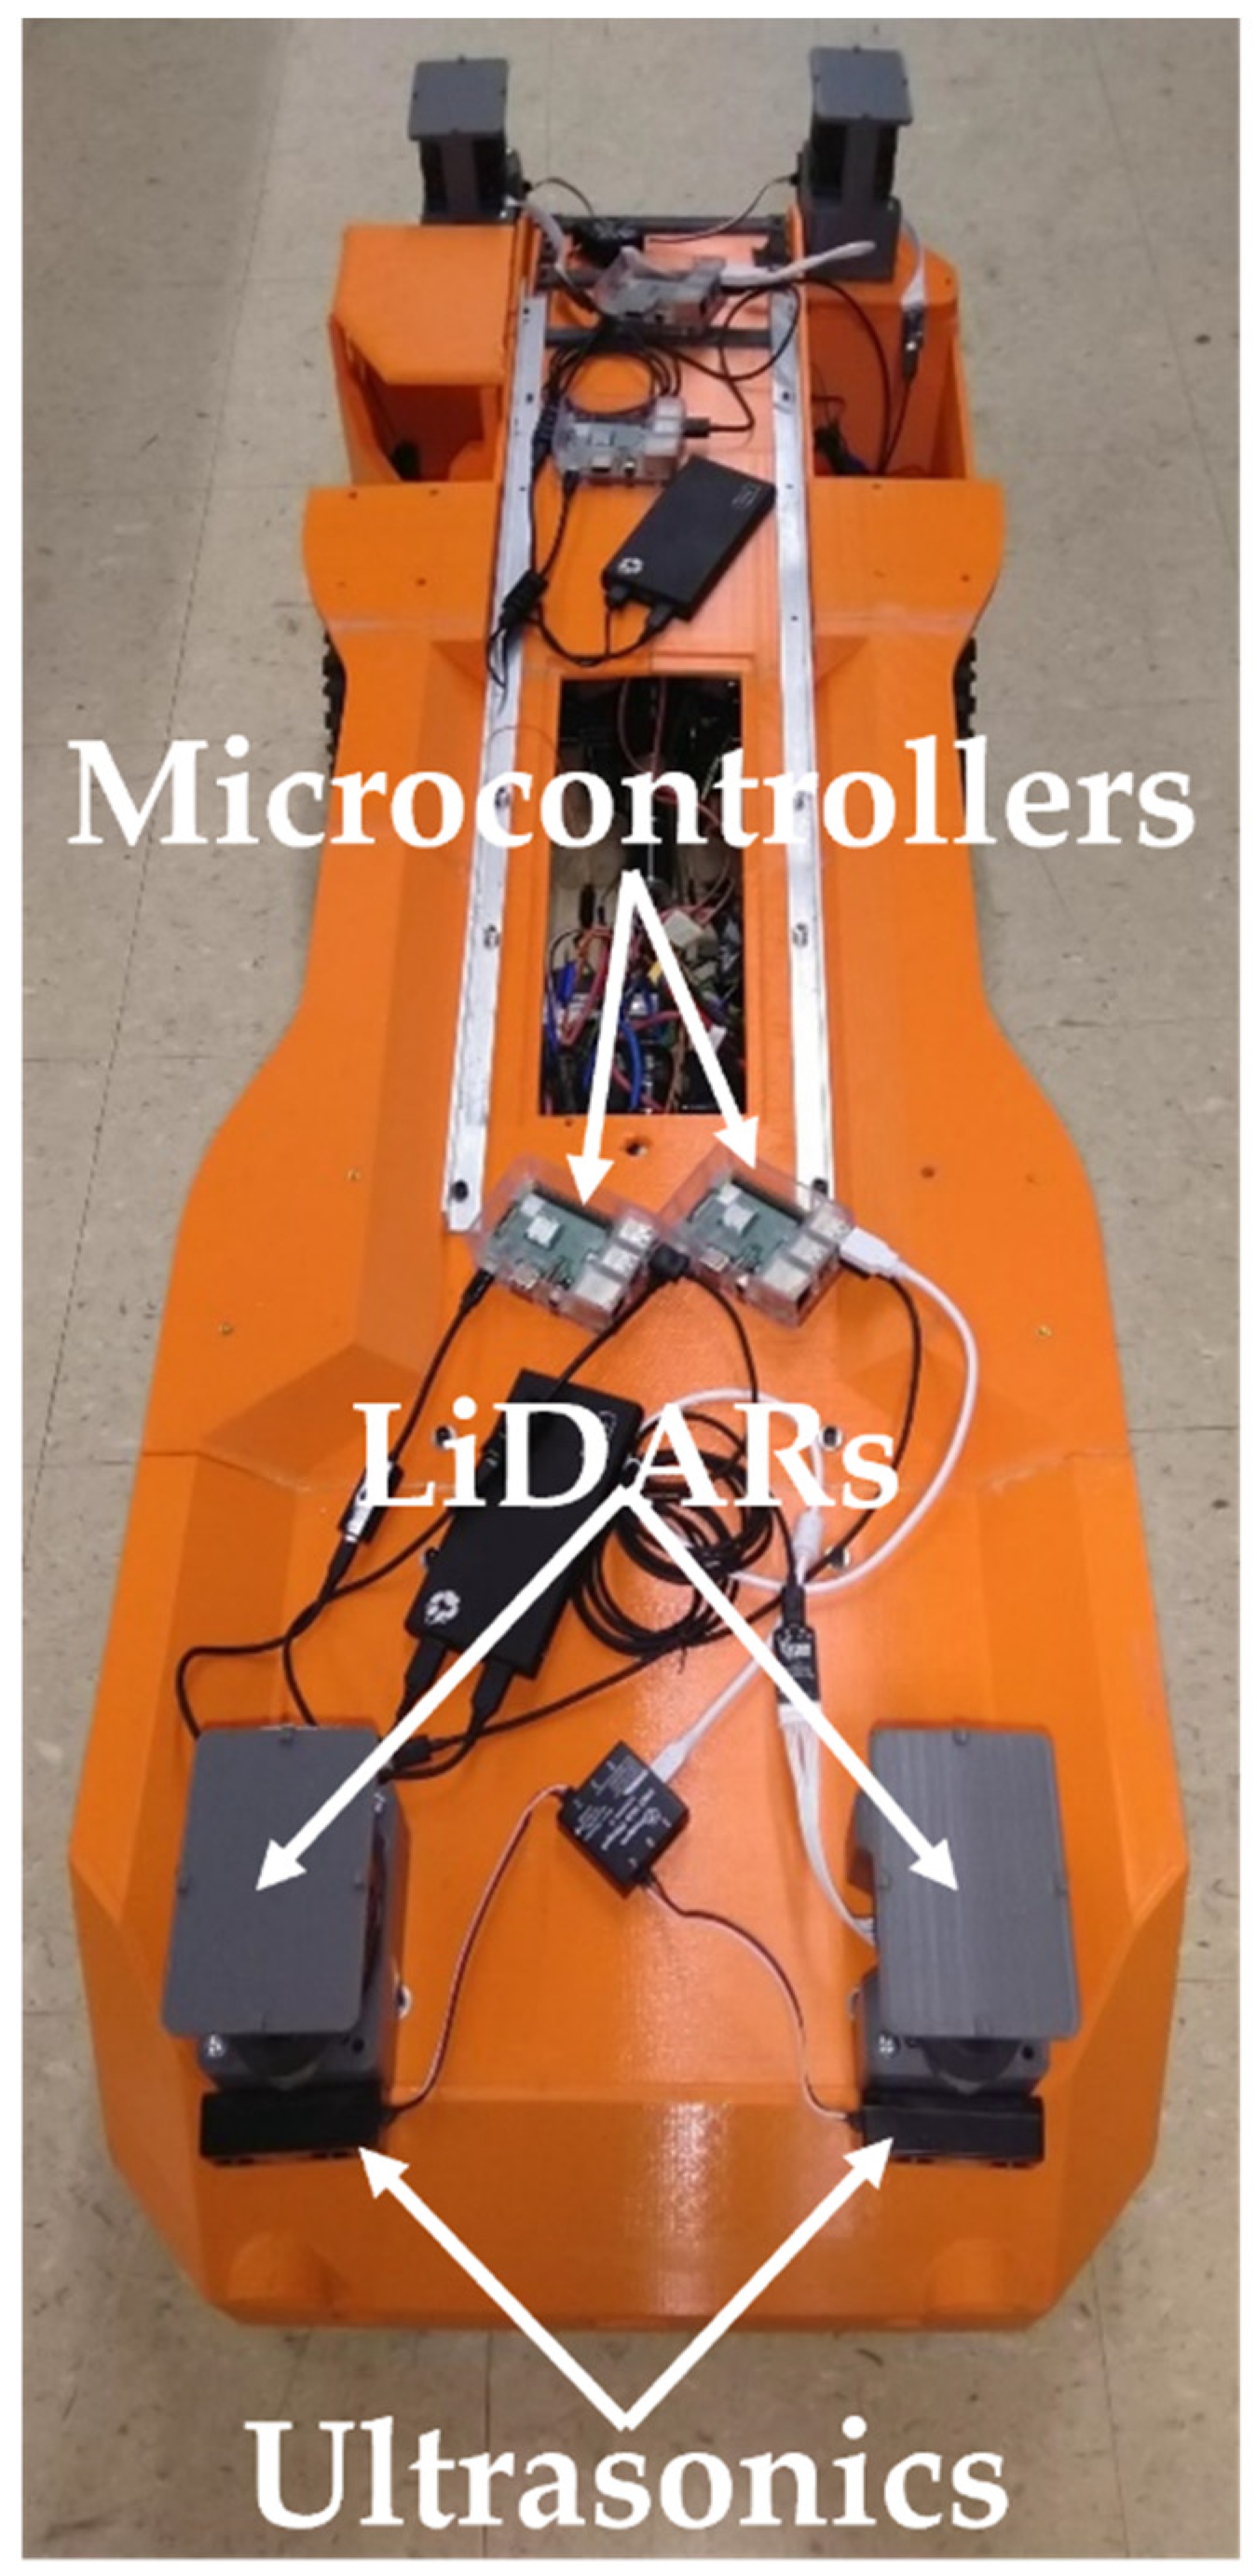
The data from the onboard sensors are collected through a number of Raspberry Pi 3 Model B+ microcontrollers [
45]. These microcontrollers are equipped with a quad core 64-bit CPU (central processing unit) with a frequency of 1.2 GHz and 1 GB RAM (random-access memory), as well as wireless LAN (local area network) connectivity. Each microcontroller is assigned to one LiDAR scanner and two ultrasonic sensors in parallel processes. The collection of data is accomplished through scripts, written in the Python programming language. The microcontrollers are programmed to collect new data from the sensors and post the data into the custom SQL database through a continuous loop. This data acquisition loop continuously retrieves the newest data from the sensors and uploads them to the SQL database through properly constructed messages. Before each iteration, the connectivity to the sensors is checked and restored in case of nonexistent or corrupted connection.
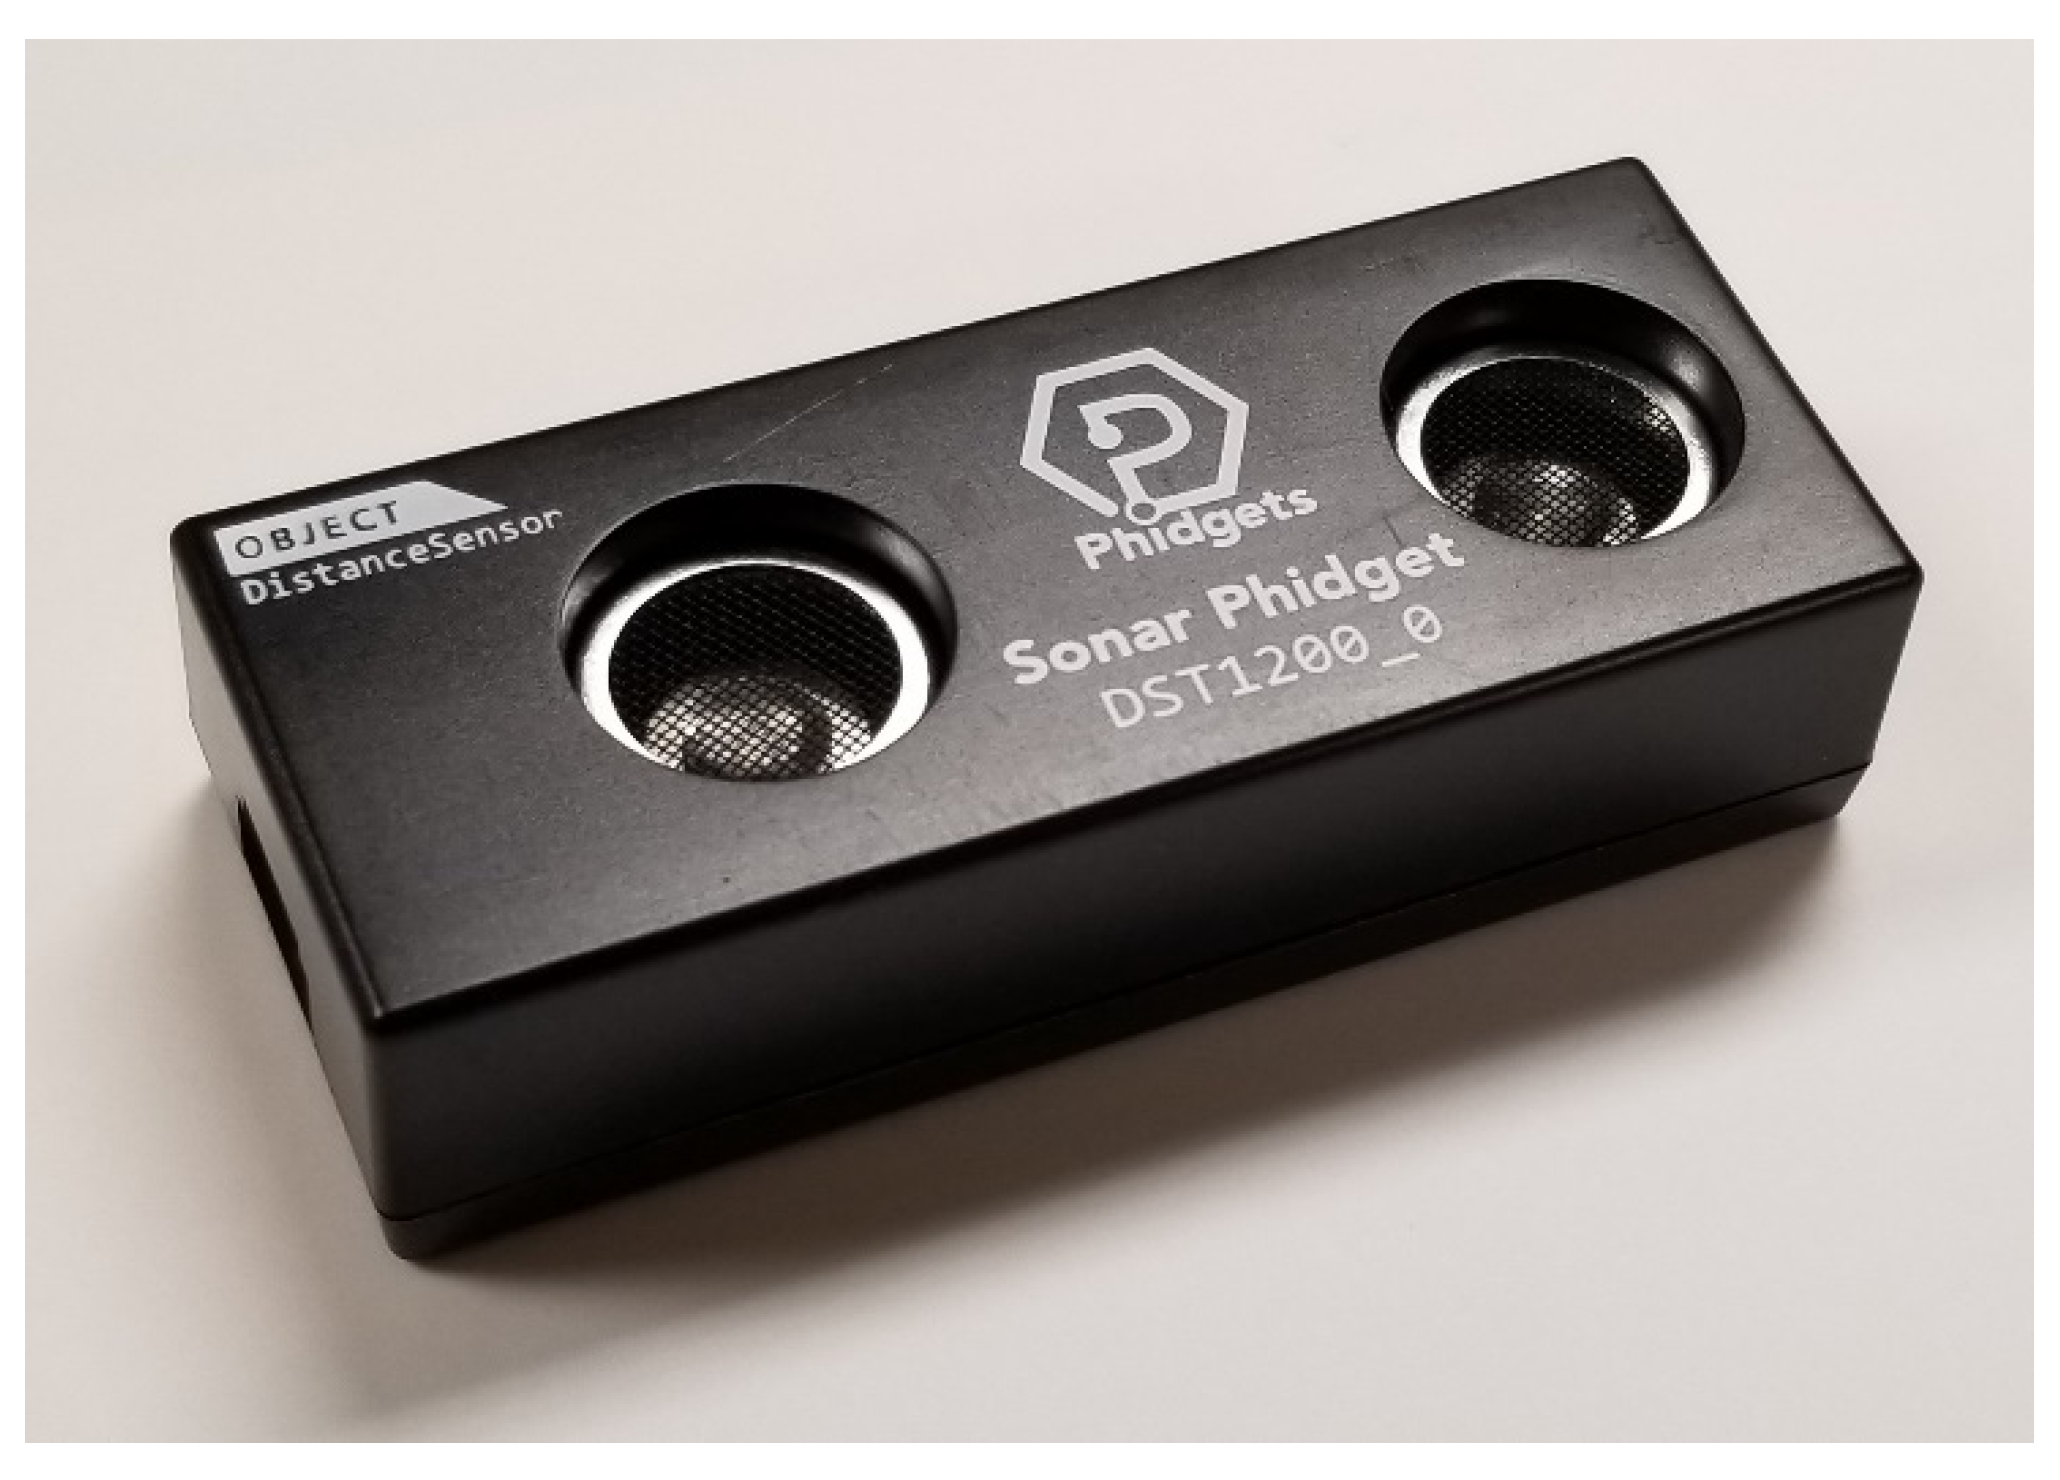
The sensor maximum update rate is determined by its specifications. In some cases, the user can select any update rate less than or equal to the maximum rate. In general, more advanced sensors have higher update rates. The maximum update rate of the ultrasonic sensors used in this project is 10 Hz or 100 ms per measurement, while the maximum update range of each of the LiDAR scanners is 10 Hz or 100 ms per one full scan. However, the measured update rates of the 2D LiDAR scanners are lower than the maximum reported in the specifications. The operating frequency of the 2D LiDAR scanners is in the range of 5 to 10 Hz per scan, with the typical frequency reported by Slamtec to be 5.5 Hz (under the condition that the LiDAR scanner retrieves 360 range measurements per scan). However, the average update rate measured in the laboratory by units controlled through the Raspberry Pi 3 B+ microcontrollers is between 7 and 8 Hz per scan. This rate is inherent to the sensor and cannot be changed manually since the current library released for this sensor under the Python programming language does not support it. Because of the higher frequency compared with the typical operating frequency, the number of range measurements collected during one scan is less than 360. The average observed value is 160–175 measurements per scan. Despite that the decreased number of measurements reduces the resolution of the maps created, the information provided is sufficient for the navigation algorithms and the decision-making processes.
Measurements by the LiDAR scanners are formatted into an array of triplets in the form of [signal quality, angle, distance], while measurements by the ultrasonic sensors include only a value for distance. Each measurement sequence is paired with the designated name of each sensor, as will be discussed in the following section. The data packet for each sensor type varies in length, which does not vary significantly between different measurement cycles.
4.2. Data Management
An SQL database schema has been developed to handle the data collected from the onboard sensors. The SQL database is populated in real time by data received from the Raspberry Pi microcontrollers. The database server asynchronously accepts the SQL post requests that include the collected data. At the same time, the database server responds to data requests from the data processing and visualization node and the webserver used for visualization of the collected data (
Figure 7).
The time needed to post the collected data to the database includes the time for the microcontroller to connect to the database over the available network protocol and the time to post each measurement to the SQL database. Thus, the update rate for the different datastreams is determined by three main factors: (i) the maximum update rate of the sensors, (ii) the number of scans performed per data collection cycle, and (iii) the time needed to post the data to the SQL database.
For example,
Table 3 summarizes the effective update rates for the LiDAR sensors as calculated by the data collection microcontrollers. The average effective update rate from the four LiDAR scanners is about 135 ms or 7.40 Hz.
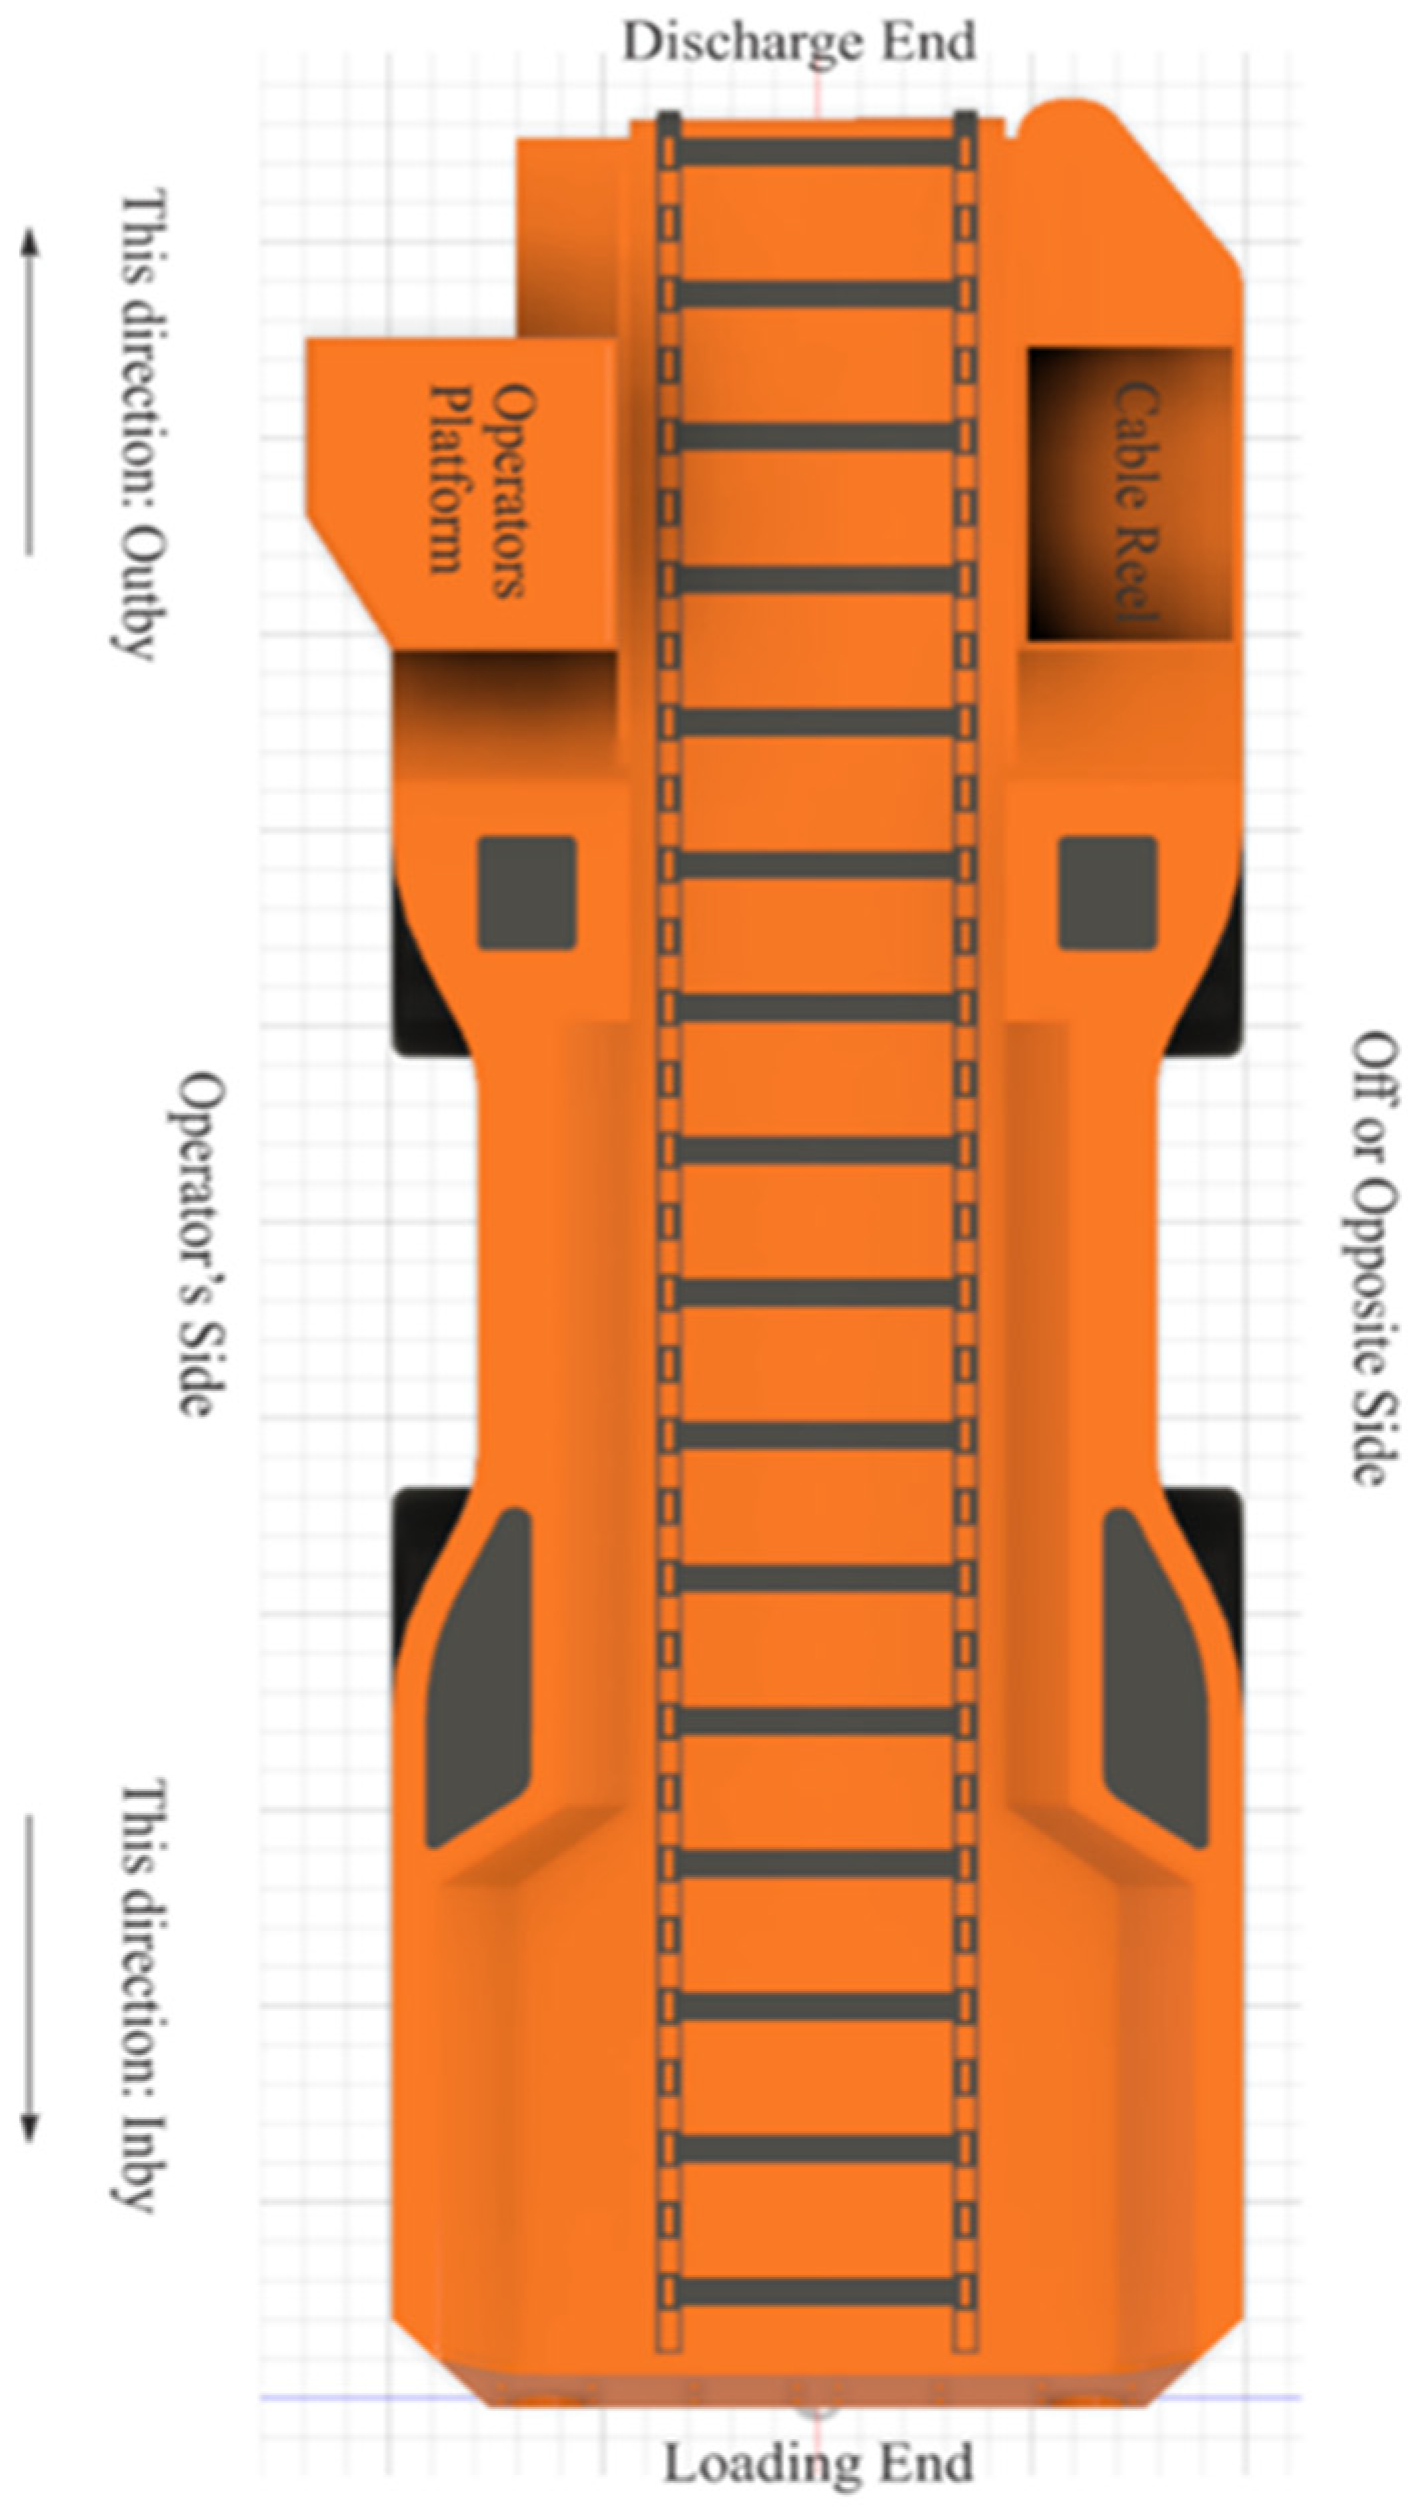
Table 4 depicts an example of data stored in the SQL database as collected from the onboard sensors. Each sensor is designated by a specific name so that the front-end routines that process and visualize the data can easily retrieve the respective sensor data. Sensor names are six to eight characters long, and each character pair is used to denote specific information about the sensor. The first pair denotes the type of sensor, US for ultrasonic or LR for LiDAR scanner; the second pair denotes the longitudinal position of the sensor on the prototype, DS for discharge end or LD for loading end; the third pair denotes the lateral position of the sensor on the prototype, OP for operator side or OF for off side; and the fourth pair is used for denoting the pointing direction of the point sensors (only the ultrasonic sensors need this descriptor), OP for operator side, OF for off side, IB for inby direction, or OB for outby direction (see
Figure 4 for a labeled schematic of the shuttle car’s parts). Moving inby corresponds to movement towards the active face, while moving outby corresponds to movement away from the face. The data collected from the 2D LiDAR units are stored as a series of arrays that contain three numbers, namely, [signal quality, angle, distance]. As shown in rows 1 and 15 of
Table 4, each such triplet is registered in the SQL database using a comma to separate the three values and is enclosed in parentheses.
Whenever the server receives a record, the time that record is created (current timestamp) is also recorded through an event triggered by the record insertion process. These times can be used to calculate another effective update rate for each sensor. Note that this update rate is the rate the database receives a new record from a specific sensor, as opposed to the effective update rate described previously, which corresponds to the rate the microcontroller sends out a new record to the database. These two effective update rates are different because of latencies in sending and/or recording data.
Table 5 shows a sample of the calculations for the update rate of a LiDAR scanner, while
Table 6 summarizes the update rates for the different sensors as calculated from the SQL database server timestamps. These rates were very close to the rates calculated through the timestamps generated by the microcontrollers before sending a record to the database. The average update rate for the LiDAR scanners is 136.15 ms, which corresponds to an update frequency of 7.35 Hz, while the average update rate of the ultrasonic sensors is 100.63 ms or 9.94 Hz.
4.3. Data Processing and Visualization
The front-end interface has been designed using a modular architecture, which facilitates the development and debugging of the software stack and provides layered processing of the raw data into a few meaningful parameters that expedite the decision-making process. The most important modules that compose the interface are the following:
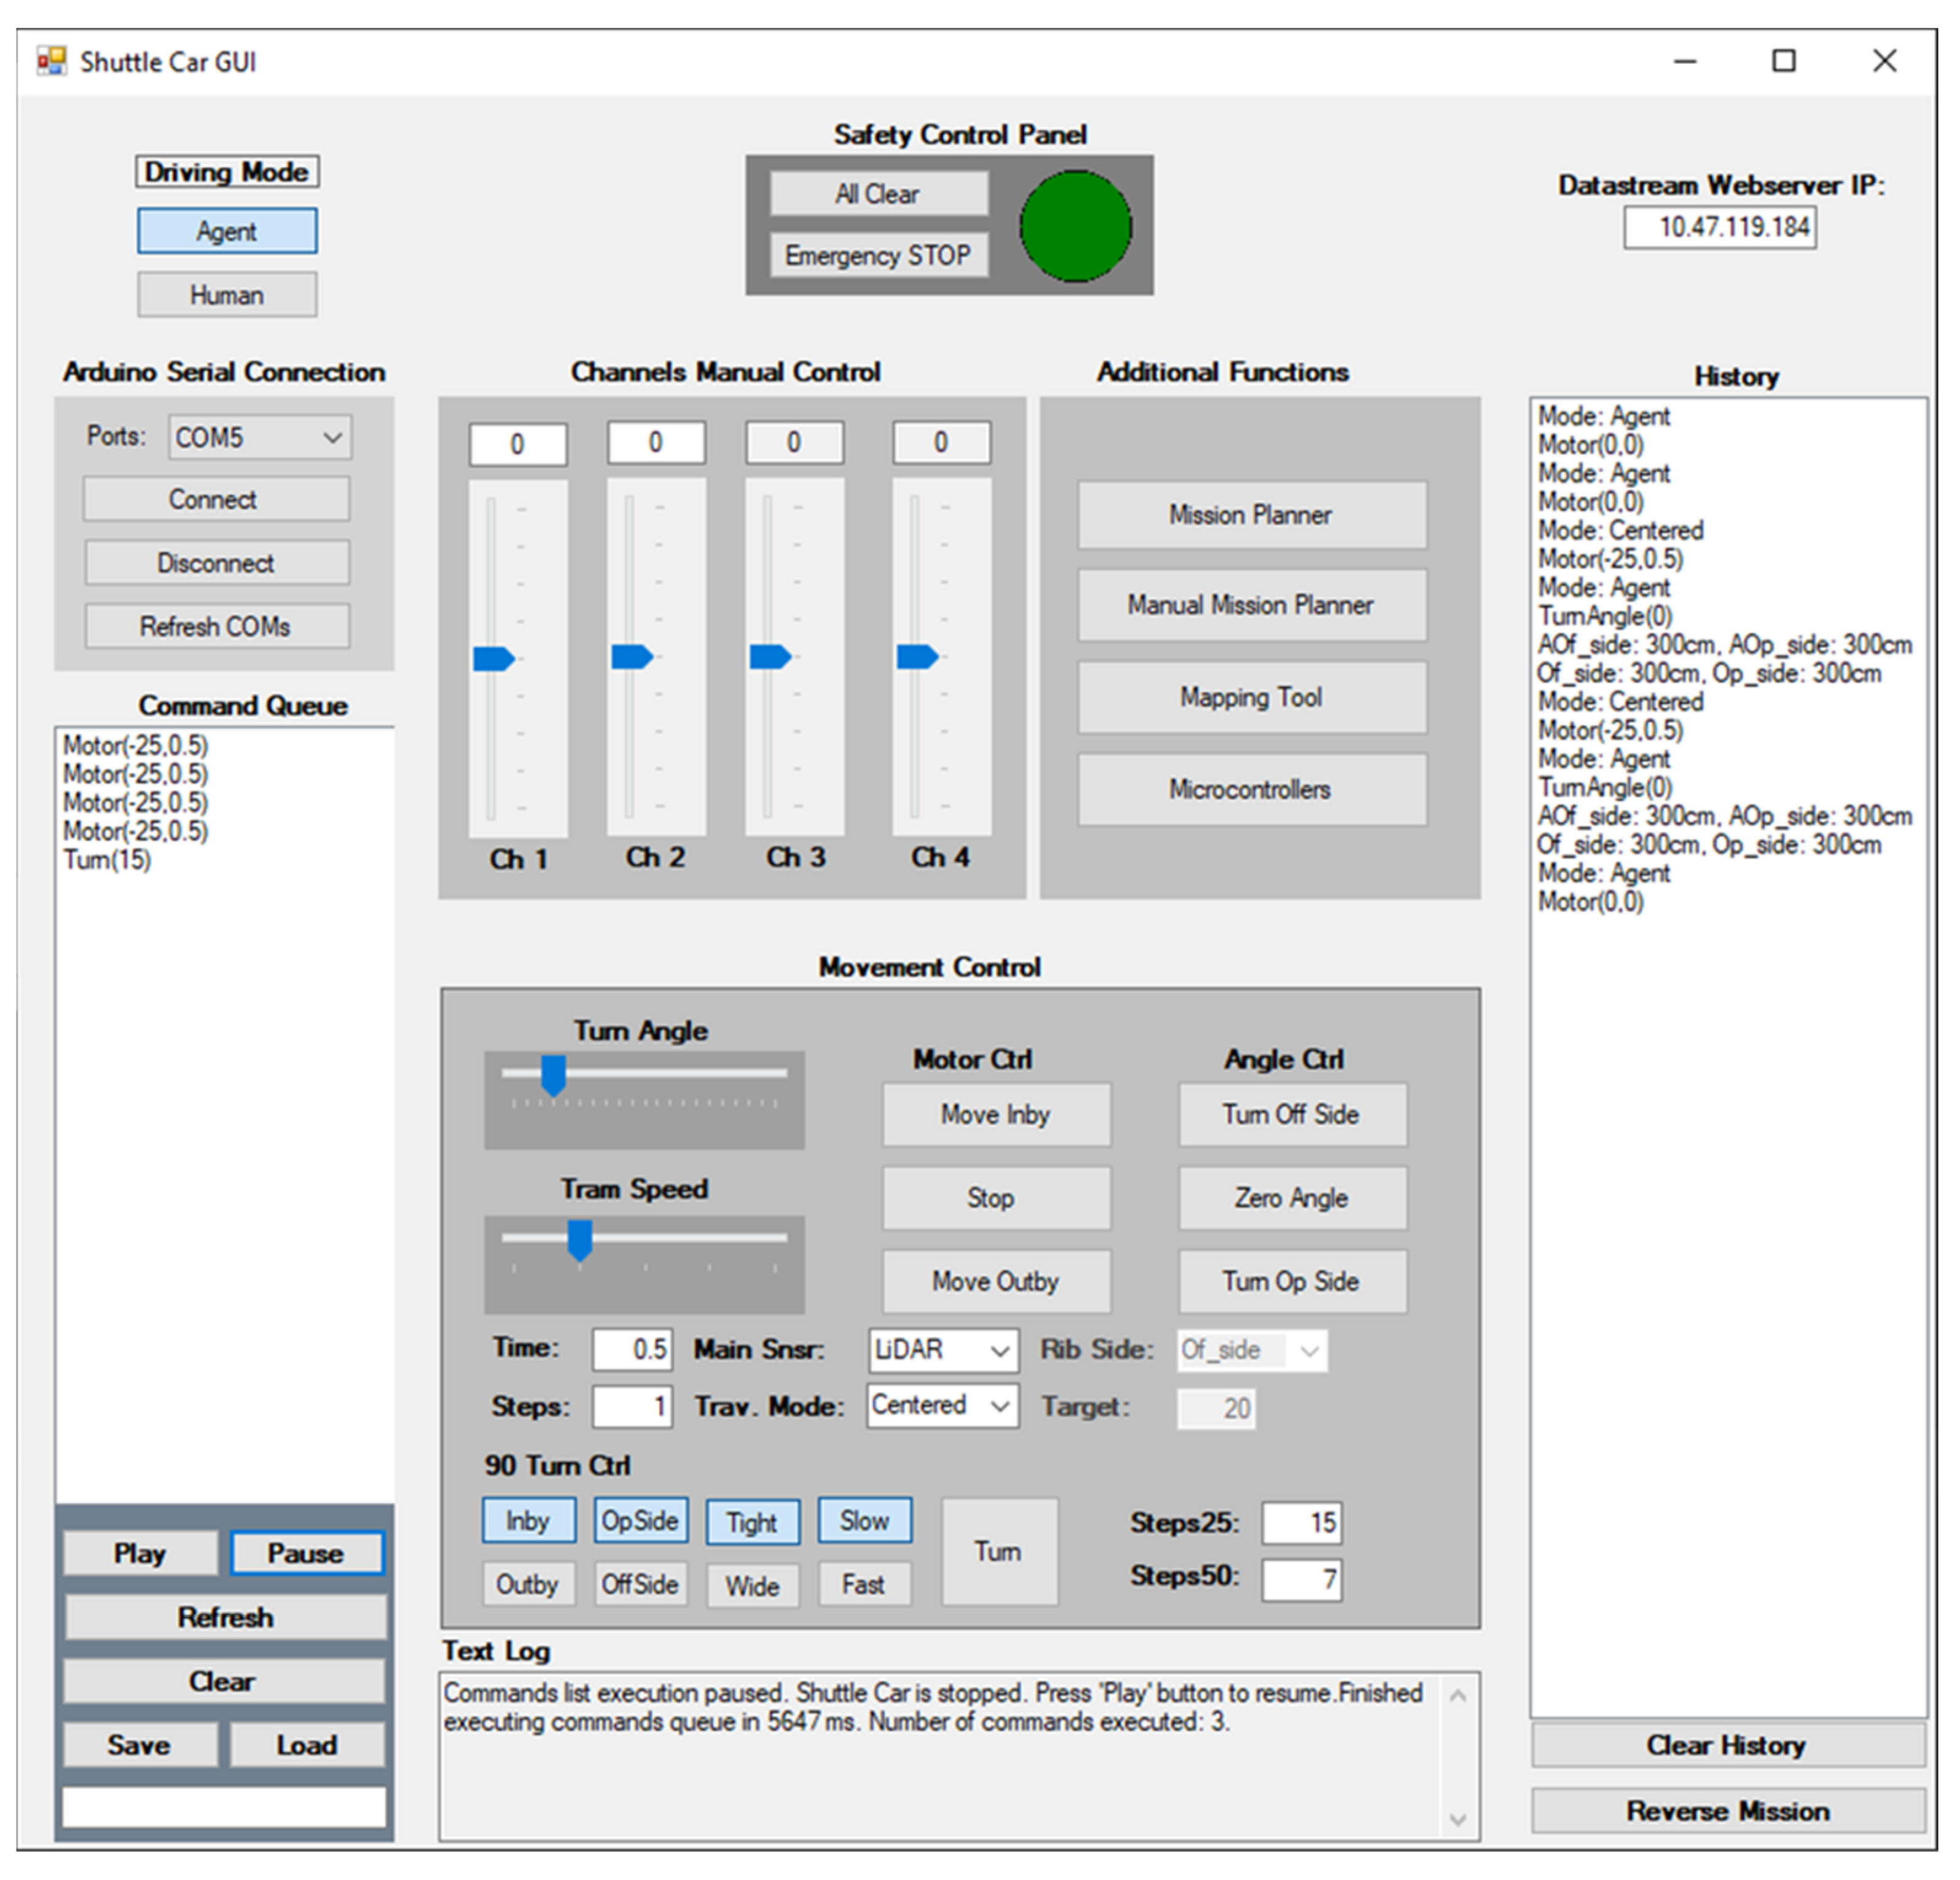
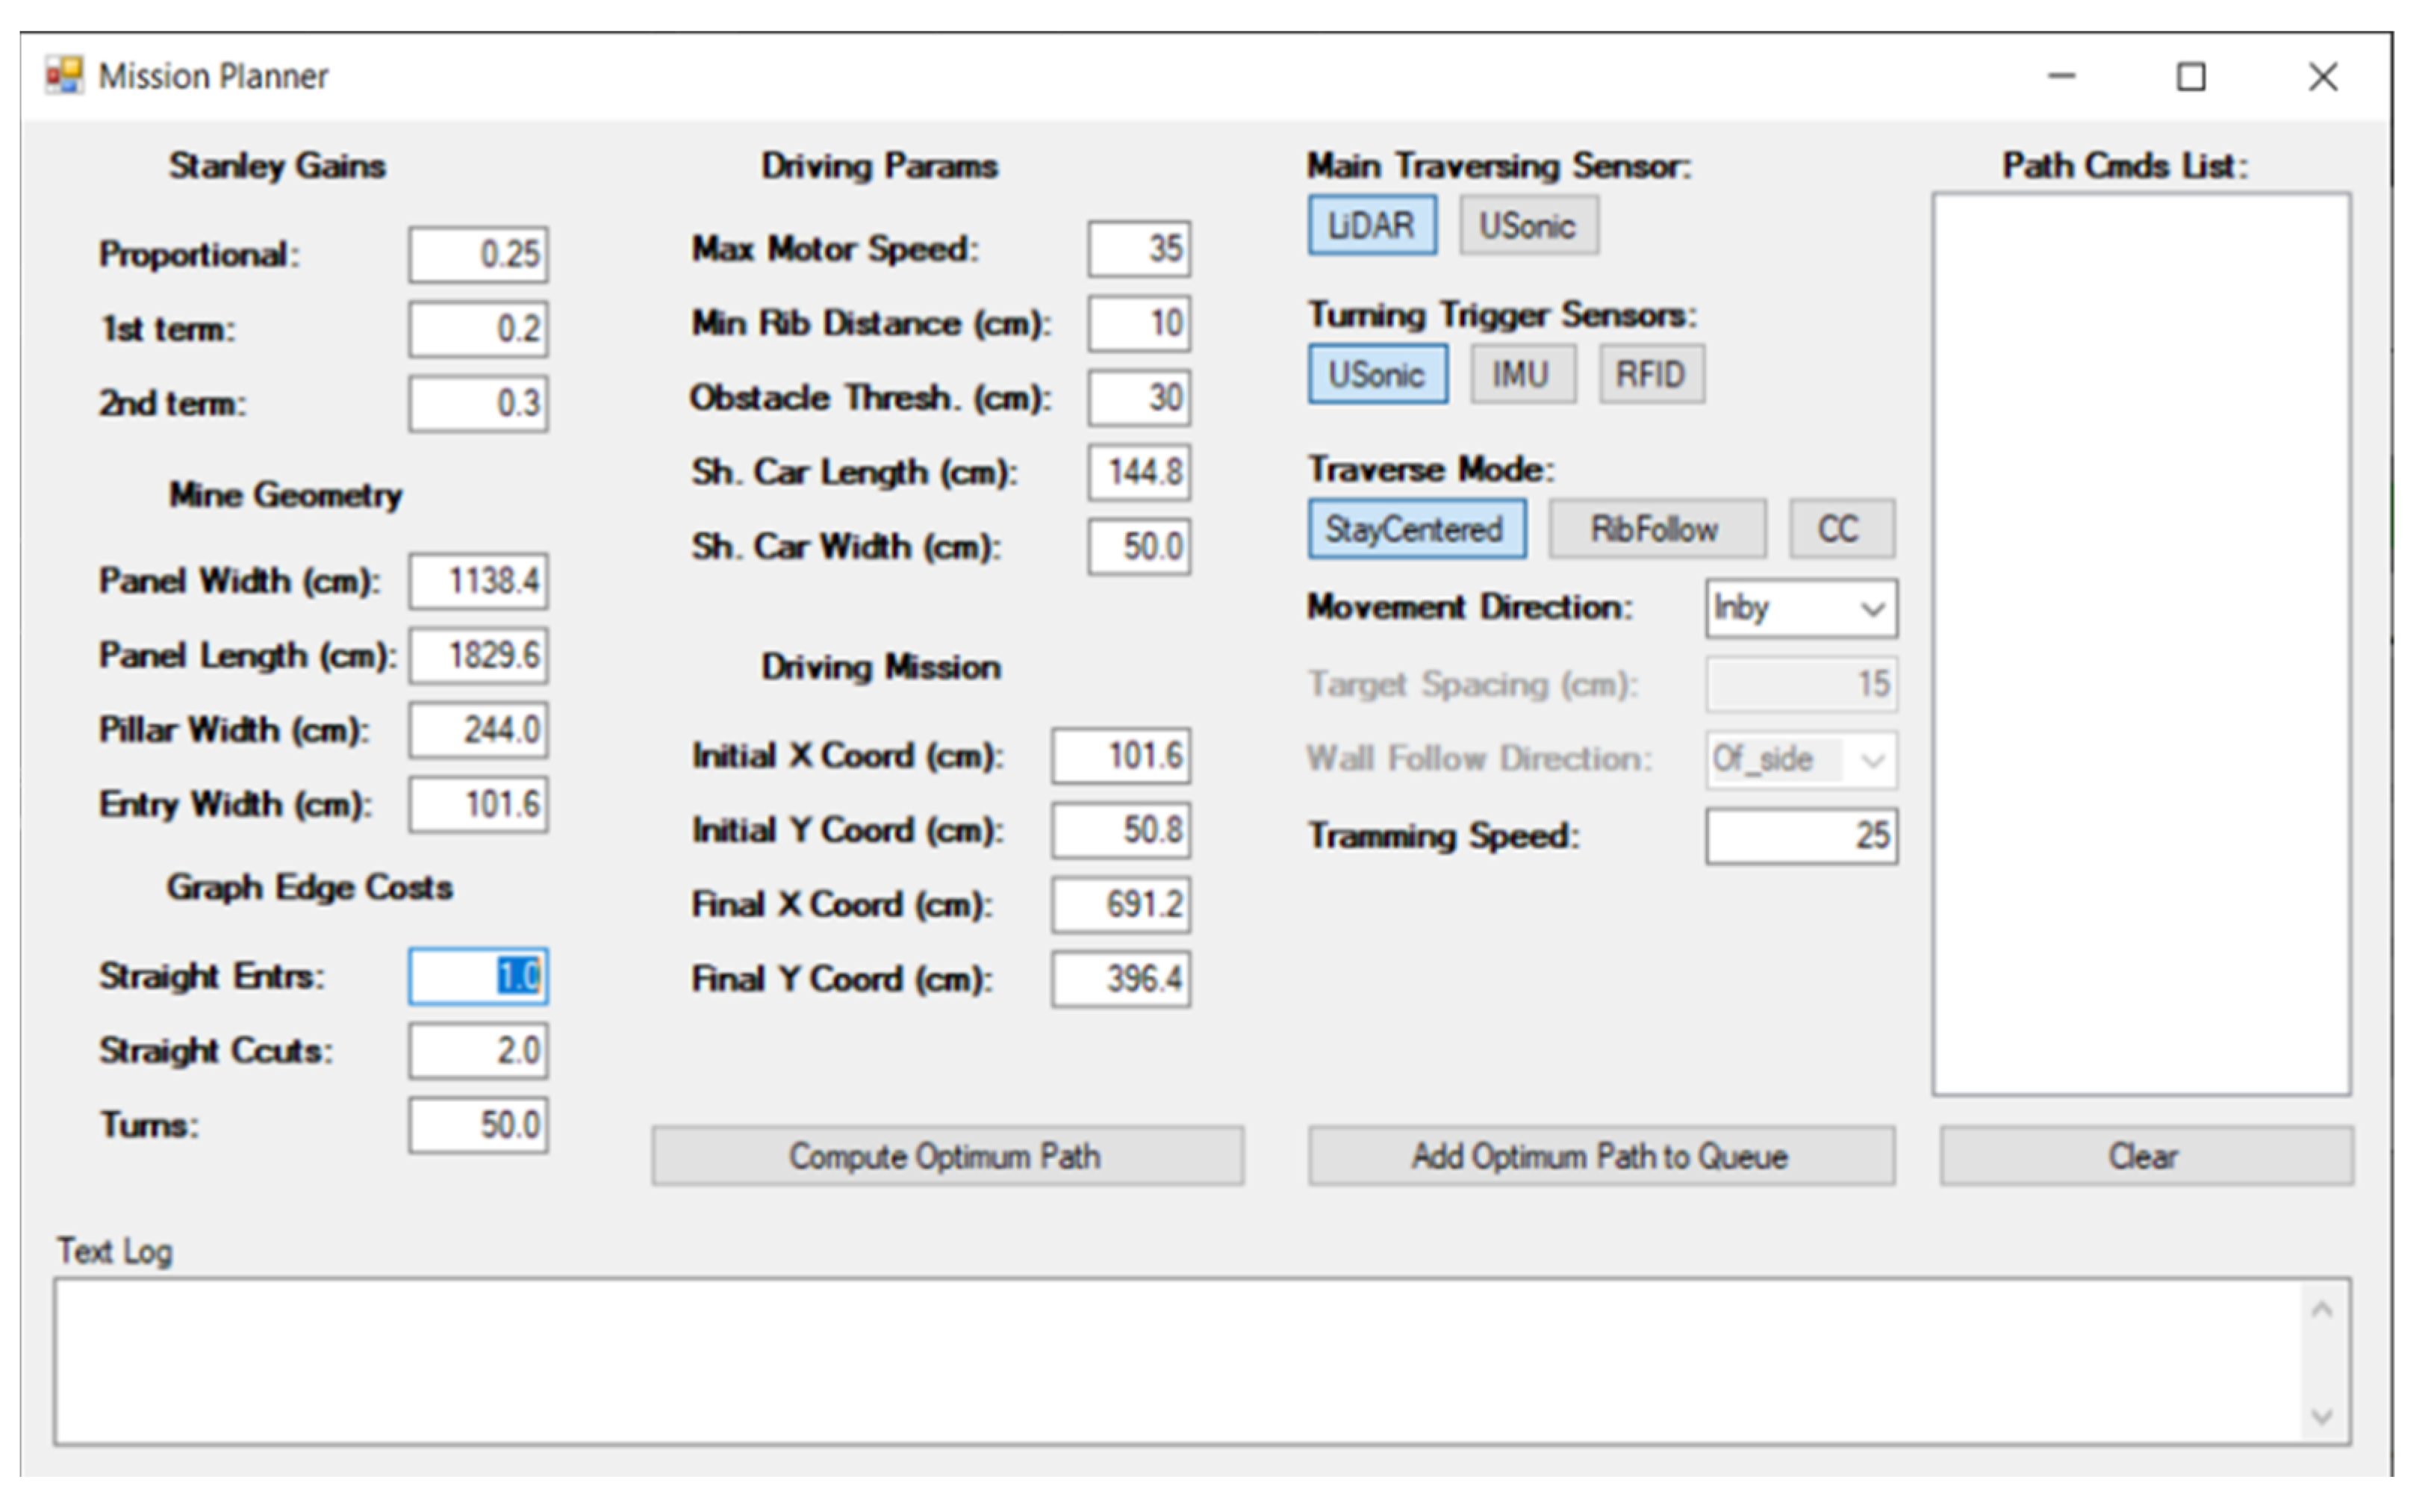
Main module: The main module provides the means for the shuttle car supervisor to create a mission for the vehicle (essentially, the path it is to follow) by creating low-level commands, and controls the starting, pausing, resuming, and termination of the execution of the command queue. Additionally, it enables the remote monitoring of the shuttle car’s movement through a number of scrolling switches that handle the speed and steering angle of the vehicle in real time. A screenshot of the currently implemented main window is shown in
Figure 8.
Data grabber module: The data grabber module enables the interface to connect to the SQL database and collect the latest updated sensor data in real time.
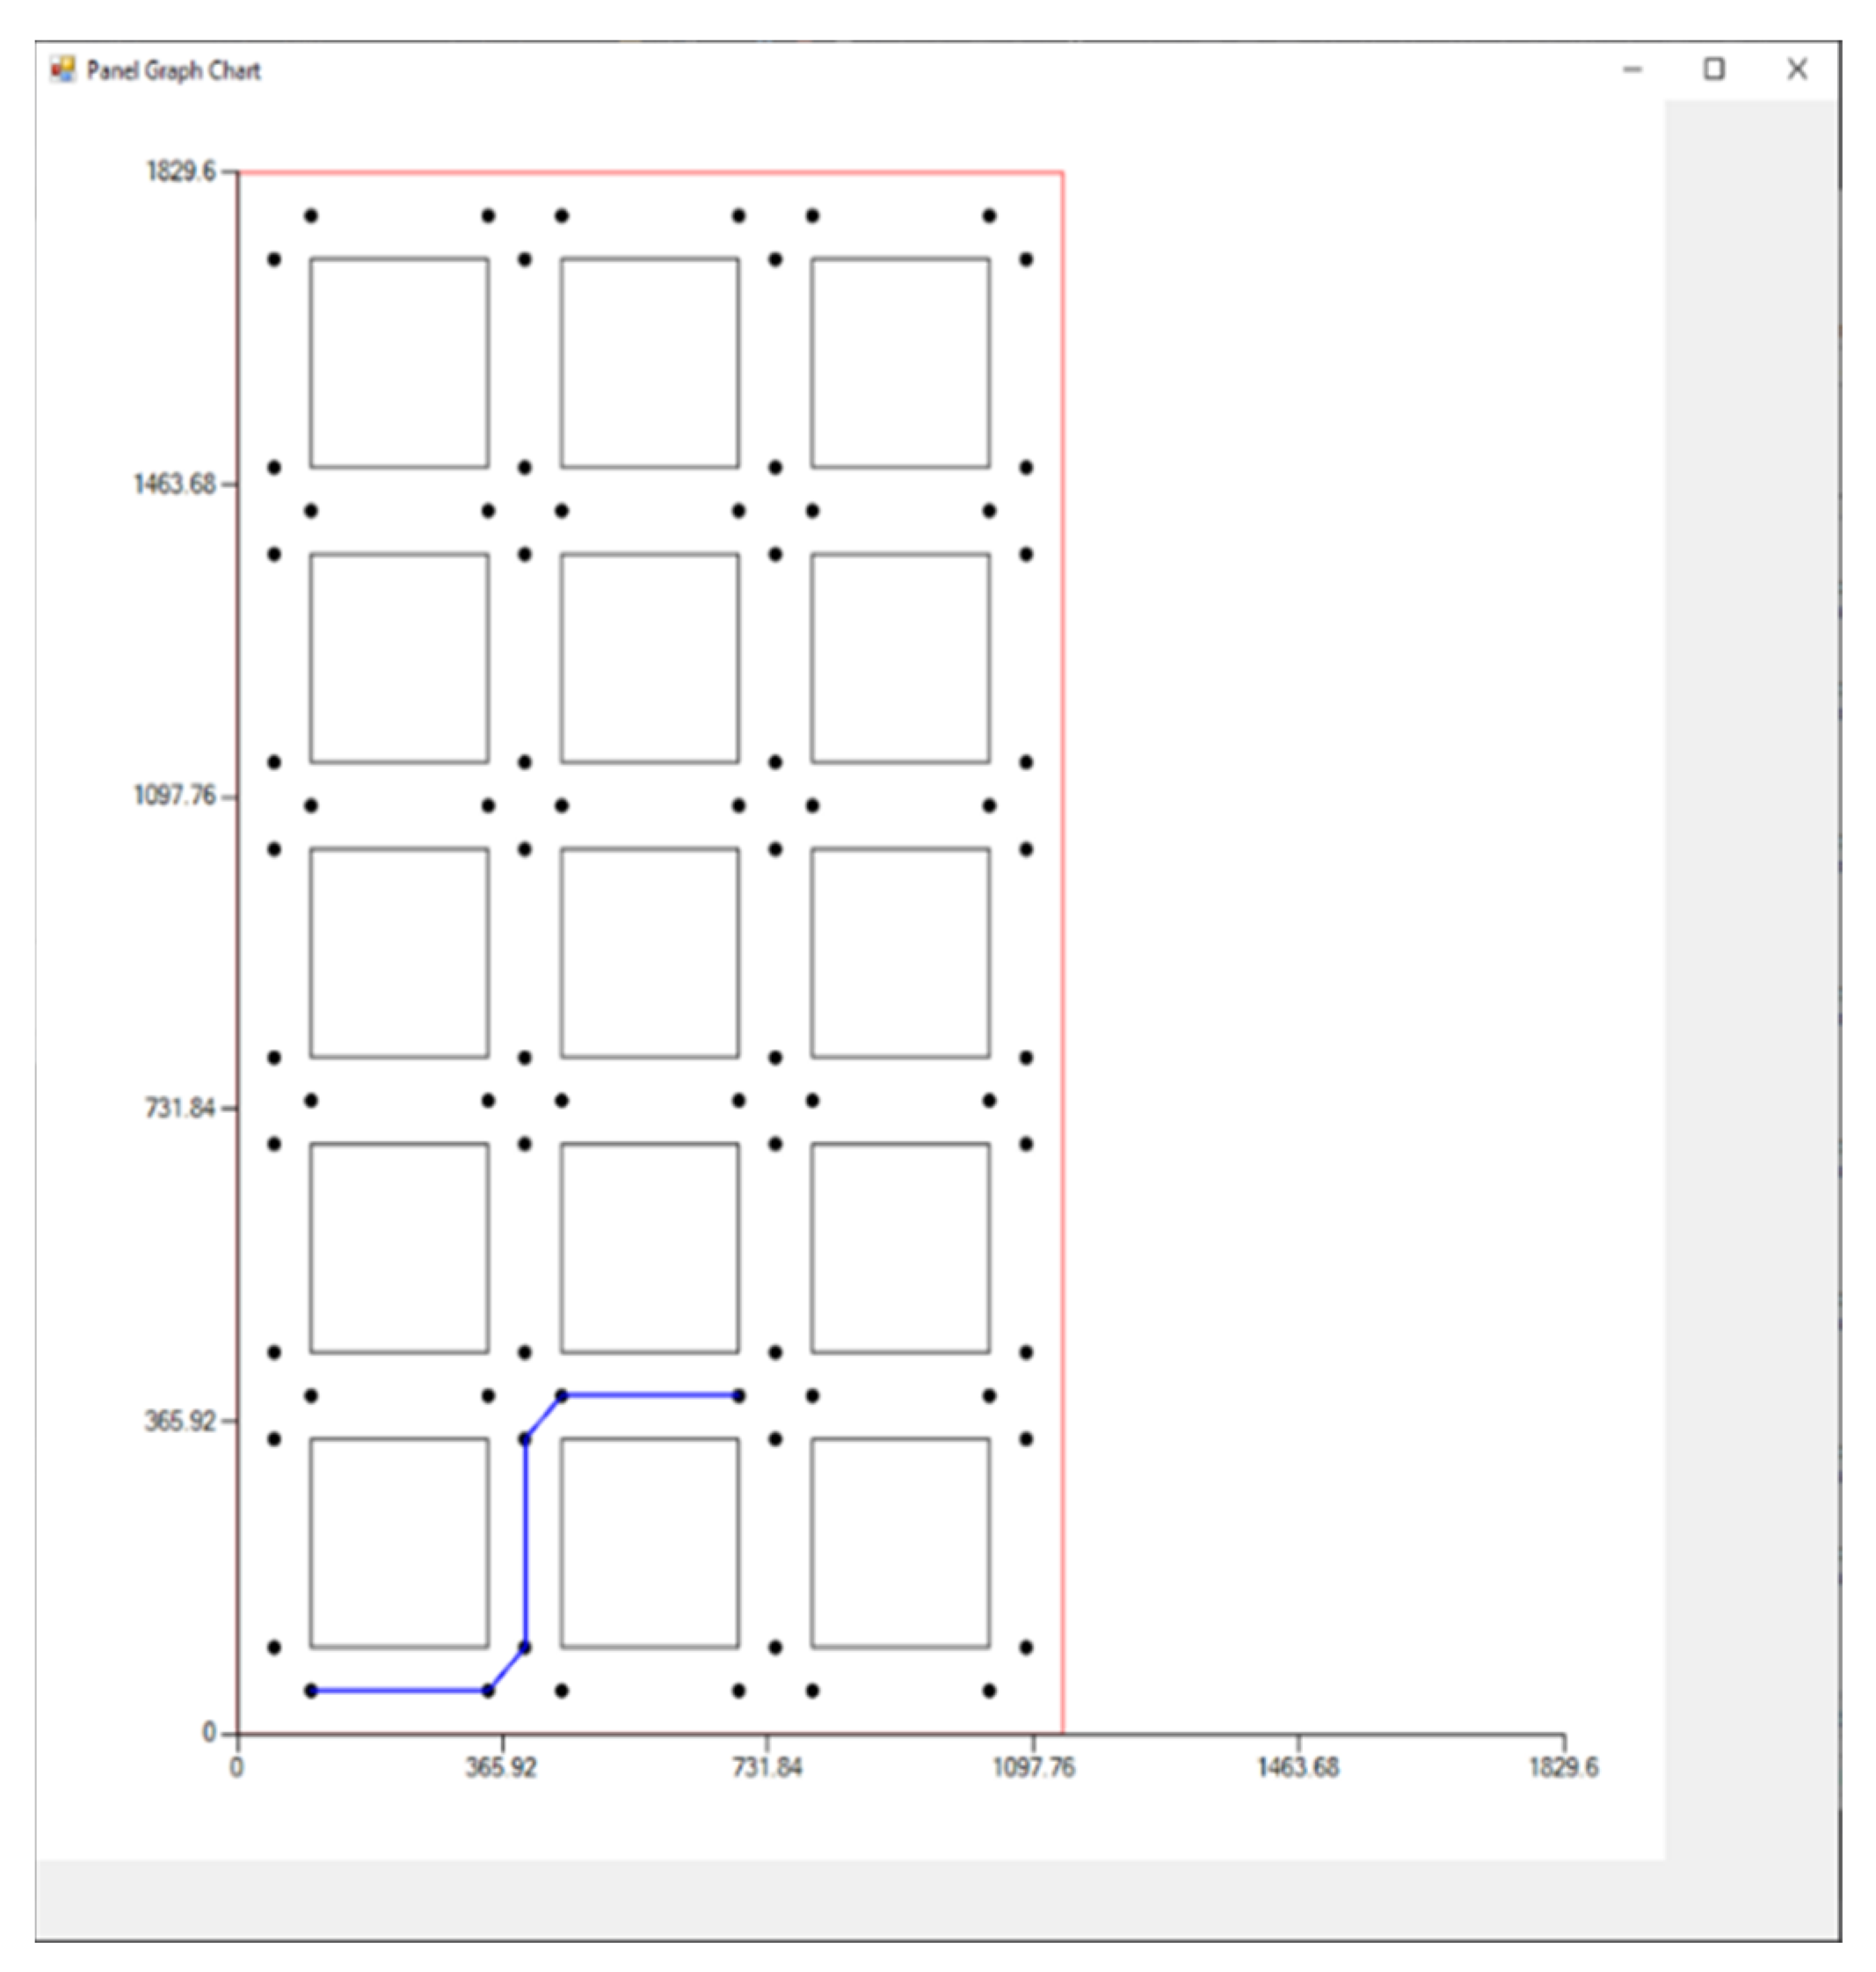
Path planning module: The path planning module provides two alternative ways for the interface user to create a mission for the shuttle car: a semiautonomous approach by creating a small number of abstract commands (instead of a relatively bigger number of low-level commands as in the main module) and a fully autonomous approach through utilization of graph theory (see
Figure 9 and
Figure 10).
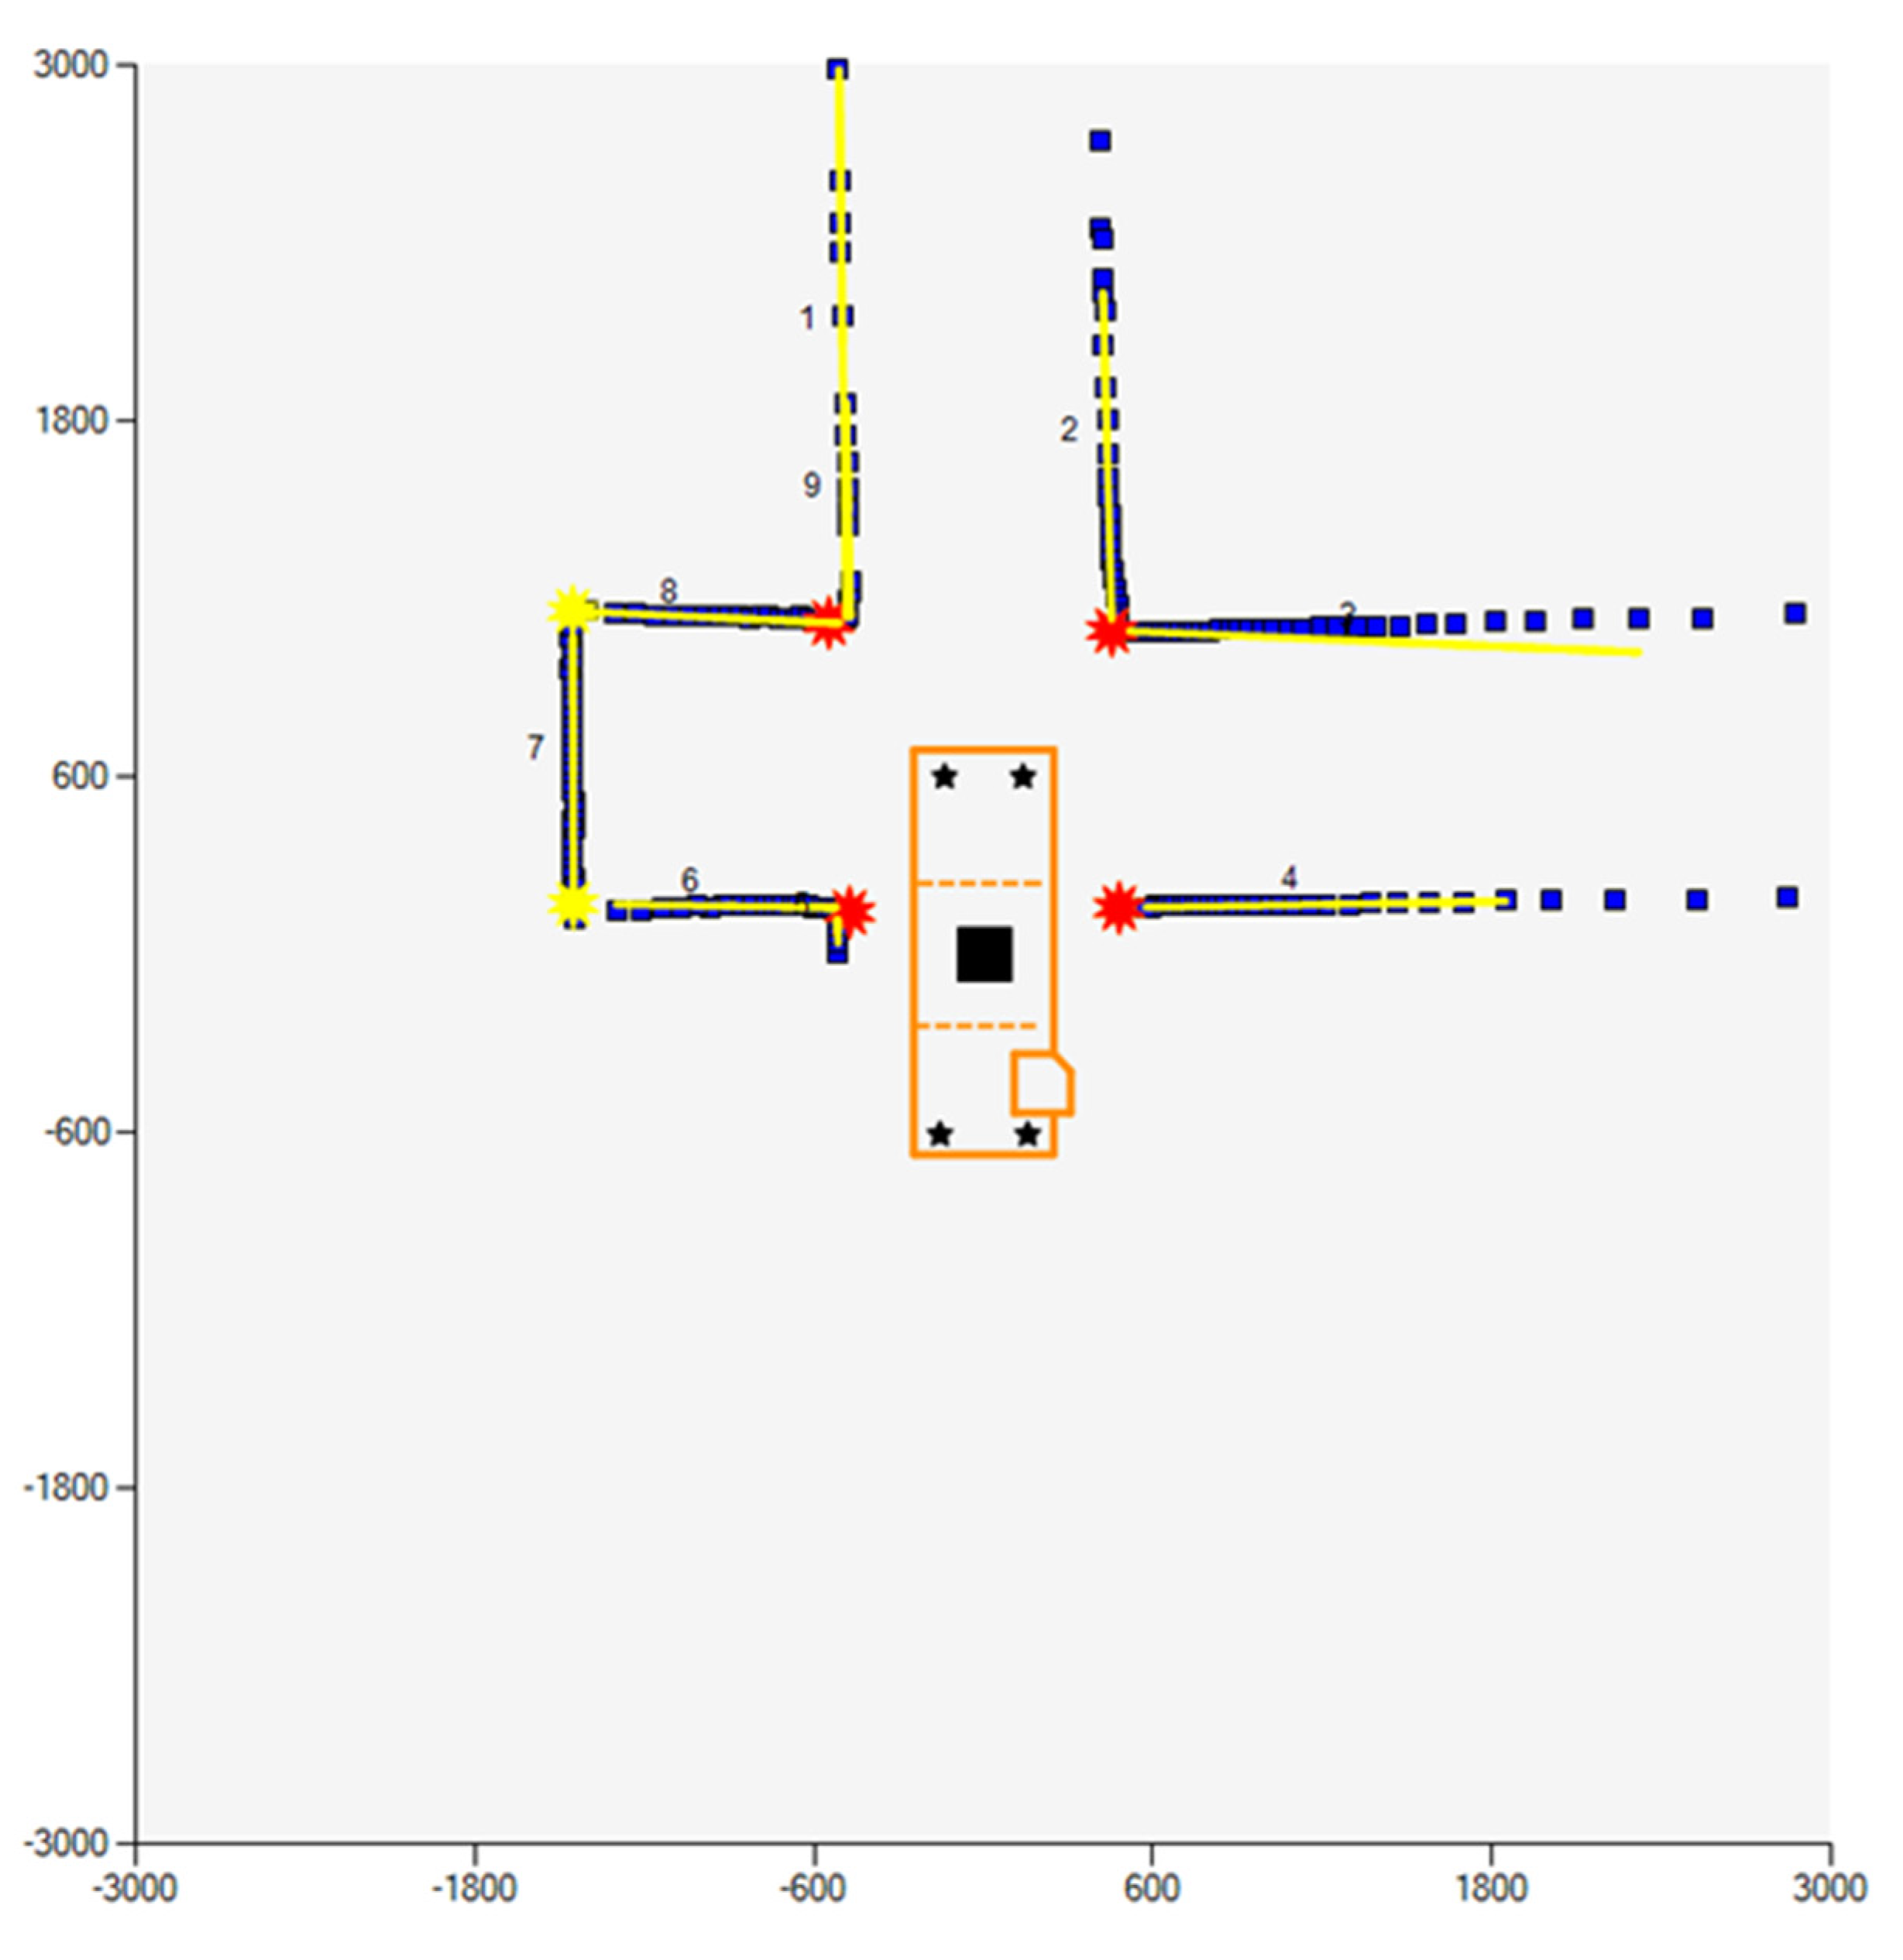
Mapping tool: The mapping tool interprets the data collected from the LiDAR scanners to create a map of the surroundings in real time. Subsequently, the tool extracts salient features from that map and stores their characteristics into parameters that are used as input for the decision agent module. The mapping tool form is used to visualize the data collected from the LiDAR units in real time. This provides a real-time map of the current surroundings of the vehicle up to a distance of 12 m (the range of the LiDAR units). The user can specify the refresh rate and the range of the size of the map (the map is always square). The latter parameter gives the user the ability to zoom in and out and observe points of interest (see
Figure 11).
Decision agent module: The decision agent module analyzes the latest available information about the surroundings and decides whether the current low-level command is safe to be executed or alternative corrective actions need to be taken.
Device control module: The device control module converts the decisions of the agent into appropriate PWM signals and controls the signal transfer to the RC and the radio receiver on board.
6. Conclusions
Data management systems play a crucial role in the implementation of an autonomous solution. Smart solutions are based on processing vast amounts of data collected by a carefully designed sensor network. Therefore, a reliable data management system is the backbone of the entire implementation, and its efficiency will directly determine the performance of the solution. The DMS implemented in the current research attempts to (i) efficiently store the data collected from the onboard sensors and (ii) make the data accessible to any client request. Both objectives need to be fulfilled in real time and with minimum latencies.
The necessity of developing three separate nodes, namely, the data collection node, the data management node, and the data processing and visualization node, was mandated by the large amount of collected data and the need to ensure uninterrupted and fast data storage and flow. Utilization of an SQL database server is one solution that allows for asynchronous, real-time, and reliable data management. Asynchronous access from multiple sources ensures that the data will not be lost because of conflicts between the different writing processes, as well as ensures that the data will be recorded in real time or near real-time speed. A similar concept applies to data requests from multiple clients.
However, one disadvantage of the three-node approach is that it introduces latencies that are associated with the data management node and the other two nodes. In general, the transmission latencies are defined by the quality of the Wi-Fi network and the length of the corresponding POST and GET messages sent to the server. The length of the message is defined by the type of sensor data. The server update rate for the LiDAR scanners is 7.35 Hz, while the rate for the ultrasonic sensors is 9.94 Hz. The average update rate for the LiDAR scanners as reported by the microcontrollers is 7.40 Hz. The difference between these two update rates is attributed to the handshake and transmission time between the SQL server and each microcontroller. The small difference indicates that the latency imposed by the communication network is negligible. The update rates of the ultrasonic sensors were not calculated on the microcontroller side because of the low overhead required to transmit and store a single measurement. This is confirmed by the measured frequency on the server side (9.94 Hz), which is very close to the maximum operating frequency of the ultrasonic sensors.
The speed of the different processes undertaken within one single decision cycle was evaluated. As expected, the most time within one decision cycle is spent in the creation of the map of the environment around the moving shuttle car (in this case, 25.2%). The acquisition of the latest sensor data consumes 10.8% of the total cycle time, and the determination of the optimal decision based on the newest map takes 5.9% of the cycle time. Finally, the execution of the optimal decision accounts for the remaining 58.1% of the cycle time. The average total time for one cycle with respect to data processing and visualization (e.g., retrieve and process the latest data and make a decision about the next optimal movement of the shuttle car prototype) is less than 900 ms. This includes the time required for the shuttle car to move for one time step. During the move time, the autonomous vehicle interface has already started processing the next decision cycle, which eliminates any interruptions in the movement of the prototype.


