Article

13C NMR Spectroscopic Studies of Intra- and Intermolecular Interactions of Amino Acid Derivatives and Peptide Derivatives in Solutions

1
Graduate School of Science and Technology, Hiroshima Institute of Technology, 2-1-1 Miyake, Saeki-ku, Hiroshima 731-5193, Japan
2
Graduate School of Engineering, Muroran Institute of Technology, 27-1, Mizumoto-cho, Muroran 050-8585, Japan
*
Authors to whom correspondence should be addressed.
Organics 2022, 3(1), 38-58; https://doi.org/10.3390/org3010003
Submission received: 23 October 2021 / Revised: 26 January 2022 / Accepted: 27 January 2022 / Published: 9 February 2022
(This article belongs to the Special Issue Feature Papers in Organics)

Abstract

:
13C NMR spectroscopic investigations were conducted for various amino acid derivatives and peptides. It was observed that 13C NMR chemical shifts of the carbonyl carbons are correlated with the solvent polarities, but the extent depends on the structures. The size of the functional groups and inter- and intra-molecular hydrogen bonding appear to be the major contributors for this tendency.

1. Introduction

NMR spectroscopy often serves as a useful tool for obtaining information about the chemical environment of various molecules in addition to structural elucidation [1,2,3]. These pieces of information include dipole–dipole forces, van der Waals interaction, hydrogen bonding etc., among sample molecules and/or solvents [4]. Various studies have been conducted for examining solvent effects with organic molecules with the use of NMR spectroscopy as well [5]. For example, hydrogen bonding and associated behaviors of organic molecules with water or acids in various solvents were monitored by 1H and/or 13C NMR spectroscopy [6,7].
Earlier, we reported that 13C NMR spectroscopy can monitor behaviors of carbonyl groups in various solvents with different polarities [8,9]. We found a correlation between 13C NMR chemical shifts of the carbonyl carbon of camphor and the solvent polarities ETN [10,11], and further evaluated the interaction between the camphor molecule and sodium dodecyl sulfate (SDS) in an aqueous solution [8]. We also found that the carbonyl carbons of various carboxylic acids and esters as well as carboxyl esters (half-esters) showed a correlation between the 13C NMR chemical shifts of carbonyl carbons and solvent polarity, and that the extent of the interaction between molecules or solvent can be dependent on the structures [9,12]. Here we have extended these studies to various amino acid derivatives and dipeptide derivatives. A fair number of spectroscopic studies have been reported for the properties and behaviors of amino acid and peptide derivatives [13,14,15]. In particular, proline is the only proteinogenic amino acid possessing the structure of a cyclic secondary amine. Due to this uniqueness, its conformational rigidity has been well documented; for example, it has been known as a breaker of secondary structure of proteins such as α-helices and β-sheets [16,17]. The unusually high percentages of the “cis” structures in the peptide bonds consisting of proline residues are also well investigated by NMR spectroscopy [18,19,20,21,22,23]. Therefore, the behaviors of peptides consisting of proline have been under close scrutiny.
In this study, 13C NMR chemical shifts of the carbonyl carbons were monitored for evaluation of the interaction between amino acid derivatives including dipeptides and various solvents with different polarities. For the purpose of understanding the behavior of the 13C NMR chemical shifts of carbonyl carbons in the dipeptides, the IR spectra of the dipeptide derivatives in chloroform and in acetonitrile solutions were also measured. In addition, the most stable structures of the dipeptide derivatives were analyzed by the density functional theory (DFT) calculations (B3LYP/6-31+G(d) level) and their IR spectra predicted by the vibrational analysis were compared with the observed IR spectra.

2. Materials and Methods

1H and 13C NMR spectra were recorded using JEOL JNM-ECZ400S NMR spectrometer operating at 400 MHz for 1H and 100.53 MHz for 13C experiments at 298.0 ± 1.0 K with 5 mm (o.d.) Pyrex glass tubes. Deuterated solvents, acetone-d6, acetonitrile-d3, chloroform-d, D2O, dimethyl sulfoxide-d6, and methanol-d4 and other reagents were purchased from Wako Pure Chemical Industries Ltd. (Japan). The compounds, N-Boc-L-alanine-OH 1a, N-Boc-L-valine-OH 2, N-Boc-L-proline-OH 3a, N-Boc-L-serine-OH 4a, N-Boc-L-threonine-OH 5, L-alanine methyl ester hydrochloride, L-serine methyl ester hydrochloride, and L-proline methyl ester hydrochloride were purchased from Tokyo Chemical Industry Co., Ltd. (Japan). The infrared spectra of dipeptide derivatives in chloroform and acetonitrile were recorded using HORIBA FT-720 Fourier transform infrared spectrometer and the demountable liquid cell. The demountable liquid cell consisted of CaF2 windows and Teflon spacer with a path length of 0.1 mm.

2.1. 13C NMR Measurements of Various Amino Acid Derivatives and Dipeptide Derivatives in Various Solvents

The concentration of the sample solutions was 25.0 ± 5.0 mmol/L. In the case of D2O solution, the chemical shifts were recorded with reference to TSP-d4 as an external standard. In the case of organic solutions, the chemical shifts were recorded with reference to the carbons in the used solvent as an internal standard (acetone-d6, δ 29.8; acetonitrile-d3, δ 1.3; benzene-d6, δ 128.0; chloroform-d, δ 77.0; dimethyl sulfoxide-d6, δ 39.5; methanol-d4, δ 49.0). In the case of ethanol and tetrahydrofuran solutions, the 13C NMR spectra were recorded using the No-Deuterium Proton NMR technique, and the chemical shifts were referenced to the used solvent as an internal standard (ethanol, δ 56.8; tetrahydrofuran δ 67.4). The ETN values utilized in this work are as follows: tetrahydrofuran, ETN 0.207; chloroform-d, ETN 0.259; acetone-d6, ETN 0.355; dimethyl sulfoxide-d6, ETN 0.444; acetonitrile-d3, ETN 0.460; ethanol, ETN 0.654; methanol-d4, ETN 0.762; D2O, ETN 1.000 [10].
In the measurement of 13C NMR spectra of the amino acid derivatives and dipeptide derivatives, the 13C NMR chemical shifts of the carbonyl carbons of the major isomer was adopted for each compound when the rotational isomers across the amide bond were observed. In this way the 13C NMR chemical shifts in relation to the solvent polarity were monitored. The 13C NMR chemical shifts of the carbonyl carbons in the amino acid derivatives and dipeptide derivatives in various solvents are listed in Tables S13–S17 (Supplementary Materials).

2.2. General Procedure for Methylation of N-Boc-Protected Amino Acids

N-Boc-L-alanine-OMe 1b, N-Boc-L-proline-OMe 3b, and N-Boc-L-serine-OMe 4b were prepared by methylation with the use of trimethylsilyl diazomethane (TMSCHN2) of corresponding acids 1a, 3a, and 4a, respectively [24,25].

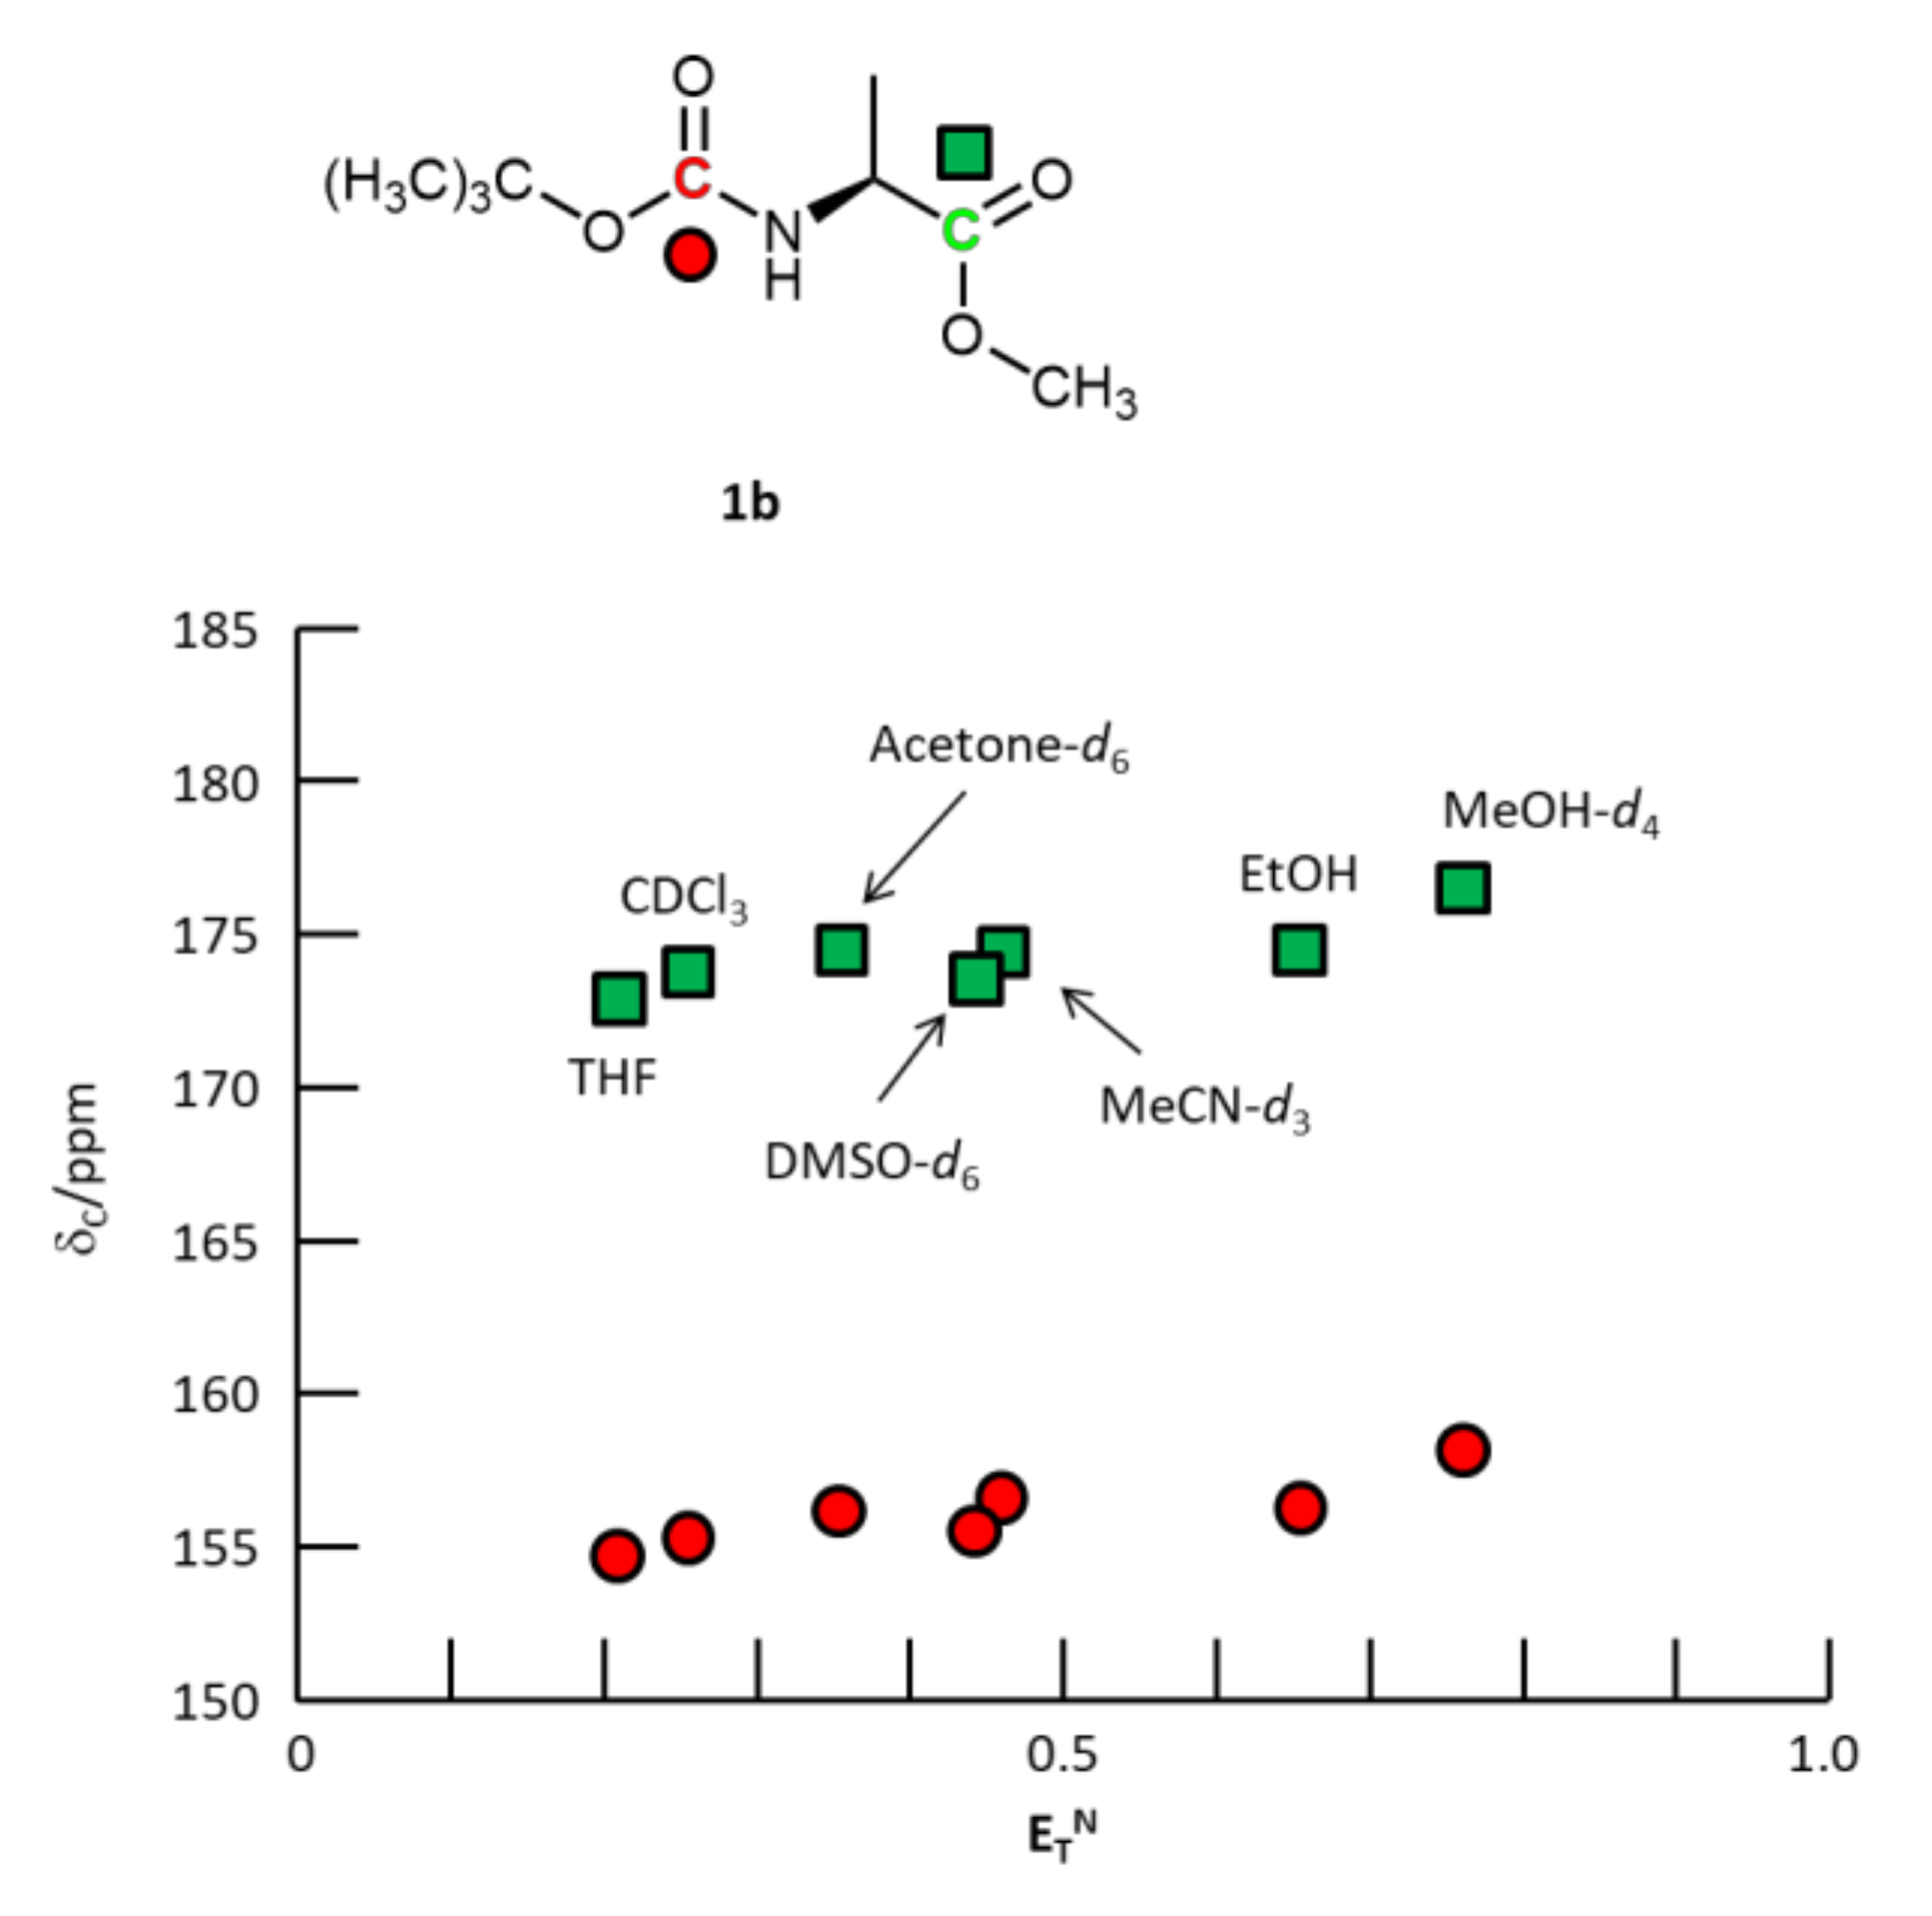
2.2.1. N-Boc-L-alanine-OMe 1b

To a stirred solution of 97 mg (0.51 mmol) of N-Boc-L-alanine-OH 1a in 5.0 mL of toluene-methanol (3:1), 1.7 mL of hexane solution of 10% TMSCHN2 (1.02 mmol) was added dropwise until the yellow color persisted. The mixture was stirred for 1 h at room temperature and concentrated in vacuo. The residue was purified by column chromatography on silica gel (hexane-ethyl acetate = 9:1) to afford 61 mg (0.30 mmol) of N-Boc-L-alanine-OMe 1b. Yield 58.4%. 1H NMR (CDCl3): 1.38 (d, J = 7.2 Hz, 3H, CH(CH3)); 1.44 (s, 9H, C(CH3)3); 3.74 (s, 3H, OCH3); 4.32 (m, 1H, CH(CH3)). 13C NMR (CDCl3): 18.7 (CH(CH3)); 28.3 (C(CH3)3); 49.1 (CH(CH3)); 52.3 (OCH3); 79.9 (C(CH3)3); 155.4 (CO-OtBu); 174.2 (CO-OCH3).

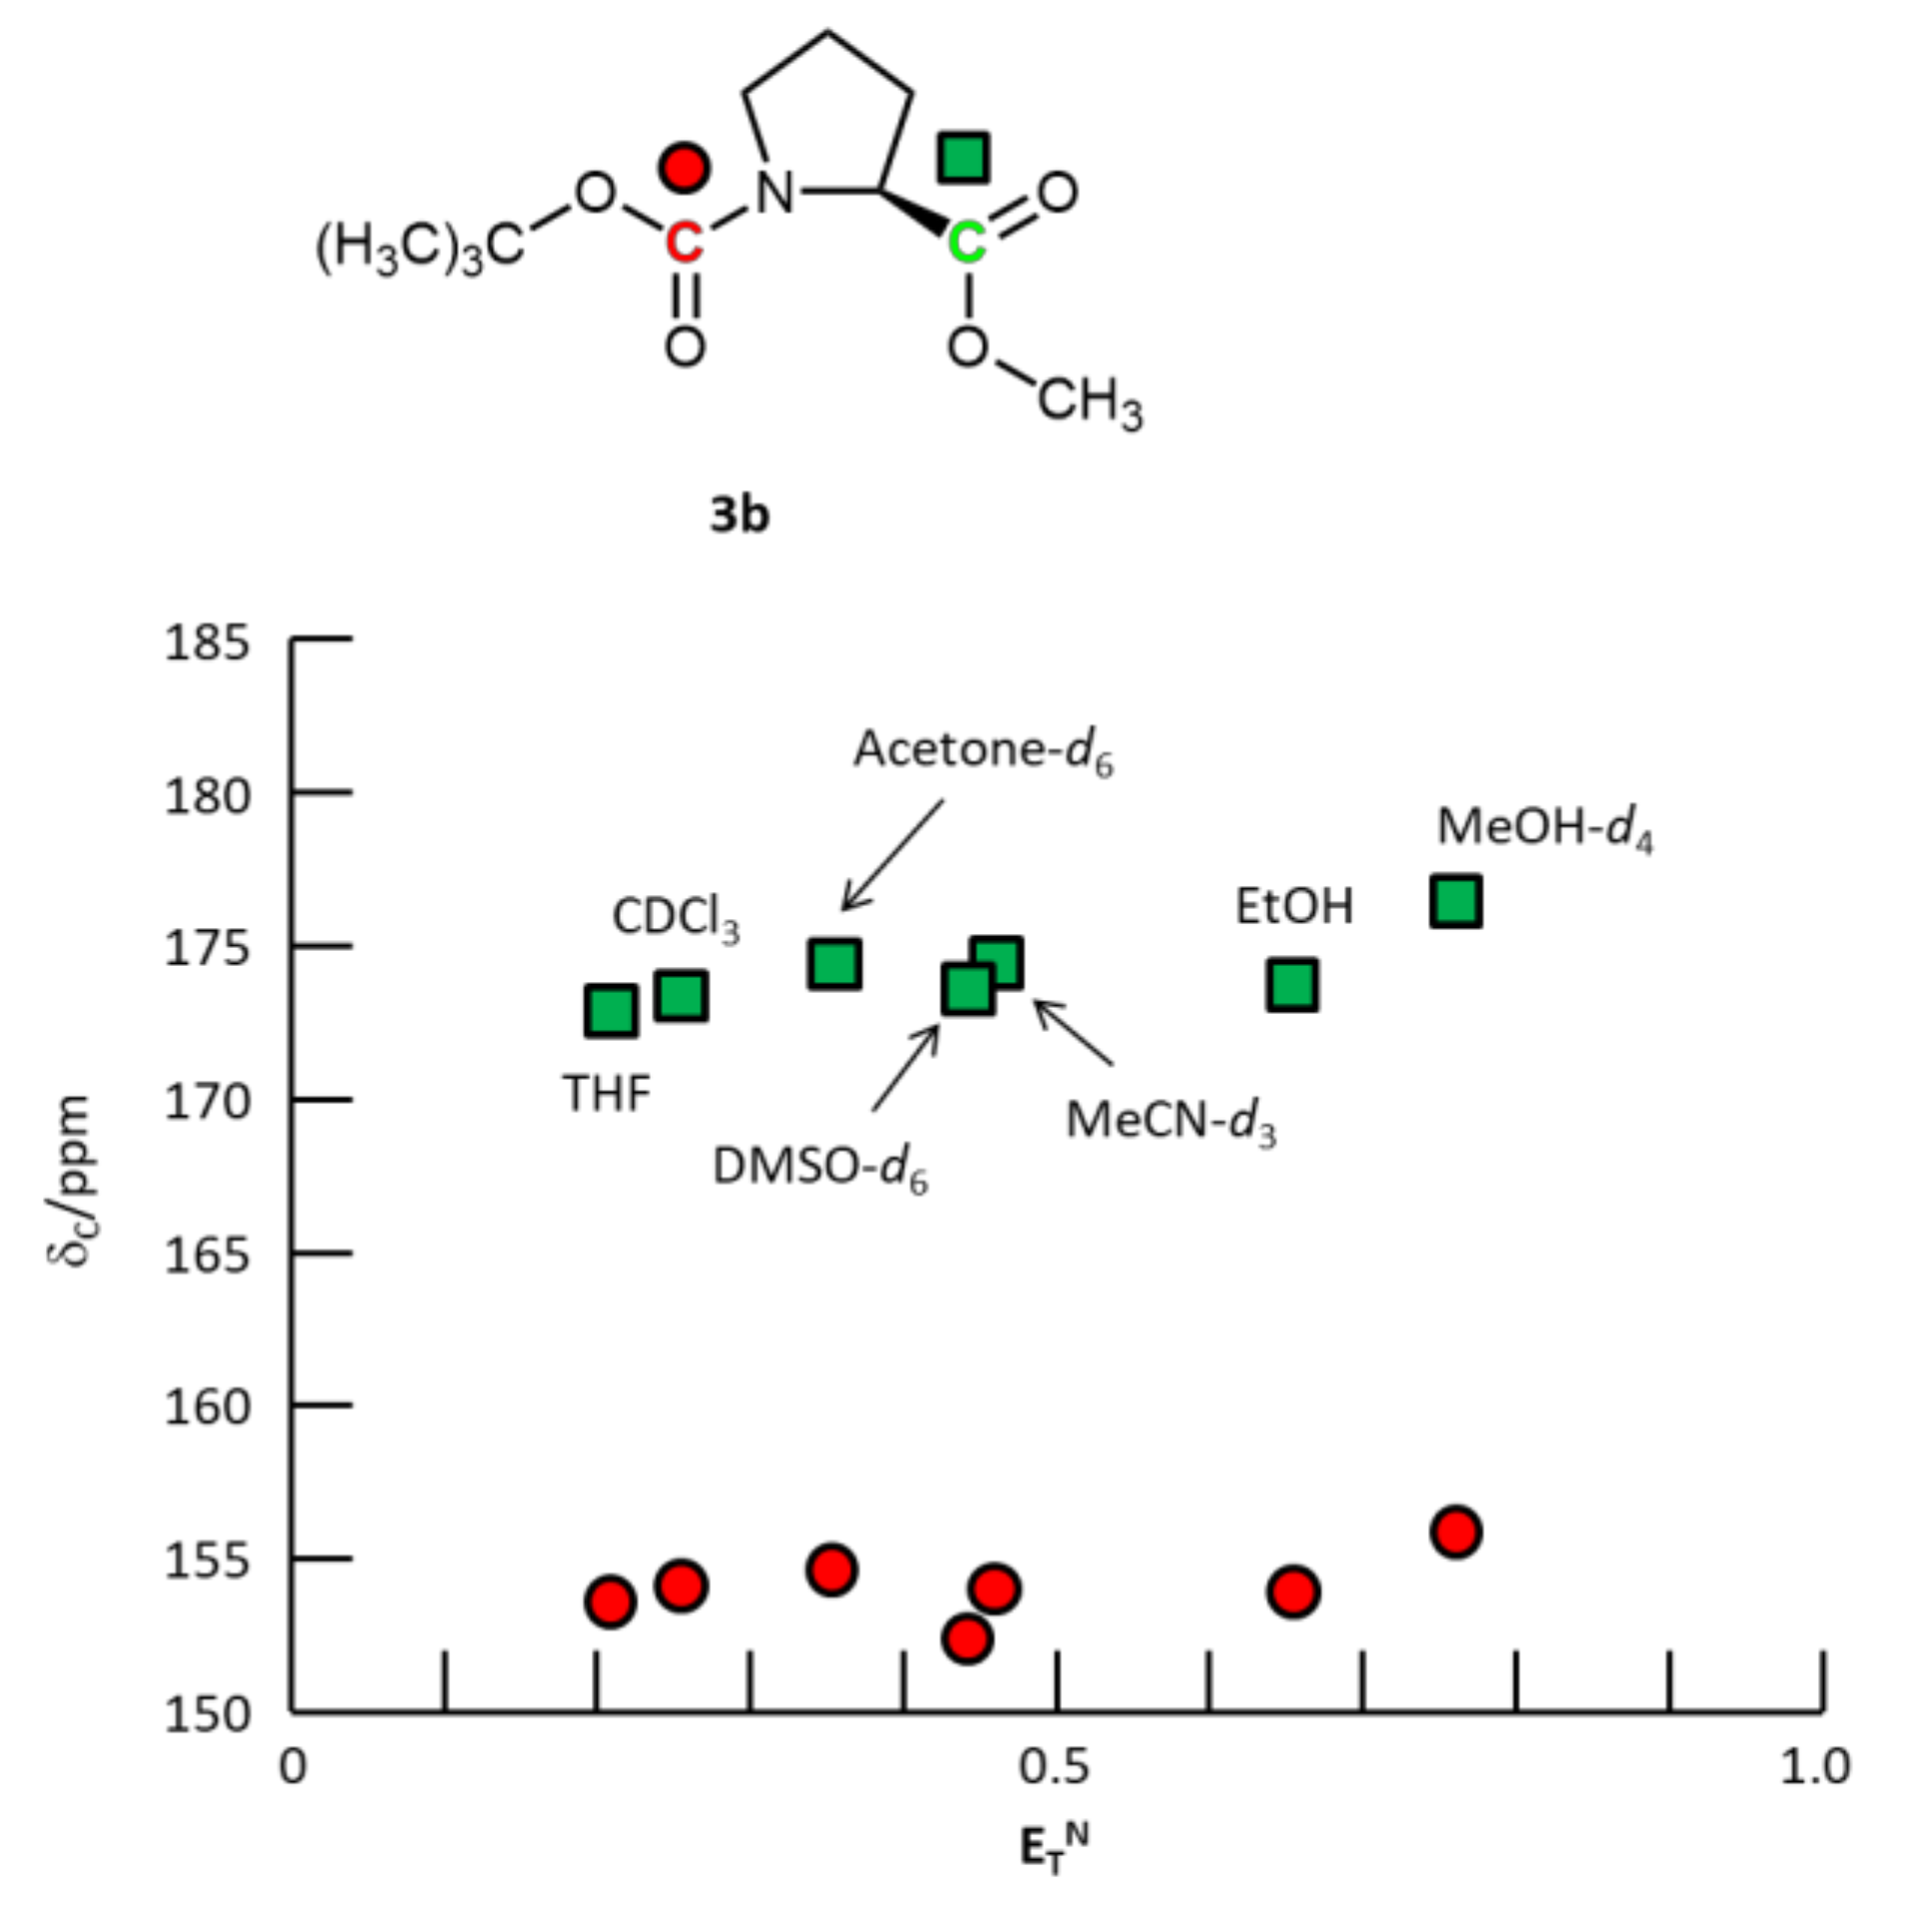
2.2.2. N-Boc-L-proline-OMe 3b

N-Boc-L-proline-OMe 3b (50 mg, 0.22 mmol) was prepared from N-Boc-L-proline-OH 3a (109 mg, 0.51 mmol) according to the same procedure described above. Yield 43.1%. 1H NMR (CDCl3): 1.41 (s, 9H, C(CH3)3); 1.82–1.87 (m, 2H, CH2); 2.12–2.28 (m, 2H, CH2); 3.37–3.58 (m, 2H, CH2); 3.72 (s, 3H, OCH3); 4.20–4.32 (m, 1H, CH). 13C NMR (CDCl3): 23.7 (CH2); 28.3 (C(CH3)3); 30.9 (CH2); 46.3 (CH2); 51.9 (OCH3); 59.1 (CH); 79.8 (C(CH3)3); 154.4 (CO-OtBu); 173.8 (CO-OCH3).

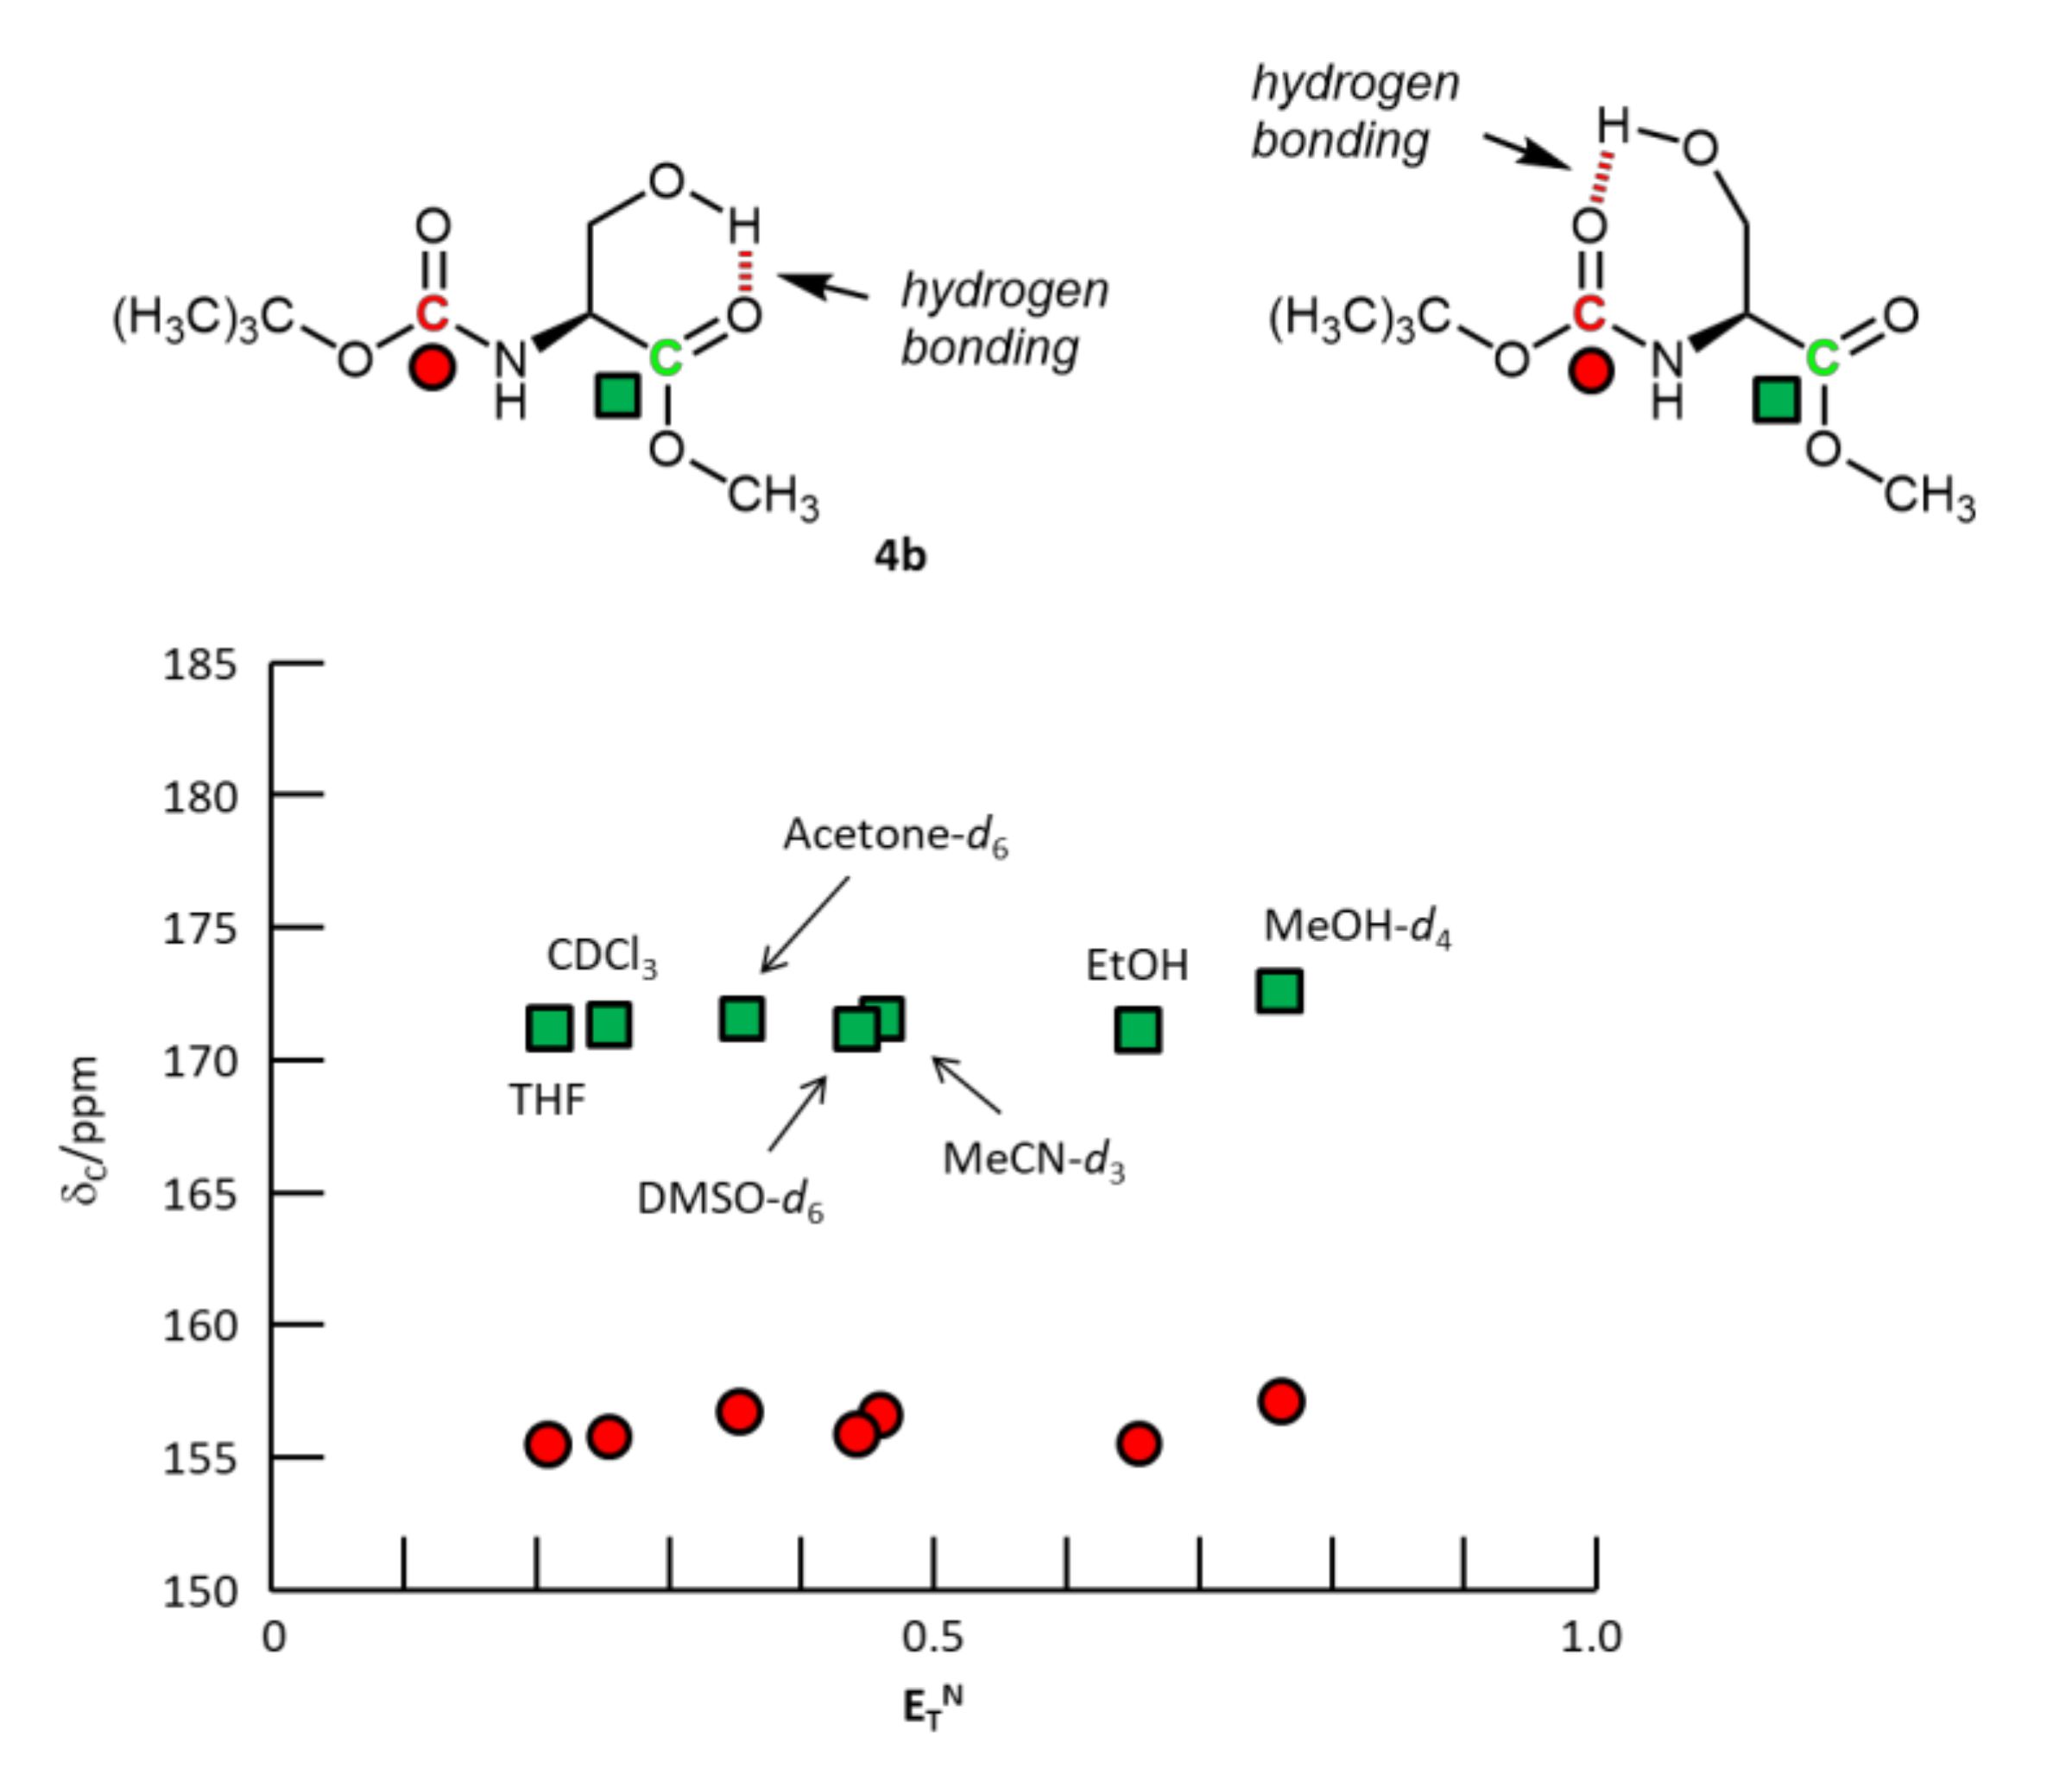
2.2.3. N-Boc-L-serine-OMe 4b

N-Boc-L-serine-OMe 4b (61 mg, 0.28 mmol) was prepared from N-Boc-L-serine-OH 4a (110 mg, 0.54 mmol) according to the same procedure described above. Yield 51.9%. 1H NMR (CDCl3): 1.44 (s, 9H, C(CH3)3); 3.79 (s, 3H, OCH3); 3.88–3.98 (m, 2H, CH2O); 4.39 (m, 1H, CH). 13C NMR (CDCl3): 28.3 (C(CH3)3); 52.7 (OCH3); 55.7 (CH); 63.6 (CH2O); 80.4 (C(CH3)3); 155.7 (CO-OtBu); 171.2 (CO-OCH3).

2.3. General Procedure for Preparation of N-Boc-Protected Dipeptide Derivatives

N-Boc-L-proline-L-alanine-OMe 6, N-Boc-L-proline-L-serine-OMe 7, N-Boc-L-proline-OMe 8, N-Boc-L-alanine-L-proline-OMe 9, and N-Boc-L-serine-L-proline-OMe 10 were prepared from the corresponding N-Boc-protected amino acid and the amino acid methyl ester with N,N′-dicyclohexylcarbodiimide (DCC) as a coupling reagent [26,27].

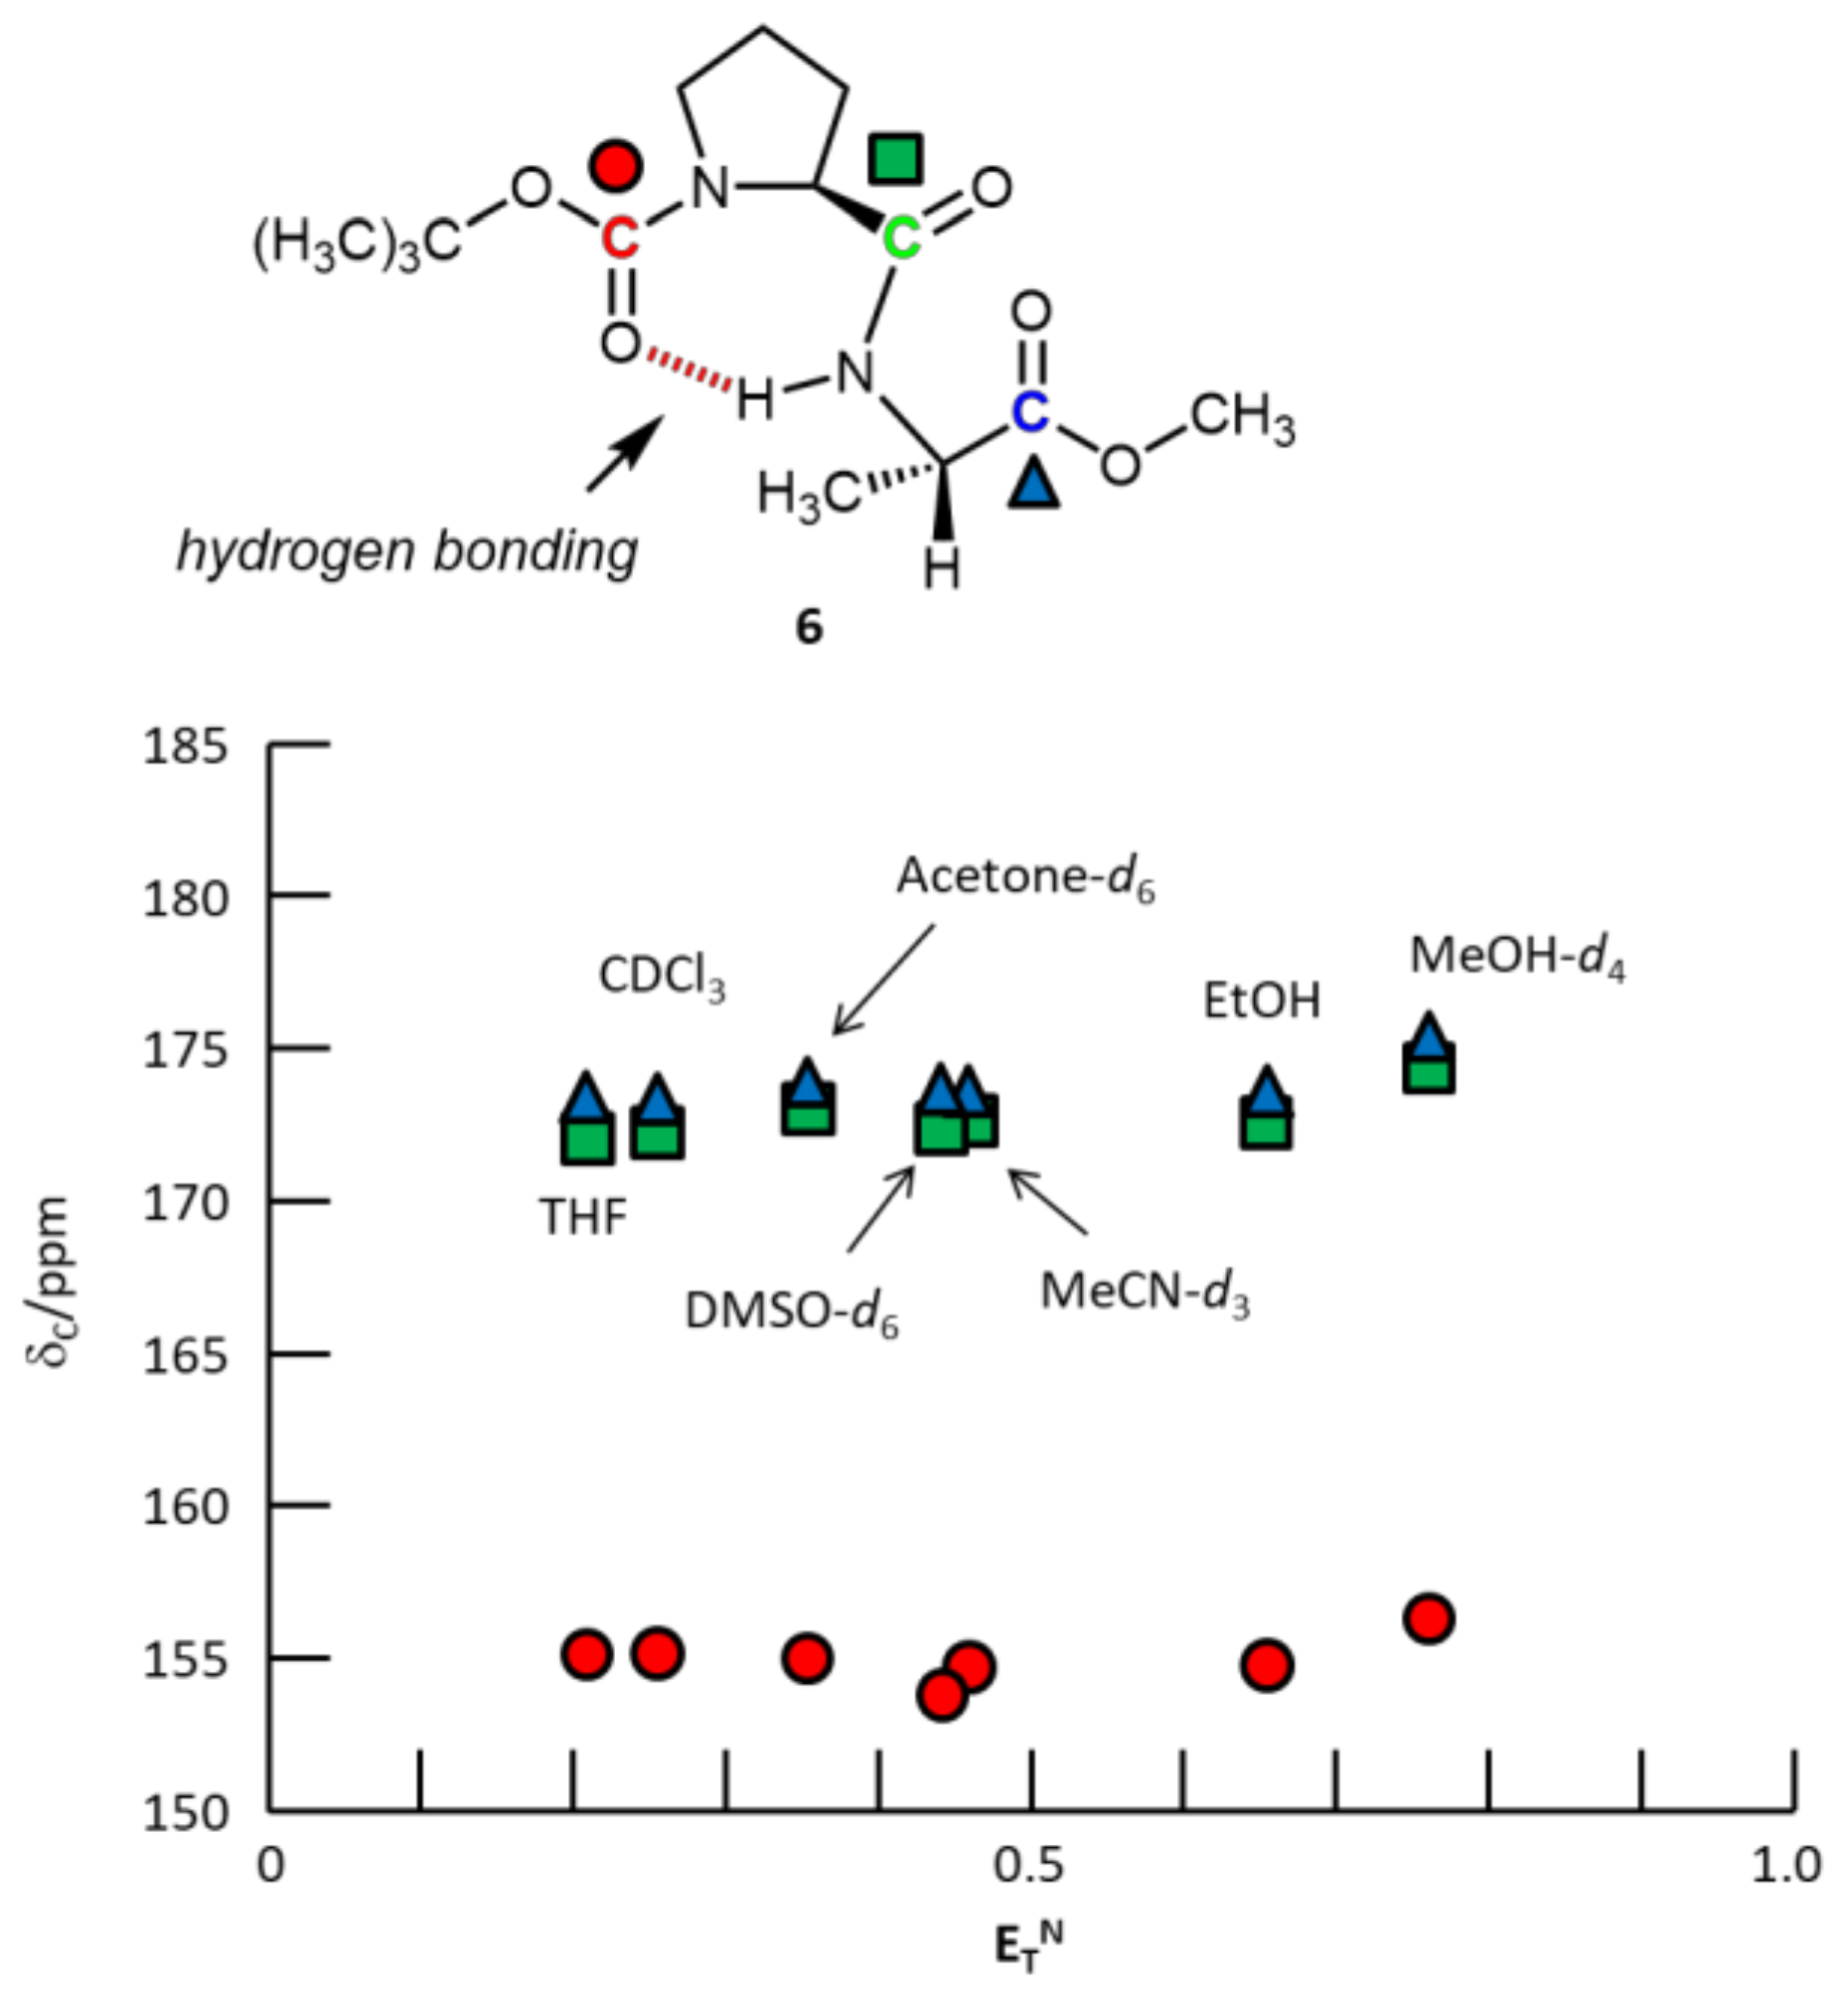
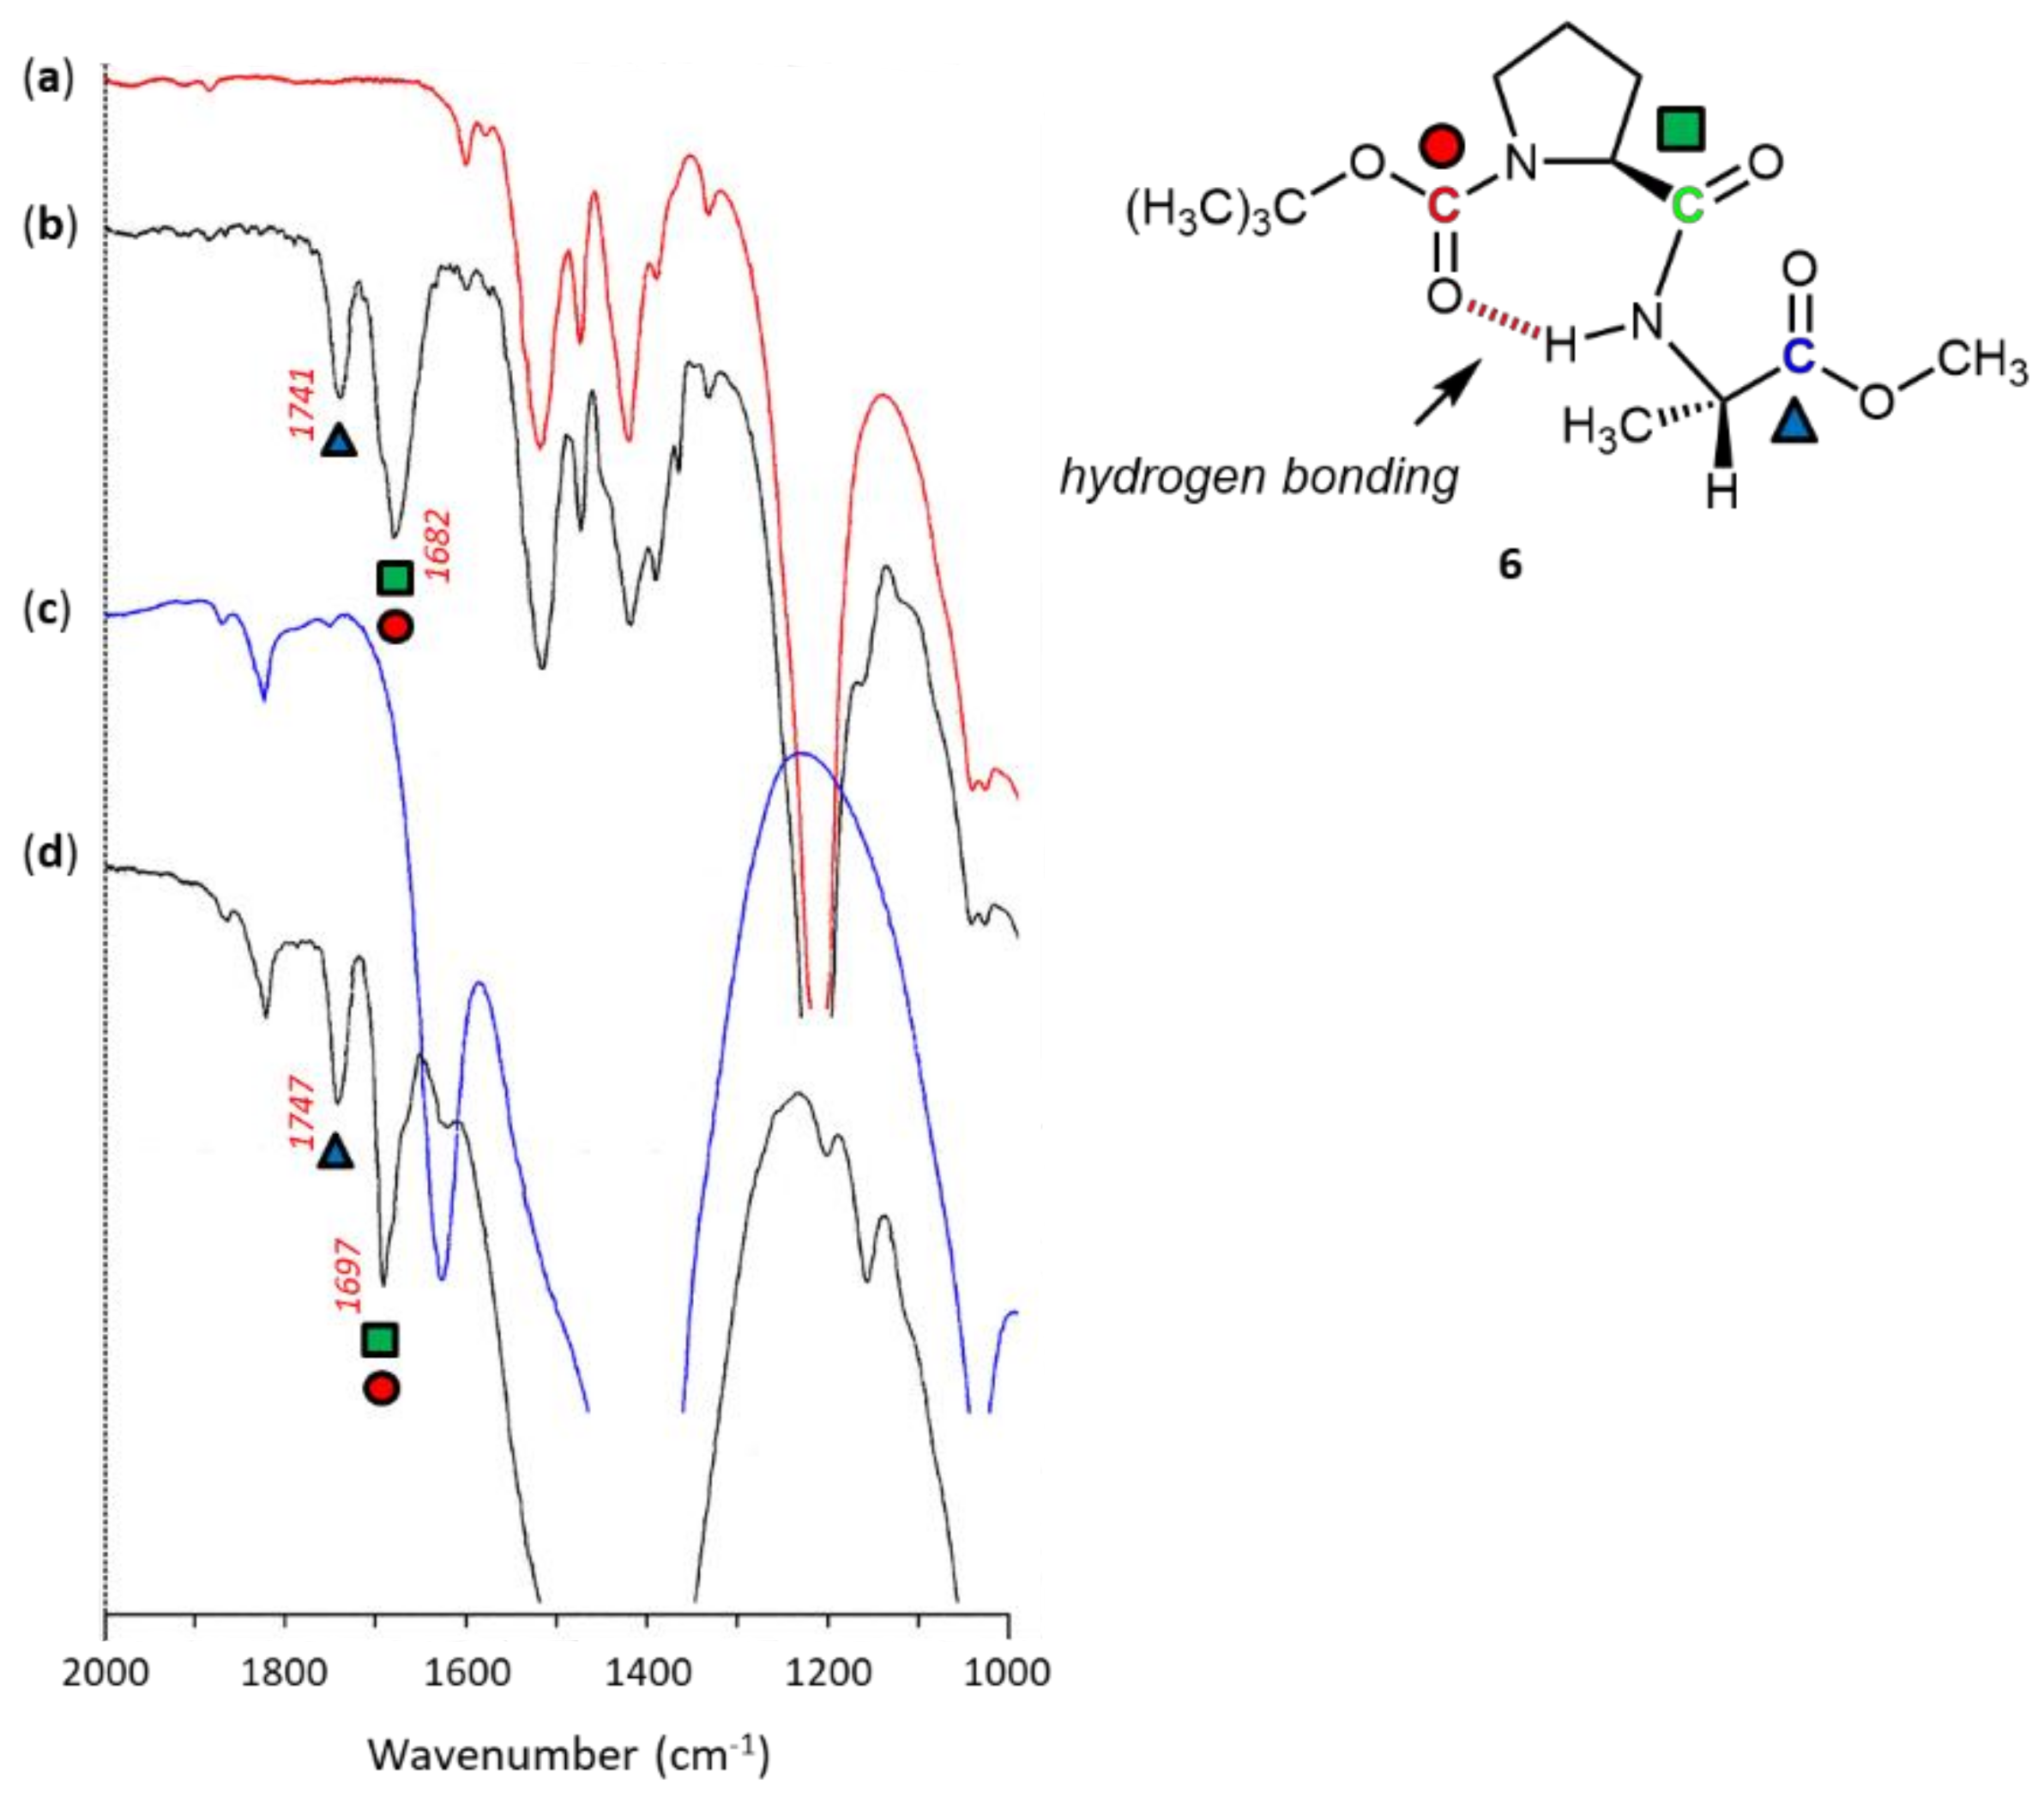
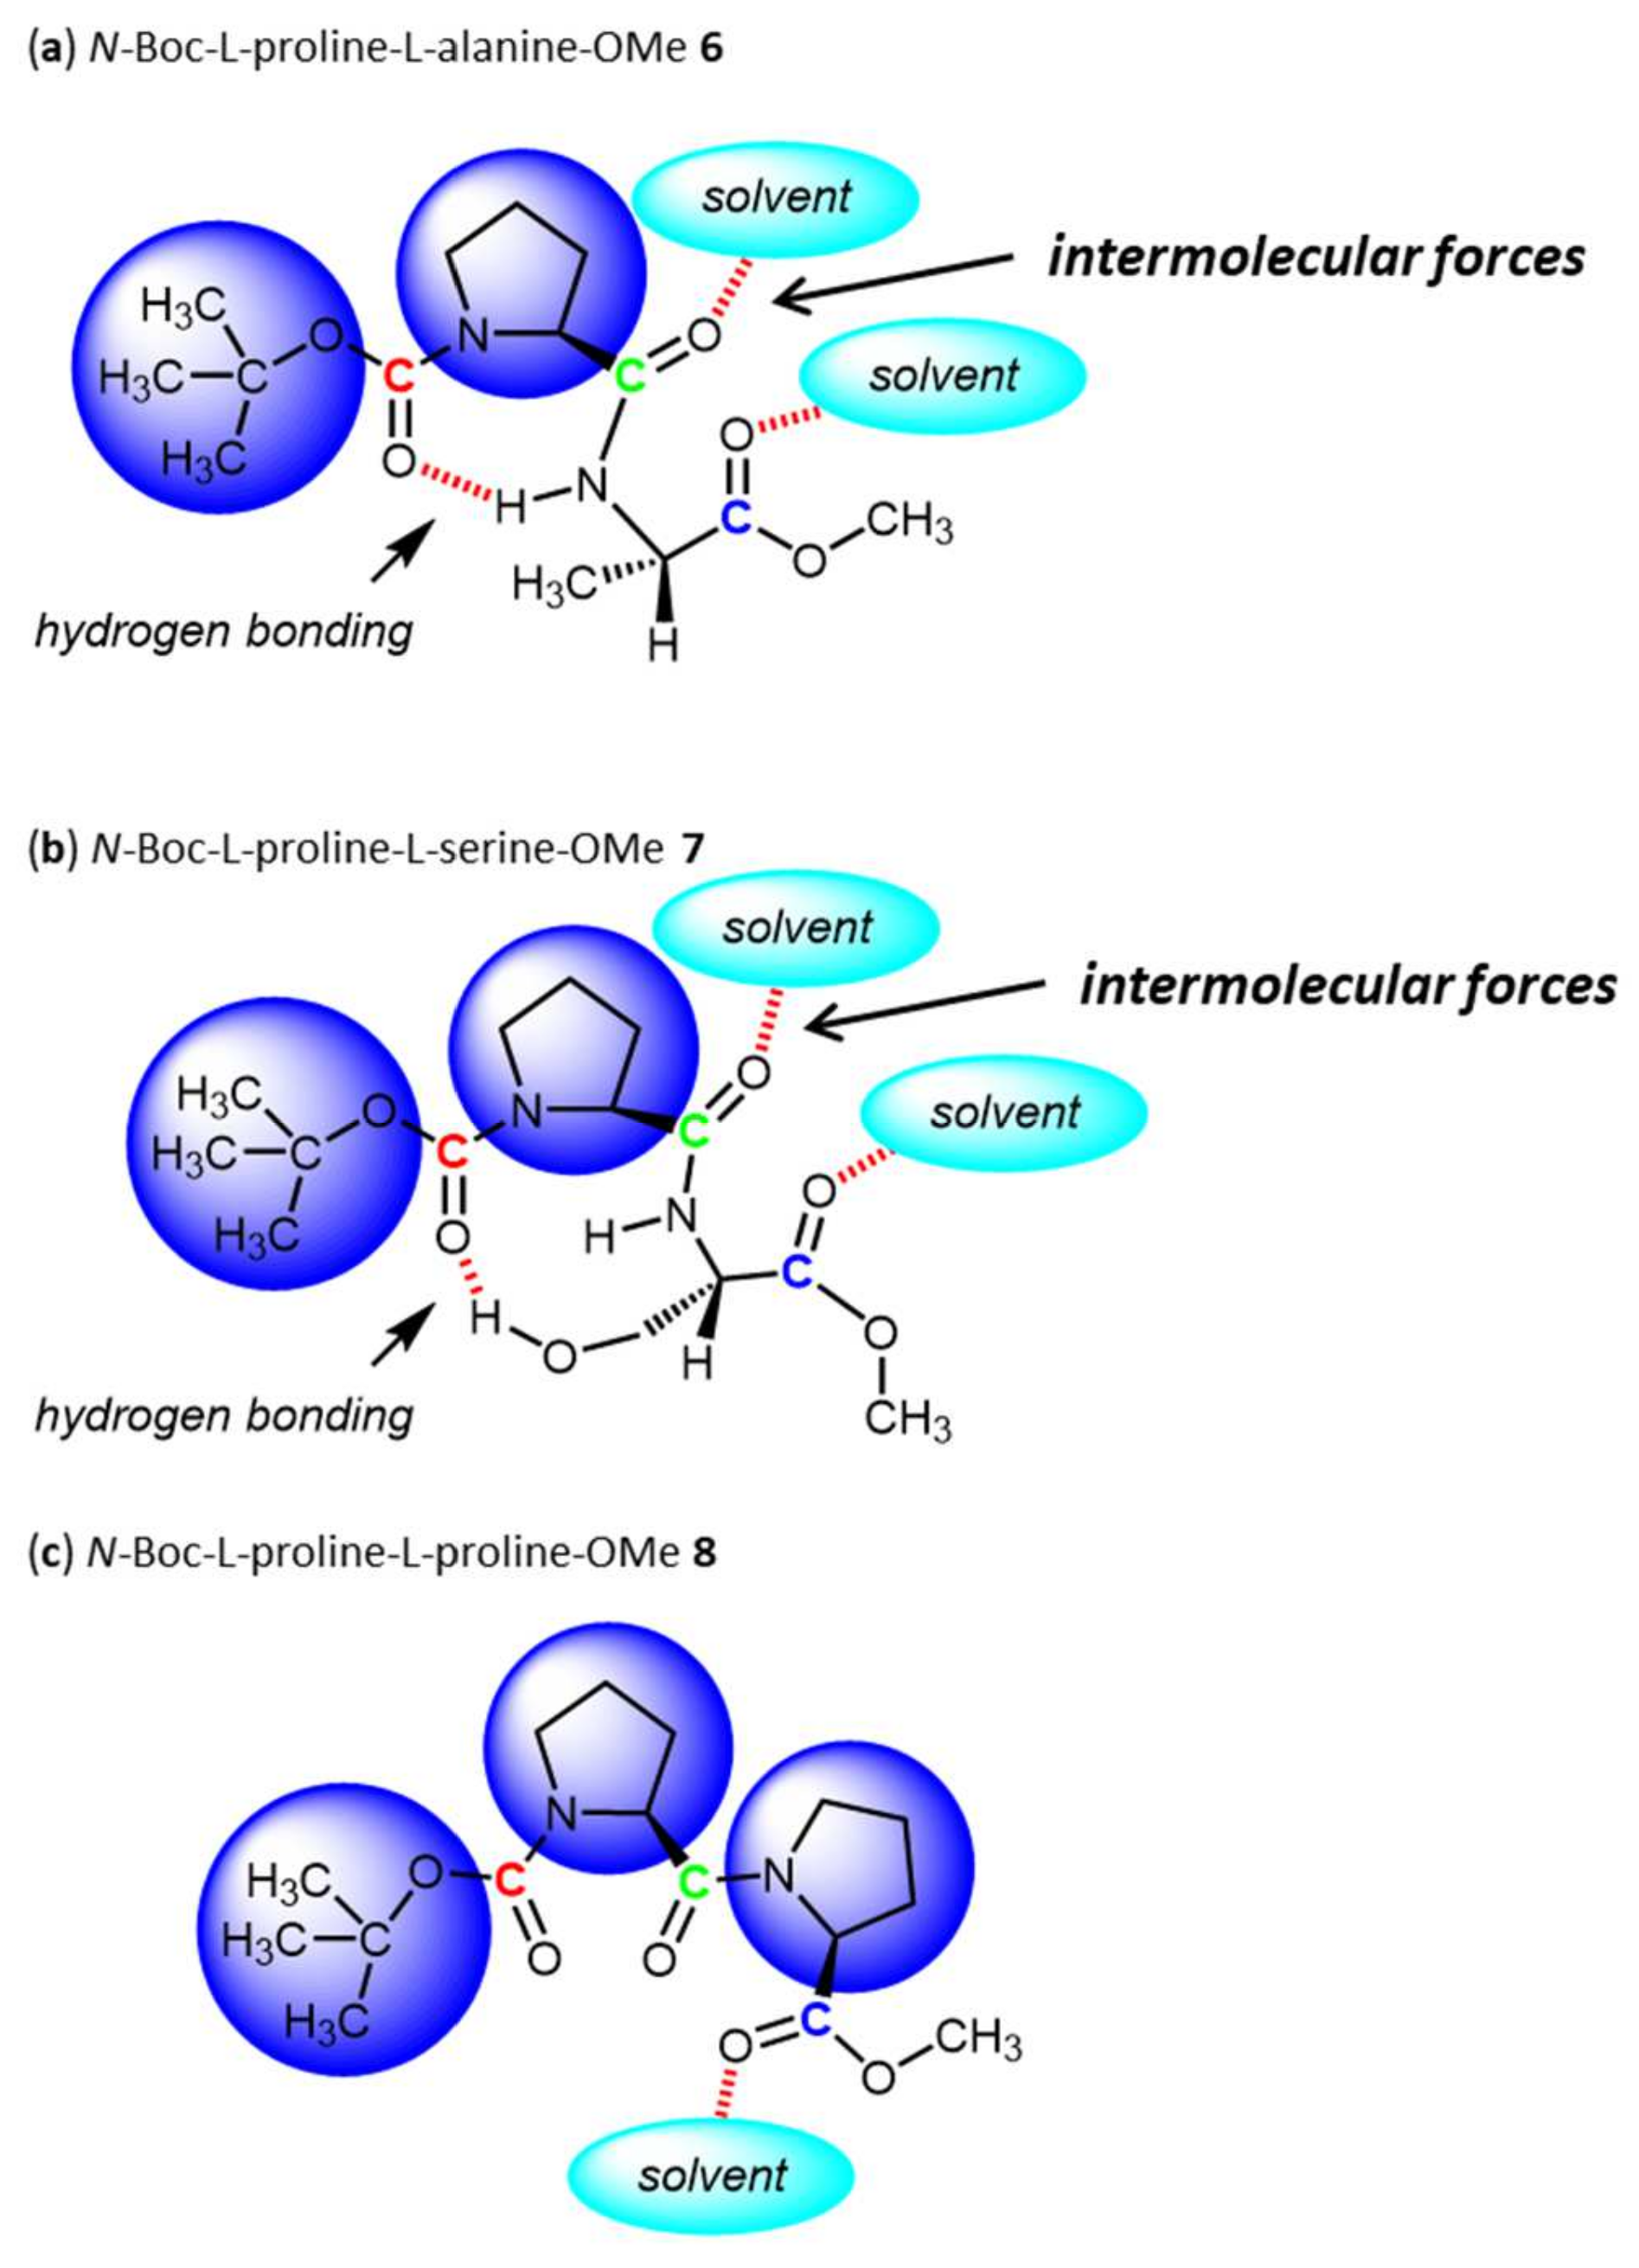
2.3.1. N-Boc-L-proline-L-alanine-OMe 6

L-Alanine methyl ester hydrochloride (1.040 g, 7.45 mmol) was suspended in 20.0 mL of CH2Cl2 and the suspension was cooled to 0 °C. Anhydrous triethylamine (1.0 mL, 7.2 mmol), N-Boc-proline-OH 2a (2.154 g, 10.01 mmol) suspended in 10.0 mL of CH2Cl2, and the solution of DCC (2.072 g, 10.04 mmol) dissolved in 10.0 mL of CH2Cl2 was added to this suspension. The reaction mixture was stirred for 1 h at 0 °C and for 5 h at room temperature. The precipitated dicyclohexylurea was then filtered off and washed with CH2Cl2. The combined filtrate was washed successively with 5% NaHCO3 aqueous solution, water, 1 mol/L HCl aqueous solution, and water. The organic phase was then dried using anhydrous Na2SO4 and the solvent was removed in vacuo. The residue was purified by column chromatography on silica gel (hexane-ethyl acetate = 1:1) to afford 1.402 g of N-Boc-L-proline-L-alanine-OMe 6 as colorless solid. M.p. 31–32 °C. Yield 62.6%. 1H NMR (CDCl3): 1.35 (d, J = 7.1 Hz, 2H, CH(CH3)); 1.45 (s, 9H, C(CH3)3); 1.80–2.00 (m, 2H, CH2); 2.05–2.36 (m, 2H, CH2); 3.27–3.52 (m, 2H, CH2); 3.73 (s, 3H, OCH3); 4.25 (m, 1H, CH(CH3)); 4.54 (m, 1H, CH). The amino proton was not observed because of broadening of the signal. 13C NMR (CDCl3): 18.5 (18.3) (CH(CH3)); 24.5 (23.7) (CH2); 28.3 (C(CH3)3); 30.8 (32.9) (CH2); 47.0 (47.9) (CH2); 52.3 (OCH3); 59.7 (CH); 61.0 (CH); 80.4 (C(CH3)3); 155.6 (154.6) (CO-OtBu); 171.7 (172.1) (CO-NH); 173.1 (CO-OCH3) (The chemical shifts in parentheses are for the minor amide rotational isomer).

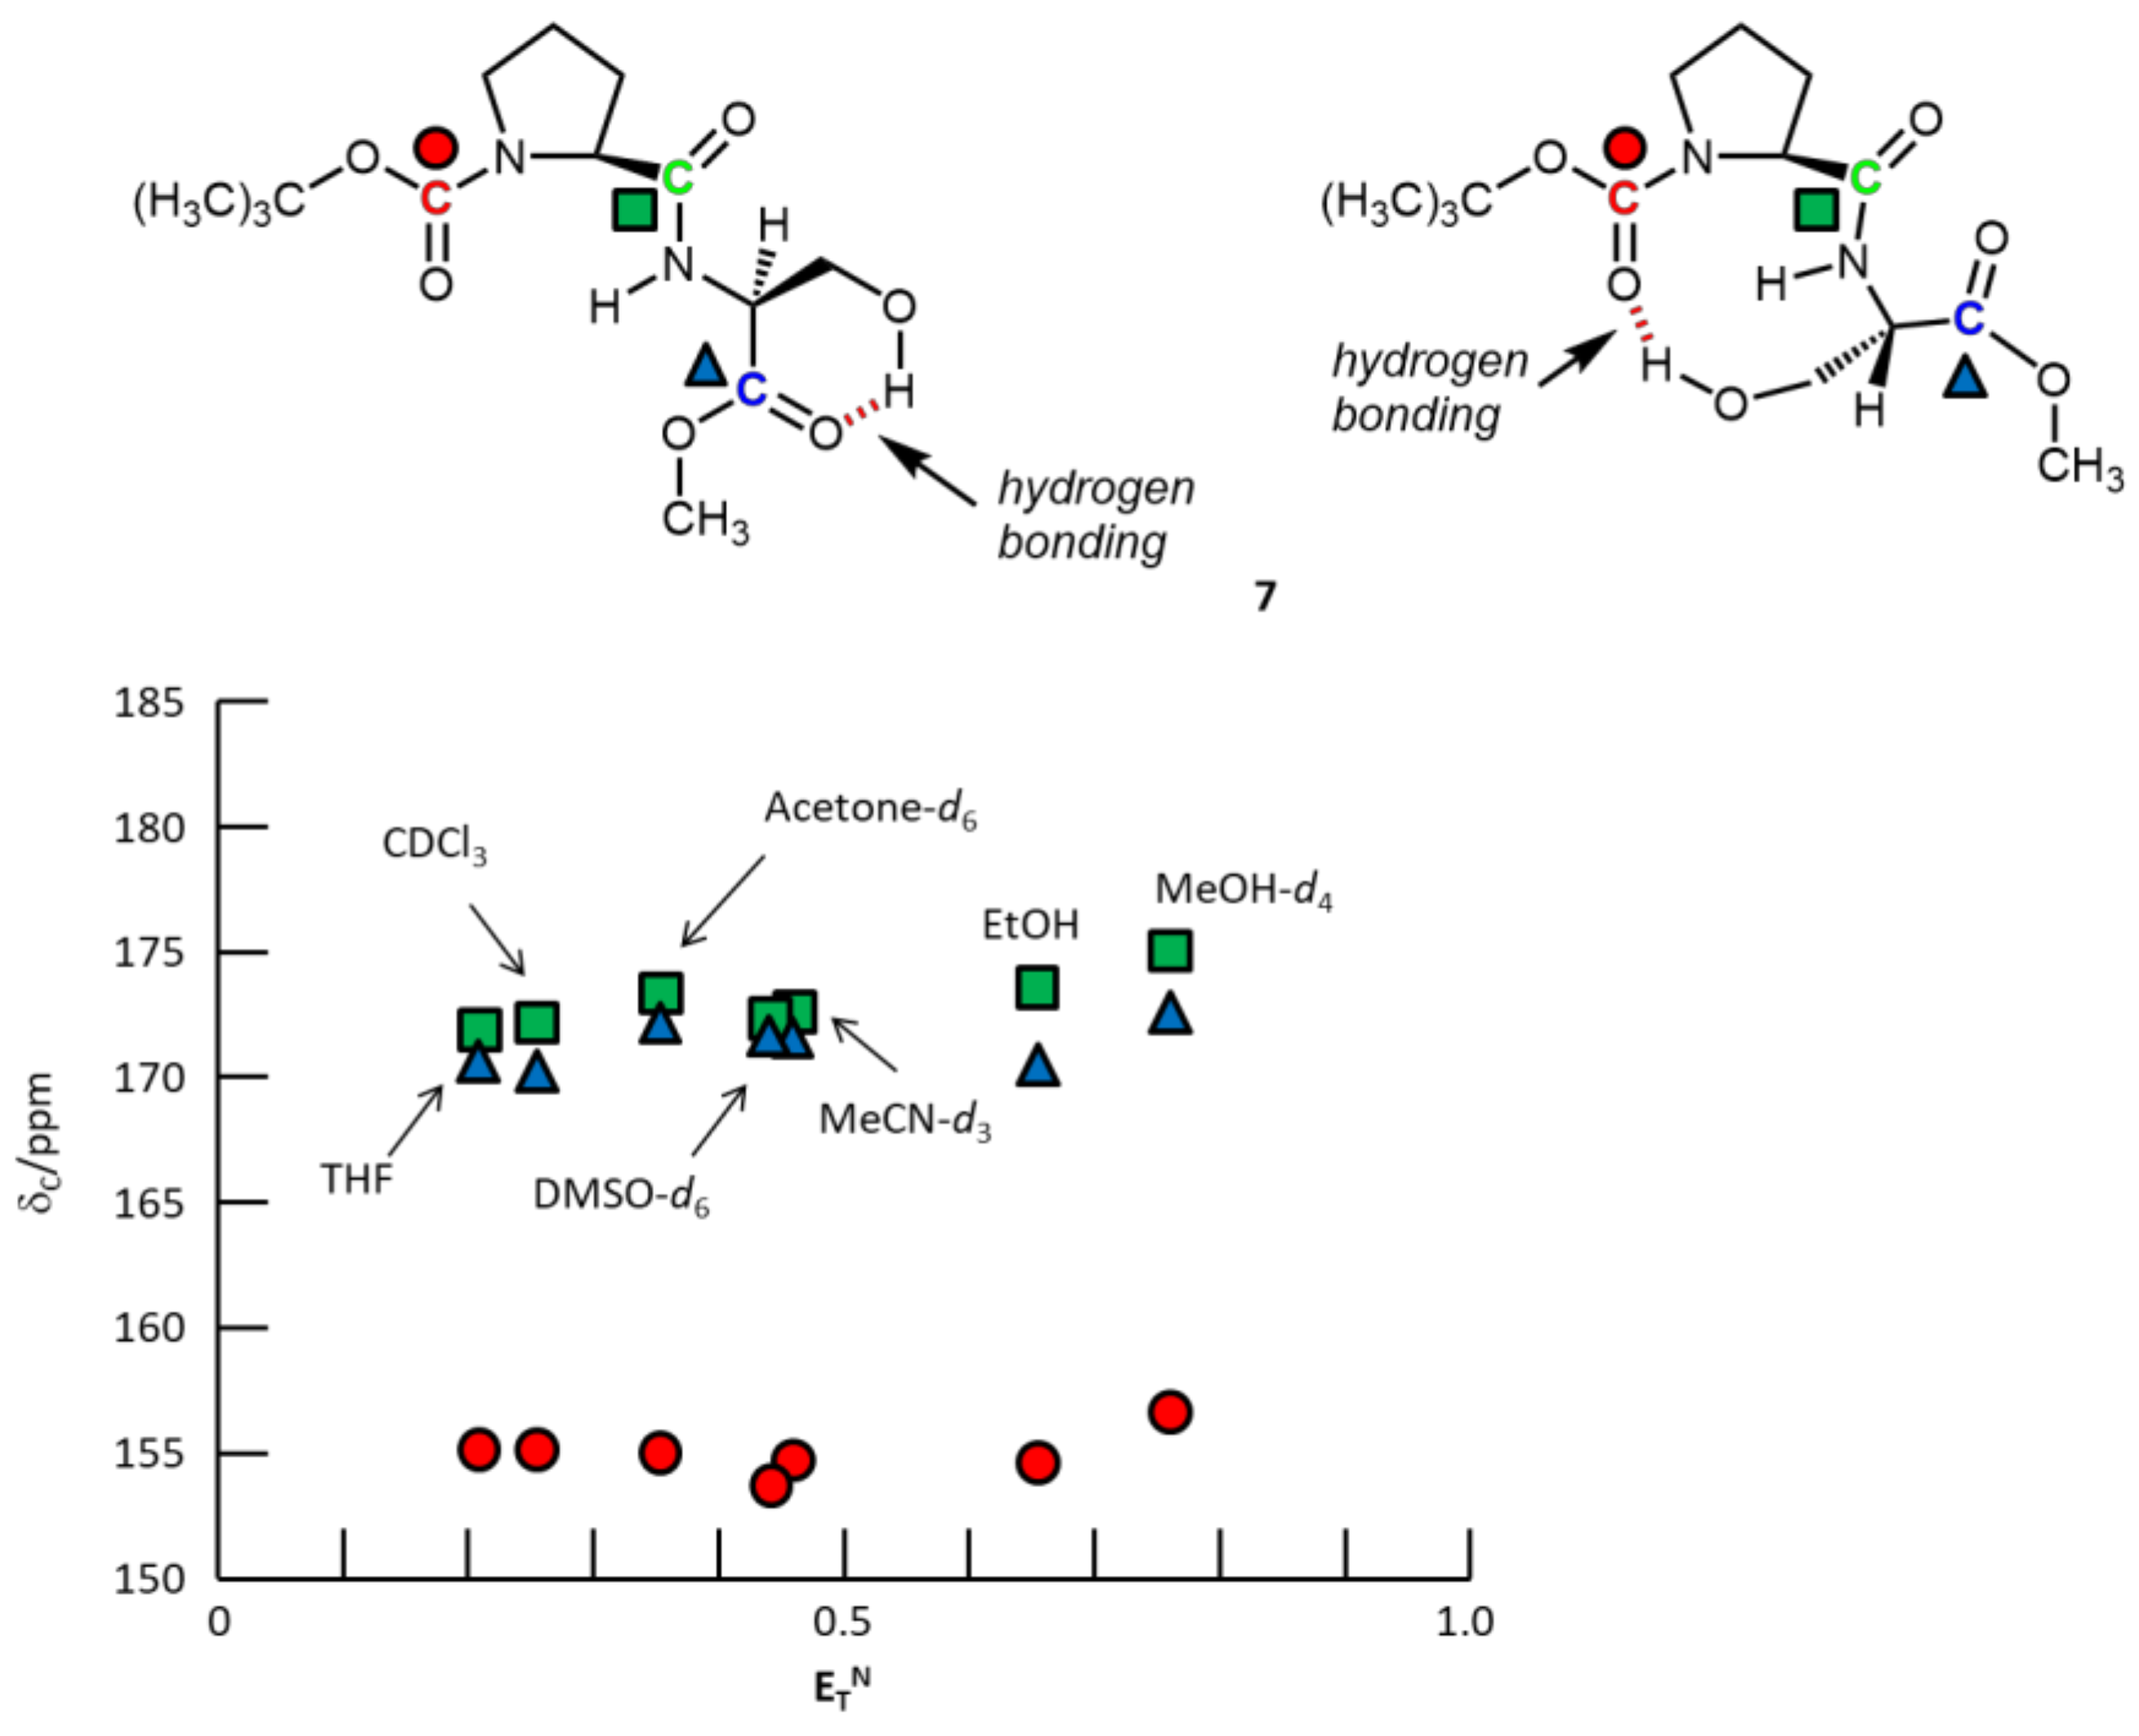
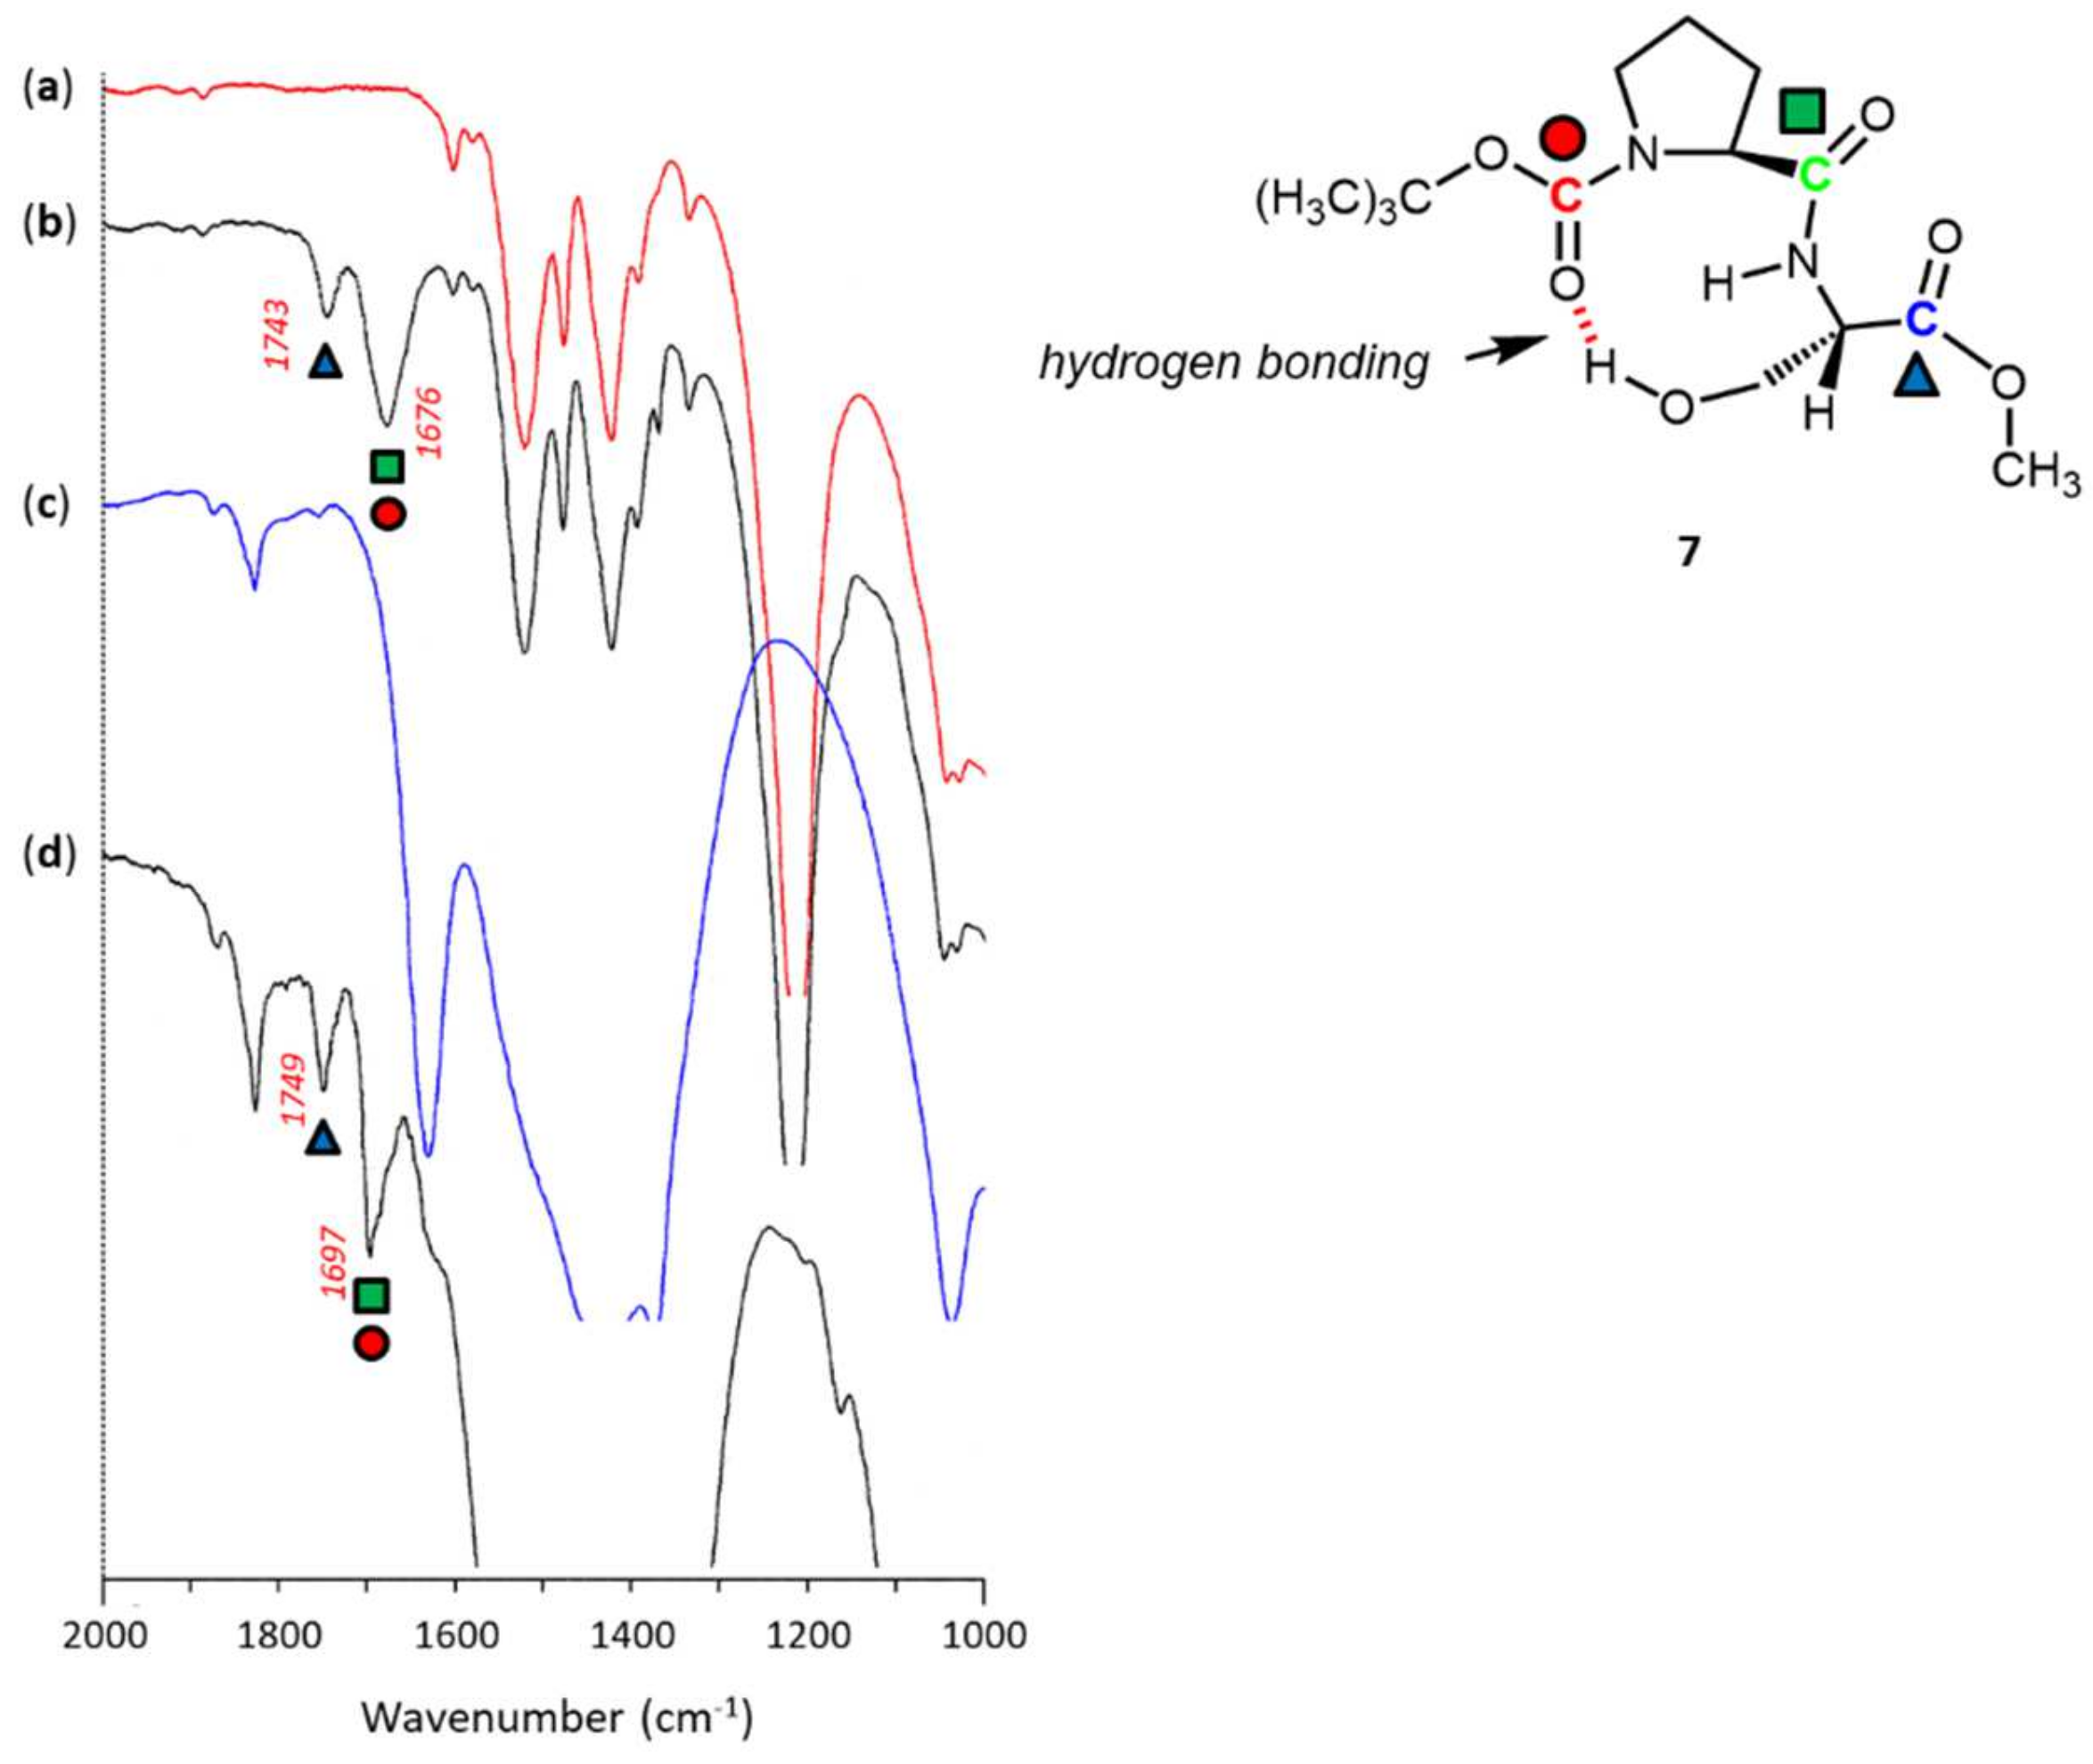
2.3.2. N-Boc-L-proline-L-serine-OMe 7

N-Boc-L-proline-L-serine-OMe 7 (0.945 g, 2.99 mmol) was prepared from L-serine methyl ester hydrochloride (1.190 g, 7.65 mmol) and N-Boc-L-proline-OH 2a (2.152 g, 10.00 mmol) according to the same procedure as described above. Yield 39.1%. 1H NMR (CDCl3): 1.43 (s, 9H, C(CH3)3); 1.77–2.21 (m, 4H, CH2 × 2); 3.33–3.52 (m, 2H, CH2); 3.76 (s, 3H, OCH3); 3.83–4.03 (m, 2H, CH2O); 4.20 (m, 1H, CH(CH2OH)); 4.60 (m, 1H, CH). The hydroxy proton and amino proton were not observed because of broadening of the signals. 13C NMR (CDCl3): 24.6 (23.7) (CH2); 28.3 (C(CH3)3); 29.2 (31.0) (CH2); 47.1 (CH2); 52.5 (OCH3); 55.1 (54.5) (CH); 60.3 (60.9) (CH2O); 62.3 (63.3) (CH); 80.6 (C(CH3)3); 155.2 (154.6) (CO-OtBu); 170.8 (CO-OCH3); 172.6 (173.2) (CO-NH) (The chemical shifts in parentheses are for the minor amide rotational isomer).

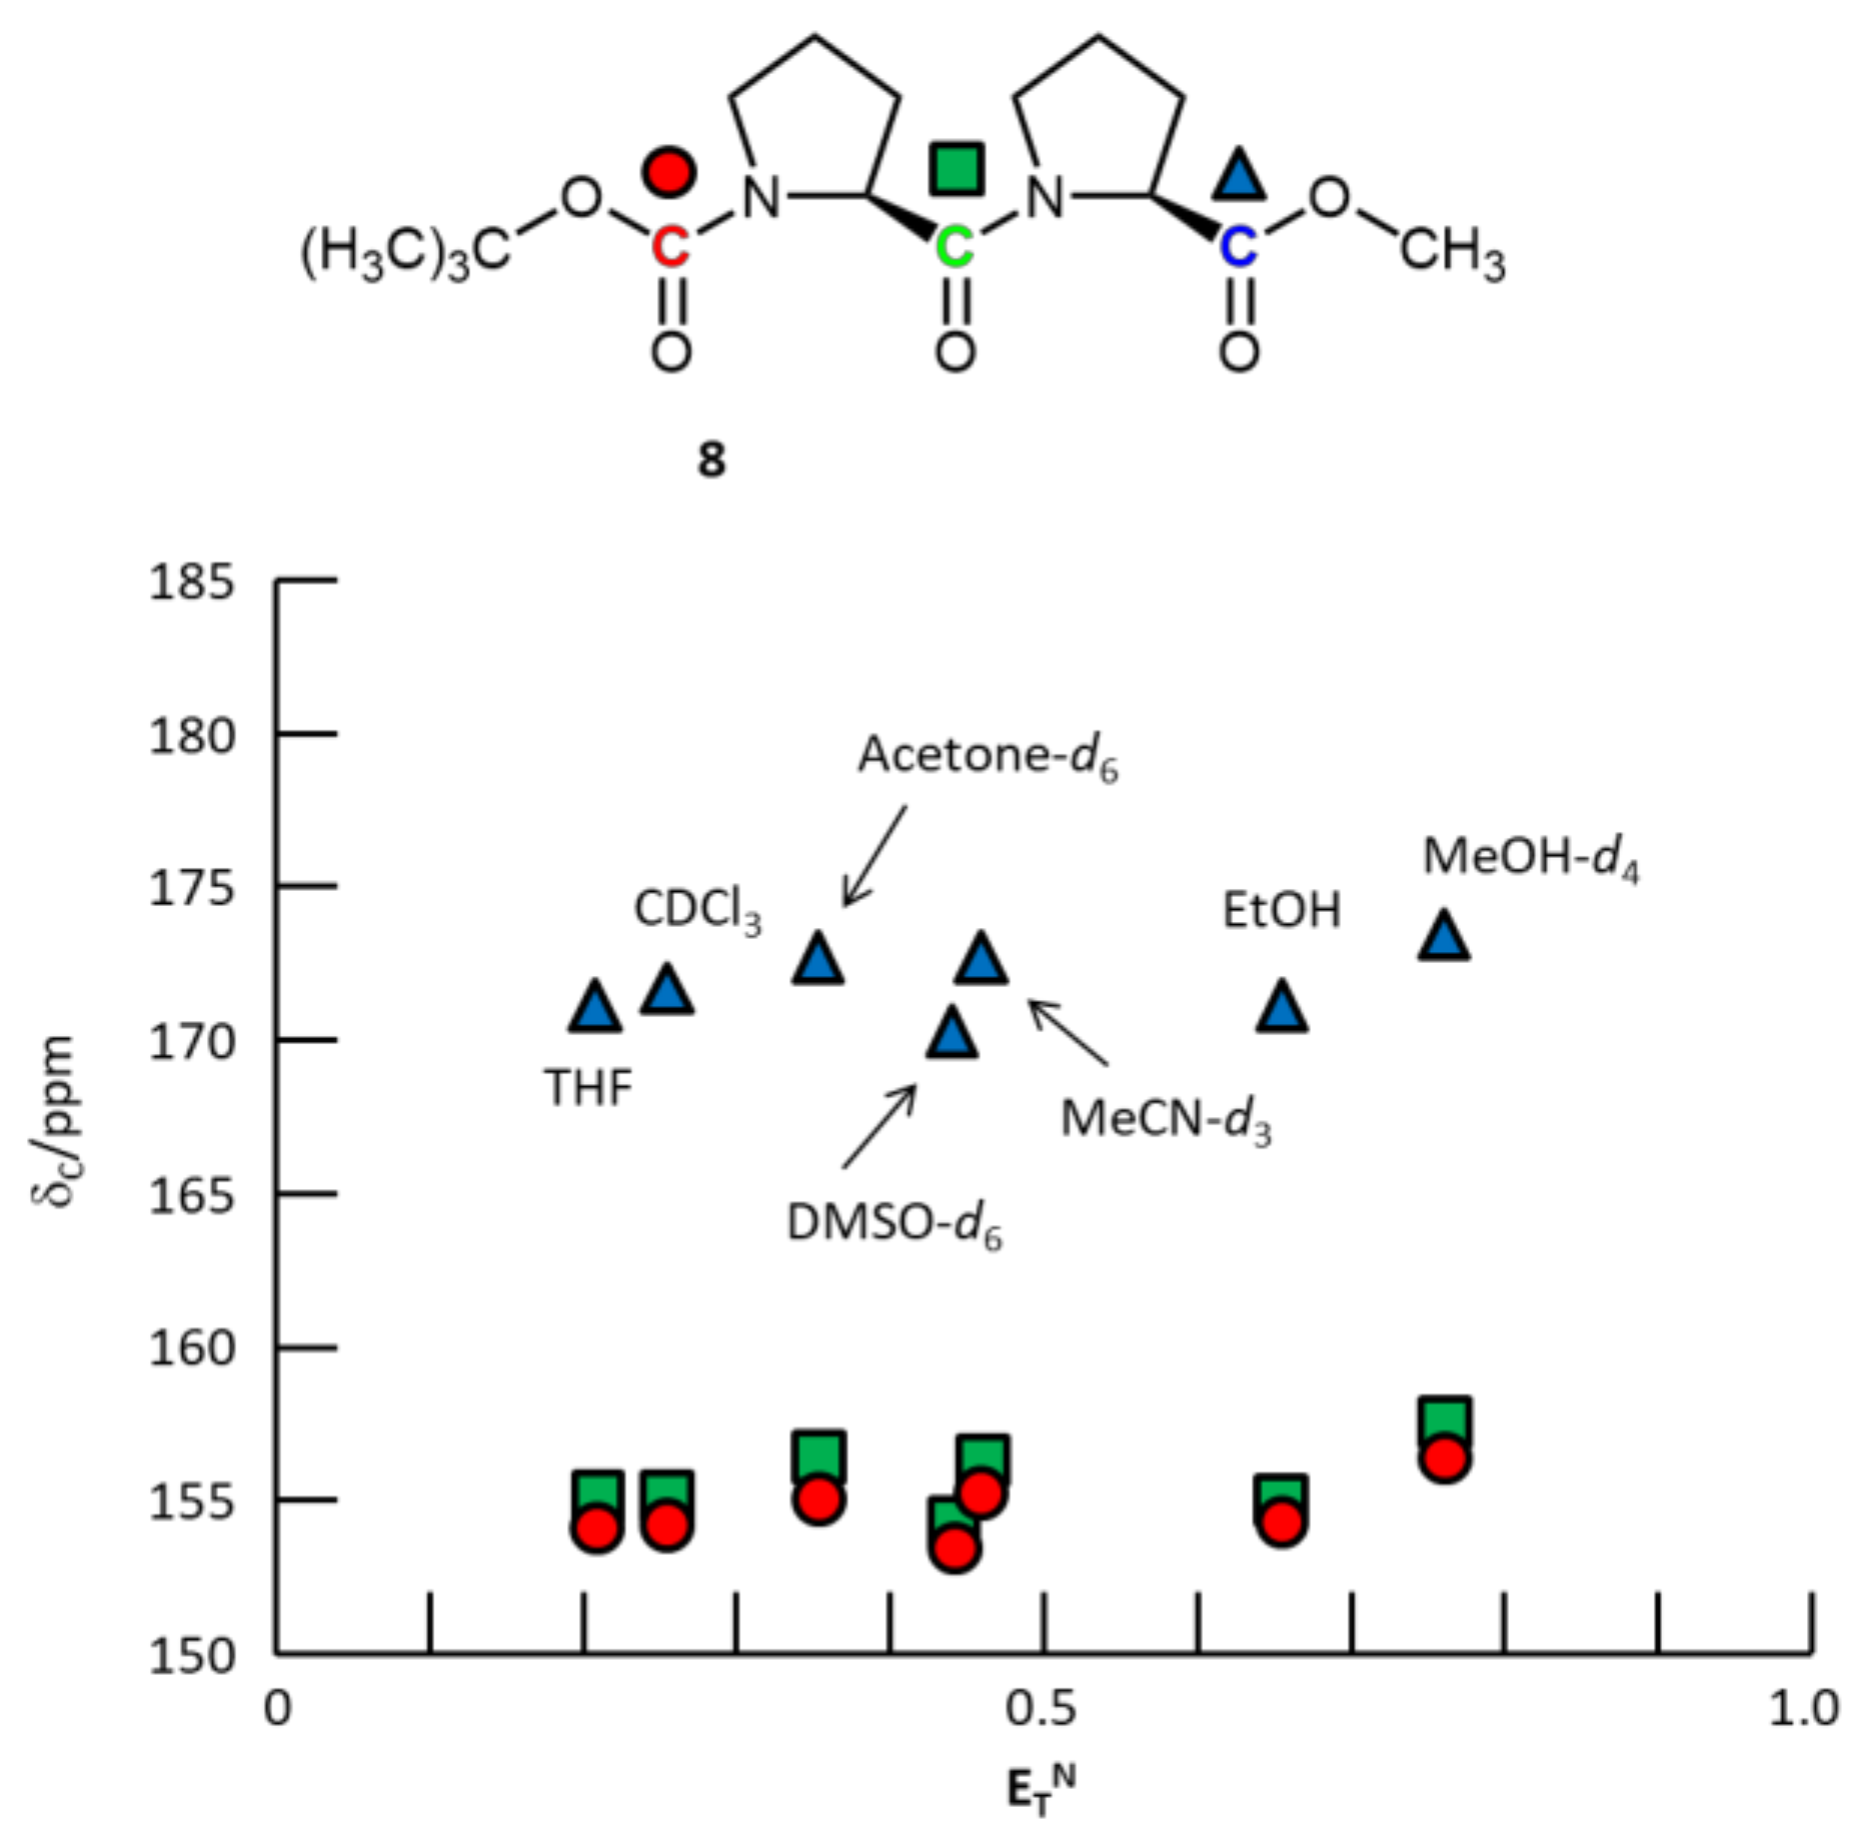
2.3.3. N-Boc-L-proline-L-proline-OMe 8

N-Boc-L-proline-L-proline-OMe 8 (0.767 g, 2.35 mmol) was prepared from L-proline methyl ester hydrochloride (1.005 g, 6.07 mmol) and N-Boc-L-proline-OH 2a (1.771 g, 8.23 mmol) according to the same procedure as described above. Yield 38.7%. 1H NMR (CDCl3): 1.39 (s, 9H, C(CH3)3); 1.67–2.26 (m, 8H, CH2 × 4); 3.28–3.64 (m, 4H, CH2 × 2); 3.67 (s, 3H, OCH3); 4.15 (m, 1H, CH); 4.42 (m, 1H, CH). 13C NMR (CDCl3): 23.6 (23.3) (CH2); 24.4 (24.2) (CH2); 29.7 (CH2); 30.7 (30.5) (CH2); 28.3 (C(CH3)3); 46.2 (CH2); 46.4 (CH2); 51.8 (OCH3); 59.0 (CH); 60.2 (CH); 79.7 (C(CH3)3); 154.1 (153.7) (CO-OtBu); 154.9 (154.3) (CO-N); 171.5 (171.0) (CO-OCH3) (The chemical shifts in parentheses are for the minor amide rotational isomer).

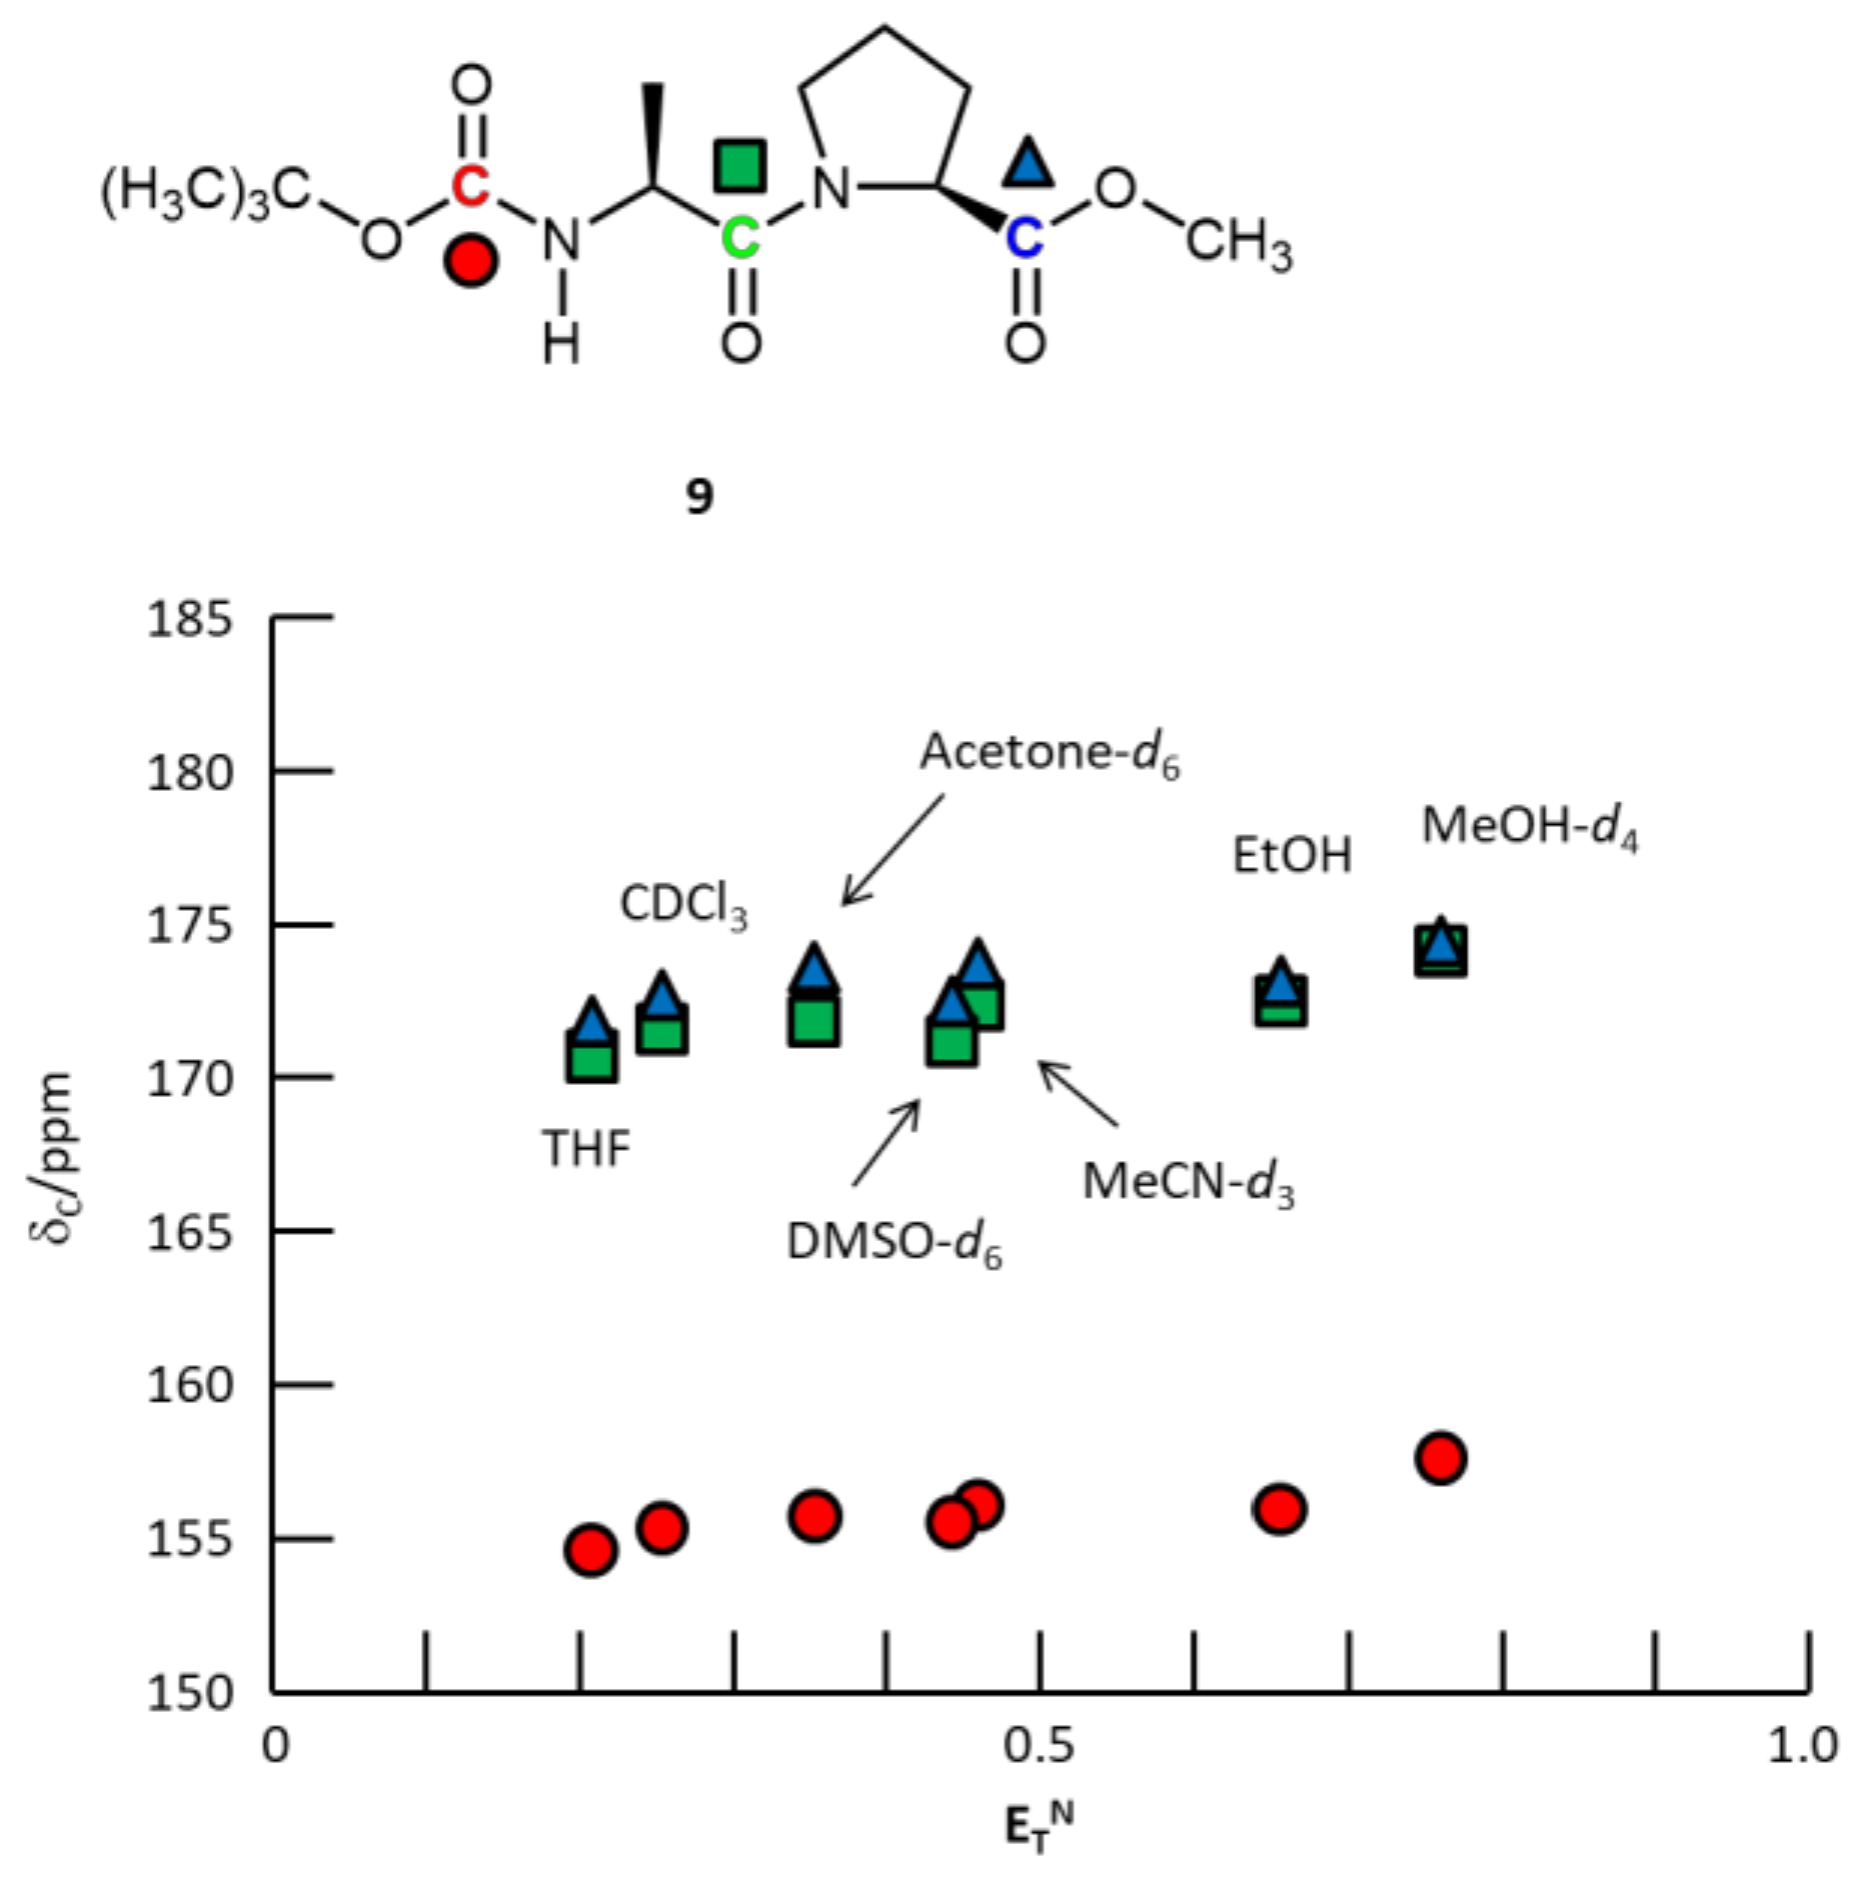
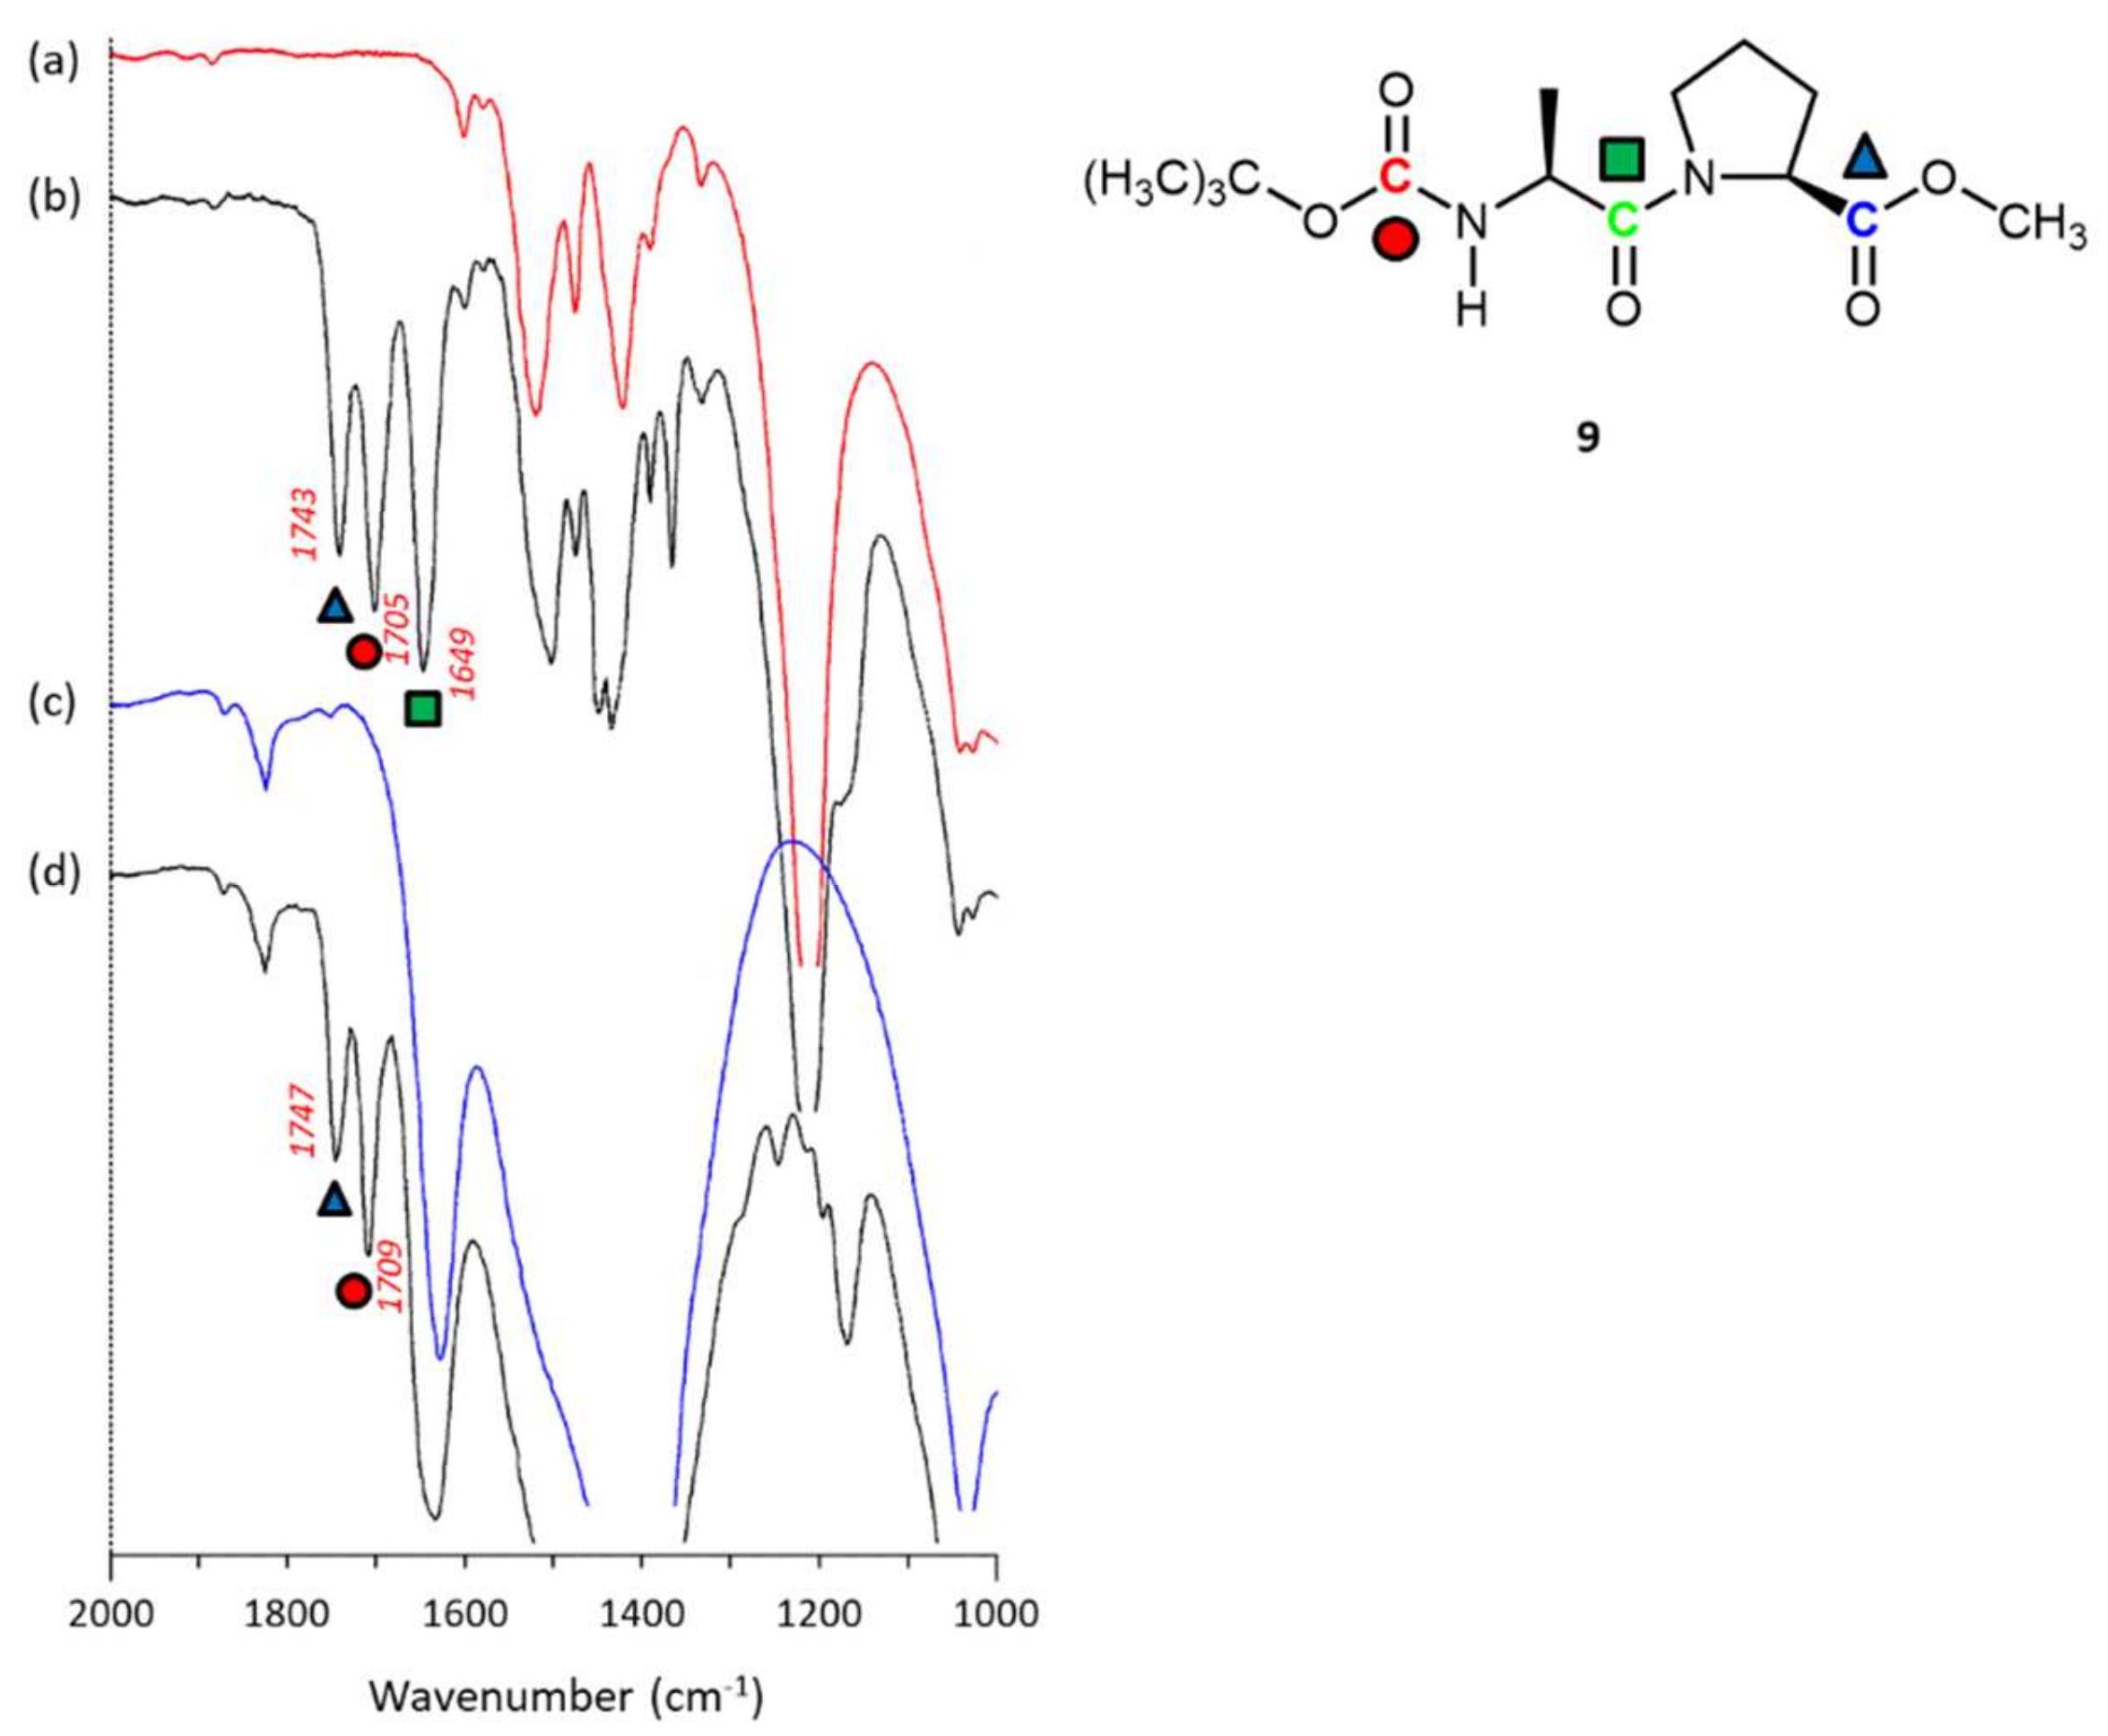
2.3.4. N-Boc-alanine-L-proline-OMe 9

N-Boc-L-alanine-L-proline-OMe 9 (1.357 g, 4.52 mmol) was prepared from L-proline methyl ester hydrochloride (0.840 g, 5.07 mmol) and N-Boc-L-alanine-OH 1a (0.902 g, 4.77 mmol) according to the same procedure as described above. Yield 89.1%. 1H NMR (CDCl3): 1.35 (d, J = 6.9 Hz, 3H, CH(CH3)); 1.40 (s, 9H, C(CH3)3); 1.90–2.27 (m, 4H, CH2 × 2); 3.54–3.71 (m, 2H, CH2); 3.70 (s, 3H, OCH3); 4.45 (m, 1H, CH(CH3)); 4.51 (m, 1H, CH). The amino proton was not observed because of broadening of the signal. 13C NMR (CDCl3): 18.3 (CH(CH3)); 24.9 (CH2); 28.3 (C(CH3)3); 28.9 (CH2); 46.7 (CH2); 47.6 (CH(CH3)); 52.2 (OCH3); 58.6 (CH); 79.5 (C(CH3)3); 155.2 (CO-OtBu); 171.7 (CO-N); 172.4 (CO-OCH3).

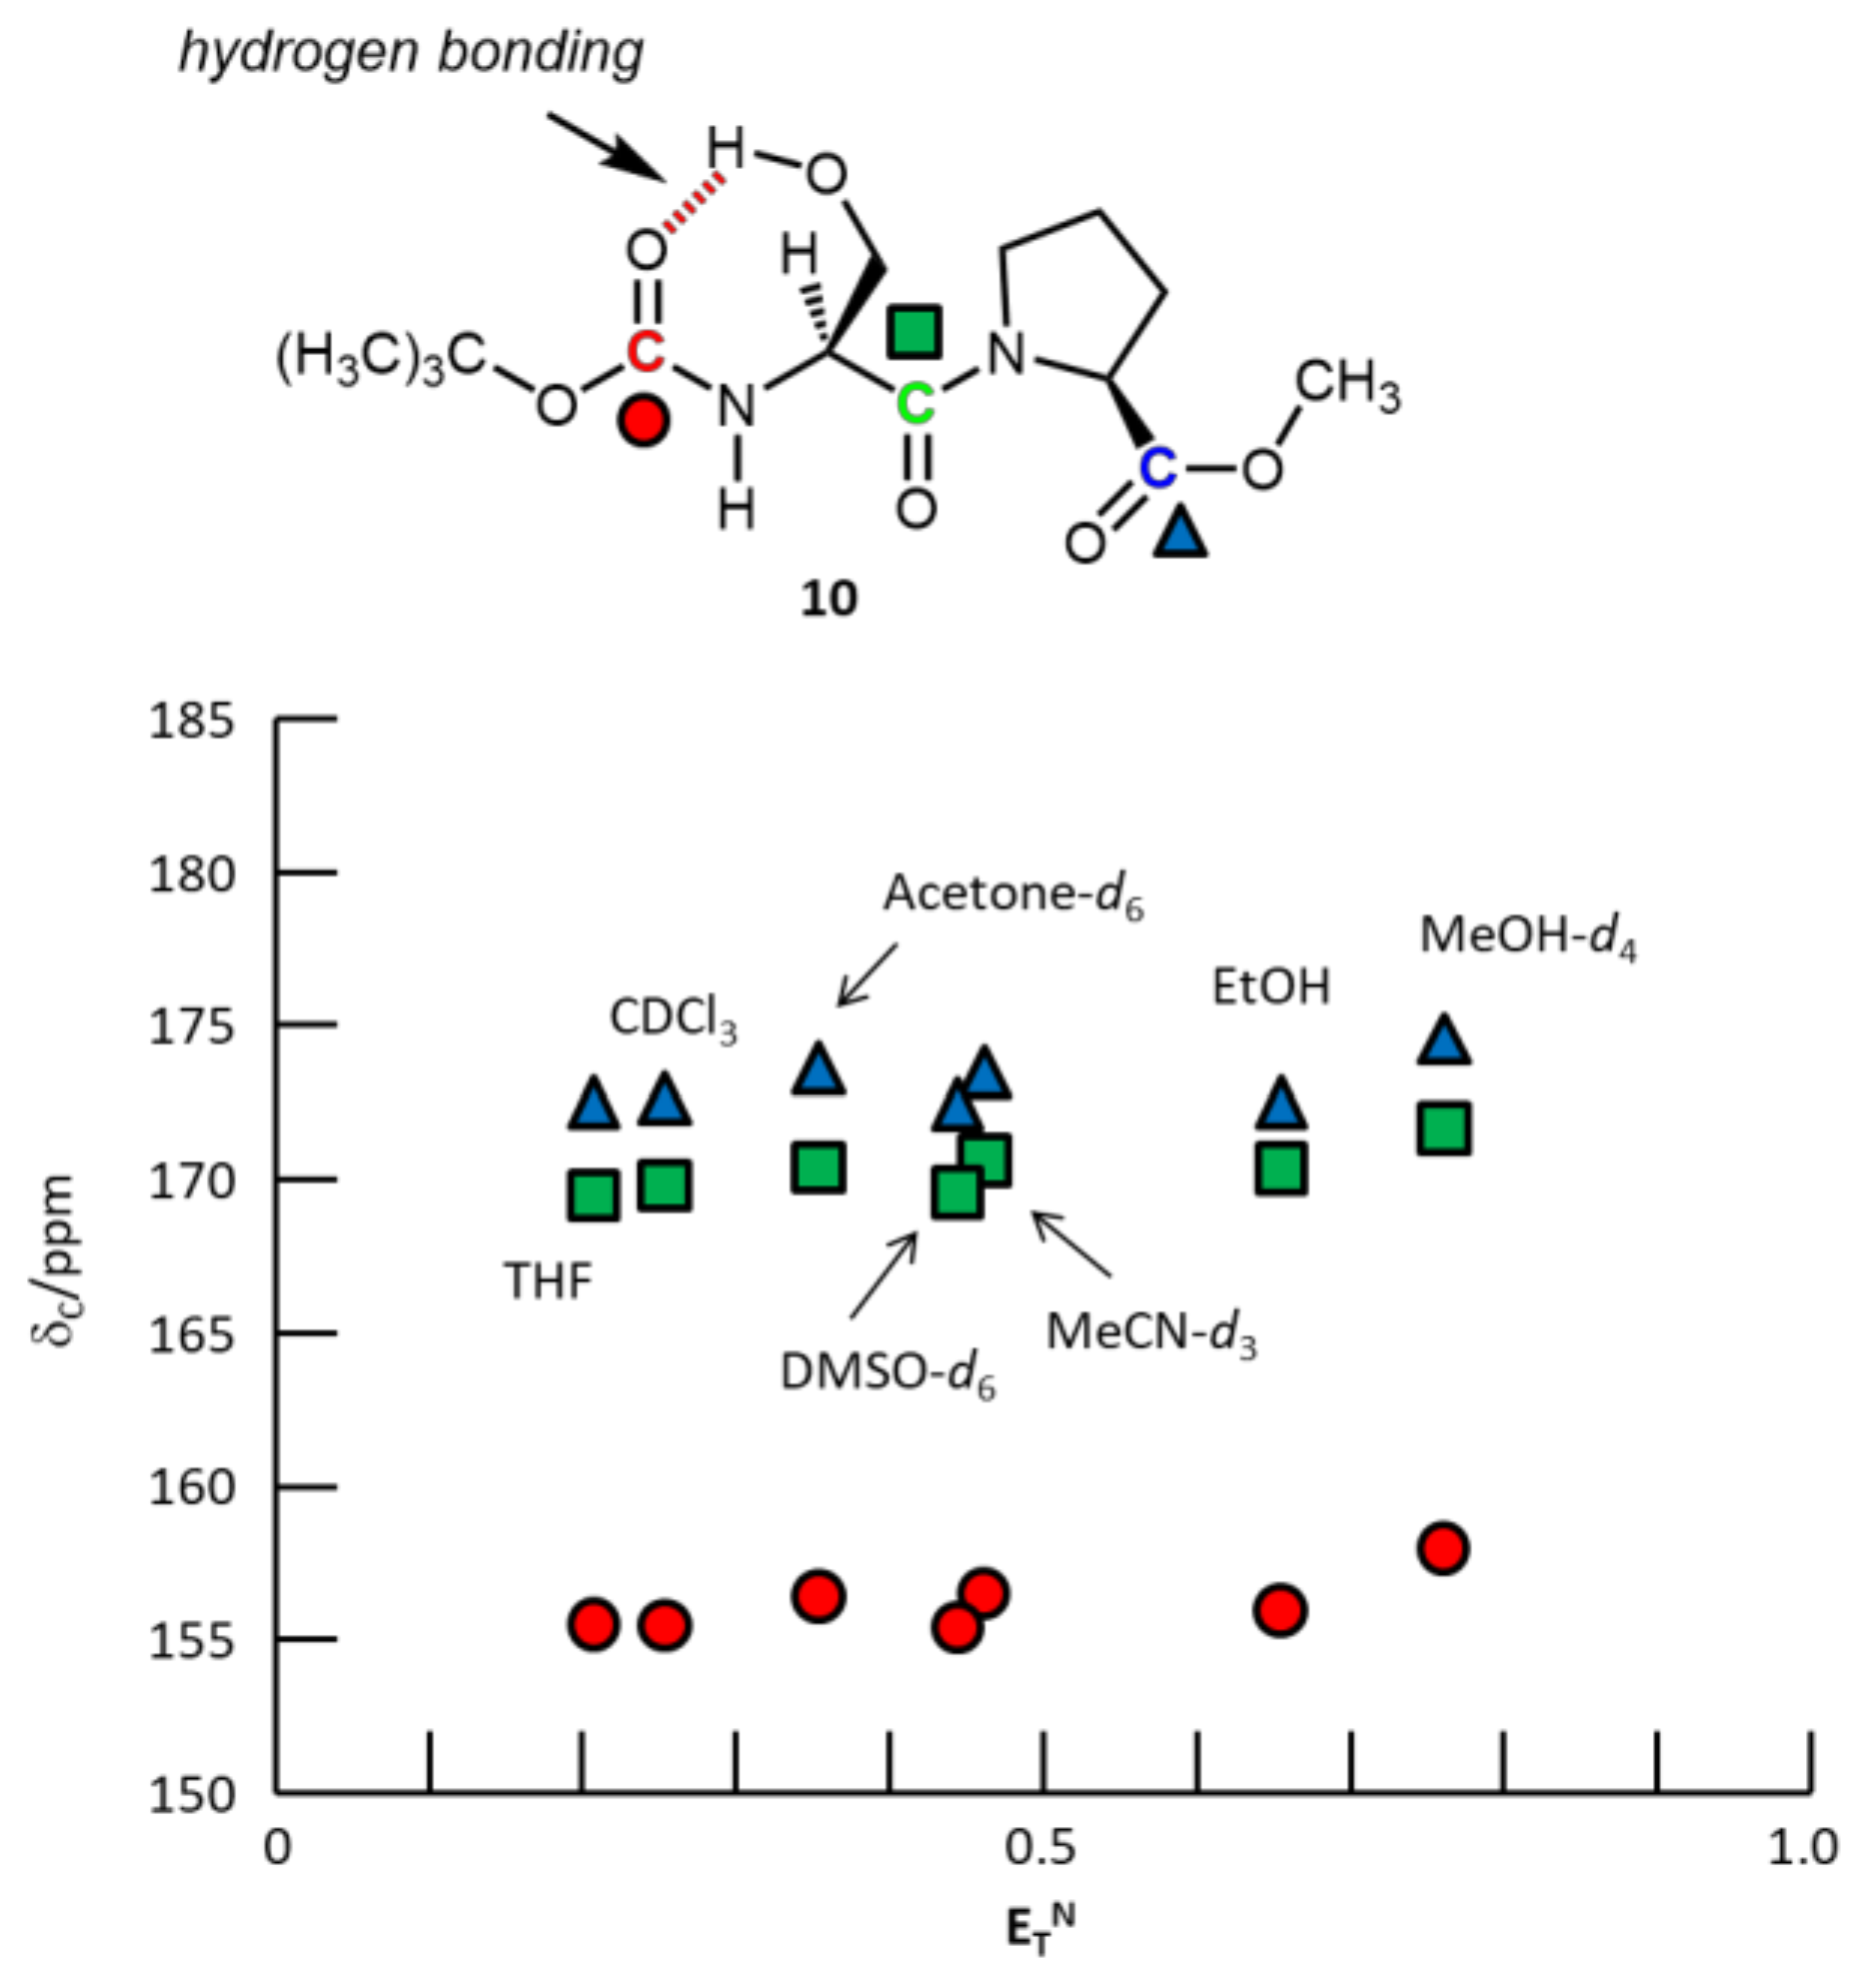
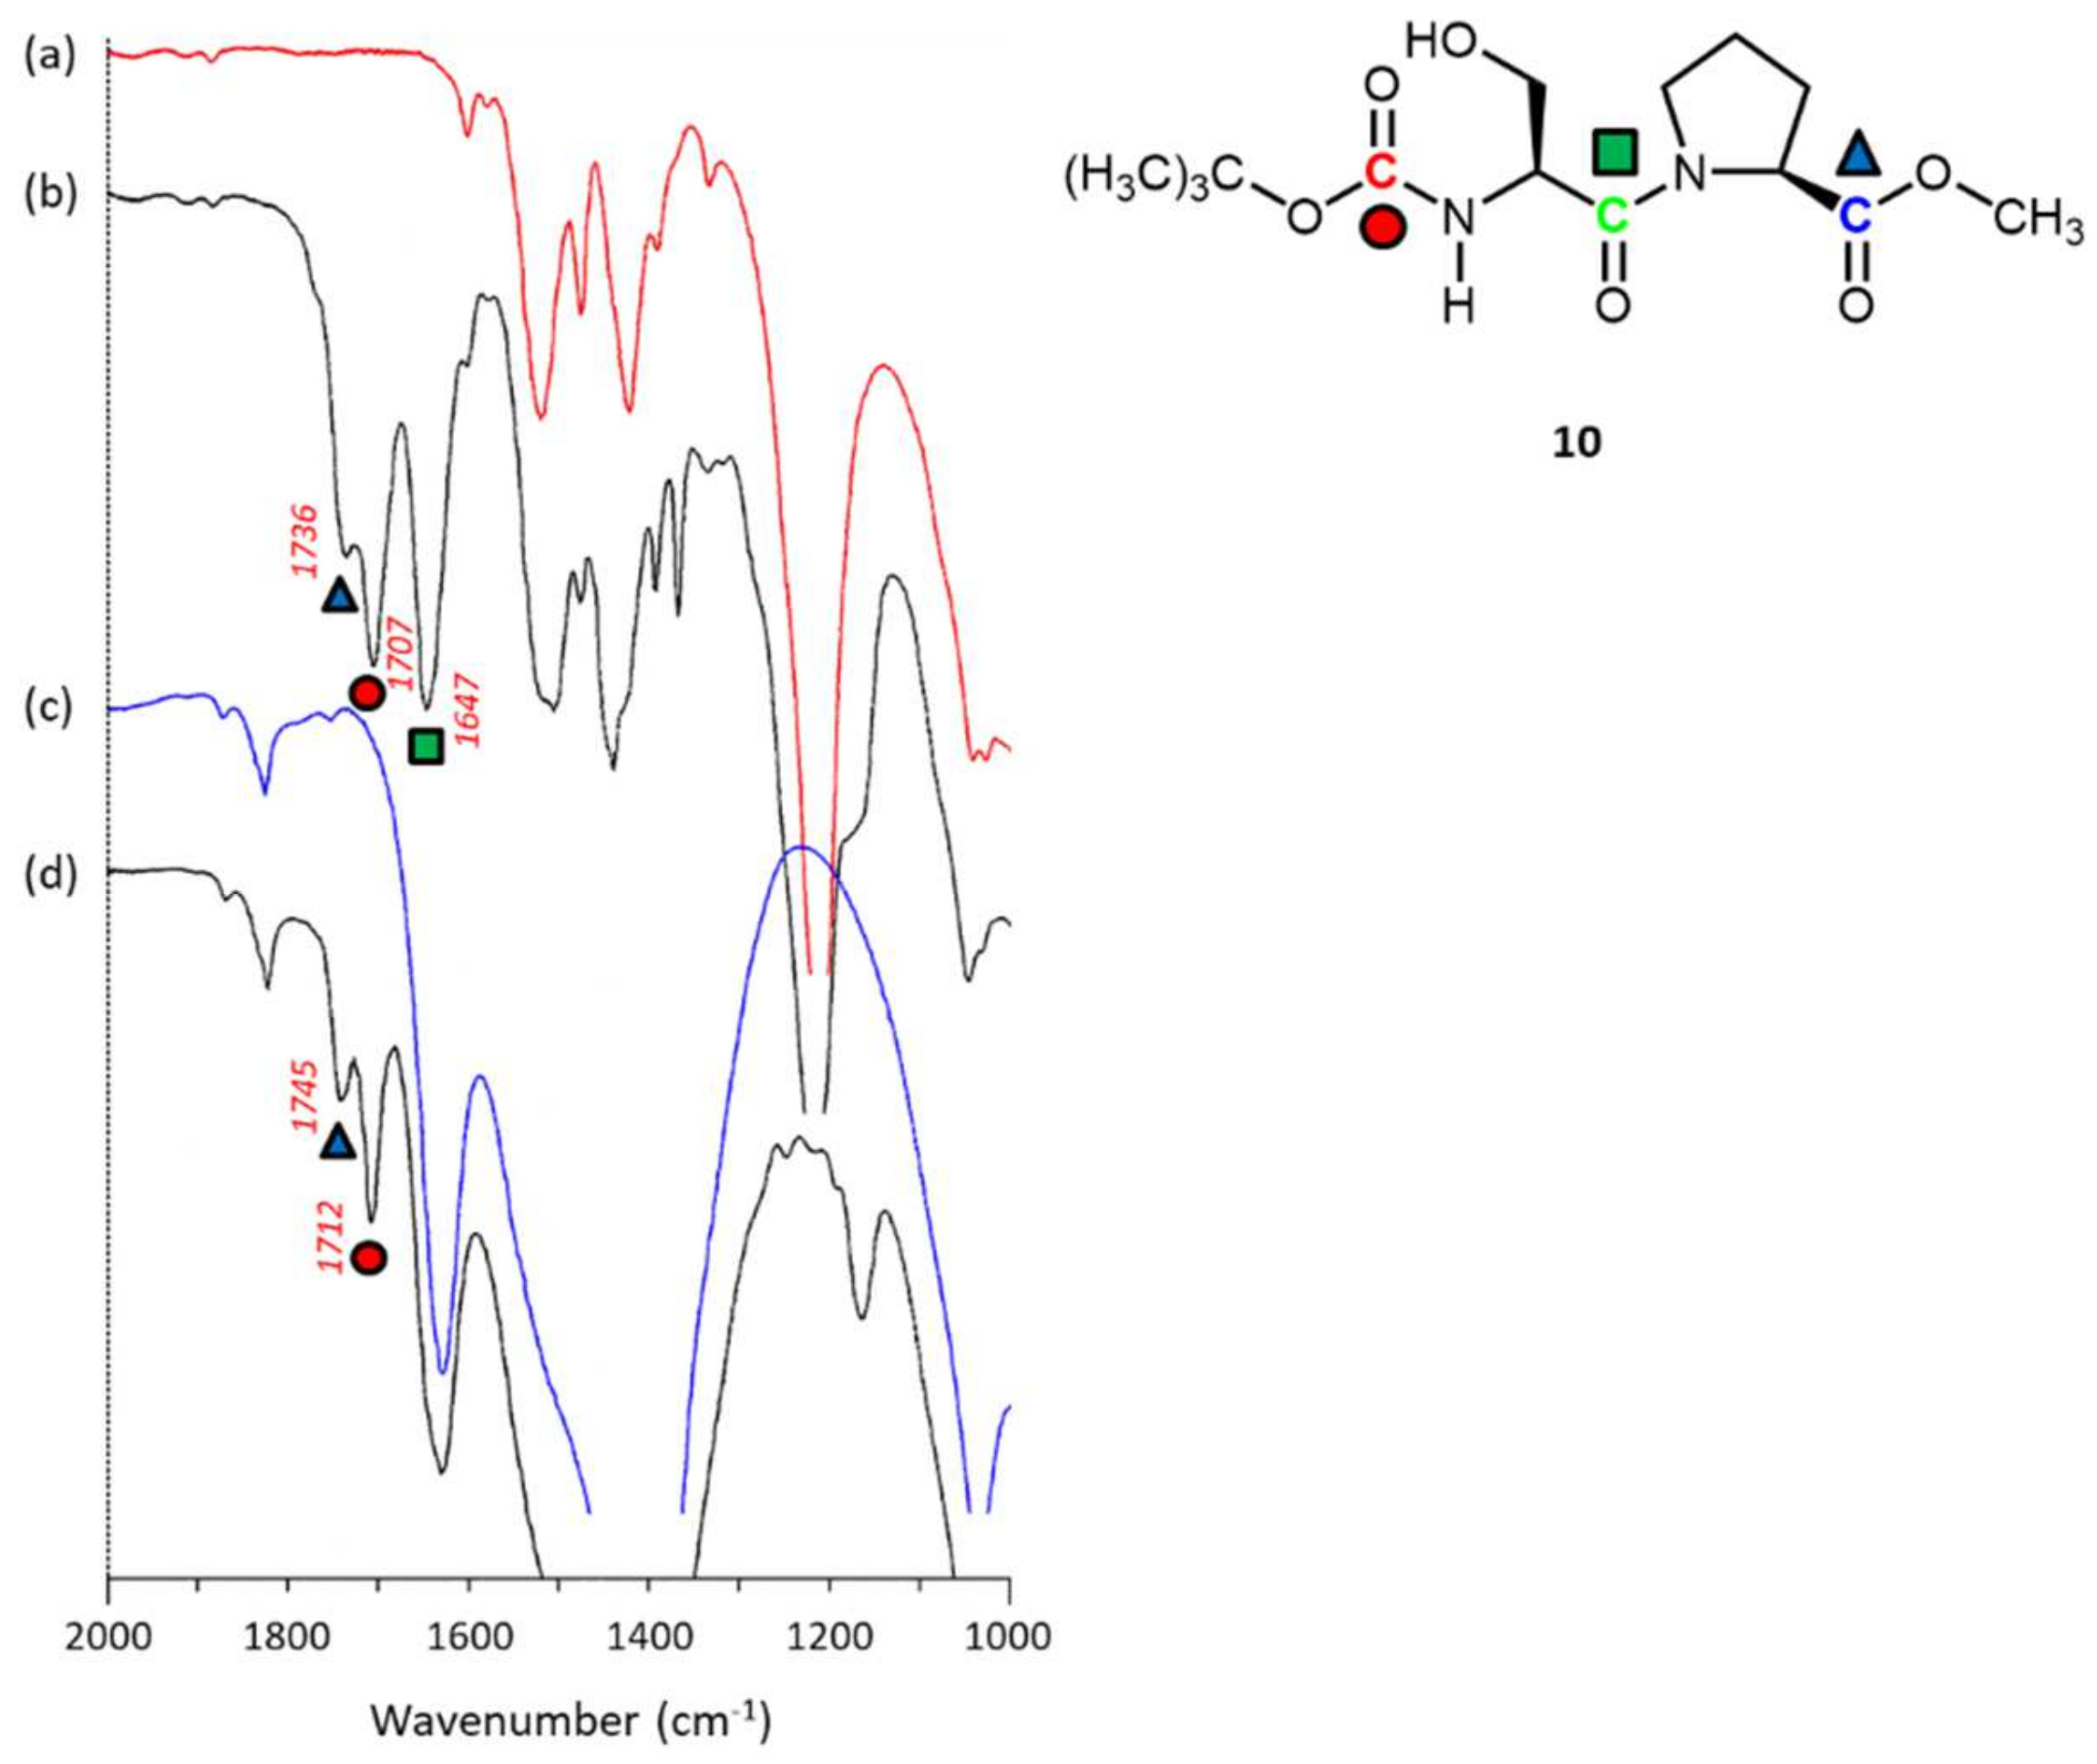
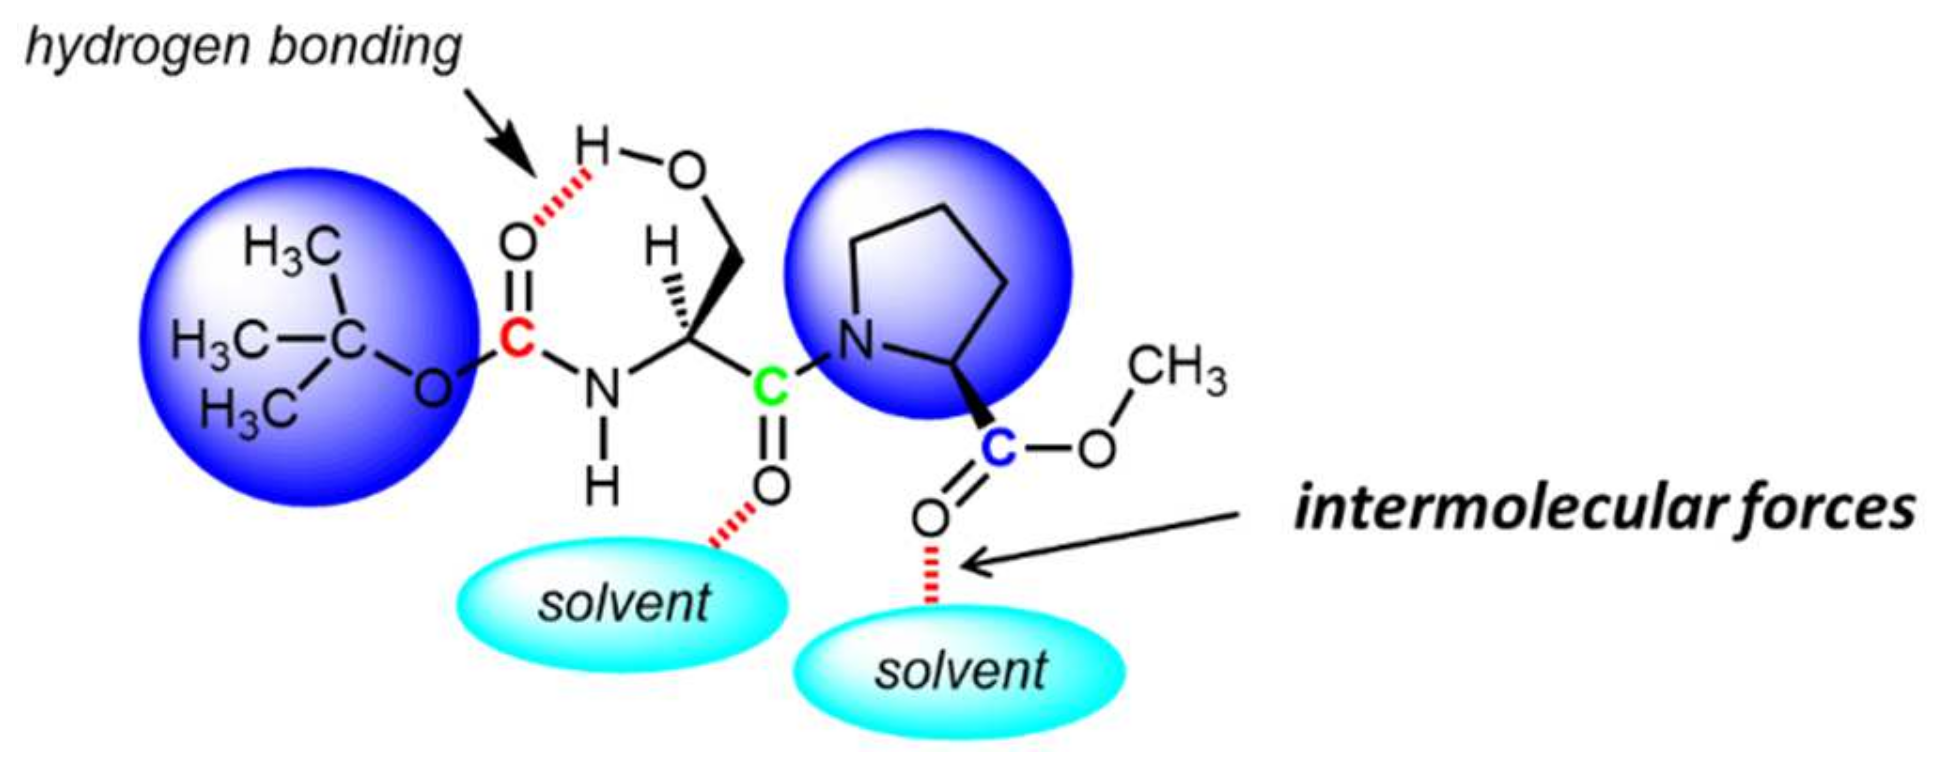
2.3.5. N-Boc-L-serine-L-proline-COOMe 10

N-Boc-L-serine-L-proline-OMe 10 (0.839 g, 2.65 mmol) was prepared from L-proline methyl ester hydrochloride (0.521 g, 3.15 mmol) and N-Boc-L-serine-OH 3a (0.606 g, 2.95 mmol) according to the same procedure as described above. Yield 84.3%. 1H NMR (CDCl3): 1.33 (s, 9H, C(CH3)3); 1.83–2.20 (m, 4H, CH2 × 2); 3.58–3.69 (m, 2H, CH2); 3.63 (s, 3H, OCH3); 3.67–3.79 (m, 2H, CH2O); 4.46 (m, H, CH); 4.50 (m, 1H, CH(CH2OH)). The hydroxy proton and amino proton were not observed because of broadening of the signals. 13C NMR (CDCl3): 24.6 (CH2); 28.0 (C(CH3)3); 28.6 (CH2); 46.9 (CH2); 52.3 (52.4) (OCH3); 53.3 (54.0) (CH); 58.7 (59.1) (CH2O); 63.5 (63.7) (CH); 79.6 (79.9) (C(CH3)3); 155.4 (157.0) (CO-OtBu); 169.9 (CO-N); 172.6 (172.1) (CO-OCH3) (The chemical shifts in parentheses are for the minor amide rotational isomer).

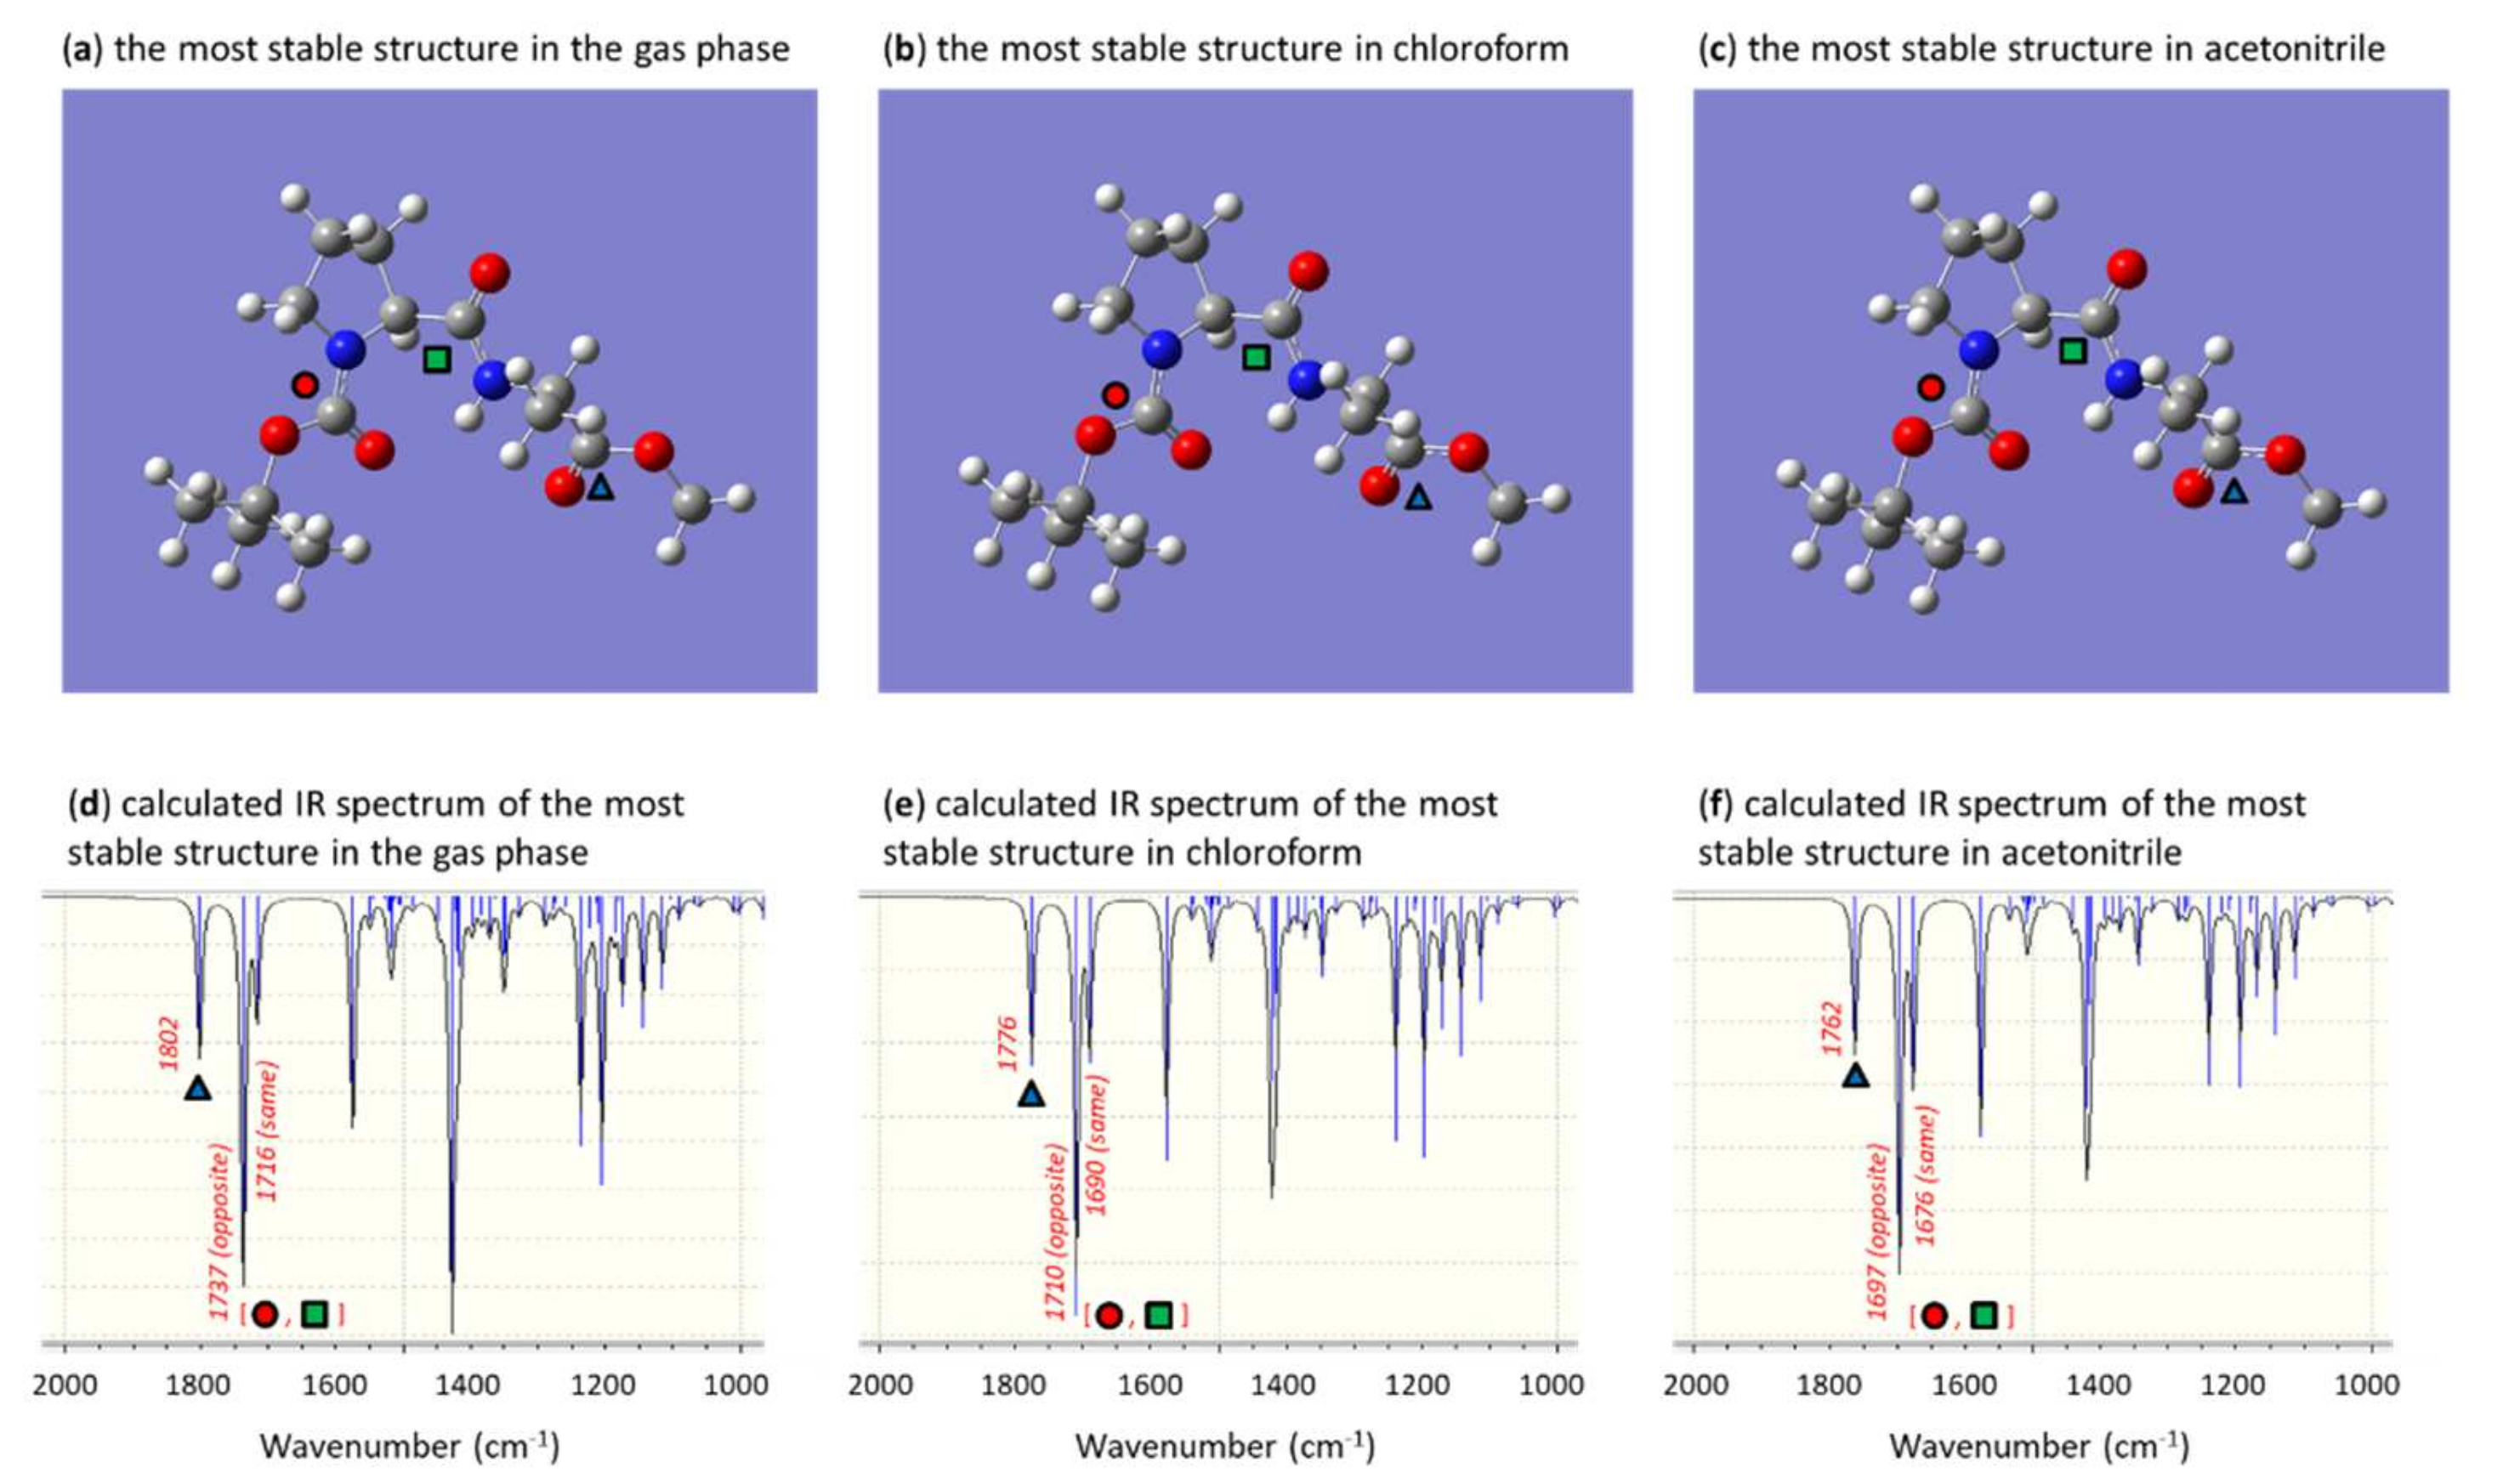
2.4. Computational Methods

The geometry optimizations for the most stable structures of N-Boc-L-proline-L-alanine-OMe 6, N-Boc-L-proline-L-serine-OMe 7, N-Boc-L-alanine-L-proline-OMe 9, and N-Boc-L-serine-L-proline-OMe 10 were performed at the B3LYP/6-31+G(d) level in the gas phase with the GAUSSIAN 09 program [28]. The geometry optimization of the dipeptide derivatives, 6, 7, 9, and 10 in the solution phase (chloroform and acetonitrile) were performed with the use of the integral equation formalism model of the polarizable continuum model (IEFPCM) at the same theory level [29,30]. At the same theory level, frequency calculations were carried out for the confirmation of the optimized geometries. Zero-point energy corrections were also performed on the electronic energies.

3. Results and Discussion

We first monitored the 13C NMR chemical shifts of the carbonyl groups in eight derivatives of five kinds of N-Boc-protected amino acids, N-Boc-L-alanine-OH 1a, N-Boc-L-alanine-OMe 1b, N-Boc-L-valine-OH 2, N-Boc-L-proline-OH 3a, N-Boc-L-proline-OMe 3b, N-Boc-L-serine-OH 4a, N-Boc-L-serine-OMe 4b, and N-Boc-L-threonine-OH 5, in various solvents having different ETN values (Scheme 1). The 13C NMR chemical shifts of the carbonyl carbons in the N-Boc-protected amino acids and these derivatives are listed in Tables S13 and S14 (Supplementary Materials).
Figure 1 shows the results of N-Boc-L-alanine-OH 1a. The 13C chemical shifts of both the carbonyl carbons in the COOH and in the N-Boc group show downfield shifts as the solvent polarity ETN increased. Figure 2 shows the results of N-Boc-L-valine-OH 2. It showed a similar tendency to N-Boc-L-alanine-OH 1a, especially for the carbonyl carbon of the COOH. However, the carbonyl carbon of the N-Boc group showed smaller change of the 13C chemical shifts than that of 1a.
A quite similar tendency was also observed in N-Boc-L-proline-OH 3a to N-Boc-L-valine-OH 2, showing greater chemical shift changes in the carbonyl carbon in the COOH, but smaller changes for the carbonyl carbon in the N-Boc group with increase of ETN values (Figure 3). We interpret that these tendencies are due to the steric bulkiness of the isopropyl group and proline rings and hence decreased susceptibility to accept solvent effects. Interestingly, the 13C chemical shifts of both the carbonyl groups were almost constant in both N-Boc-L-serine-OH 4a (Figure 4) and N-Boc-L-threonine-OH 5 (Figure 5). From the behaviors of the 13C NMR chemical shifts of the carbonyl carbon in the N-Boc group of 4a and 5, it can be assumed that the solvent effect was not affected in the aprotic solvents because of the intramolecular hydrogen bonding between the oxygen atom of the carbonyl group in the carboxyl group or the carbonyl group in the N-Boc group and the hydrogen atom of the hydroxy group of the L-serine and L-threonine, but in the protic solvents, the slight downfield shifts were likely due to competition of the hydrogen bonding with the protic solvent.
We measured 13C NMR chemical shifts of three kinds of the corresponding methyl esters, N-Boc-L-alanine-OMe 1b (Figure 6), N-Boc-L-proline-OMe 3b (Figure 7), and N-Boc-L-serine-OMe 4b (Figure 8). Since these methyl esters were insoluble in D2O, the behavior of 13C NMR chemical shifts of the carbonyl carbons was investigated in seven organic solvents having different ETN values. However, these tendencies did not alter from the corresponding carboxylic acids, 1a, 3a, and 4a, showing the same tendencies for the chemical shifts of the carbonyl carbons. Therefore, for further studies, we utilized all carbomethoxy derivatives instead of the free carboxylic acids because of the increased solubilities in organic solvents.
From these observations, it appears that the intermolecular forces between the carbonyl group and the solvent countervail with the steric effects by the substituents of the amino acids, and amino acid derivatives with a small functional group can move the 13C NMR chemical shifts of the carbonyl carbons of the N-Boc group as in Scheme 2a,b. On the other hand, although the solvent polarity ETN values was increased, the 13C NMR chemical shifts of the carbonyl carbon in the N-Boc group and in the carboxy group or the carbomethoxy group of 4a, 4b, and 5 were only slightly changed. Therefore, these results could be assumed to mean that the intramolecular hydrogen bonding exists between the oxygen atom of the carbonyl group in the carboxyl group or the carbonyl group in the N-Boc group and the hydrogen atom of the hydroxy group of the L-serine and L-threonine as shown in Scheme 2c.
Next, we measured 13C NMR chemical shifts of the carbonyl carbons of five dipeptide derivatives, N-Boc-L-proline-L-alanine-OMe 6, N-Boc-L-proline-L-serine-OMe 7, and N-Boc-L-proline-L-proline-OMe 8, in particular, containing an N-Boc-protected L-proline residue, and N-Boc-L-alanine-L-proline-OMe 9 and N-Boc-L-serine-L-proline-OMe 10, containing an L-proline methyl ester (Scheme 3). The 13C NMR chemical shifts of the carbonyl carbons in the N-Boc-protected dipeptide derivatives are listed in Tables S15–S17 (Supplementary Materials). Figure 9, Figure 10, Figure 11, Figure 12 and Figure 13 show the results.
For N-Boc-L-proline-L-alanine-OMe 6 as shown in Figure 9, both the carbonyl carbons of the peptide bond and the carbomethoxy group showed downfield shifts as the solvent polarity ETN values increased, while the carbonyl carbon of the N-Boc group showed only slight change as in the above results. The pattern of the 13C NMR chemical shifts of the carbonyl carbon in the N-Boc group of 6 were similar to N-Boc-L-proline-OMe 3b and the pattern of the carbonyl carbon in the carbomethoxy group of 6 were similar to N-Boc-L-alanine-OMe 1b. From these solvent effects on these carbonyl groups, we predicted that intramolecular hydrogen bonding was formed between the oxygen atom of the carbonyl group in the N-Boc group and the hydrogen atom of the peptide bond as shown in Figure 9 and in Scheme 4a.
For N-Boc-L-proline-L-serine-OMe 7 as shown in Figure 10, the carbonyl carbon of the peptide bond showed a downfield shift with the increase of the solvent polarity and the carbonyl carbon of the carbomethoxy group showed only slight change. However, the carbonyl carbon of the N-Boc group remained almost constant except in protic solvents as in the dipeptide derivative 6, probably due to the similar intramolecular hydrogen bonding as shown in Figure 10. Here, interestingly, we found out that intramolecular hydrogen bonding can also form between the carbonyl oxygen of the N-Boc group on the L-proline and the hydrogen atom of the hydroxy group as in Scheme 4b, which will be described later.
For N-Boc-L-proline-L-proline-OMe 8, only the carbonyl carbon of the carbomethoxy group showed downfield shifts with the increase of the solvent polarity, while two other carbonyl carbons in the N-Boc group and in the peptide bond showed only slight changes of the chemical shifts (Figure 11).
From these solvent effects of dipeptides 68, it appears that the steric effects caused by the proline residue is remarkable, showing comparable effects caused by the intramolecular hydrogen bonding (Scheme 4c).
In order to investigate the steric effect of the proline ring residue, the behavior of the 13C NMR chemical shifts of the carbonyl carbons in the two dipeptides, N-Boc-L-alanine-L-proline-OMe 9 and N-Boc-L-serine-L-proline-OMe 10 in different solvents were investigated. Interestingly, when we measured 13C NMR chemical shifts of the carbonyl carbons of N-Boc-L-alanine-L-proline-OMe 9, all the three carbonyl carbons in 9 showed downfield shifts with the increase of the solvent polarity ETN values (Figure 12). This is an anticipated outcome as this case is similar to N-Boc-L-alanine-OH 1a or N-Boc-L-alanine-OMe 1b. In addition, this outcome also suggests that the peptide bond formed with the carboxyl group on the proline ring makes some contribution to the near-constant chemical shifts on the carbonyl next to the proline nitrogen atom.
The dipeptide N-Boc-L-serine-L-proline-OMe 10 also showed downfield shifts for the two carbonyl carbons in the carbomethoxy group and in the peptide bond, while the change of the carbonyl carbon in the N-Boc group was slight except in EtOH and MeOH-d4 (Figure 13). It is likely that only these protic solvents exhibited the influence because of the hydrogen bonding from these solvents. This pattern for the N-Boc group was similar to N-Boc-L-serine-OH 4a, N-Boc-L-serine-OMe 4b, and N-Boc-L-proline-L-serine-OMe 7. These results suggest that the intramolecular hydrogen bonding can be formed between the carbonyl oxygen of the N-Boc group on the L-serine and the hydrogen atom of the hydroxy group of L-serine from the behavior of the carbonyl carbon of the N-Boc group in dipeptide 10 as will be described later (Scheme 5).
As for the 13C NMR chemical shifts of the N-Boc group in dipeptide derivatives 6, 7, 9, and 10, the 13C NMR chemical shifts of the carbonyl carbon in the N-Boc group in 9 showed the downfield shifts with an increase of the solvent polarity (Figure 12), whereas those of the N-Boc group attached to L-proline in 6, in 7, and in 10 hardly changed even with the increased solvent polarity (Figure 9, Figure 10 and Figure 13). For elucidation of the behavior of the 13C NMR chemical shift of the carbonyl carbon in the N-Boc group in the dipeptide derivatives, 6, 7, 9, and 10, the infrared absorption spectra in organic solutions were measured and the absorption patterns of the carbonyl groups in the dipeptide derivatives were examined. We selected chloroform as a low-polarity solvent and acetonitrile as a high-polarity solvent for the organic solvents with minimal interferences with the carbonyl absorptions for the IR measurement. Furthermore, the IR spectra of the dipeptide derivatives, 6, 7, 9, and 10, were predicted based on their most stable structures calculated by the density functional theory (DFT) at the B3LYP/6-31+G(d) level in the gas phase and in the solution phase, and they were compared with the actually measured spectra. All the calculations were performed with the use of the GAUSSIAN 09 program [28].
The IR spectra of the dipeptide, N-Boc-L-proline-L-alanine-OMe 6, in chloroform and in acetonitrile are shown in Figure 14. The carbonyl groups assigned to the carbonyl bond in the ester group in 6 were observed at 1741 cm−1, and those in the N-Boc group and in peptide bonds were observed at 1682 cm−1 in chloroform (Figure 14b). They were observed at 1747 and 1697 cm−1 respectively in acetonitrile (Figure 14d).
The calculated IR spectra of 6 having the most stable structures in the gas phase and in the solution phase are shown in Figure 15. As shown in Figure 15d, in the gas phase, the carbonyl group of the methyl ester group in 6 appeared at 1802 cm−1. The above carbonyl bond in the N-Boc group and the carbonyl bond in the peptide bond were at 1716 and 1737 cm−1, respectively. The absorption at 1716 cm−1 was assigned to the stretching vibration in the same direction for each carbonyl bond, and 1737 cm−1 was assigned to that in the opposite direction. As shown in Figure 15e,f, the calculated IR absorptions of the carbonyl bond in the ester group of 6 appeared at 1776 cm−1 and 1762 cm−1 in chloroform and in acetonitrile respectively. Those assigned to the carbonyls in the N-Boc group and in the peptide bond were at 1710 cm−1 (opposite) and 1690 cm−1 (same) in chloroform and at 1697 cm−1 (opposite) and 1676 cm−1 (same) in acetonitrile. From these spectra, the observed spectral pattern of the absorptions of the carbonyl groups in 6 is in good agreement with the estimated patterns by the DFT calculation in the gas phase and in the solution phase (chloroform and acetonitrile).
From the DFT calculations of dipeptide 6, it was revealed that the intramolecular hydrogen bonding could be formed between the oxygen atom of the carbonyl group of the N-Boc group attached to proline and the hydrogen atom of the peptide bond between L-proline and L-alanine in the optimized structure shown in Scheme 4a. Therefore, the IR spectral results in organic solutions indeed support that dipeptide 6 primarily adopts the structures shown in Figure 15b,c and in Scheme 4a.
The IR spectra in chloroform and in acetonitrile along with the predicted IR spectra of N-Boc-L-proline-L-serine-OMe 7, are shown in Figure 16 and Figure 17, respectively. The carbonyl groups assigned to the carbonyl bond in the ester group in 7 were observed at 1743 cm−1 and those in the N-Boc group and in the peptide bond were observed at 1676 cm−1 in chloroform (Figure 16b). These carbonyl groups were observed at 1749 and 1697 cm−1 in acetonitrile (Figure 16d). The calculated IR spectra of 7 in the gas phase and in the solution phase are shown in Figure 17d,f. As shown in Figure 17d, the carbonyl bond assigned to the carbomethoxy group appeared at 1792 cm−1, that assigned to the peptide bond was at 1741 cm−1, and that assigned to the N-Boc group was at 1717 cm−1 in the gas phase.
As in those of dipeptide 6, the observed IR spectra in organic solution and the estimated IR spectra of the most stable structure of 7 showed good agreement. From the results of the IR spectra of dipeptide 7 in organic solution and the calculated IR spectra, we reasoned that an intramolecular hydrogen bonding was formed between the oxygen atom of the carbonyl group in the N-Boc group attached to L-proline and the hydrogen atom of the hydroxy group of the serine in the organic solution as shown in Figure 17a–c and Scheme 4b in the organic solution.
Next, the observed IR spectra in chloroform and in acetonitrile along with the predicted IR spectra of the most stable structures of N-Boc-L-alanine-L-proline-OMe 9 and those of N-Boc-L-serine-L-proline-OMe 10 are shown in Figure 18 and Figure 19 as well as Figure 20 and Figure 21. The absorptions of the carbonyl groups assigned to the carbonyl bond in the carbomethoxy group in 9 in chloroform and in acetonitrile were observed at 1743 and 1747 cm−1, and those assigned to the carbonyl bond in N-Boc group were observed at 1705 and 1709 cm−1 also in chloroform and in acetonitrile as shown in Figure 18b,d. The absorption assigned to the carbonyl bond in the peptide bond was observed at 1649 cm−1 in chloroform, whereas the absorption in acetonitrile was not observed because of the overlap with the background of the solvent (Figure 18b–d).
The absorptions of carbonyl groups assigned to the carbonyl bond in the ester group in 10 were observed at 1736 and 1745 cm−1 in chloroform and in acetonitrile respectively, and those assigned to the carbonyls in the N-Boc group were observed at 1707 and 1712 cm−1 also in chloroform and in acetonitrile respectively, and the absorption assigned to the carbonyl in the peptide bond was observed at 1647 cm−1 in chloroform (Figure 20b,d).
Both the observed IR spectra of 9 and 10 were found to be in good agreement with the estimated IR spectra of the most stable structures of 9 and 10, respectively. It is especially notable that the optimized structure of 10 obtained by the DFT calculation showed the existence of the intramolecular hydrogen bonding between the oxygen atom of the carbonyl bond in the N-Boc group and the hydrogen atom of the hydroxy group of the serine (Figure 21a–c). These results support the solvent effects of the carbonyl group of each N-Boc group in 9 and 10 as shown in Figure 12 and Figure 13.

4. Conclusions

In summary, the correlation between the 13C NMR chemical shift of carbonyl carbons by NMR spectroscopy and the solvent polarity parameter ETN, the IR absorption spectra in solution, and the predicted IR spectra from the optimized structures obtained by DFT calculations can reveal the intermolecular and intramolecular interactions between the amino acid derivatives including dipeptide derivatives and solvents. In the case of N-Boc-protected amino acids and the dipeptides having a small aliphatic functional group (e.g., alanine), more prominent downfield shifts with increase of ETN value were observed for the 13C NMR chemical shifts of the carbonyls in the carbomethoxy group and in the N-Boc groups. This observation indicates the existence of intermolecular forces between the carbonyl group and the solvent due to the less steric hindrance by the amino acids with a small functional group as depicted in Scheme 2. Amino acids and dipeptides having a large functional group (e.g., proline) showed slight downfield shifts for the carbonyl in the N-Boc group with increase of ETN perhaps due to the steric bulkiness and the hydrogen bonding between the oxygen atom of the N-Boc group and the peptide bond as shown in Scheme 4. In particular, the carbonyls in N-Boc-L-proline-L-proline-OMe 8 were hardly affected by the change of the solvent polarity due to the bulkiness (Scheme 4c). In the case of N-Boc-protected amino acid and dipeptides having a hydroxyl group, the 13C NMR chemical shifts of the carbonyl carbon in N-Boc group were almost constant regardless of the polarity of the solvent, due to the intramolecular hydrogen bonding between the oxygen atom of the carbonyl bond of the N-Boc group and the hydrogen atom of the hydroxy group of serine as depicted in Scheme 4b and Scheme 5. The above tendency found on the proline residue of 8 in which the 13C NMR chemical shifts remains near-constant is as notable as this hydrogen bonding.

Supplementary Materials

The following supporting information can be downloaded at: https://www.mdpi.com/article/10.3390/org3010003/s1. Table S1. B3LYP/6-31+G(d) Optimized cartesian coordinates, energies, and calculated frequencies of carbonyl groups in the gas phase for N-Boc-L-proline-L-alanine-OMe 6, Table S2. B3LYP/6-31+G(d) Optimized cartesian coordinates, energies, and calculated frequencies of carbonyl groups in chloroform for N-Boc-L-proline-L-alanine-OMe 6. Table S3. B3LYP/6-31+G(d) Optimized cartesian coordinates, energies, and calculated frequencies of carbonyl groups in acetonitrile for N-Boc-L-proline-L-alanine-OMe 6. Table S4. B3LYP/6-31+G(d) Optimized cartesian coordinates, energies, and calculated frequencies of carbonyl groups in the gas phase for N-Boc-L-proline-L-serine-OMe 7. Table S5. B3LYP/6-31+G(d) Optimized cartesian coordinates, energies, and calculated frequencies of carbonyl groups in chloroform for N-Boc-L-proline-L-serine-OMe 7. Table S6. B3LYP/6-31+G(d) Optimized cartesian coordinates, energies, and calculated frequencies of carbonyl groups in acetonitrile for N-Boc-L-proline-L-serine-OMe 7. Table S7. B3LYP/6-31+G(d) Optimized cartesian coordinates, energies, and calculated frequencies of carbonyl groups in the gas phase for N-Boc-L-alanine-L-proline-OMe 9. Table S8. B3LYP/6-31+G(d) Optimized cartesian coordinates, energies, and calculated frequencies of carbonyl groups in chloroform for N-Boc-L-alanine-L-proline-OMe 9. Table S9. B3LYP/6-31+G(d) Optimized cartesian coordinates, energies, and calculated frequencies of carbonyl groups in acetonitrile for N-Boc-L-alanine-L-proline-OMe 9. Table S10. B3LYP/6-31+G(d) Optimized cartesian coordinates, energies, and calculated frequencies of carbonyl groups in the gas phase for N-Boc-L-serine-L-proline-OMe 10. Table S11. B3LYP/6-31+G(d) Optimized cartesian coordinates, energies, and calculated frequencies of carbonyl groups in chloroform for N-Boc-L-serine-L-proline-OMe 10. Table S12. B3LYP/6-31+G(d) Optimized cartesian coordinates, energies, and calculated frequencies of carbonyl groups in acetonitrile for N-Boc-L-serine-L-proline-OMe 10. Table S13. 13C NMR chemical shifts of carbonyl carbons in 1a, 1b, 2, and 3a. Table S14. 13C NMR chemical shifts of carbonyl carbons in in 3b, 4a, 4b, and 5. Table S15. 13C NMR chemical shifts of carbonyl carbons in 6 and 7. Table S16. 13C NMR chemical shifts of carbonyl carbons in 8 and 9. Table S17. 13C NMR chemical shifts of carbonyl carbons in 10, Video S1, N-Boc-L-proline-L-alanine-OMe 6, Video S2, N-Boc-L-proline-L-serine-OMe 7, Video S3, N-Boc-L-alanine-L-proline-OMe 9, Video S4, N-Boc-L-serine-L-proline-OMe 10.

Author Contributions

Conceptualization, Y.H. and S.N.; methodology, Y.H. and S.N.; investigation, Y.H., S.N., S.C., Y.U., R.H., T.K., D.N. and K.Y.; wrote the manuscript, Y.H. and S.N. All authors have read and agreed to the published version of the manuscript.

Funding

This research was funded by the Strategic Research Foundation Grant-aided Project for Private University (MEXT, Japan), Grants-in-Aid for Scientific Research (JSPS, Japan), and The Iwatani Naoji Foundation Grant, The Ogasawara Toshiaki Foundation Grant, and JST-SICORP Grant (JPMJSC21U3), Japan.

Institutional Review Board Statement

Not applicable.

Informed Consent Statement

Not applicable.

Data Availability Statement

Not applicable.

Acknowledgments

This work has been supported by the Strategic Research Foundation Grant-aided Project for Private University (MEXT, Japan), Grants-in-Aid for Scientific Research (JSPS, Japan), The Iwatani Naoji Foundation Grant, The Ogasawara Toshiaki Foundation Grant, and JST-SICORP Grant (JPMJSC21U3), Japan.

Conflicts of Interest

The authors declare no conflict of interest.

References

  1. Kwan, E.E.; Huang, S.G. Structural Elucidation with NMR Spectroscopy: Practical Strategies for Organic Chemists. Eur. J. Org. Chem. 2008, 2008, 2671–2688. [Google Scholar] [CrossRef]
  2. Günther, H. NMR Spectroscopy: Basic Principles, Concepts and Applications in Chemistry, 3rd ed.; Wiley-VCH: Weinheim, Germany, 2013. [Google Scholar]
  3. Dias, D.A.; Jones, O.A.H.; Beale, D.J.; Boughton, B.A.; Benheim, D.; Kouremenos, K.A.; Wolfender, J.-L.; Wishart, D.S. Current and Future Perspectives on the Structural Identification of Small Molecules in Biological Systems. Metabolites 2016, 6, 46. [Google Scholar] [CrossRef]
  4. Maeda, M.; Aoyama, T.; Takido, T.; Seno, M. Hydrogen-Bonding Interactions of C-Tetraundecenylresorc[4]arene with Some Guest Molecules. J. Oleo Sci. 2006, 55, 637–646. [Google Scholar] [CrossRef] [Green Version]
  5. Mann, S.K.; Pham, T.N.; McQueen, L.L.; Lewandowski, J.R.; Brown, S.P. Revealing Intermolecular Hydrogen Bonding Structure and Dynamics in a Deep Eutectic Pharmaceutical by Magic-Angle Spinning NMR Spectroscopy. Mol. Pharm. 2020, 17, 622–631. [Google Scholar] [CrossRef] [PubMed] [Green Version]
  6. Milic, M.; Targos, K.; Chavez, M.T.; Thompson, M.A.M.; Jennings, J.J.; Franz, A.K. NMR Quantification of Hydrogen-Bond-Accepting Ability for Organic Molecules. J. Org. Chem. 2021, 86, 6031–6043. [Google Scholar] [CrossRef]
  7. Pease, L.G.; Deber, C.M.; Blout, E.R. Cyclic Peptides. V. 1H and 13C Nuclear Magnetic Resonance Determination of the Preferred β Conformation for Proline-Containing Cyclic Hexapeptides. J. Am. Chem. Soc. 1973, 95, 258–260. [Google Scholar] [CrossRef]
  8. Nakata, S.; Tenno, R.; Deguchi, A.; Yamamoto, H.; Hiraga, Y.; Izumi, S. Marangoni Flow around a Camphor Disk Regenerated by the Interaction between Camphor and Sodium Dodecyl Sulfate Molecules. Colloids Surf. A Physicochem. Eng. Asp. 2015, 466, 40–44. [Google Scholar] [CrossRef]
  9. Hiraga, Y.; Chaki, S.; Niwayama, S. 13C NMR Spectroscopic Studies of the Behaviors of Carbonyl Compounds in Various Solutions. Tetrahedron Lett. 2017, 58, 4677–4681. [Google Scholar] [CrossRef]
  10. Reichardt, C. Solvents and Solvent Effects in Organic Chemistry, 3rd ed.; Wiley-VCH: Weinheim, Germany, 2003. [Google Scholar]
  11. Reichardt, C. Solvatochromic Dyes as Solvent Polarity Indicators. Chem. Rev. 1994, 94, 2319–2358. [Google Scholar] [CrossRef]
  12. Niwayama, S. Highly Efficient Selective Monohydrolysis of Symmetric Diesters. J. Org. Chem. 2000, 65, 5834–5836. [Google Scholar] [CrossRef]
  13. Sarnowski, M.P.; Kang, C.W.; Elbatrawi, Y.M.; Wojtas, L.; Valle, J.R.D. Peptide N-Amination Supports β-Sheet Conformation. Angew. Chem. Int. Ed. 2017, 56, 2083–2086. [Google Scholar] [CrossRef] [PubMed]
  14. Ramotowska, S.; Zarzeczańska, D.; Dąbkowska, I.; Wcisło, A.; Niedziałkowski, P.; Czaczyk, E.; Grobelna, B.; Ossowski, T. Hydrogen Bonding and Protonation Effects in Amino Acids’ Anthraquinone Derivatives—Spectroscopic and Electrochemical Studies. Spectrochim. Acta Part A Mol. Biomol. Spectrosc. 2019, 222, 117226. [Google Scholar] [CrossRef]
  15. Shoulders, M.D.; Raines, R.T. Interstrand Dipole-Dipole Interactions Can Stabilize the Collagen Triple Helix. J. Biol. Chem. 2011, 286, 22905–22912. [Google Scholar] [CrossRef] [Green Version]
  16. Shamsir, M.S.; Dalby, A.R. β-Sheet Containment by Flanking Prolines: Molecular Dynamic Simulations of the Inhibition of β-Sheet Elongation by Proline Residues in Human Prion Protein. Biophys. J. 2007, 92, 2080–2089. [Google Scholar] [CrossRef] [PubMed] [Green Version]
  17. Lee, C.; Kalmar, L.; Xue, B.; Tompa, P.; Daughdrill, G.W.; Uversky, V.N.; Han, K.-H. Contribution of Proline to the Pre-structuring Tendency of Transient Helical Secondary Structure Elements in Intrinsically Disordered Proteins. Biochim. Biophys. Acta 2014, 1840, 993–1003. [Google Scholar] [CrossRef] [PubMed] [Green Version]
  18. Deber, C.M.; Bovey, F.A.; Carver, J.P.; Blout, E.R. Nuclear Magnetic Resonance Evidence for cis-Peptide Bonds in Proline Oligomers. J. Am. Chem. Soc. 1970, 92, 6191–6198. [Google Scholar] [CrossRef]
  19. Torchia, D.A.; Sparks, S.W. Proline Assignments and Identification of the Cis K116/P117 Peptide Bond in Liganded Staphylococcal Nuclease Using Isotope Edited 2D NMR Spectroscopy. J. Am. Chem. Soc. 1989, 111, 8315–8317. [Google Scholar] [CrossRef]
  20. Ohgo, K.; Dabalos, C.L.; Kumashiro, K.K. Solid-State NMR Spectroscopy and Isotopic Labeling Target Abundant Dipeptide Sequences in Elastin’s Hydrophobic Domains. Macromolecules 2018, 51, 2145–2156. [Google Scholar] [CrossRef]
  21. Lansing, J.C.; Hu, J.G.; Belenky, M.; Griffin, R.G.; Herzfeld, J. Solid-State NMR Investigation of the Buried X-Proline Peptide Bonds of Bacteriorhodopsin. Biochemistry 2003, 42, 3586–3593. [Google Scholar] [CrossRef]
  22. Aliv, A.E.; Courtier-Murias, D. Conformational Analysis of L-Prolines in Water. J. Phys. Chem. B 2007, 111, 14034–14042. [Google Scholar] [CrossRef]
  23. Budαěšínský, M.; Ragnarsson, U.; Lankiewicz, L.; Grehn, L.; Slaninová, J.; Hlaváček, J. Synthesis and Utilization of 13C and 15N Backbone-labeled Proline: NMR Study of Synthesized Oxytocin with Backbone-labeled C-terminal Tripeptide Amide. Amino Acids 2005, 29, 151–160. [Google Scholar] [CrossRef]
  24. Presser, A.; Hüfner, A. Trimethylsilyldiazomethane—A Mild and Efficient Reagent for the Methylation of Carboxylic Acids and Alcohols in Natural Products. Mon. Chem. 2004, 135, 1015–1022. [Google Scholar] [CrossRef]
  25. Leggio, A.; Liguori, A.; Perri, F.; Siciliano, C.; Viscomi, M.C. Methylation of α-Amino Acids and Derivatives Using Trimethylsilyldiazomethane. Chem. Biol. Drug Des. 2009, 73, 287–291. [Google Scholar] [CrossRef] [PubMed]
  26. Blatchly, R.A.; Allen, T.R.; Bergstrom, D.T.; Shinozaki, Y. Microscale Synthesis and Analysis of a Dipeptide. J. Chem. Educ. 1989, 66, 965–966. [Google Scholar] [CrossRef]
  27. Abdurragman, J.; Wahyuningrum, D.; Achmad, S.; Bundjali, B. Synthesis of Dipeptide Benzoylalanylglycine Methyl Ester and Corrosion Inhibitor Evaluation by Tafel Equation. Sains Malays. 2011, 40, 973–976. [Google Scholar]
  28. Available online: https://gaussian.com/glossary/g09/ (accessed on 30 December 2021).
  29. Eilme, A. Solvatochromic Probe in Molecular Solvents: Implicit Versus Explicit Solvent Model. Theor. Chem. Acc. 2014, 133, 1538. [Google Scholar] [CrossRef] [Green Version]
  30. Klamt, A.; Moya, C.; Palomar, J. A Comprehensive Comparison of the IEFPCM and SS(V)PE Continuum Solvation Methods with the COSMO Approach. J. Chem. Theory Comput. 2015, 11, 4220–4225. [Google Scholar] [CrossRef] [Green Version]
Scheme 1. N-Boc-protected amino acids and these derivatives.
Organics 03 00003 sch001
Figure 1. 13C NMR chemical shifts of the carbonyl carbons of N-Boc-L-alanine-OH 1a.
Organics 03 00003 g001
Figure 2. 13C NMR chemical shifts of the carbonyl carbons of N-Boc-L-valine-OH 2.
Organics 03 00003 g002
Figure 3. 13C NMR chemical shifts of the carbonyl carbons of N-Boc-L-proline-OH 3a.
Organics 03 00003 g003
Figure 4. 13C NMR chemical shifts of the carbonyl carbons of N-Boc-L-serine-OH 4a.
Organics 03 00003 g004
Figure 5. 13C NMR chemical shifts of the carbonyl carbons of N-Boc-L-threonine-OH 5.
Organics 03 00003 g005
Figure 6. 13C NMR chemical shifts of the carbonyl carbons of N-Boc-L-alanine-OMe 1b.
Organics 03 00003 g006
Figure 7. 13C NMR chemical shifts of the carbonyl carbons of N-Boc-L-proline-OMe 3b.
Organics 03 00003 g007
Figure 8. 13C NMR chemical shifts of the carbonyl carbons of N-Boc-L-serine-OMe 4b.
Organics 03 00003 g008
Scheme 2. The existence of intermolecular forces between the carbonyl group in N-Boc-protected amino acid derivatives having several functional groups. (a) Small nonpolar aliphatic functional group, (b) large nonpolar aliphatic functional group, (c) a polar functional group (hydroxy group).
Organics 03 00003 sch002
Scheme 3. N-Boc-protected dipeptide derivatives.
Organics 03 00003 sch003
Figure 9. 13C NMR chemical shifts of the carbonyl carbons of N-Boc-L-proline-L-alanine-OMe 6.
Organics 03 00003 g009
Scheme 4. Steric effects caused by the proline residue, the N-Boc group, and intramolecular hydrogen bonding. (a) N-Boc-L-proline-L-alanine-OMe 6, (b) N-Boc-L-proline-L-serine-OMe 7, (c) N-Boc-L-proline-L-proline-OMe 8.
Organics 03 00003 sch004
Figure 10. 13C NMR chemical shifts of the carbonyl carbons of N-Boc-L-proline-L-serine-OMe 7.
Organics 03 00003 g010
Figure 11. 13C NMR chemical shifts of the carbonyl carbons of N-Boc-L-proline-L-proline-OMe 8.
Organics 03 00003 g011
Figure 12. 13C NMR chemical shifts of the carbonyl carbons of N-Boc-L-alanine-L-proline-OMe 9.
Organics 03 00003 g012
Figure 13. 13C NMR chemical shifts of the carbonyl carbons of N-Boc-L-serine-L-proline-OMe 10.
Organics 03 00003 g013
Scheme 5. Steric effects caused by the proline residue and intramolecular hydrogen bonding in N-Boc-L-serine-L-proline-OMe 10.
Organics 03 00003 sch005
Figure 14. IR spectra of N-Boc-L-proline-L-alanine-OMe 6: (a) CHCl3 (red line); (b) 20 mmol/L of 6 in CHCl3; (c) acetonitrile (blue line); (d) 20 mmol/L of 6 in acetonitrile.
Organics 03 00003 g014
Figure 15. The most stable structure and calculated IR spectra of N-Boc-L-proline-L-alanine-OMe 6: (a) The most stable structure in the gas phase; (b) the most stable structure in chloroform; (c) the most stable structure in acetonitrile; (d) calculated IR spectrum in the gas phase; (e) calculated IR spectrum in chloroform; (f) calculated IR spectrum in acetonitrile. Same and Opposite in (d,f) mean the stretching vibration in the same direction and opposite direction for each carbonyl bond, respectively.
Organics 03 00003 g015
Figure 16. IR spectra of N-Boc-L-proline-L-serine-OMe 7: (a) CHCl3 (red line); (b) 20 mmol/L of 7 in CHCl3; (c) acetonitrile (blue line); (d) 20 mmol/L of 7 in acetonitrile.
Organics 03 00003 g016
Figure 17. The most stable structure and calculated IR spectra of N-Boc-L-proline-L-serine-OMe 7: (a) The most stable structure in the gas phase; (b) the most stable structure in chloroform; (c) the most stable structure in acetonitrile; (d) calculated IR spectrum in the gas phase; (e) calculated IR spectrum in chloroform; (f) calculated IR spectrum in acetonitrile.
Organics 03 00003 g017
Figure 18. IR spectra of N-Boc-L-alanine-L-proline-OMe 9: (a) CHCl3 (red line); (b) 20 mmol/L of 9 in CHCl3; (c) acetonitrile (blue line); (d) 20 mmol/L of 9 in acetonitrile.
Organics 03 00003 g018
Figure 19. The most stable structure and calculated IR spectra of N-Boc-L-alanine-L-proline-OMe 9: (a) the most stable structure in the gas phase, (b) the most stable structure in chloroform, (c) the most stable structure in acetonitrile, (d) calculated IR spectrum in the gas phase, (e) calculated IR spectrum in chloroform, (f) calculated IR spectrum in acetonitrile.
Organics 03 00003 g019
Figure 20. IR spectra of N-Boc-L-serine-L-proline-OMe 10: (a) CHCl3 (red line); (b) 20 mmol/L of 10 in CHCl3; (c) acetonitrile (blue line); (d) 20 mmol/L of 10 in acetonitrile.
Organics 03 00003 g020
Figure 21. The most stable structure and calculated IR spectra of N-Boc-L-serine-L-proline-OMe 10: (a) the most stable structure in the gas phase, (b) the most stable structure in chloroform, (c) the most stable structure in acetonitrile, (d) calculated IR spectrum in the gas phase, (e) calculated IR spectrum in chloroform, (f) calculated IR spectrum in acetonitrile.
Organics 03 00003 g021
Publisher’s Note: MDPI stays neutral with regard to jurisdictional claims in published maps and institutional affiliations.

