Article

Evaluation of Vaporizing Diesel Spray with High-Speed Laser Absorption Scattering Technique for Measuring Vapor and Liquid Phase Concentration Distributions

1
Department of Mathematics, Bangabandhu Sheikh Mujibur Rahman Science & Technology University, Gopalganj 8100, Bangladesh
2
UCI Combustion Laboratory, University of California, Irvine, CA 92697, USA
3
Mechanical Engineering Program, Graduate School of Advanced Science and Engineering, University of Hiroshima, Hiroshima 739-0046, Japan
4
Department of Mechanics and Maritime Sciences, Chalmers University of Technology, SE-412 96 Goteborg, Sweden
*
Author to whom correspondence should be addressed.
Fuels 2023, 4(1), 75-91; https://doi.org/10.3390/fuels4010006
Submission received: 3 November 2022 / Revised: 30 December 2022 / Accepted: 26 January 2023 / Published: 16 February 2023

Abstract

:
The Conventional Laser Absorption Scattering (C-LAS) technique is used to measure the mixture concentration and visualize the vapor phase. The former is determined by the attenuation of visible and ultraviolet light whereas the latter is achieved via light absorption and scattering theory. The C-LAS uses the Nd: YAG pulsed laser and CCD cameras to provide one spray shot at a particular instance which requires time and effort. However, the temporal measurement of a single spray shot is not possible. To record the distribution of the whole vapor phase in an injection event and measure liquid and vapor concentrations inside the spray, a High-Speed Laser Absorption Scattering (HS-LAS) technique was developed. The HS-LAS consists of continuous diode light sources, high-speed video cameras, and an image intensifier for UV light, which can provide the temporal variation of a single-shot spray. In the experiment, a commercial seven-hole injector with a hole diameter of 0.123 mm allowing high injection pressure of up to 100 MPa was used to avoid the potential inconsistencies with a single-hole test injector. The diesel surrogate fuel which consists of 97.5% n-tridecane and 2.5% of volume-based 1-methylnaphthalene was used. The injection amount of 5.0 mg/hole was selected to investigate the structure and mixture formation process of the spray. The findings of the experiments show that this imaging approach is a promising diagnostic technique for concurrently obtaining quantitative information on the quantity of vapor and droplets in a fuel spray. Furthermore, the turbulent/vortex fluid dynamics’ temporal development/variation can be investigated.

1. Introduction

Fuel injection and the air-fuel mixture quality play a vital role in diesel engine combustion performance. Direct injection (D.I.) diesel engines require a better understanding of the fuel injection process as well as liquid and vapor phase fuel concentration to improve engine efficiency, performance, and emissions. This is because, when the liquid fuel in the diesel engine is injected into the high-temperature and high-pressure atmosphere, the liquid fuel jet breaks up, and the fuel evaporates as well as mixes with the ambient air [1,2,3,4].
As liquid droplets and vapor coexist simultaneously in diesel spray evaporation, the quantitative estimation becomes rather challenging. Throughout the last several decades, various diagnostic techniques have been established to make such estimations. Two of the earliest optical diagnostics were shadowgraph and Schlieren imaging; these were mainly used to observe the qualitative information of the evaporating diesel spray structure [5,6]. Holography is one of the unique methods of recording three-dimensional information on a fuel spray by using the interference of laser light. It has demonstrated the ability to provide temperature distributions, velocity, droplet size and vapor concentration inside a fuel spray [7,8,9], but due to noise interference, it can only provide estimations in moderate ambient density/temperature and low atmospheric vapor concentration. Raman spectroscopy technique was applied for a line-imaging or single-point measurement of fuel-air ratio inside the combustion chamber [10,11]. However, Raman scattering is such a weak process, it must be carefully considered in terms of signal-to-noise ratio. When Raman spectroscopy is used to examine the entire spray zone, it is a time-consuming process.
At low gas density, planar laser Rayleigh scattering (PLRS) is frequently used for quantitative measurements of vapor phase equivalence ratio [12,13,14]. Especially, strong scattering from liquid droplets must be suppressed in PLRS vapor-fuel measurements in an evaporating liquid fuel spray. In other words, in the presence of liquid droplets, PLRS is not suitable for determining fuel vapor concentration. The laser induced exciplex fluorescence (LIEF) technology should be emphasized, because it is commonly used to simultaneously evaluate vapor and liquid phase concentrations [15,16,17,18,19,20,21,22,23,24,25]. Nonetheless, problems with this measurement are common, such as fluorescence suppression by oxygen and crosstalk between exciplex (liquid) and monomer (vapor) fluorescence due to overlapping emission spectra. In addition, it is challenging to apply LIEF quantitatively to evaporating sprays in a high-temperature atmosphere, because when the temperature surpasses 500K, the fluorescence is highly dependent on the temperature [18].
Suzuki et al. [26] established the laser absorption scattering (LAS) technique to determine the liquid and vapor concentration in the diesel spray. The LAS technique [20,21] is just a line-of-sight extinction method with various benefits such as high signal/noise ratio, no fluorescence quenching and low atmospheric temperature dependence. Previously, Zhang et al. [22] employed 1,3-dimethylnaphthalene (1,3-DMN) as a LAS test fuel. Nevertheless, it was observed that the spray structure of 1,3-DMN differs from that of diesel fuel, which could lead to absorption saturation. Therefore, Nishida et al. [23] used a LAS fuel consisting of 97.5% n-tridecane and 2.5% 1-methylnaphthalene (1-MN) by volume basis. It was observed that this tracer LAS fuel had physical properties similar to diesel fuel, and absorption was not saturated. However, until now, the LAS approach has only been utilized for single-shot measurements, meaning that each injection event includes only one spray image.
Until now, the LAS approach has only been utilized for single-shot measurements, meaning that each injection event includes only one spray image. Thus a new method, that is, a high-speed laser absorption scattering (HS-LAS) technique is developed in this study. UV LED and Continuous Wave (CV) laser were employed as continuous UV and visible light sources, respectively, and one intensifier was fixed with a B/W high-speed video camera to detect UV light whereas another color camera detected visible light. Tracer LAS fuel was used for the fuel injection. In addition, the deconvolution named onion-peeling model and extended laser absorption scattering (LAS) techniques were applied to analyze the spray characteristic and mixture formation. Particularly, spray behaviors such as the distribution of liquid and vapor phases, equivalence ratio, vapor concentration and distribution of the vapor mass were analyzed.

2. Methodology

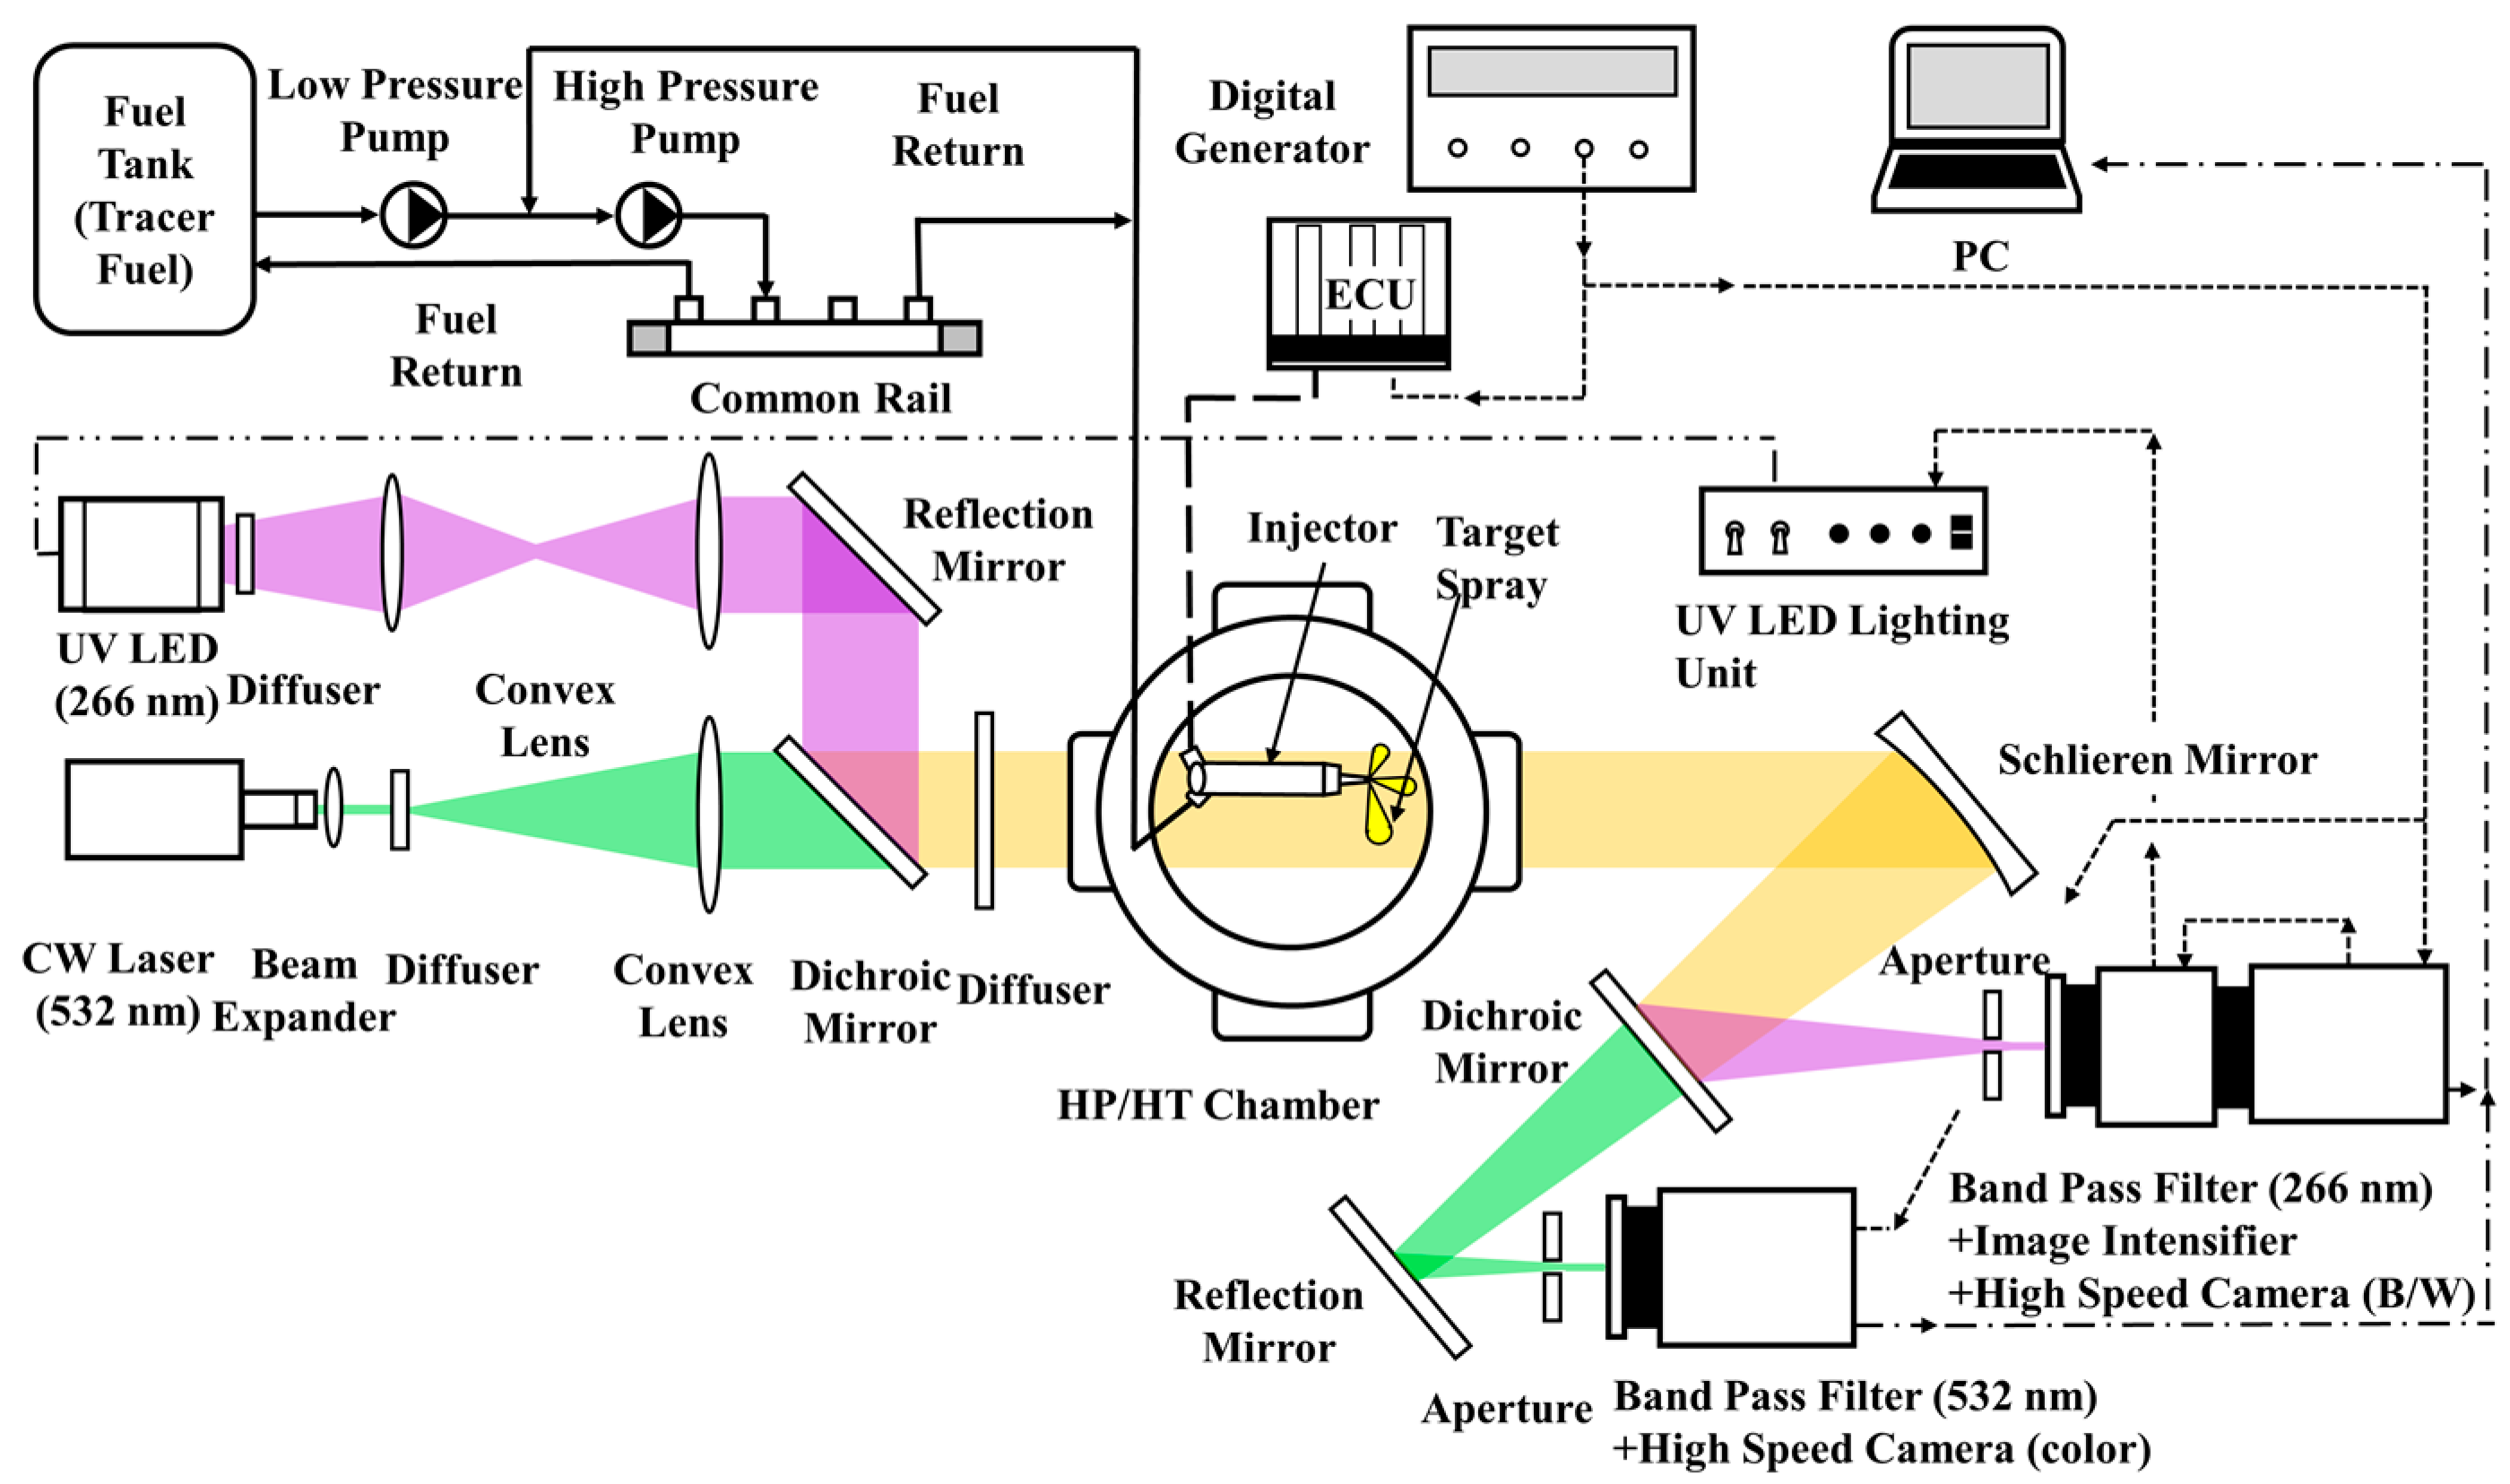
2.1. Experimental Setup

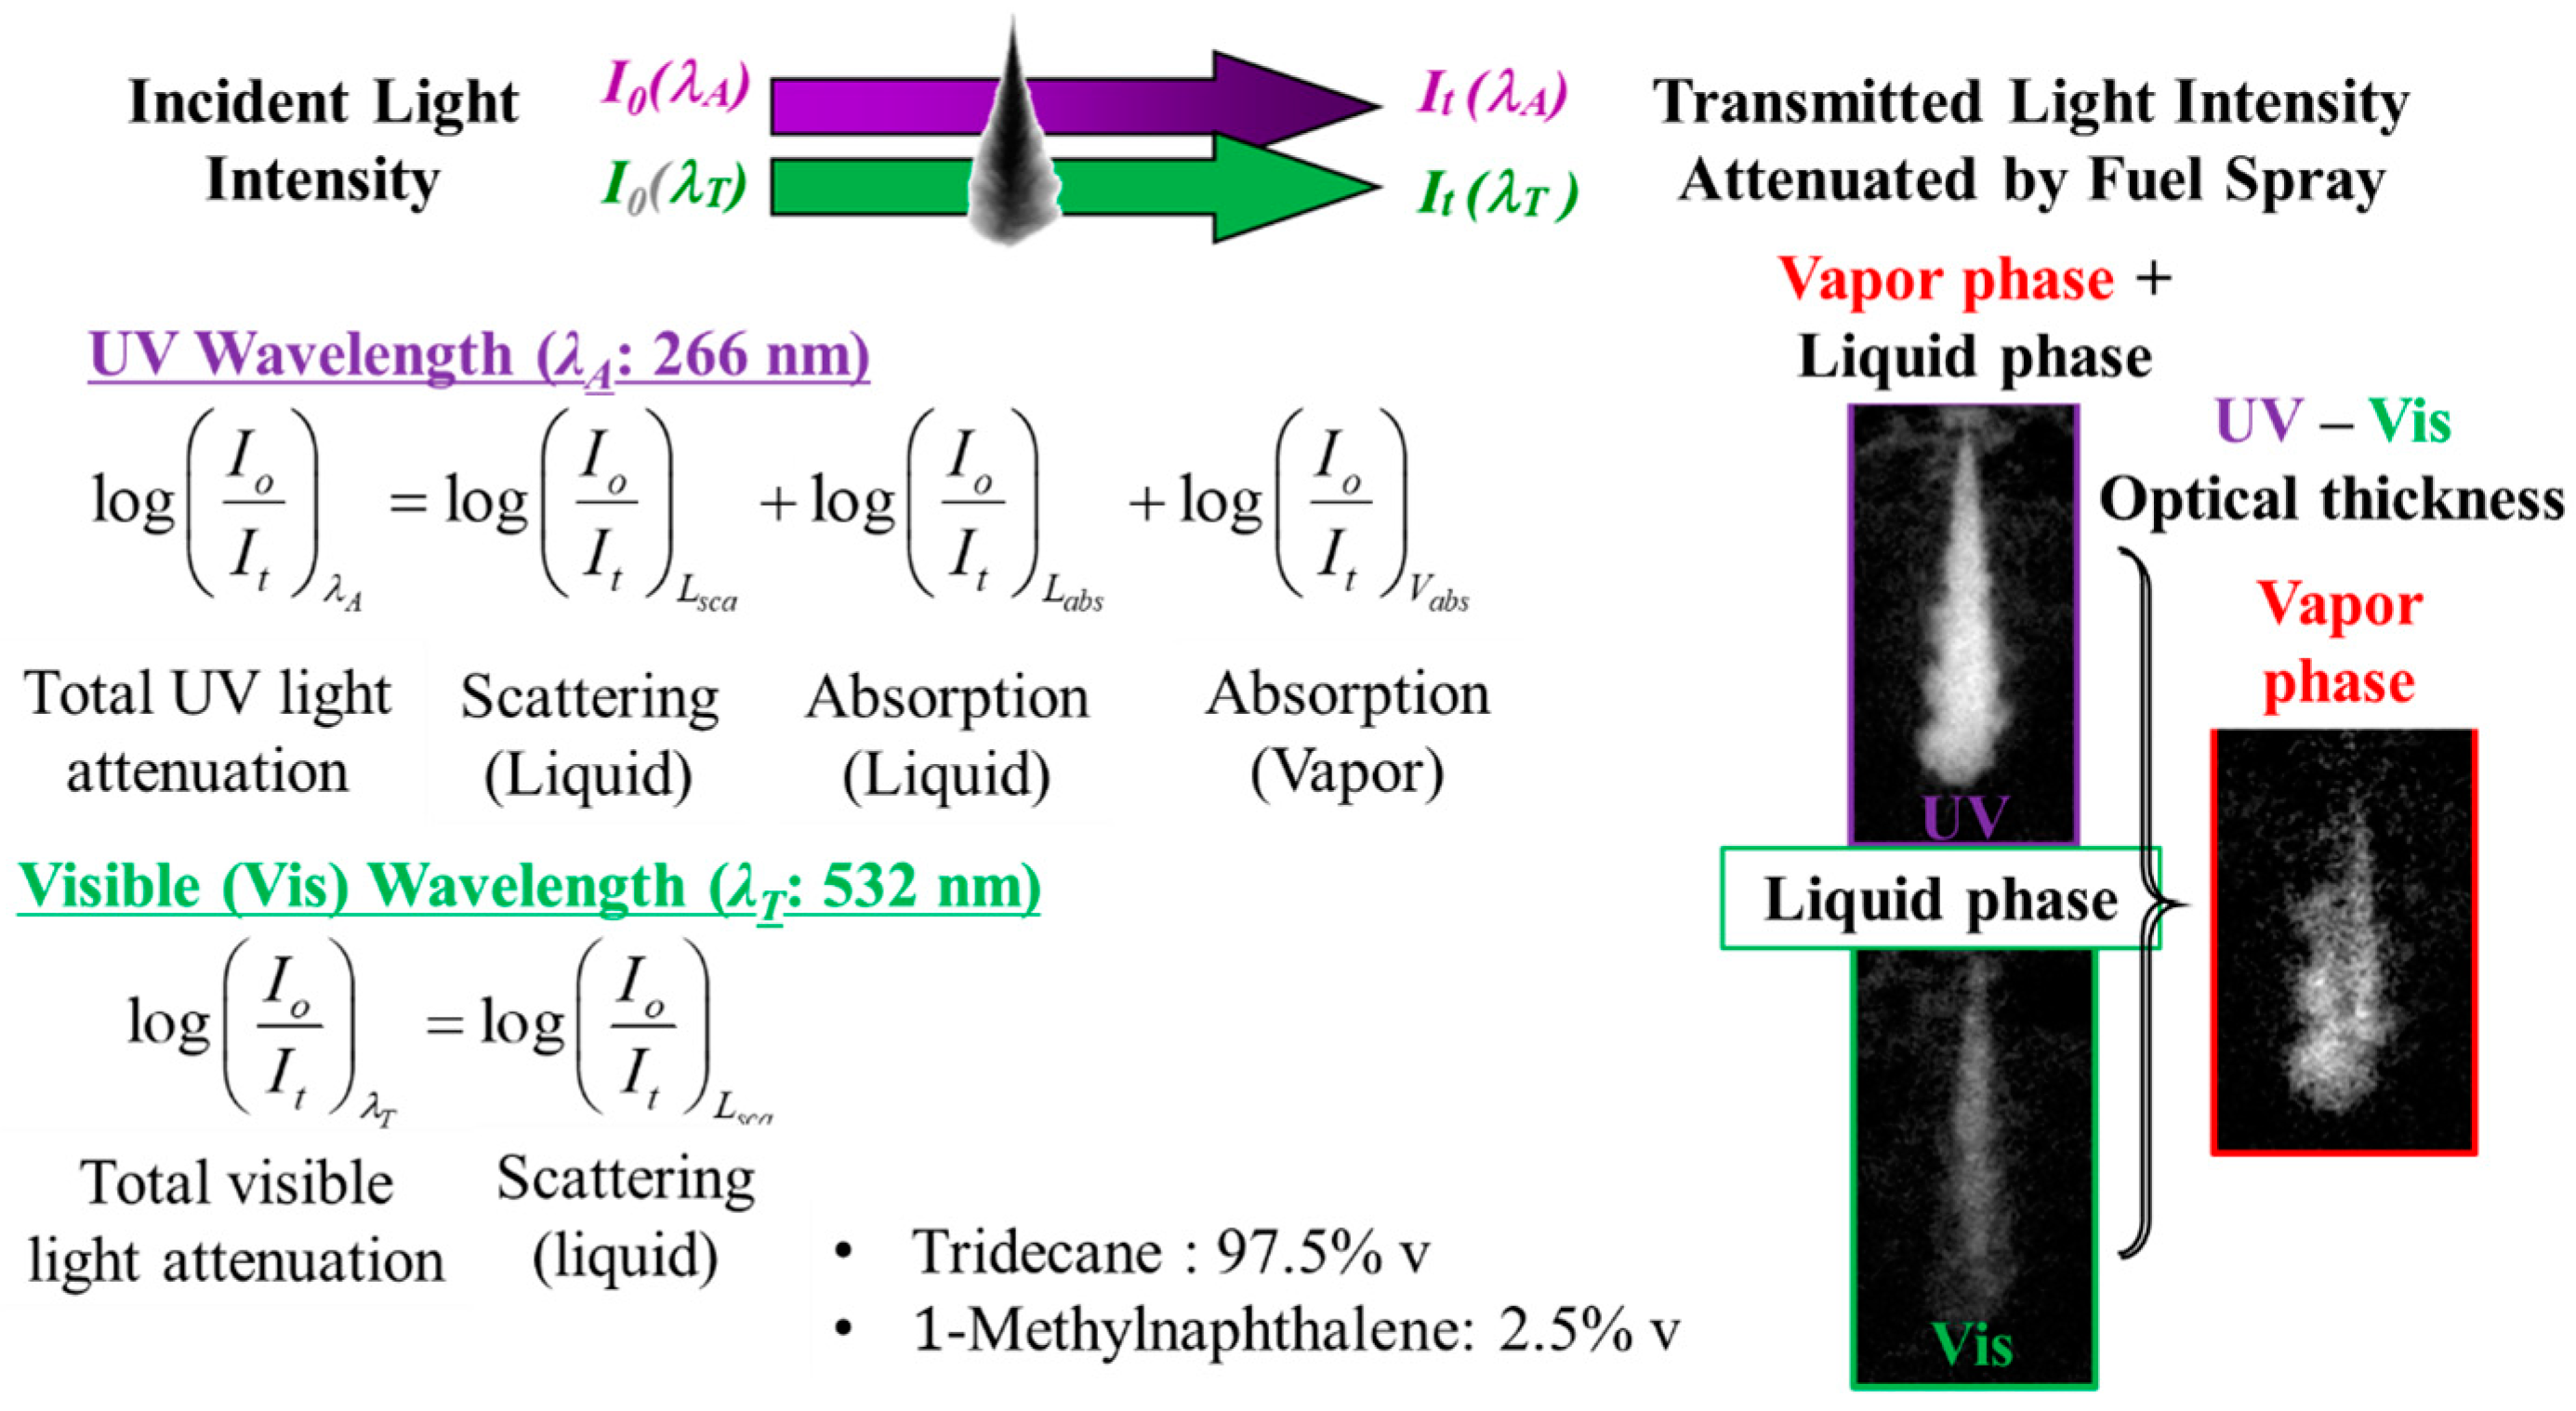
2.1.1. Measurement Principle

This paper does not describe the details of the C-LAS principle since as it was systematically presented in previous papers [22,24,25,26,27,28]. Here, the C-LAS technique is only illustrated simply, as necessary for reading this paper. In the C-LAS technique two types of light beams are used: 532 nm (visible) and 266 nm (ultraviolet). Two incident light beams pass through the spray, as illustrated in Figure 1. The transmitted light intensities are reduced by the effect of attenuation. In the UV (ultraviolet) image, the intensity is attenuated via liquid scattering and liquid absorption as well as vapor absorption; in the Vis(visible) image, the extinction is only caused by droplet scattering. Therefore, the vapor phase optical thickness can be obtained by subtracting the visible phase optical thickness from the UV optical thickness.
However, to measure the spatial distribution of vapor and liquid concentration, the onion peeling is applied to the vapor and liquid phase optical thickness for the case of axisymmetric spray [22]. The radial cross section of the spray is divided into many concentric rings in the processing model. When each ring’s width is extremely narrow, the concentrations within the ring can be termed homogeneous. The concentration of vapor phase fuel in each ring can be calculated through Lambert–Beer’s law by Equation (1). For liquid concentration, it is assumed that liquid droplets in the spray have a uniform Sauter Mean Diameter (SMD). Based on droplet optical thickness and light scattering theory, the concentration of the liquid can be determined as shown in Equation (2). The SMD is measured by summing the liquid droplet optical thickness in the whole extinction image of the spray.
C v = 1 ε λ A L log I o I t λ A - R log I o I t λ A
C L = 2.303 2 3 L f S M D R k · Q e x t l o g I 0 I t l T
S M D = 0.63 R Q e x t M f f s l n I 0 I t l T Δ S
It is important to note that the onion peeling method can be used again to calculate the volume-based fuel concentration, the distribution of mixture temperature, overall amount of air entrainment and equivalence ratio. The mass concentration of ambient gas entrainment is calculated via the ideal gas equation. Therefore, the average equivalence ratios of vapor and liquid phase could be estimated by applying Equations (4) and (5), respectively.
ϕ v = A F S T O I C H A F V = A F S T O I C H ( C a C v )
ϕ L = A F S T O I C H A F L = A F S T O I C H C a C l - C a f
In fact, in a diesel engine, the spray is always non-axisymmetric. When the C-LAS method is used to examine a non-axisymmetric spray pattern, the onion-peeling method is not available. Therefore, ref. [29] modified the C-LAS method to analyze the non-axisymmetric spray concentrations.

2.1.2. Optical Arrangement

The specifications of light source and image intensifier are illustrated in Table 1. A 26.2 W UV LED and a 2W Constant Wave (CW) diode laser are used as ultraviolet and visible light source. The wavelengths of ultraviolet and visible light are 266 nm and 532 nm, respectively. To capture the spray images, two high-speed video cameras B/W and color (NAC-MEMRECAM HX-3) are selected. The frame rate and resolution of both cameras are 20,000 frames per second (fps) and 512 × 512 pixels, respectively. A UVi image intensifier (Invisible Vision Ltd., Norwich, UK) is attached in front of the B/W camera to capture the UV image.
A schematic of the optical arrangement of the high-speed laser absorption scattering (HS-LAS) imaging system and the spray injection system is shown in Figure 2. To carry out the experiment, a high-pressure, high temperature constant volume chamber was used. The chamber was cylindrical in shape with four optical windows, where two quartz windows of 100-mm diameter were selected for spray visualization. The injector was positioned on the top of the chamber. Moreover, to obtain the required injection pressure, a common rail system was used. Since the experiment was performed at evaporation condition, an electric heater was positioned in the center of the lower part of the spray chamber. Further, the insulator was stuck to the inner walls of the chamber. The necessary ambient temperature was controlled accordingly via the 20 A heating system. In order to monitor the temperature at various locations in the spray chamber, three thermocouples were used. Since ultraviolet and visible lights were used for the current study, the visible light was expanded to about φ100 mm diameter by a visible beam expander and passed through the convex lens whereas the ultraviolet light was passed through φ50 mm and φ100 mm diameter convex lenses. A reflection mirror and a dichroic mirror made the two light beams coaxial and directed them to the beam diffuser to offer a homogeneous spray image background and passed them through the fuel spray injected into a test chamber. After attenuation due to absorption and/or scattering of the fuel vapor and droplets, the light beams were reflected by the Schlieren mirror. Then, the pair of beams was separated by another dichroic and a reflection mirror directing the two beams into the respective high-speed video camera. A multi hole injector adaptor was designed to carry out this experiment such that most of the spray plume can be visible. The injector was mounted to the adaptor such that at least one of the spray plumes could be perpendicular to the merged light beam. However, because of the actual viewpoint and blurriness of the window at high ambient pressure and temperature, the nozzle tip’s location could not be seen clearly. Therefore, the first 7 mm downstream of the nozzle tip was eliminated from the original image during image processing to provide a synthetic and clean appearance of the data [24,25,26,27,28,29,30]. The Vis and UV images were then synchronized, and ensemble averaging was applied to six image sequences recorded at each experimental condition. Finally, the line-of-sight images were deconvoluted using the onion-peeling method.

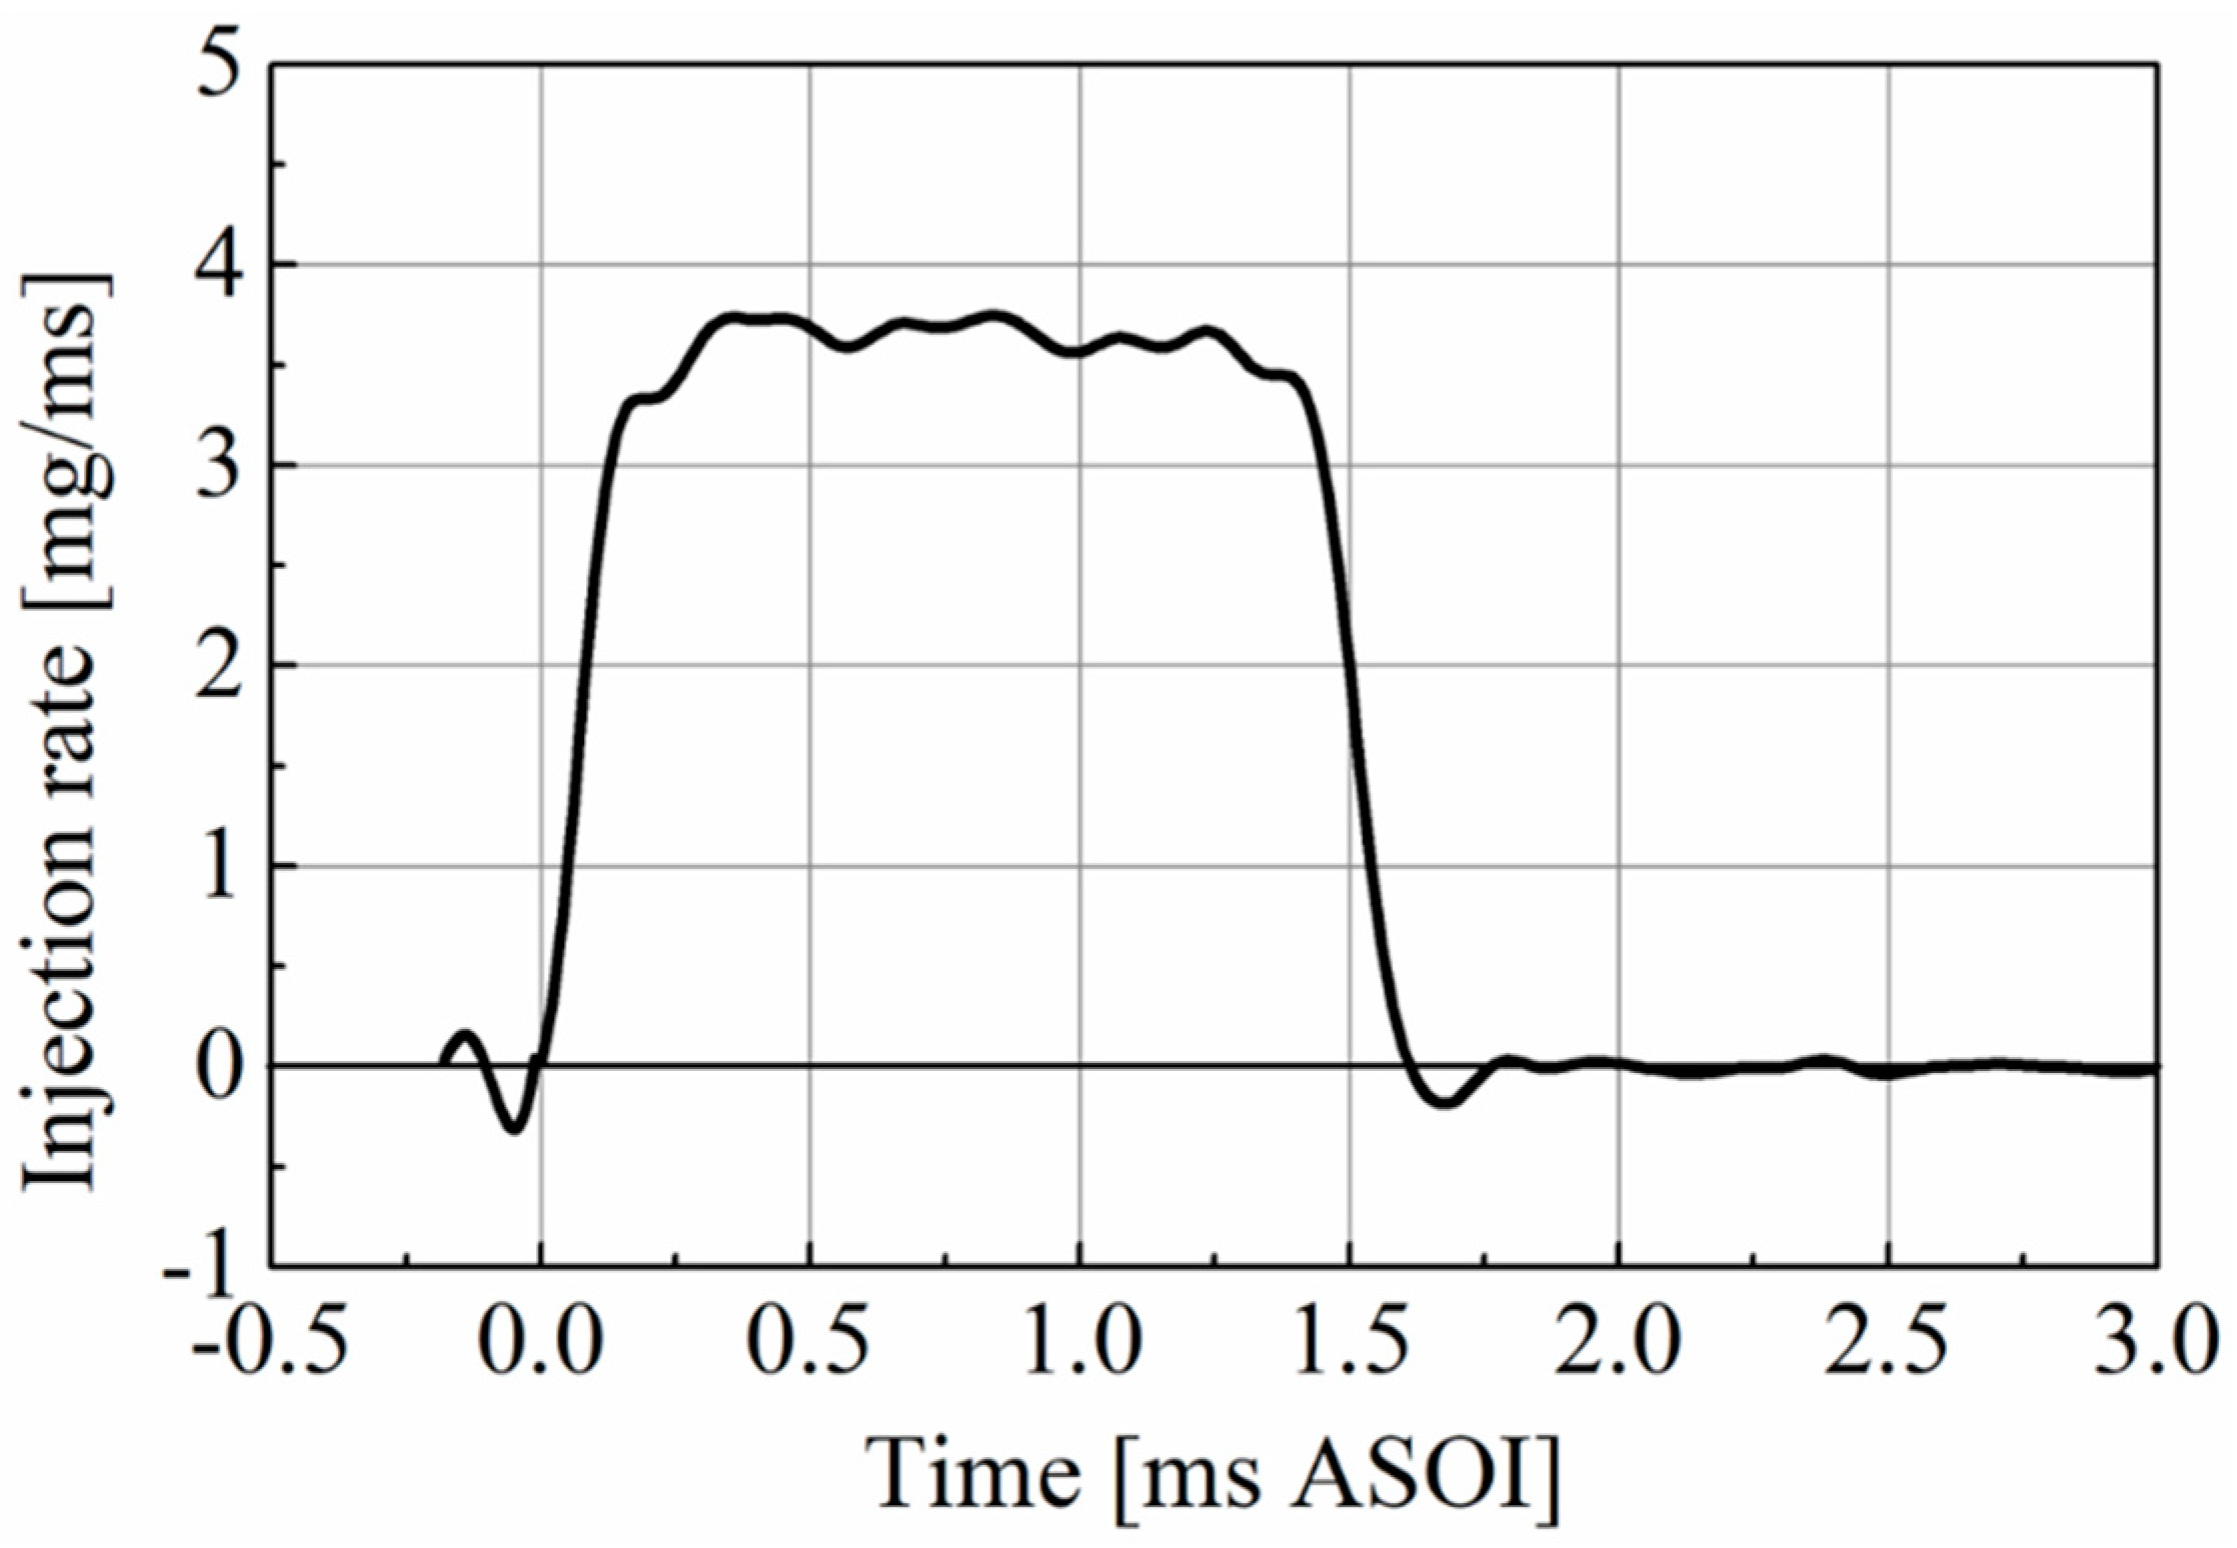
2.2. Experimental Conditions

In the C-LAS technique, the commercial diesel fuel cannot be used because the UV absorption of most commercial diesel fuels is high (due to a high aromatic content) but difficult to predict and calibrate and may vary from different qualities and suppliers and even batch to batch. Therefore, the selected fuel needs to meet the physical properties of diesel fuel, and to have sufficient absorption complying with Lambert–Beer’s law. The Tracer LAS fuel with the composition of 97.5% n-Tridecane and 2.5% 1-MN fuel was therefore chosen for this study. Furthermore, the chamber was filled with pure nitrogen gas to create a vaporizing atmosphere for the diesel spray but avoid reaction. The ambient temperature and pressure were set at 800 K and 4.8 MPa, respectively, while the gas density was kept at about 20.2 kg/m3. The fuel injection pressure of 100 MPa was achieved using a common rail system. A multi-hole injector with seven holes (whose diameter was 0.123 mm each) was used in this study. The injector was attached to a multi-hole adaptor, which was fixed at the chamber’s top. The injector was controlled by an ECU (electronic control unit) and a delay pulse generator (Stanford Research System Model DG645) was used to control the injection mass and injection timing. The experimental conditions are shown in Table 2.
The injection rate is shown in Figure 3. The Zeuch method was used to measure the injection rate shape, employing an injection rate meter (Ono Sokki’s Co., Ltd., FJ-07000, Yokohama, Japan). The mass flow rate and the pressure of the chamber are the main features of the Zeuch method. The fuel mass grows as more fuel is injected into the chamber, allowing the chamber pressure to increase [31,32,33,34,35]. As stated previously, a seven-hole injector was used to determine the injection rate; the total amount of injected fuel mass was 5 mg per hole, and the backpressure was 2 MPa. The injection duration is 1.62 ms and the mass flow rate moves through the transient to the quasi-steady stage between 0.0 ms and 0.3 ms ASOI. The maximum injection rate is around 3.6 mg/ms, which is found during the quasi-steady stage. However, the characteristics of the shot-to-shot variation, mixture formation process and vapor mass distribution of reference condition will be comprehensively compared and discussed based on the various injection timings in the following section.

3. Results and Discussion

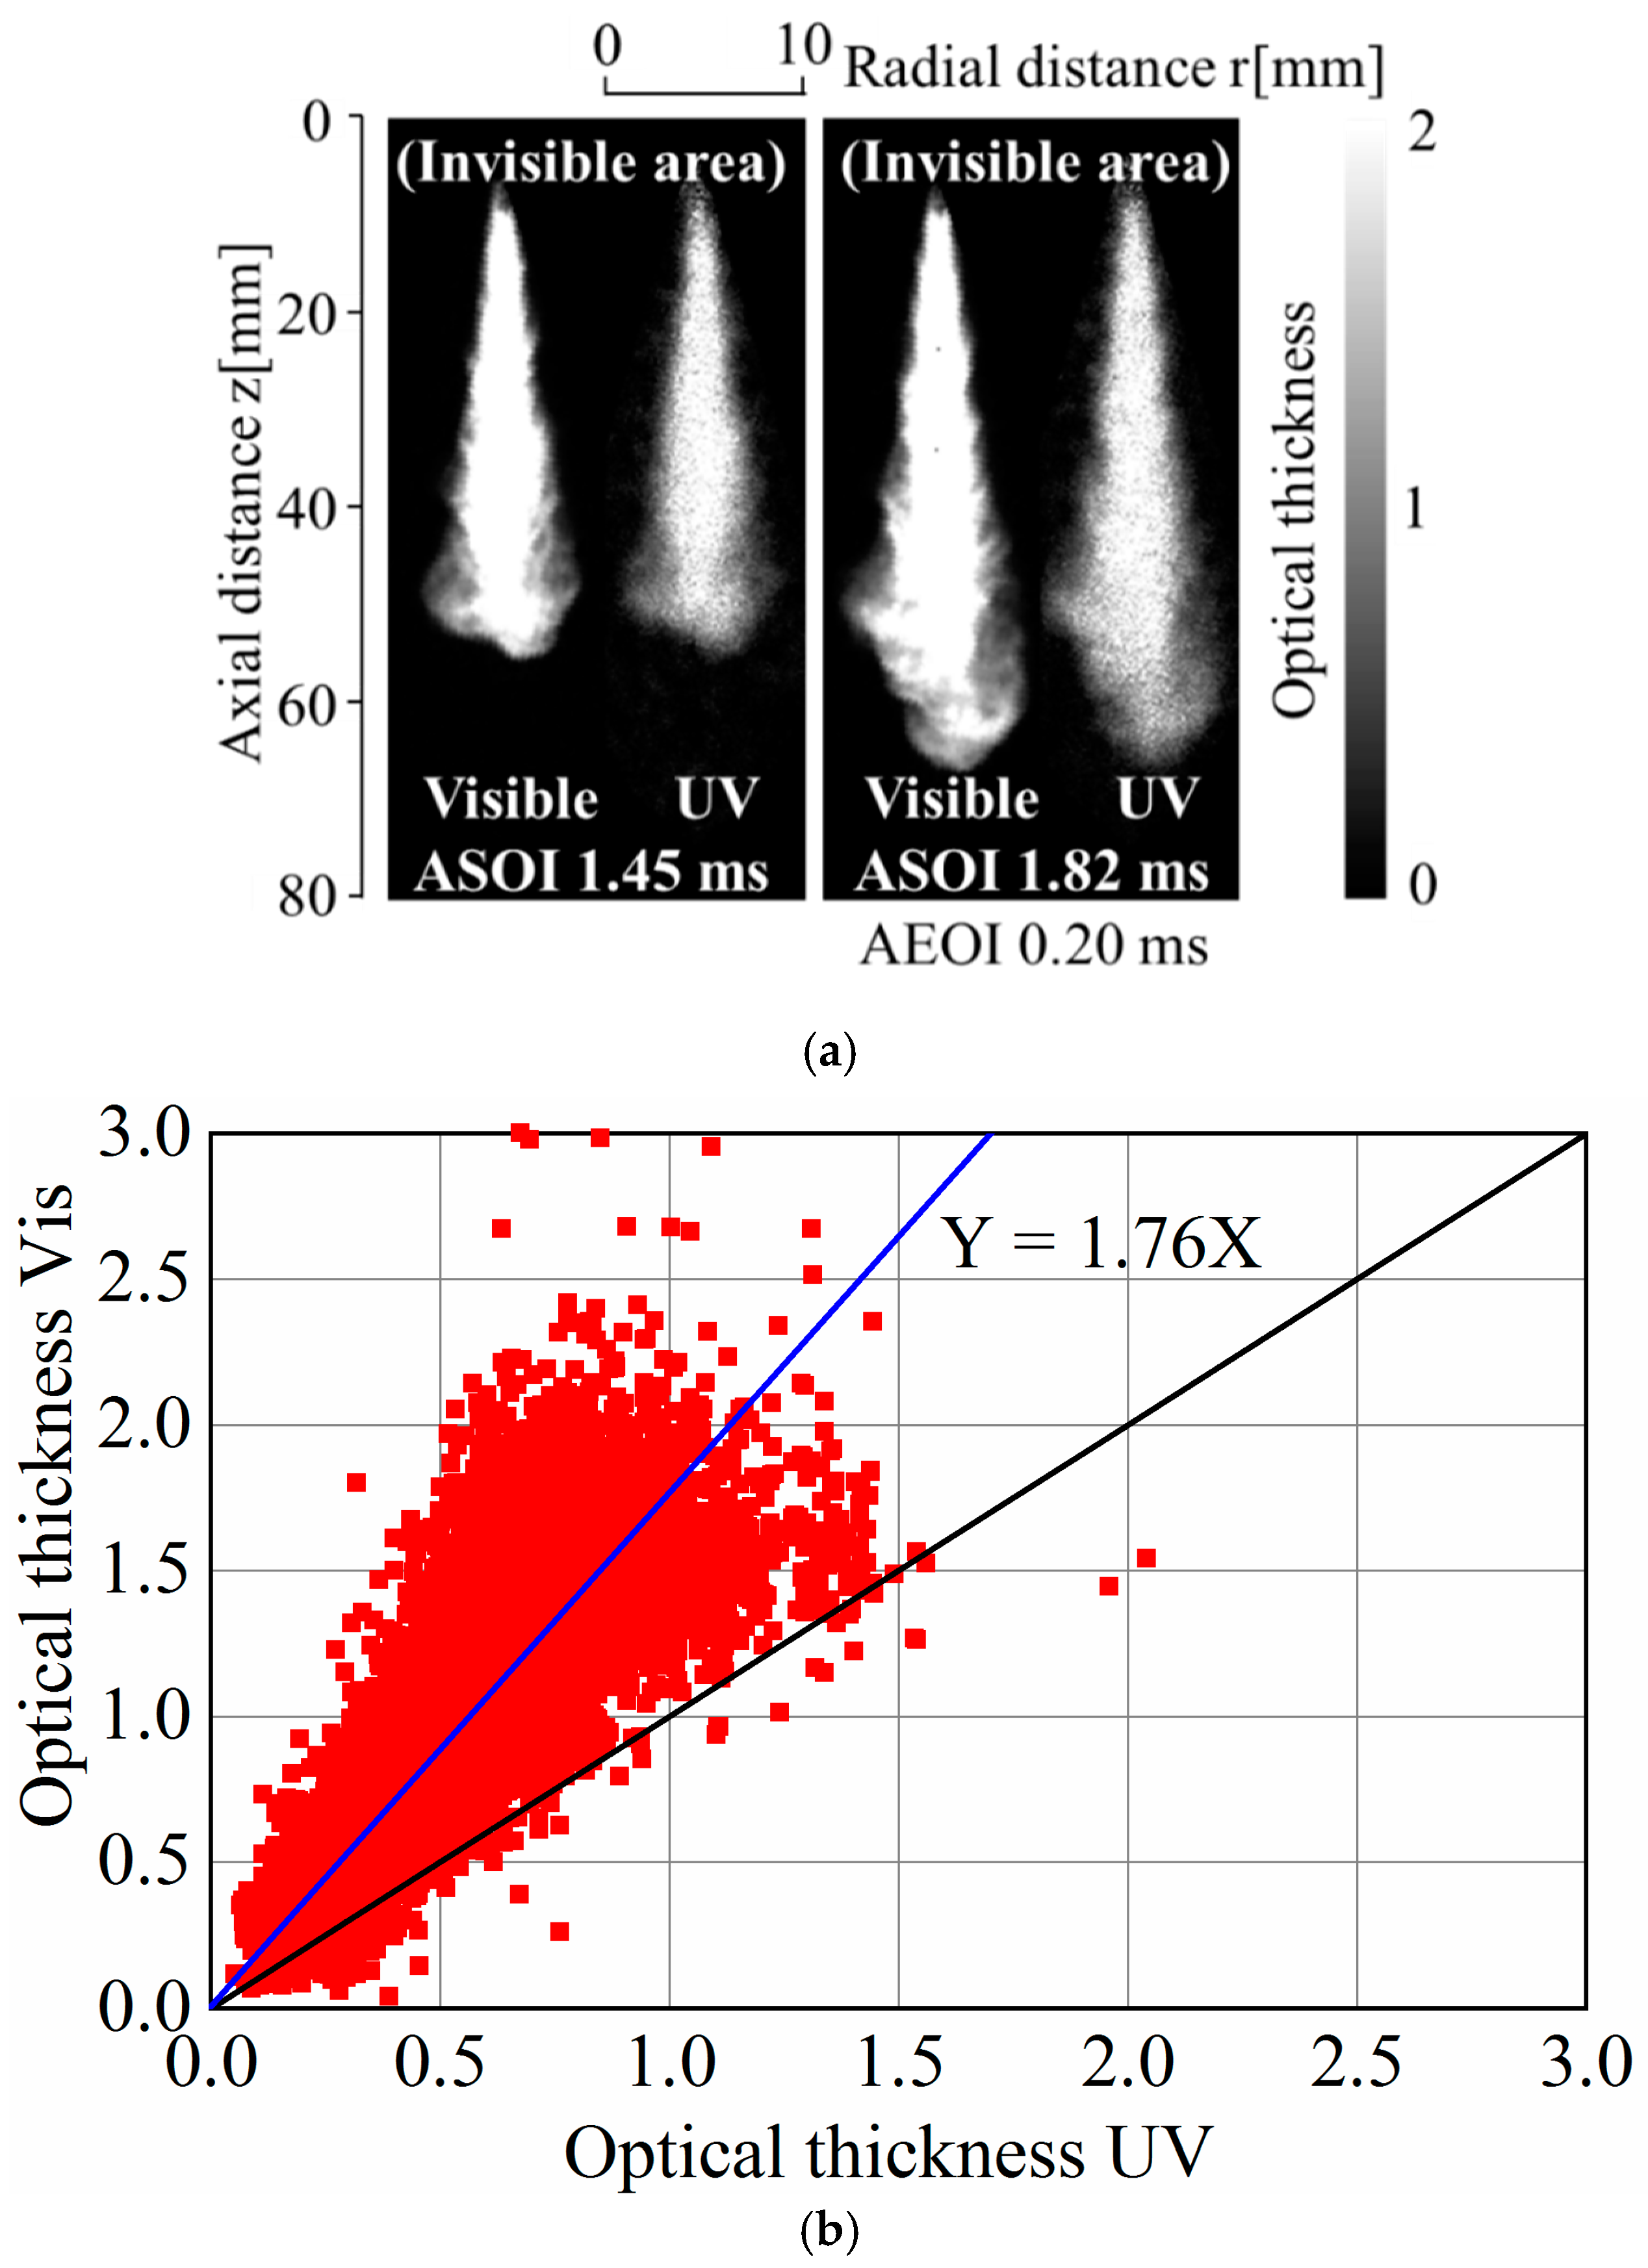
3.1. Comparison of UV and Vis Optical Thickness of Non-Evaporating Spray

The line-of-sight optical thickness images of a non-evaporating spray injected into an environment of high pressure and room temperature are shown in Figure 4a. For the non-evaporation experiment, the ambient density was selected to 20.2 kg/m3, which is like that of the evaporating condition. Images captured 1.45 ms ASOI and 0.20 ms AEOI (=1.82 ms ASOI) are displayed to show representative sprays during and after the end of injection. In both pairs of images the left part shows the visible optical thickness whereas the right part shows the UV optical thickness. In addition, the maximum Gray scale color palette shows the absolute values of the optical thickness. The optical thickness of visible vs. UV light for each point in the whole spray region is shown in Figure 4b. From the figure, the values of visible optical thickness are much higher than the UV optical thickness. This is due to the use of an image intensifier to capture the UV image. The least squares method has been used for comparability of visible and UV phase optical thickness. The blue line in the figure indicates the best fit and represents the visible and UV optical thicknesses. In this paper 1.76 is defined as the correction factor (CF) for the image intensifier. This CF is applied in the analysis of the UV optical thickness of the evaporating spray.

3.2. Measurement of Evaporating Diesel Spray

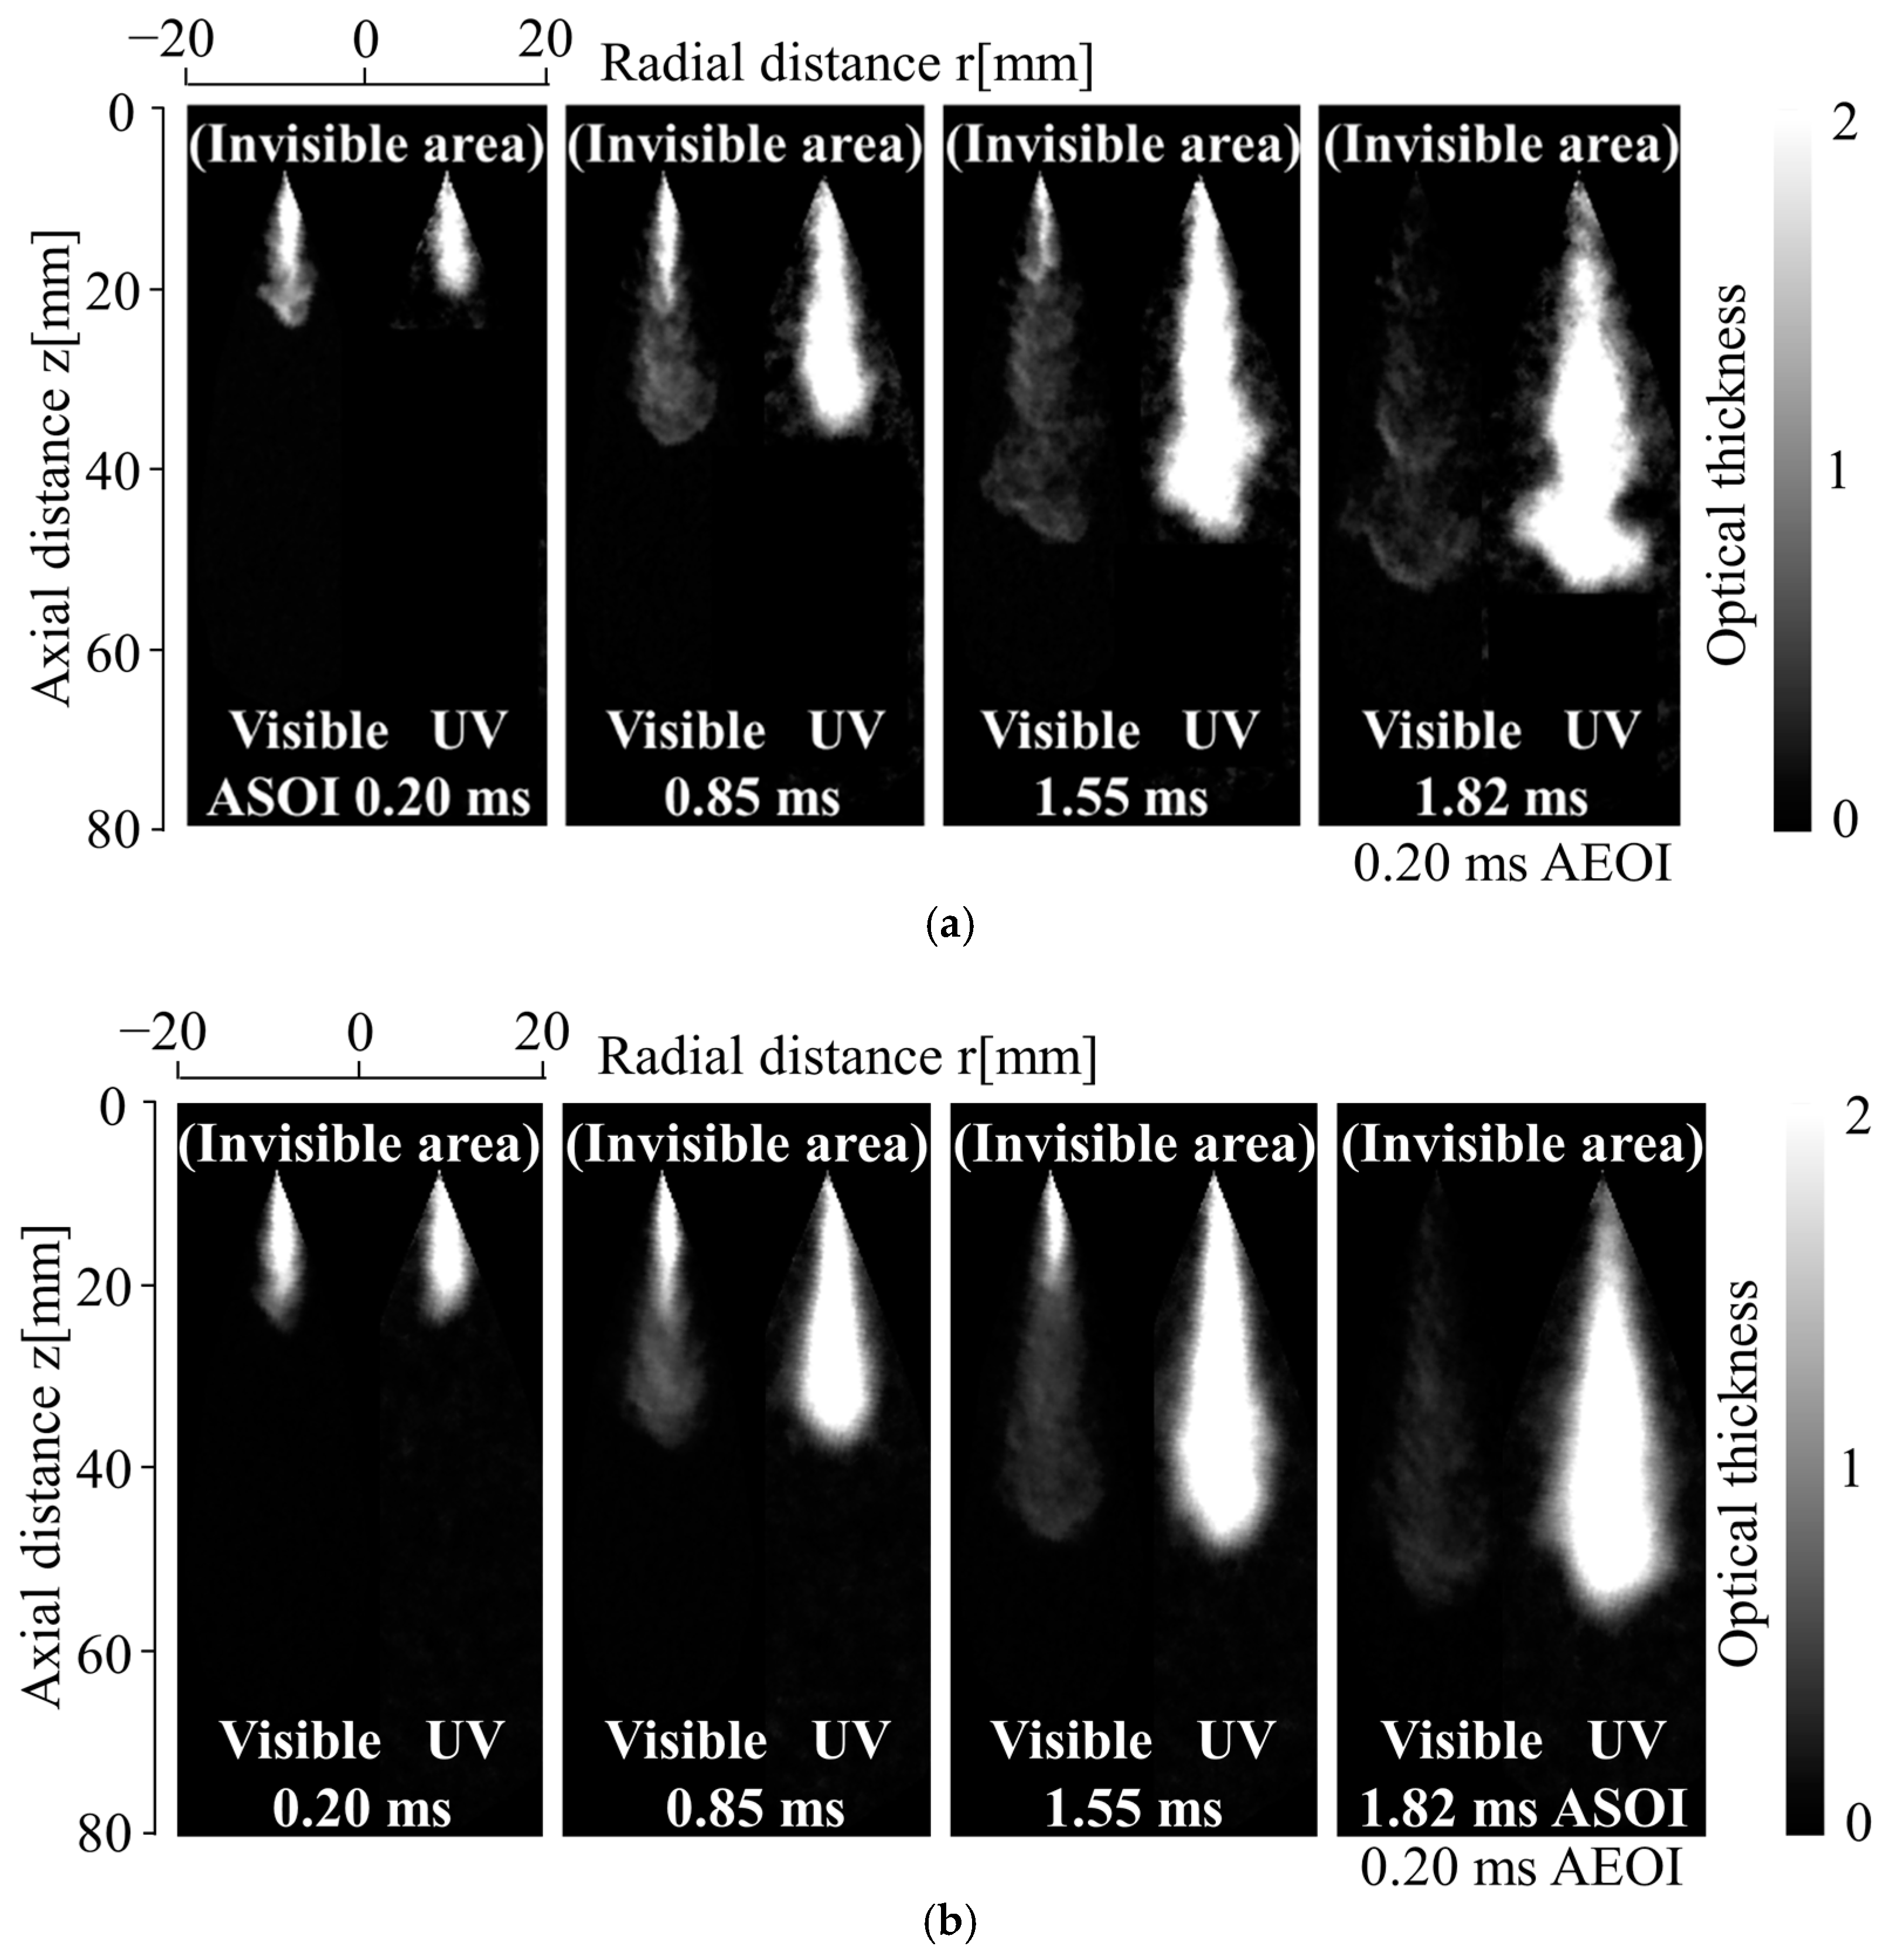
3.2.1. Optical Thickness Images

Figure 5 shows the optical thickness images simultaneously at Vis (left column) and UV (right column) wavelengths of the single and average shot spray. In the figure, the line-of-sight optical thickness at the two wavelengths is shown by the brightness in the spray region of each image, and the gas area around it is colored black. As previously stated, the visible image is only due to the scattering by droplets and hence refers to the distribution of liquid phase, whereas the UV image includes the extinction by both vapor and liquid phases. Since the main purpose of this study is to investigate the spray structure at shot-to-shot variation of the diesel spray, which was not possible by the C-LAS system, the experiment was repeated six times, maintaining the same ambient conditions. The image acquisition timings displayed in the figure are selected at 0.20 ms (SOI transient stage), 0.85 ms (middle quasi-steady stage), 1.55 ms (EOI transient stage) after the start of the injection (ASOI) and 0.2 ms after the end of the injection (AEOI) to observe the representative spray characteristics during and after the injection for single and average shot of the spray. From Figure 5a, at 0.20 ms ASOI, the Vis. (liquid phase) penetration is longer than the UV phase for the single shot spray. However, at 0.85 ms, ASOI images represent a similar penetration phenomenon of the spray for single and average shot, except that the vapor phase width is a little bigger. At 1.55 ms ASOI, the droplets evaporate quickly, and a fast evaporation rate appears at the spray downstream region. Moreover, at 0.2 ms AEOI, it should be noted that near the nozzle tip, there is a region with UV optical thickness, but visible optical thickness is unclear, which confirm that more air was entrained into the spray after EOI at the spray tail region for single and average shot spray. However, at 0.2 ms AEOI the spray structure is has a mushroom shape at the spray tip region for the single shot spray. In contrast, it can be seen that the spray shape is symmetric around the spray axis for the average shot spray.

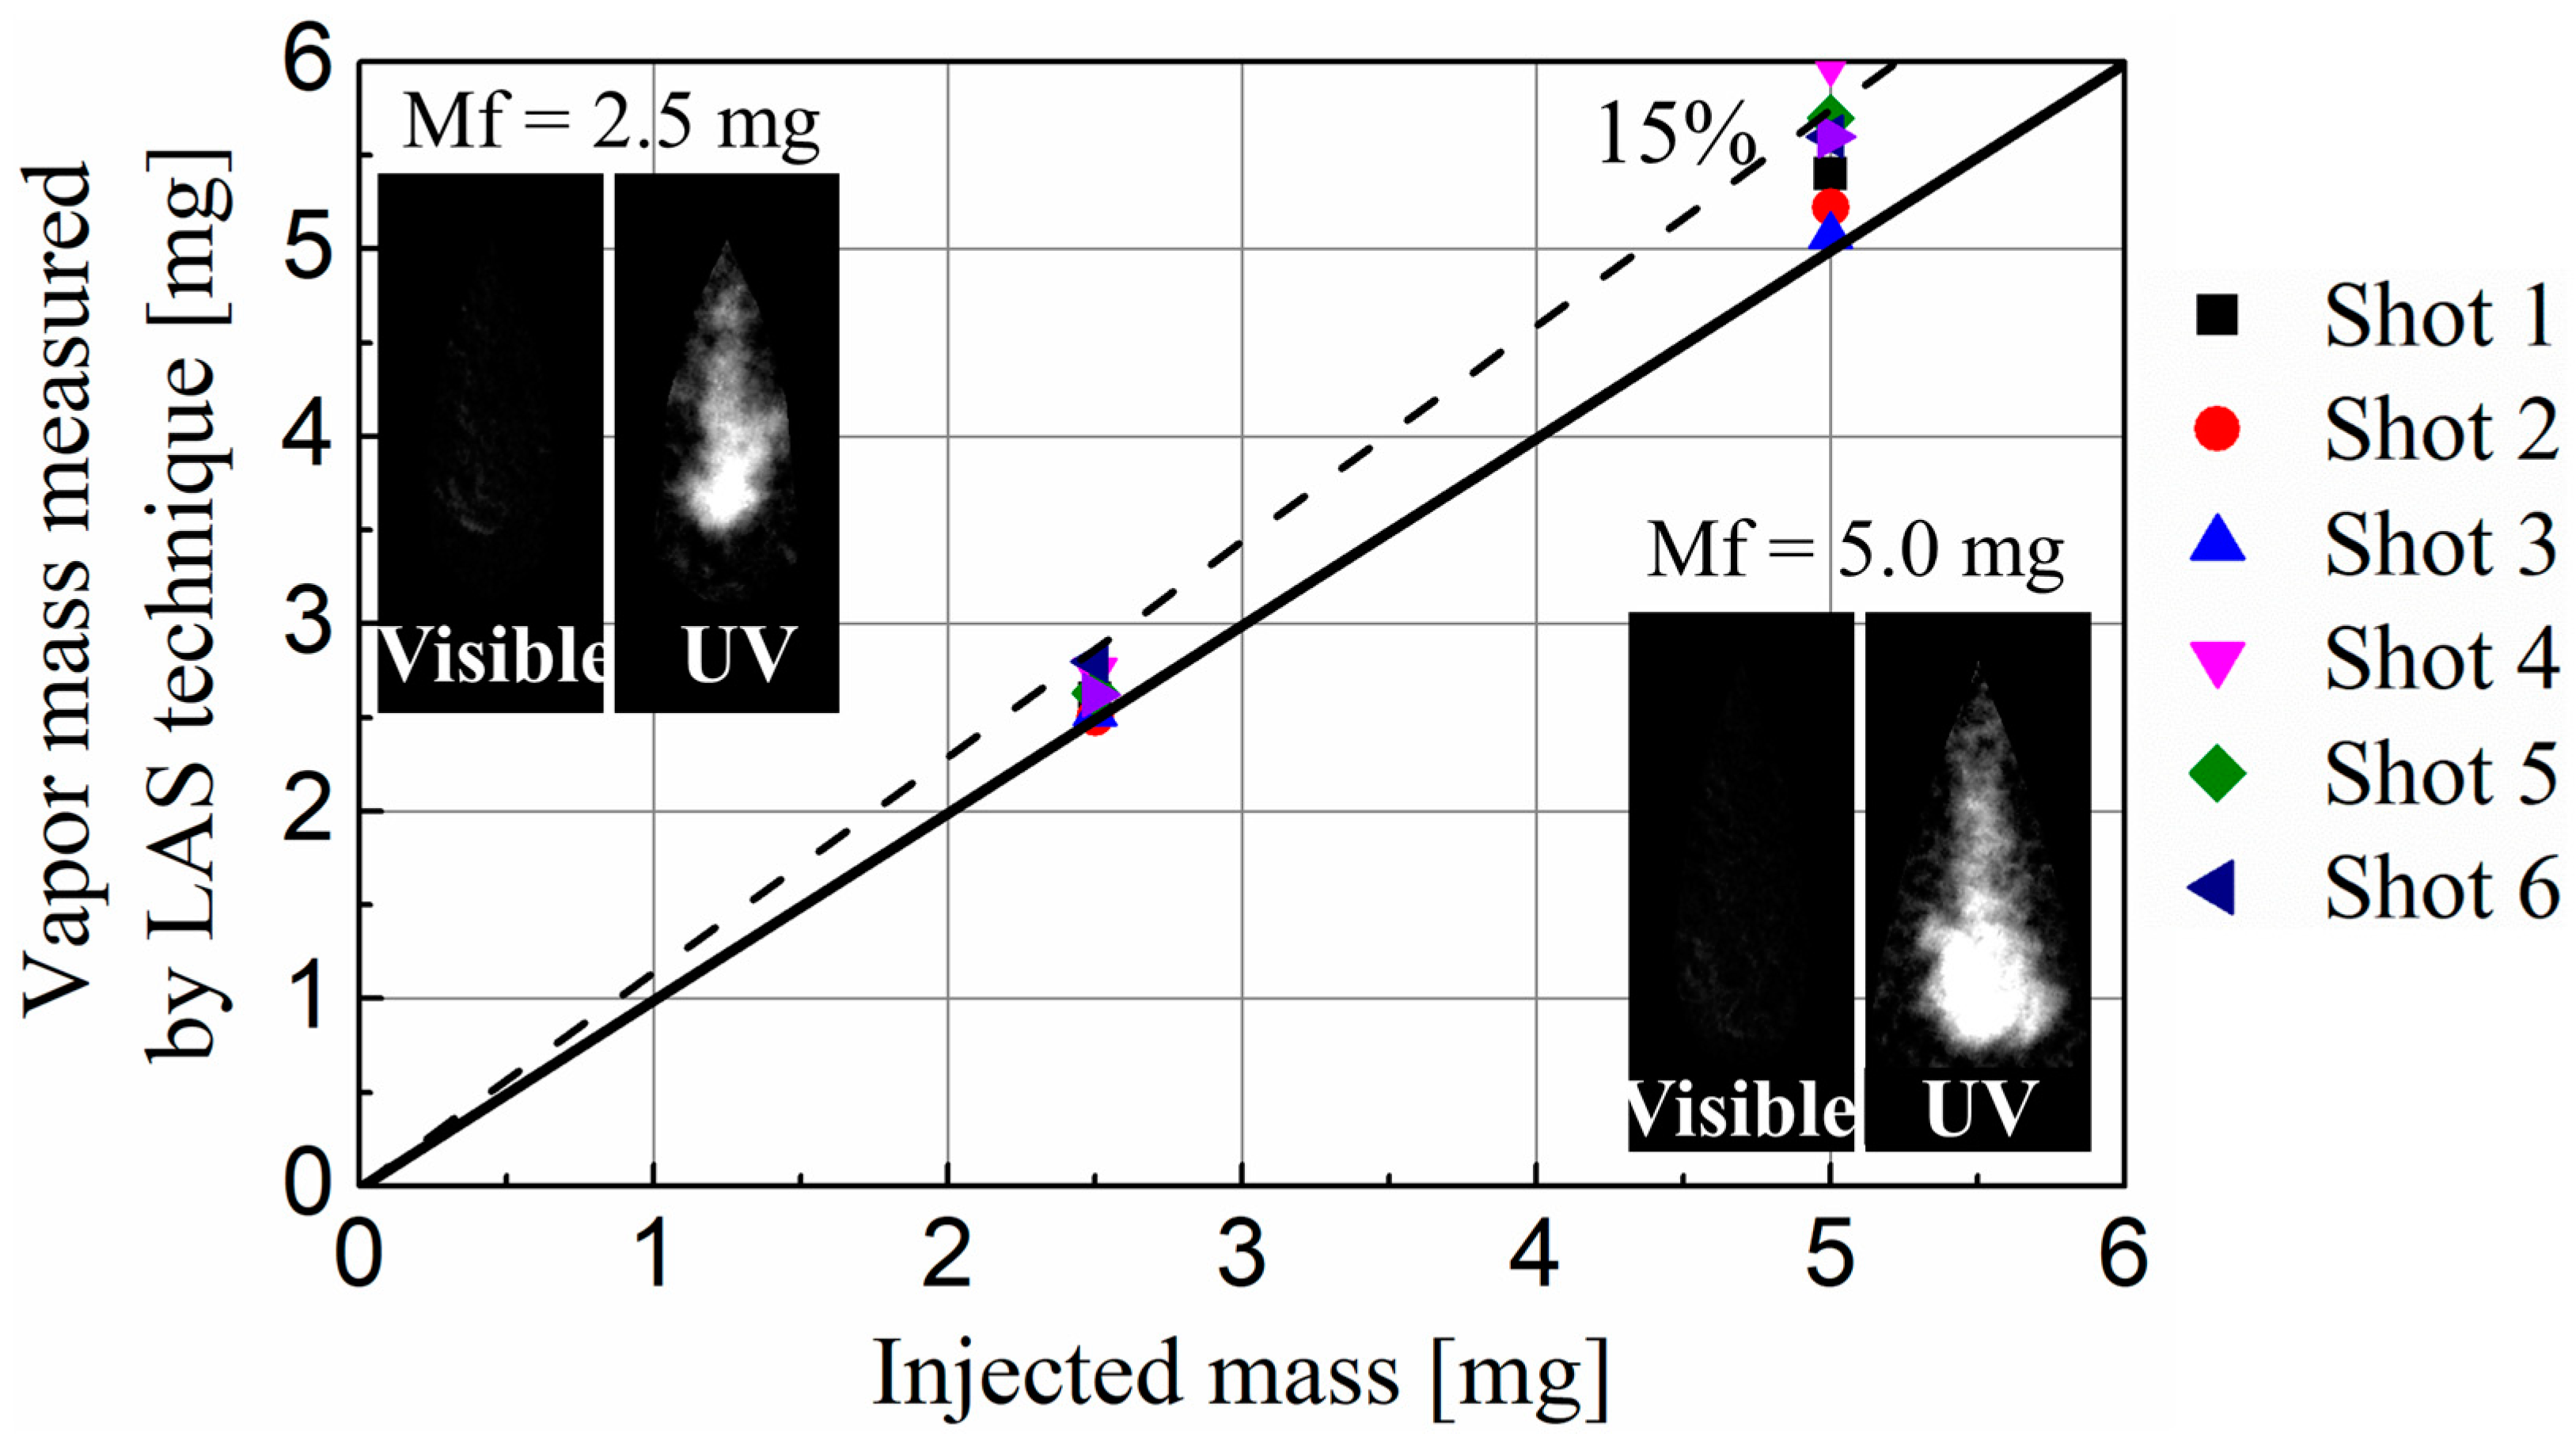
3.2.2. Comparison of Fuel Mass of Completely Evaporated Spray and Injected Mass

The measurements varying the injection amount were made on a completely evaporated fuel spray to verify the vapor mass measurement accuracy using the C-LAS technique. For this measurement, the injection amounts 2.5 and 5.0 mg/hole were selected. The measurement timings were considered at an adequately long time after the end of injection so that the liquid fuel would be completely evaporated. When the vapor mass ceased to increase with time and no liquid phase could be detected in the visible image, it was considered that the droplets inside the spray had been completely evaporated. The vapor fuel mass was determined using molecular absorption coefficient data. The results of measured cumulative vapor mass by image analysis of six shots versus the amount of injected fuel mass are illustrated in Figure 6. Overall, the results yielded by the C-LAS measurement technique are regularly a little different from the total mass of fuel injected. However, it should be noted that the measured vapor mass vs. the amount of fuel injected was generally contained within 15% error lines. As a result, vapor measurement applying the C-LAS technique can be considered reliable to a large extent.
The above inaccuracy analysis is based on measurements taken on sprays that have completely evaporated. It should be observed that when liquid droplets are included in the spray, the measuring inaccuracy rises.

3.3. Axisymmetric Analysis

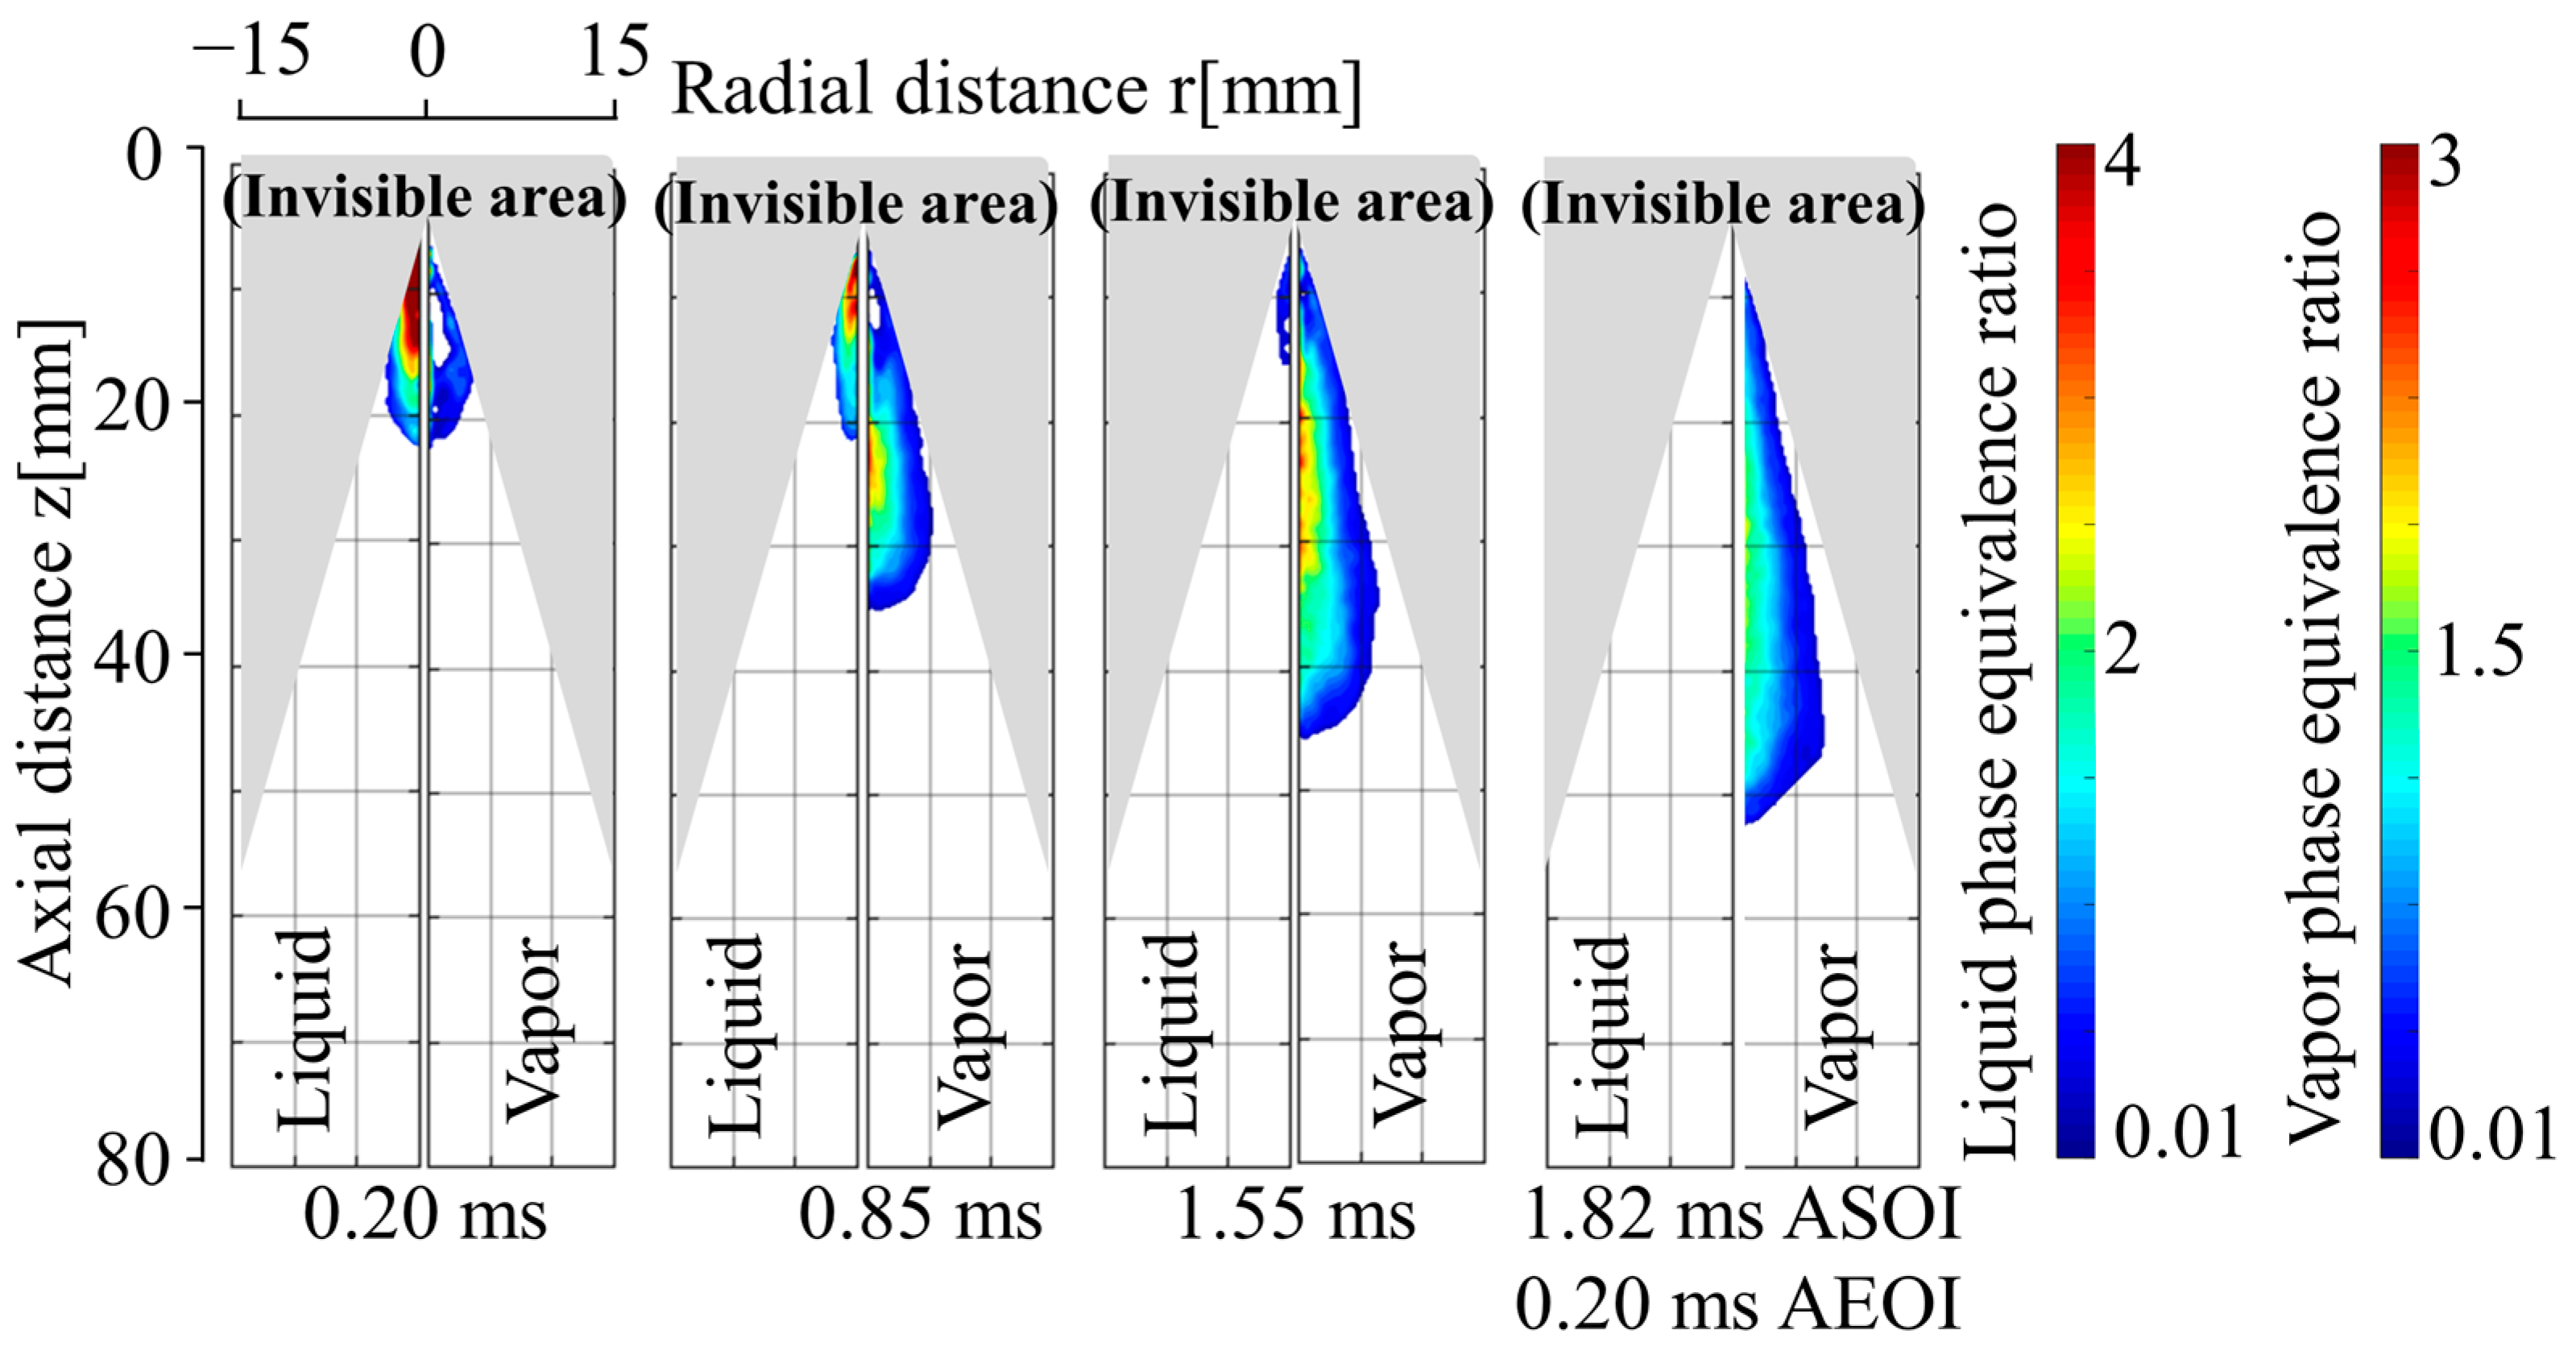
3.3.1. Vapor and Liquid Phase Equivalence Ratio Distributions

Figure 7 shows the equivalence ratio distributions result of the liquid and vapor phases deconvoluted via the onion-peeling method from the line-of-sight optical thickness images as time elapses under the reference condition. The image acquisition times are as follows: 0.20 ms, 0.85, ms 1.55 ms ASOI, and 0.20 ms AEOI to observe the liquid and vapor phase equivalence ratio distribution during and after the injection. In each case, the figure was separated into two parts; the left part shows the liquid phase equivalence ratio whereas the right part shows the vapor phase equivalence ratio. In addition, the maximum values of the vapor and liquid phase equivalence ratios are 3 and 4, respectively. During the injection period, the liquid phase equivalence ratio dominates first and then decreases whereas the vapor phase equivalence ratio increases as time elapses. It was previously mentioned that the visible optical thickness was not clear at 0.20 ms after EOI; thus the corresponding equivalence ratio is absent in this timing. Moreover, the vapor phase equivalence ratio at 1.55 ms ASOI is distributed homogeneously at the center position of the spray cloud, whereas the magnitude seems lower at 0.20 after EOI which indicates that a leaner mixture dominates after the end of injection timing.

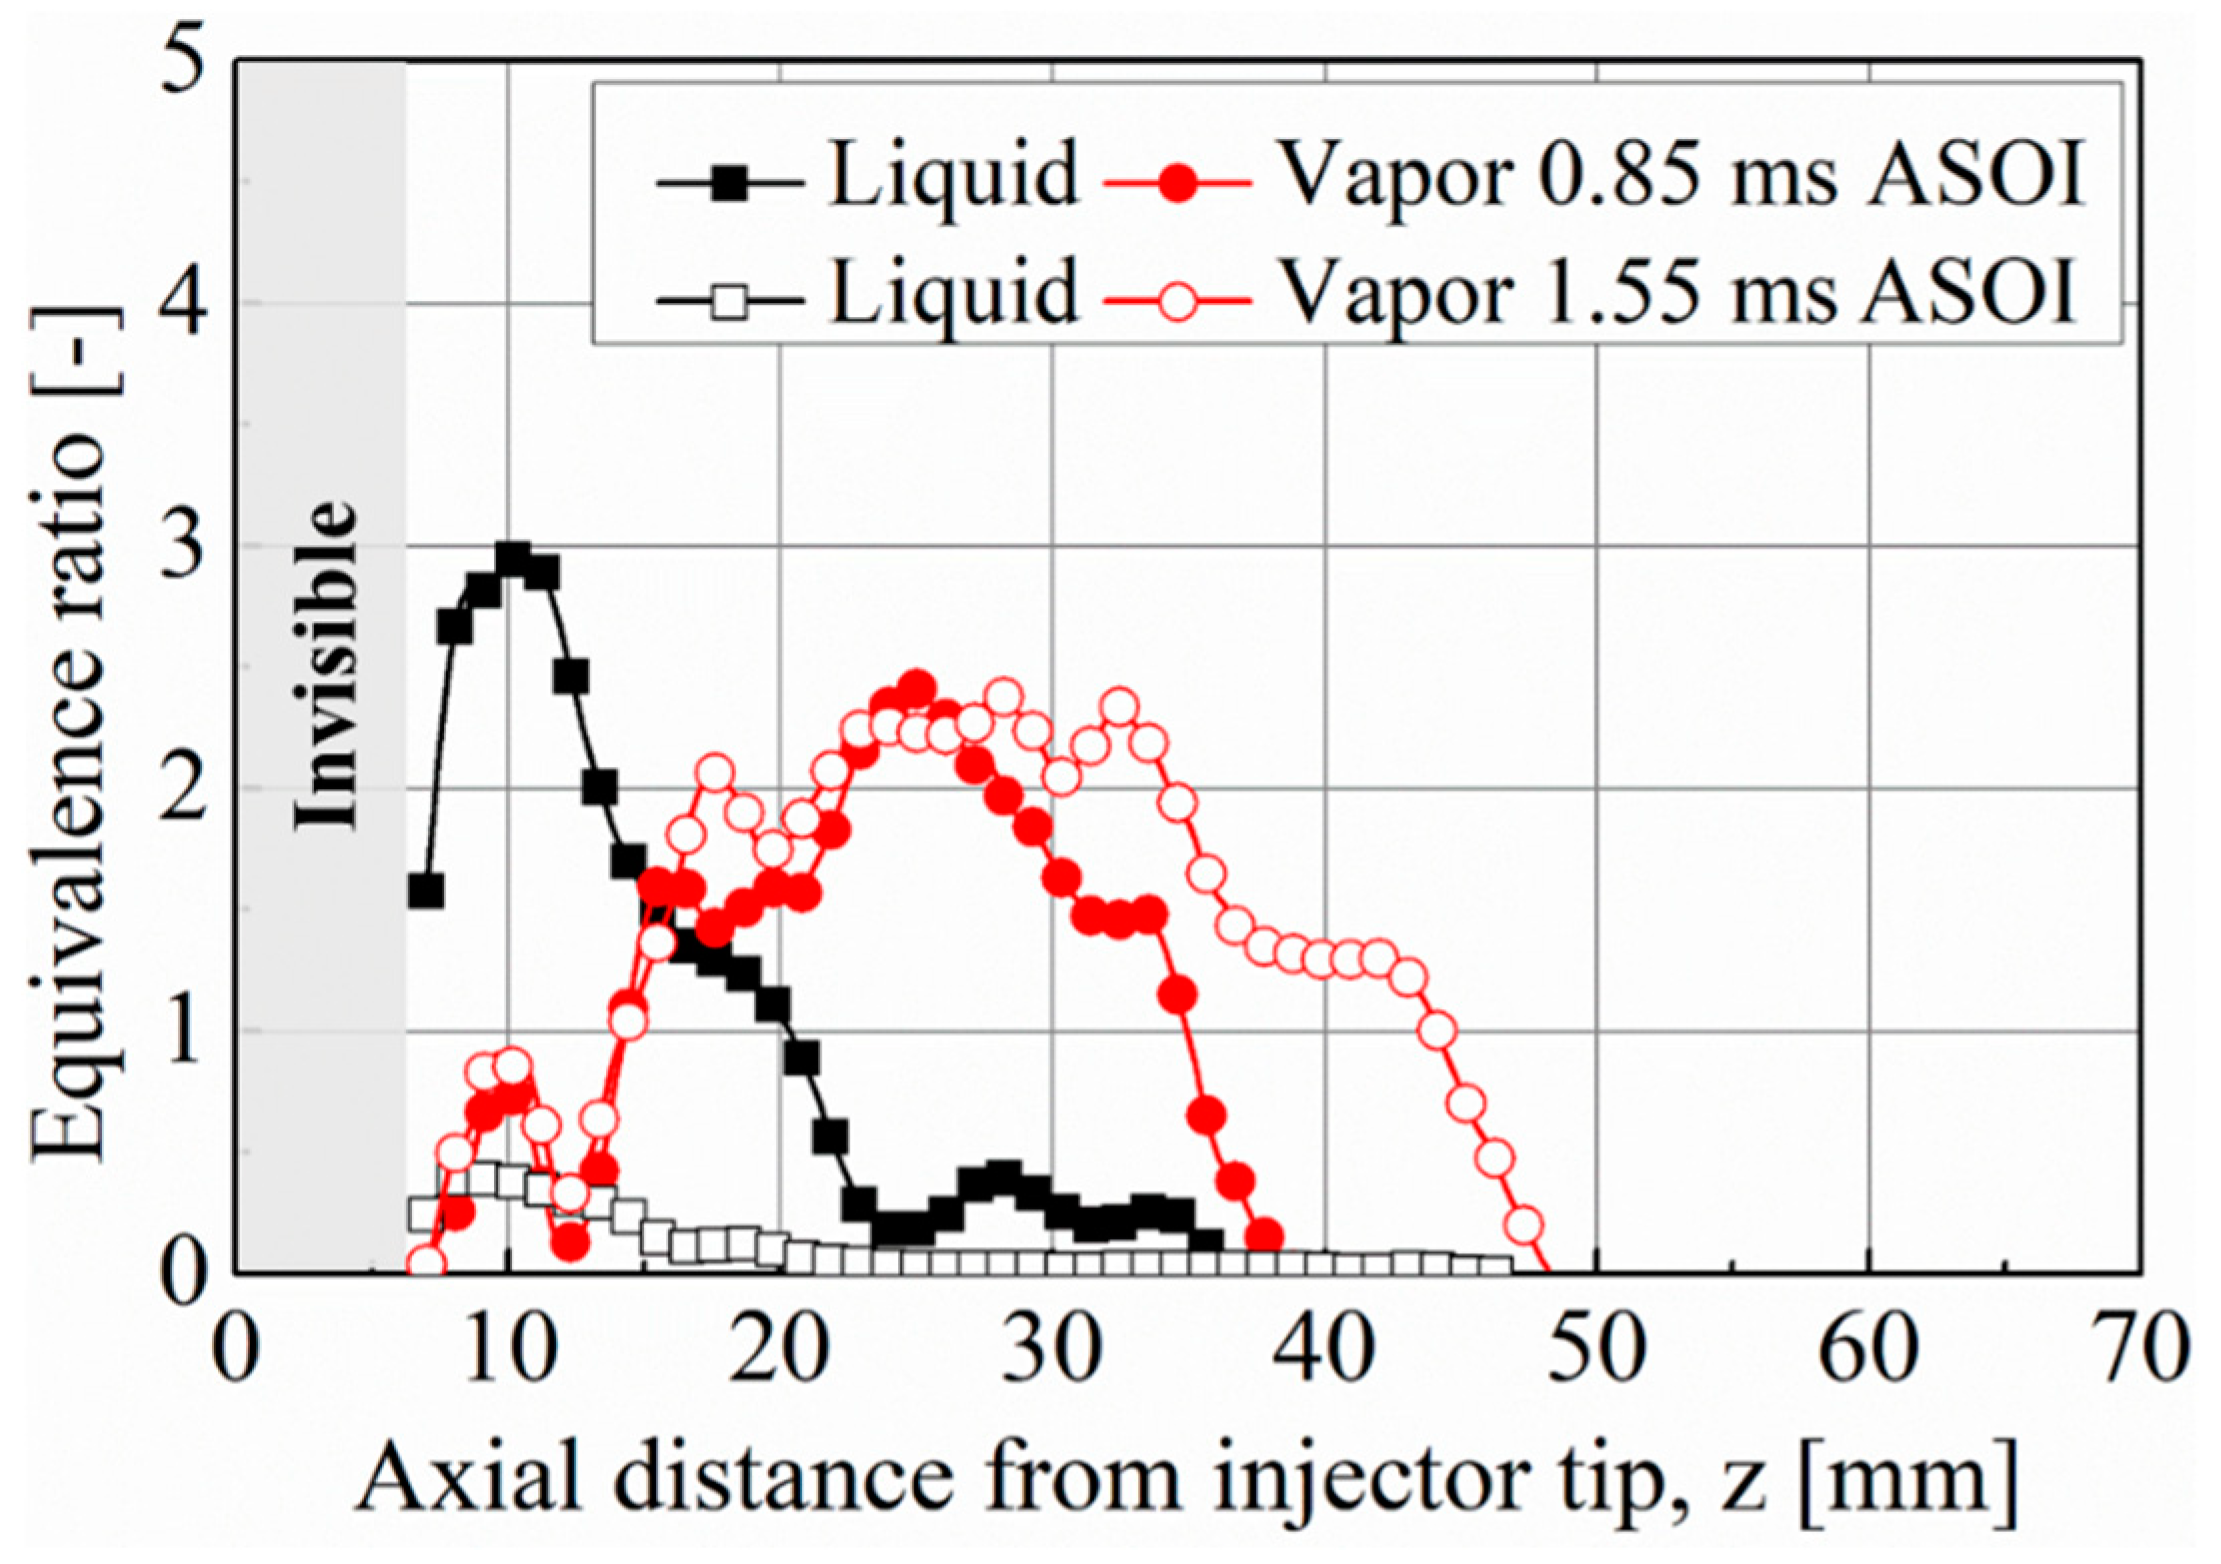
3.3.2. Equivalence Ratio Distributions in Axial and Radial Directions

Figure 8 shows the equivalence ratio distribution of liquid and vapor along the spray axis (the average equivalence ratio is determined at every 2 mm from the spray axis for measurement precision) and Figure 9 in the radial direction from the spray center line 30 mm downstream of the nozzle tip at the middle of the quasi-steady stage and the EOI transient stage of the spray. In Figure 8, the vapor phase equivalence ratio shows that each curve has two peaks.
The first peak can be found at a distance of around 10 mm along the spray axis. It is unclear. However, it should be noted that there is a relatively large uncertainty in the determination of the vapor phase equivalence ratio due to the evaluation of a narrow spray close to the invisible area in the presence of a very high drop density. As the spray evolves, the second peak appears closer to the spray tip, according to the stagnation region. In short, the shape of curves is something like a saddleback [28]. On the other hand, the liquid phase equivalence ratio curves show a single peak that reduces with axial distance, indicating that the fuel evaporates at the same rate as it is injected. The vapor phase equivalence ratio curves are higher than the liquid phase equivalence ratio curves, as shown in Figure 9. The curves of vapor show that the equivalence ratio decreases with respect to radial distance from the centerline of the spray axis (Gaussian shape). This suggests that as the fuel spray penetrates further, greater air entrainment occurs. However, this far downstream, the liquid phase equivalence ratio is quite low and close to zero at 1.55 ms ASOI. This means that as the air-fuel mixing quality improves, the majority of the liquid fuel evaporates and is transformed to vapor.

3.3.3. Probability Density of Vapor Phase Concentration

The contour data from Figure 7 can be rearranged to vapor mass distribution as a function of the equivalence ratio, as shown in Figure 10. The curve indicates the amount of existing vapor mass of every 0.05 interval in equivalence ratio. Therefore, the integration of the area formed by the profile divided by 0.05 equals the total amount of fuel in the vapor phase. After the end of injection, there is a relatively significant volume with a lean mixture with a peak at an equivalence ratio of less than 0.5. On the other hand, the mass distribution at 1.55 ms ASOI timing also revealed that the total mass of the rich mixture with an equivalence ratio of above 2 was slightly greater than after the end of injection timing.

3.4. Non-Axisymmetric Analysis

3.4.1. Shot-to-Shot Variation Temporal Vortex/Eddy Characteristics

The time evolution of individual line-of-sight vapor fuel mass concentration shot-to-shot variation for the reference conditions is presented in Figure 11. The color palette in Figure 11c shows the absolute values of vapor mass per unit area (in mg/cm2) in the vapor phase image. The maximum value of the vapor mass for the vapor phase was set to 3. The representative acquisition timings are at 0.20 ms, 0.85 ms, 1.55 ms ASOI and 0.2 ms after the end of injection. At 0.85 ms ASOI, for the first and third shot, it can be seen that the comparatively high vapor concentration regions are visible in the middle of the spray, increasing slowly while the spray penetrates as time elapses. After the end of injection for every shot, the high vapor concentration regions near the nozzle quickly mix with ambient gas, reducing vapor concentrations to low levels in a few tenths of a millisecond. This finding is due to the air entrainment conservation kinematics after the end of injection. Consequently, a low-vapor-concentration region forms rapidly at the spray’s tail, represented by green and blue color, after the end of injection, while a high-vapor-concentration region remains close to the spray’s tip, represented by a yellow color, where the mixing with air is noticeably high [35]. Therefore, at the first glance, every shot spray seems to follow the same path. When precisely comparing the structure at the tip, a difference can be observed between the different shots. However, some larger lean fuel concentration areas (indicated by the blue color) are observed at the radial periphery of the third shot. For this shot, injected fuel mixed with the air quickly after the end of injection, leading to lean fuel concentration areas in peripheral regions.

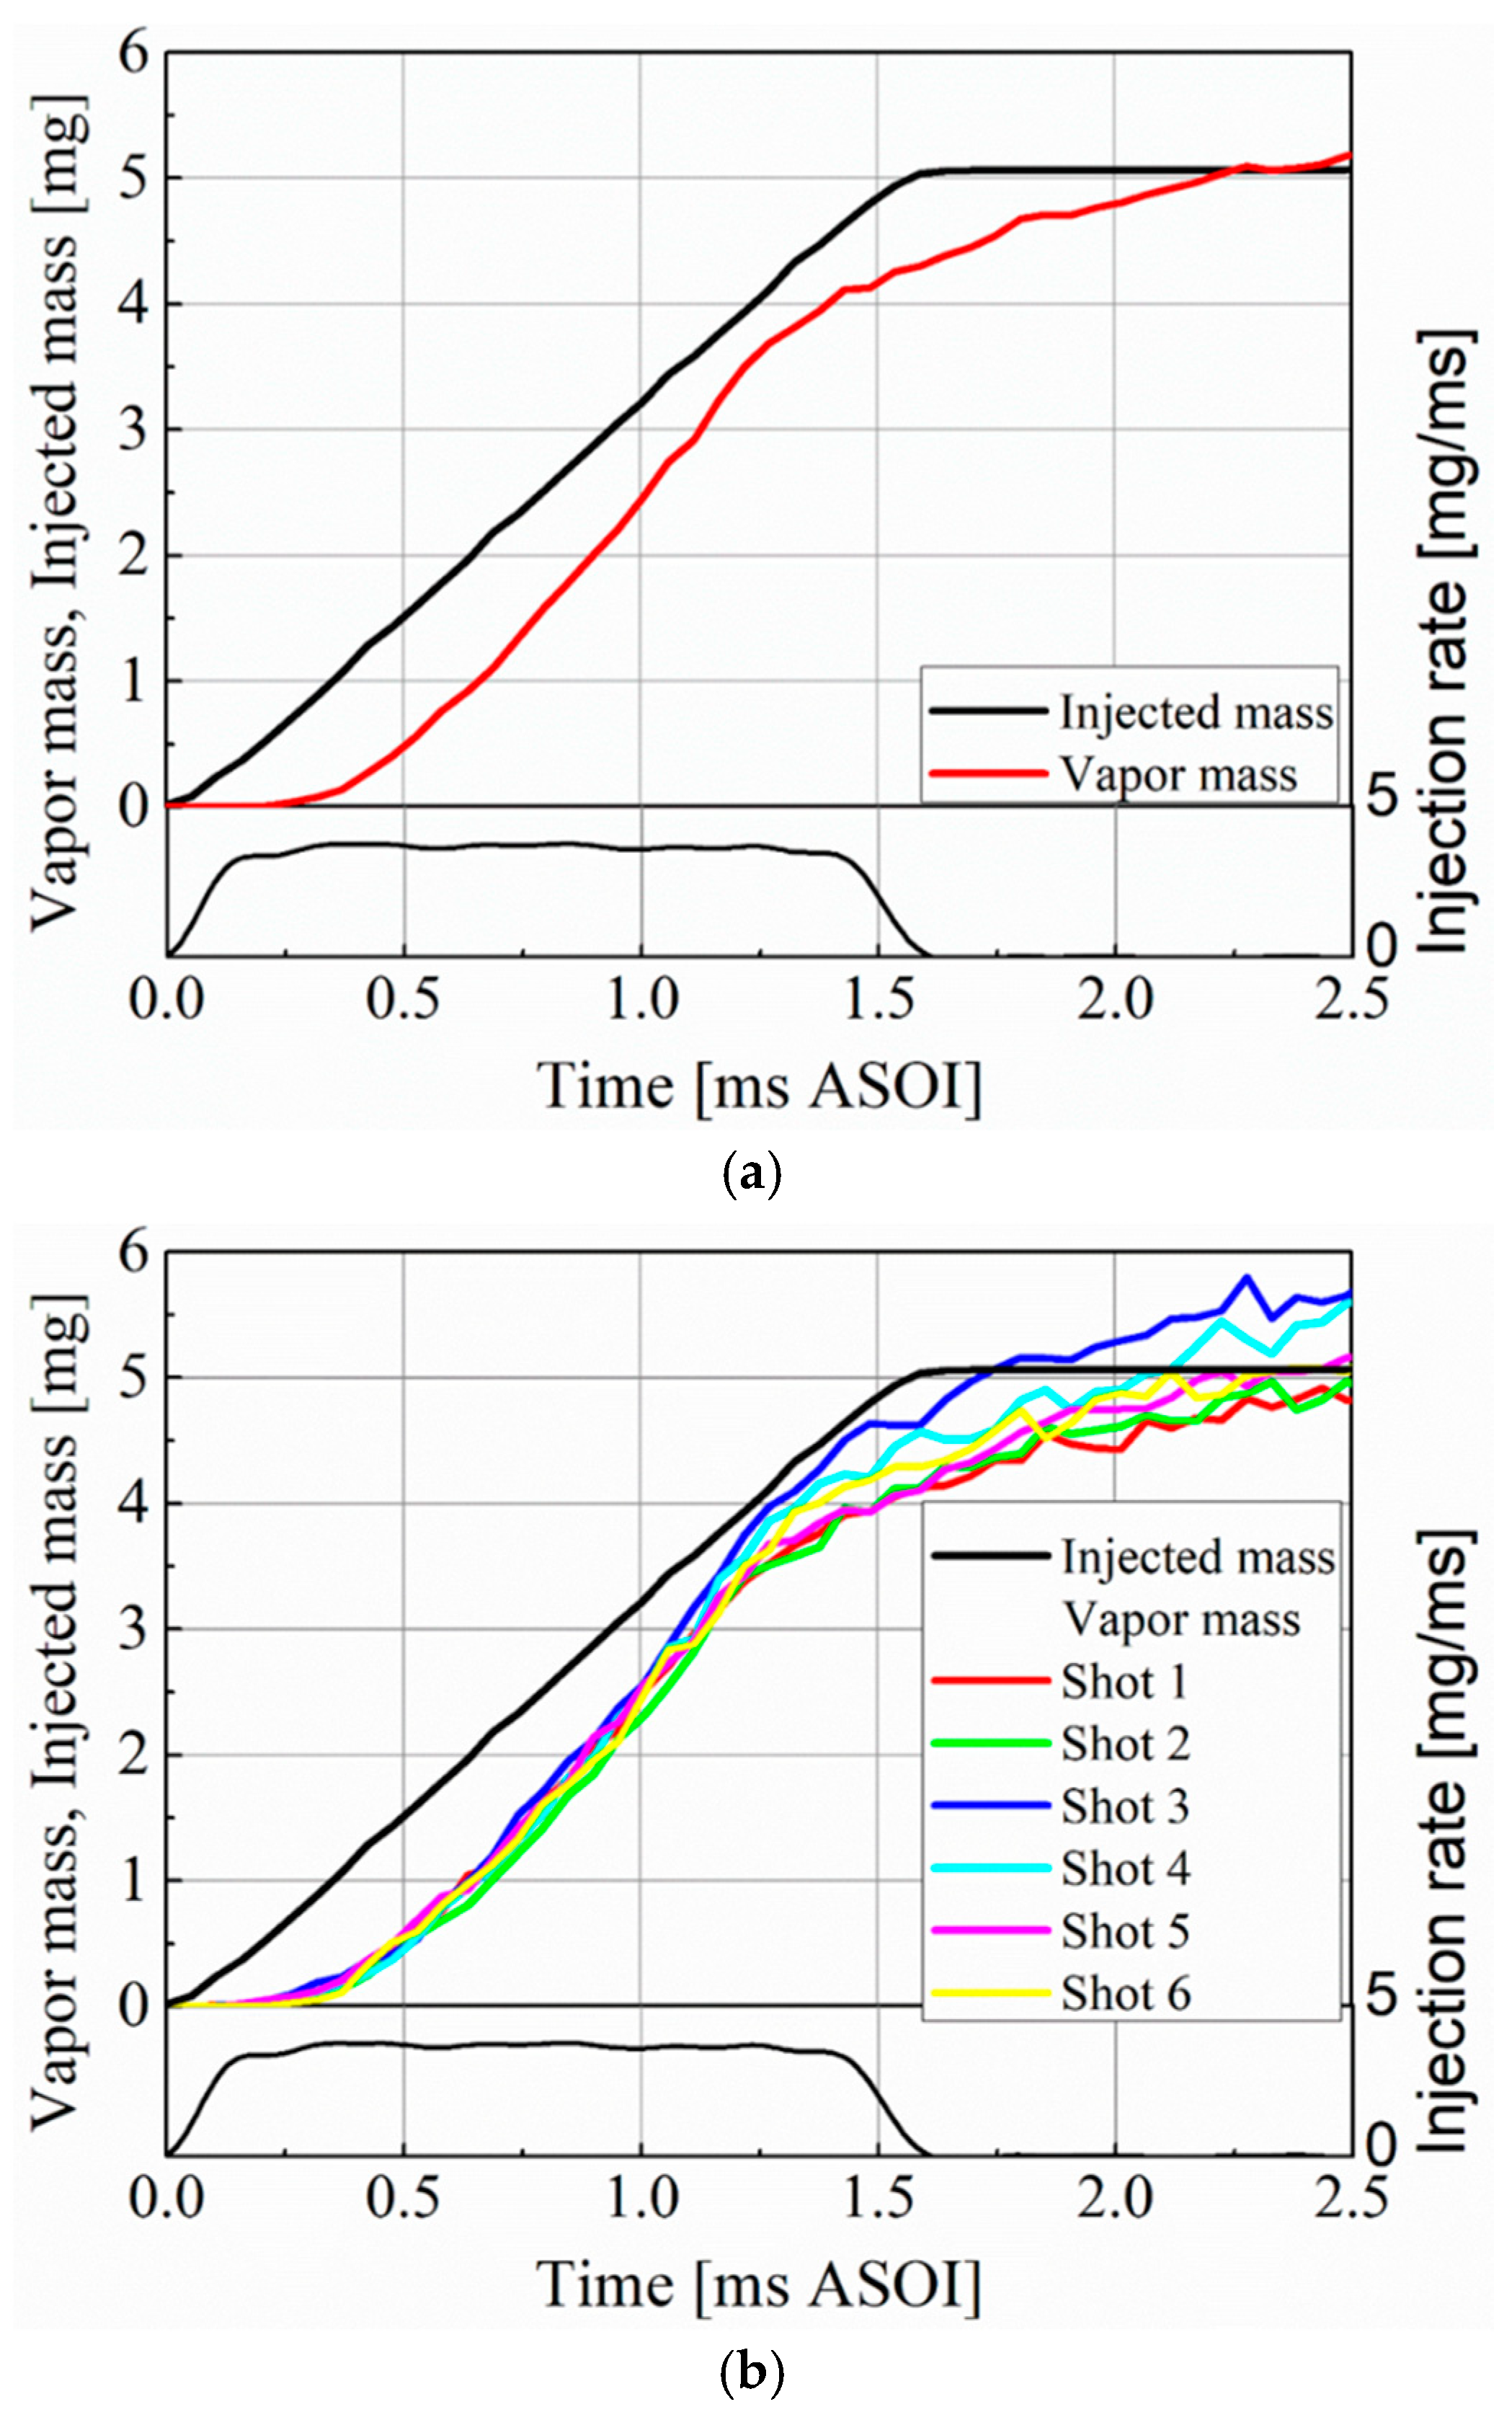
3.4.2. Temporal Variation of Total Vapor Mass in Spray

The temporal variation of the vapor mass distribution on average (axisymmetric) and shot-to-shot (non-axisymmetric) variation compared with nominally injected mass are shown in Figure 12. The evaporation ratio of every injection timing can be calculated by the measured vapor mass since the evaporation ratio is dependent on the vapor mass and injected mass. From 0.0 to 0.6 ms ASOI for the axisymmetric spray and from 0.0 to 0.80 ms ASOI for the non-axisymmetric spray, the vapor mass is lower than the injected mass for all shots since at this injection duration liquid droplets are dominating in the spray. However, the vapor mass increases with time elapse for average, and all shot sprays. In general, in AEOI the vapor mass curve should be parallel to the injected mass curve after completely evaporating the spray, but some curves do not follow the above rule. This is one of the possible reasons for the error in vapor measurement accuracy using the extended C-LAS technique. The fact that the measured vapor mass appears to increase after the end of injection may among other things also be related to the temperature-dependent molar absorption coefficient (MAC), since when the fuel mixture is further diluted the average temperature of the fuel molecules should increase.

4. Conclusions

The HS-LAS technique for measuring quantitative information of vapor and liquid in fuel spray has been developed by using UV LED and CW laser as continuous light sources, high-speed video cameras, and an image intensifier for UV light. A diesel surrogate fuel which consists of 97.5% n-tridecane and 2.5% of volume-based 1-methylnaphthalene was used. Quantitative studies of vapor and liquid fuel distribution in injected diesel sprays into a high-pressure and high-temperature environment were carried out using this technique. The conclusions may be summarized as follows:
  • The difference in the UV and visible optical thickness, which significantly affects the accuracy of vapor resolution, was observed using simultaneous measurements of optical thickness at 266 nm and 532 nm wavelengths of a non-evaporating fuel spray injected into a high-density atmosphere by a high-pressure injection technique. Due to the employment of an image intensifier to capture the UV image, the result indicates that there is a significant variation in optical thickness between the two wavelengths. During the processing of the evaporating spray images, an intensifier correction factor was applied to the UV phase optical thickness to compare the visible and UV phase optical thicknesses.
  • A sequence of experiments on the completely evaporated fuel spray were conducted to confirm the vapor measurement. The vapor mass measured from the optical thickness of the vapor phase by the imaging approach agrees well with the injected fuel mass.
  • Simultaneous vapor and droplet measurements were carried out. The following points are drawn from the findings.
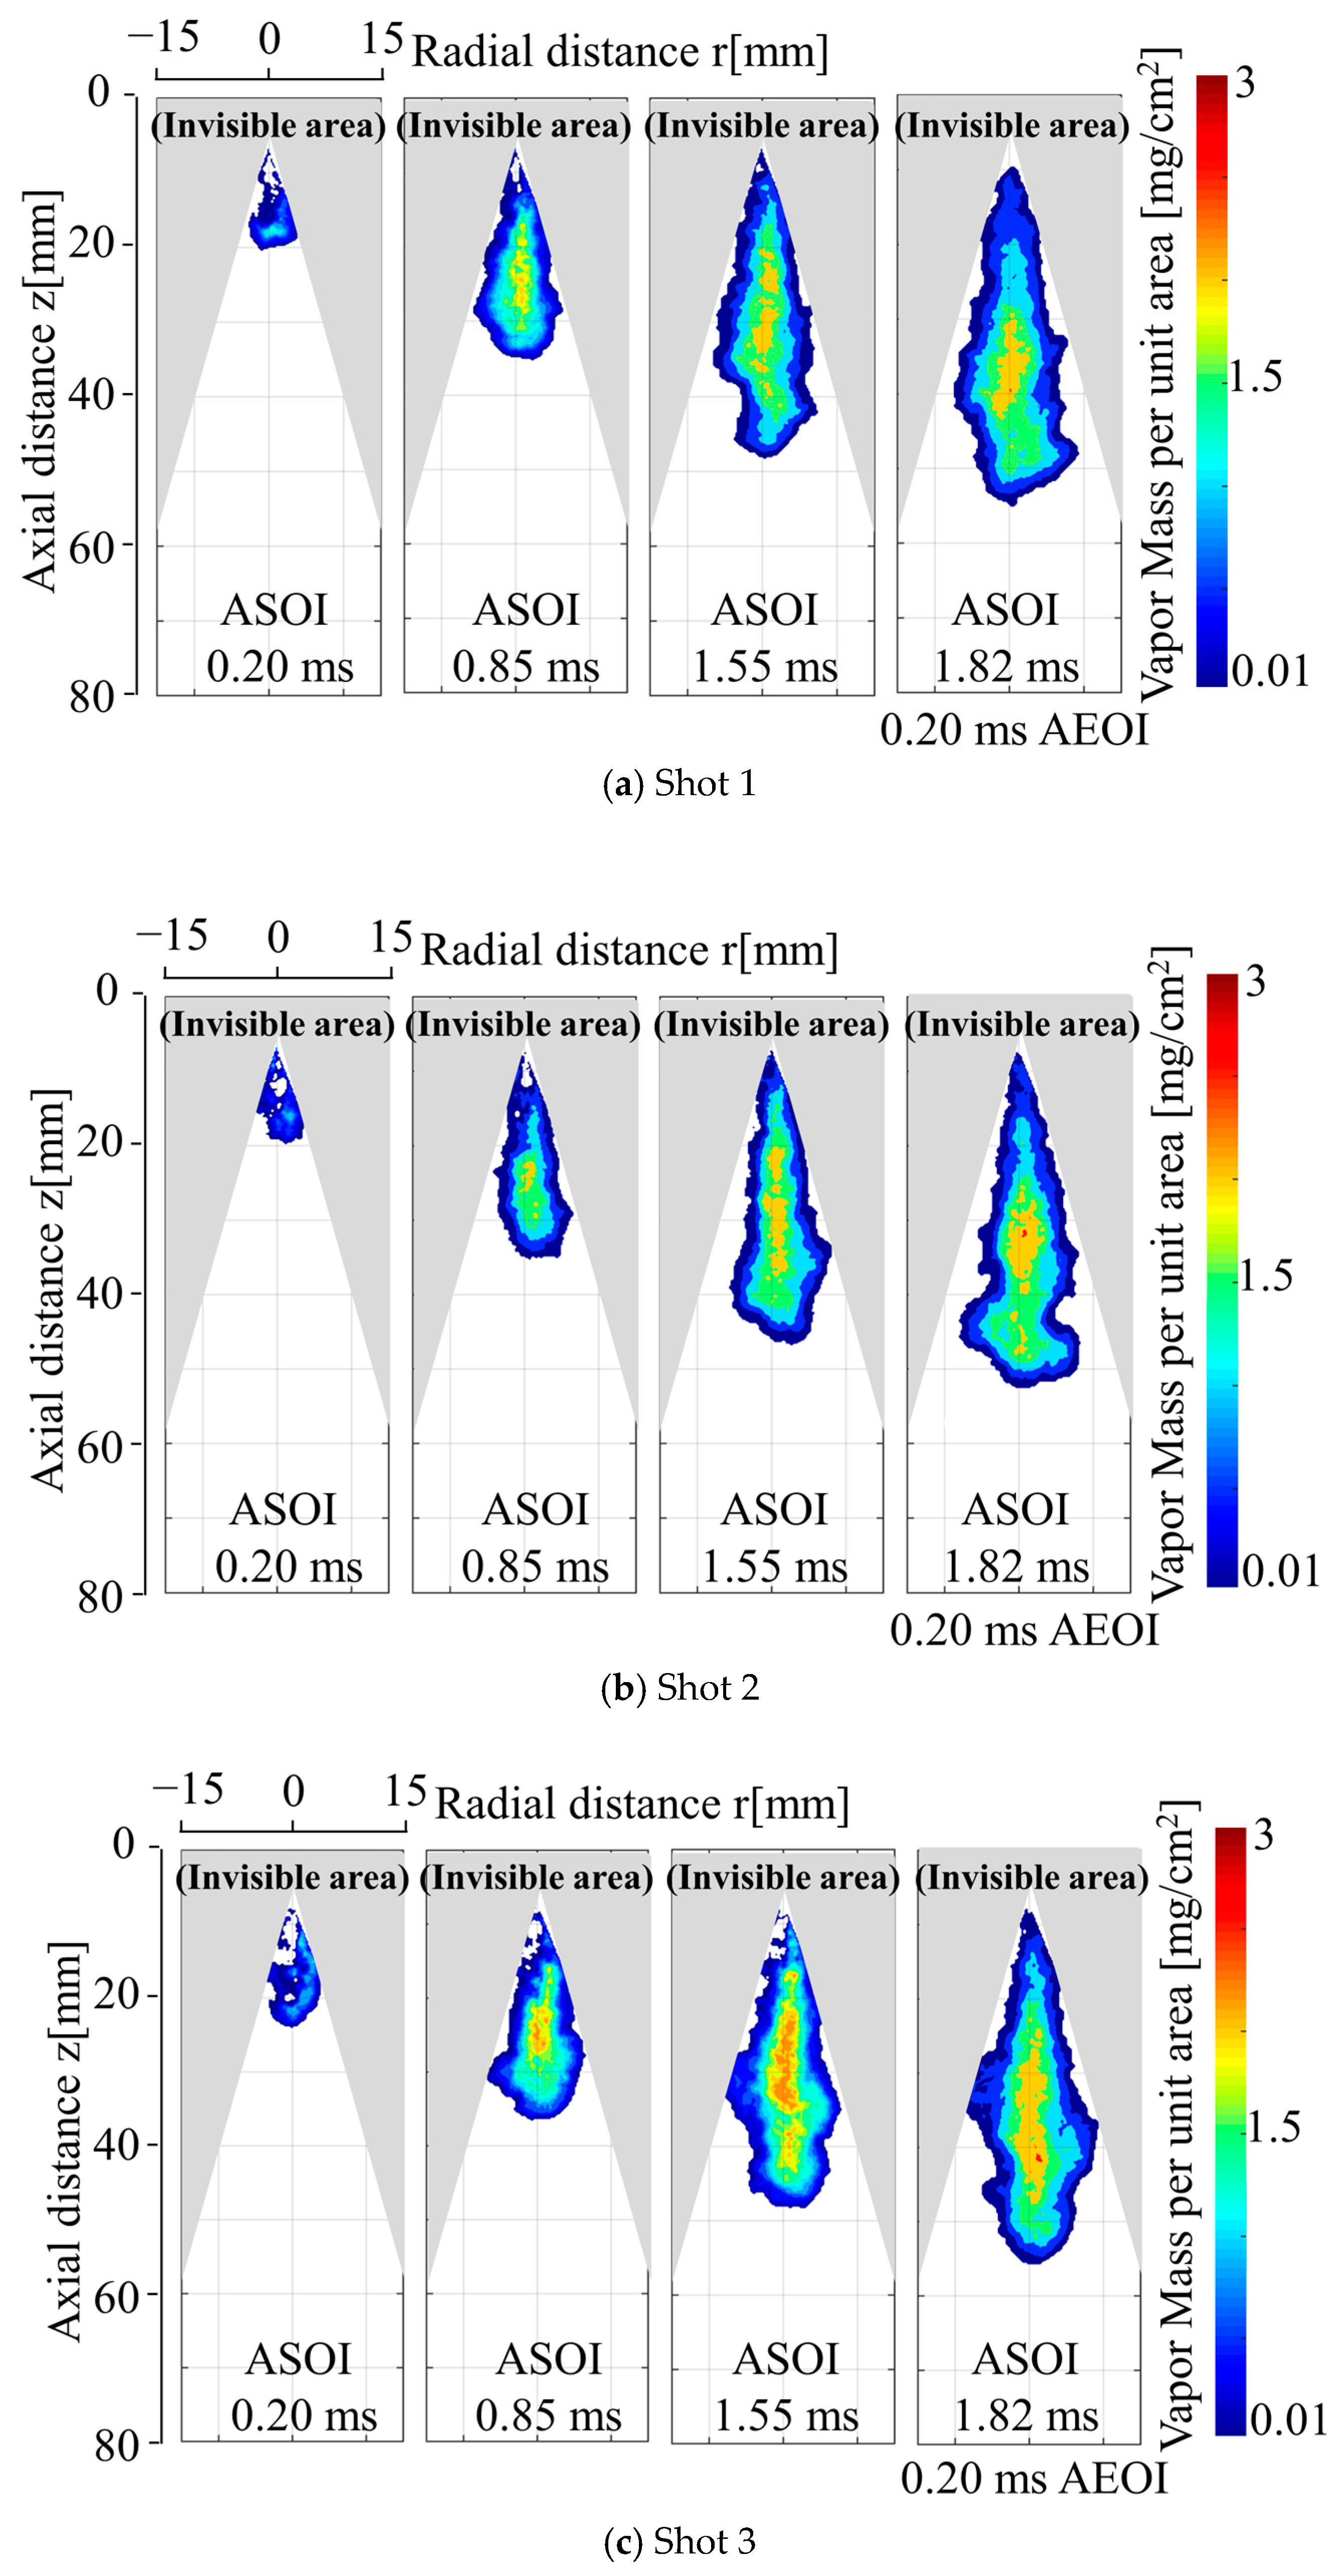
    • In most areas of the spray plume, vapor optical thickness is substantially greater than droplet optical thickness, except in the upstream, droplet-dominated zone.
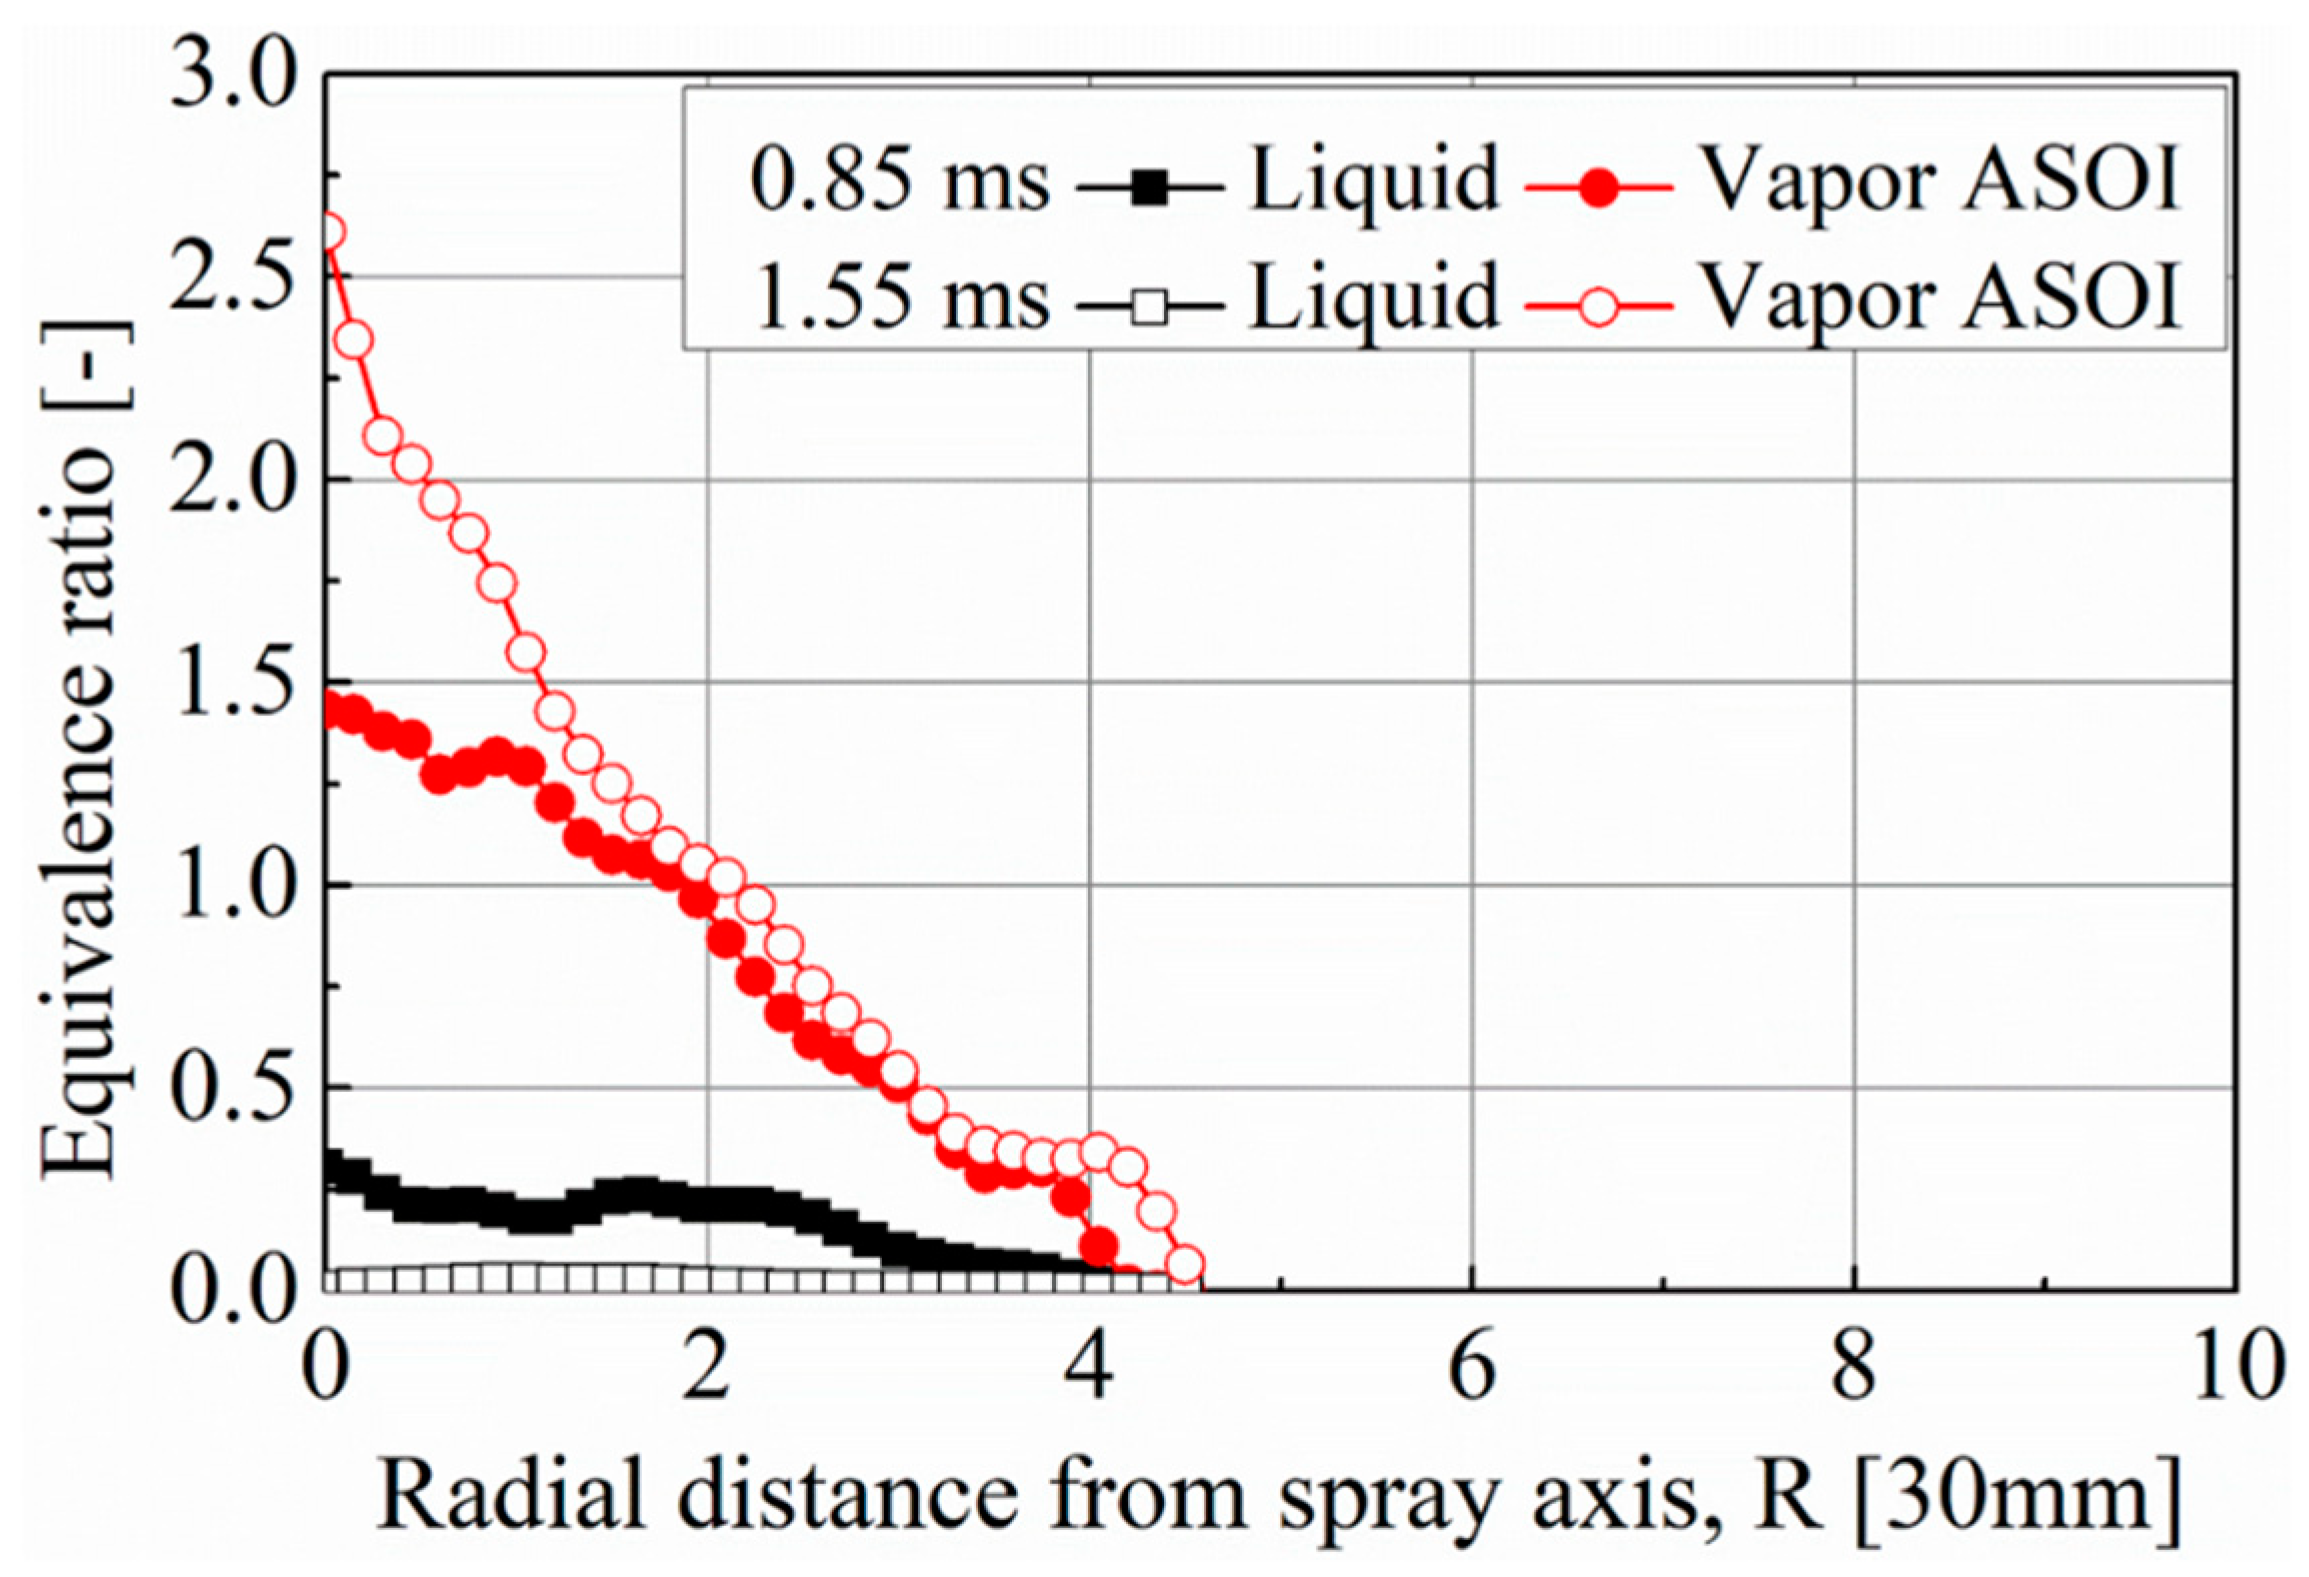
    • During the injection period the liquid phase equivalence ratio dominates first and then decreases whereas the vapor phase equivalence ratio increases as time elapses.
    • Equivalence ratio vapor distribution curves along the spray axis resemble a saddleback. The equivalence ratio of droplets decreases as the radial and axial distances increase.
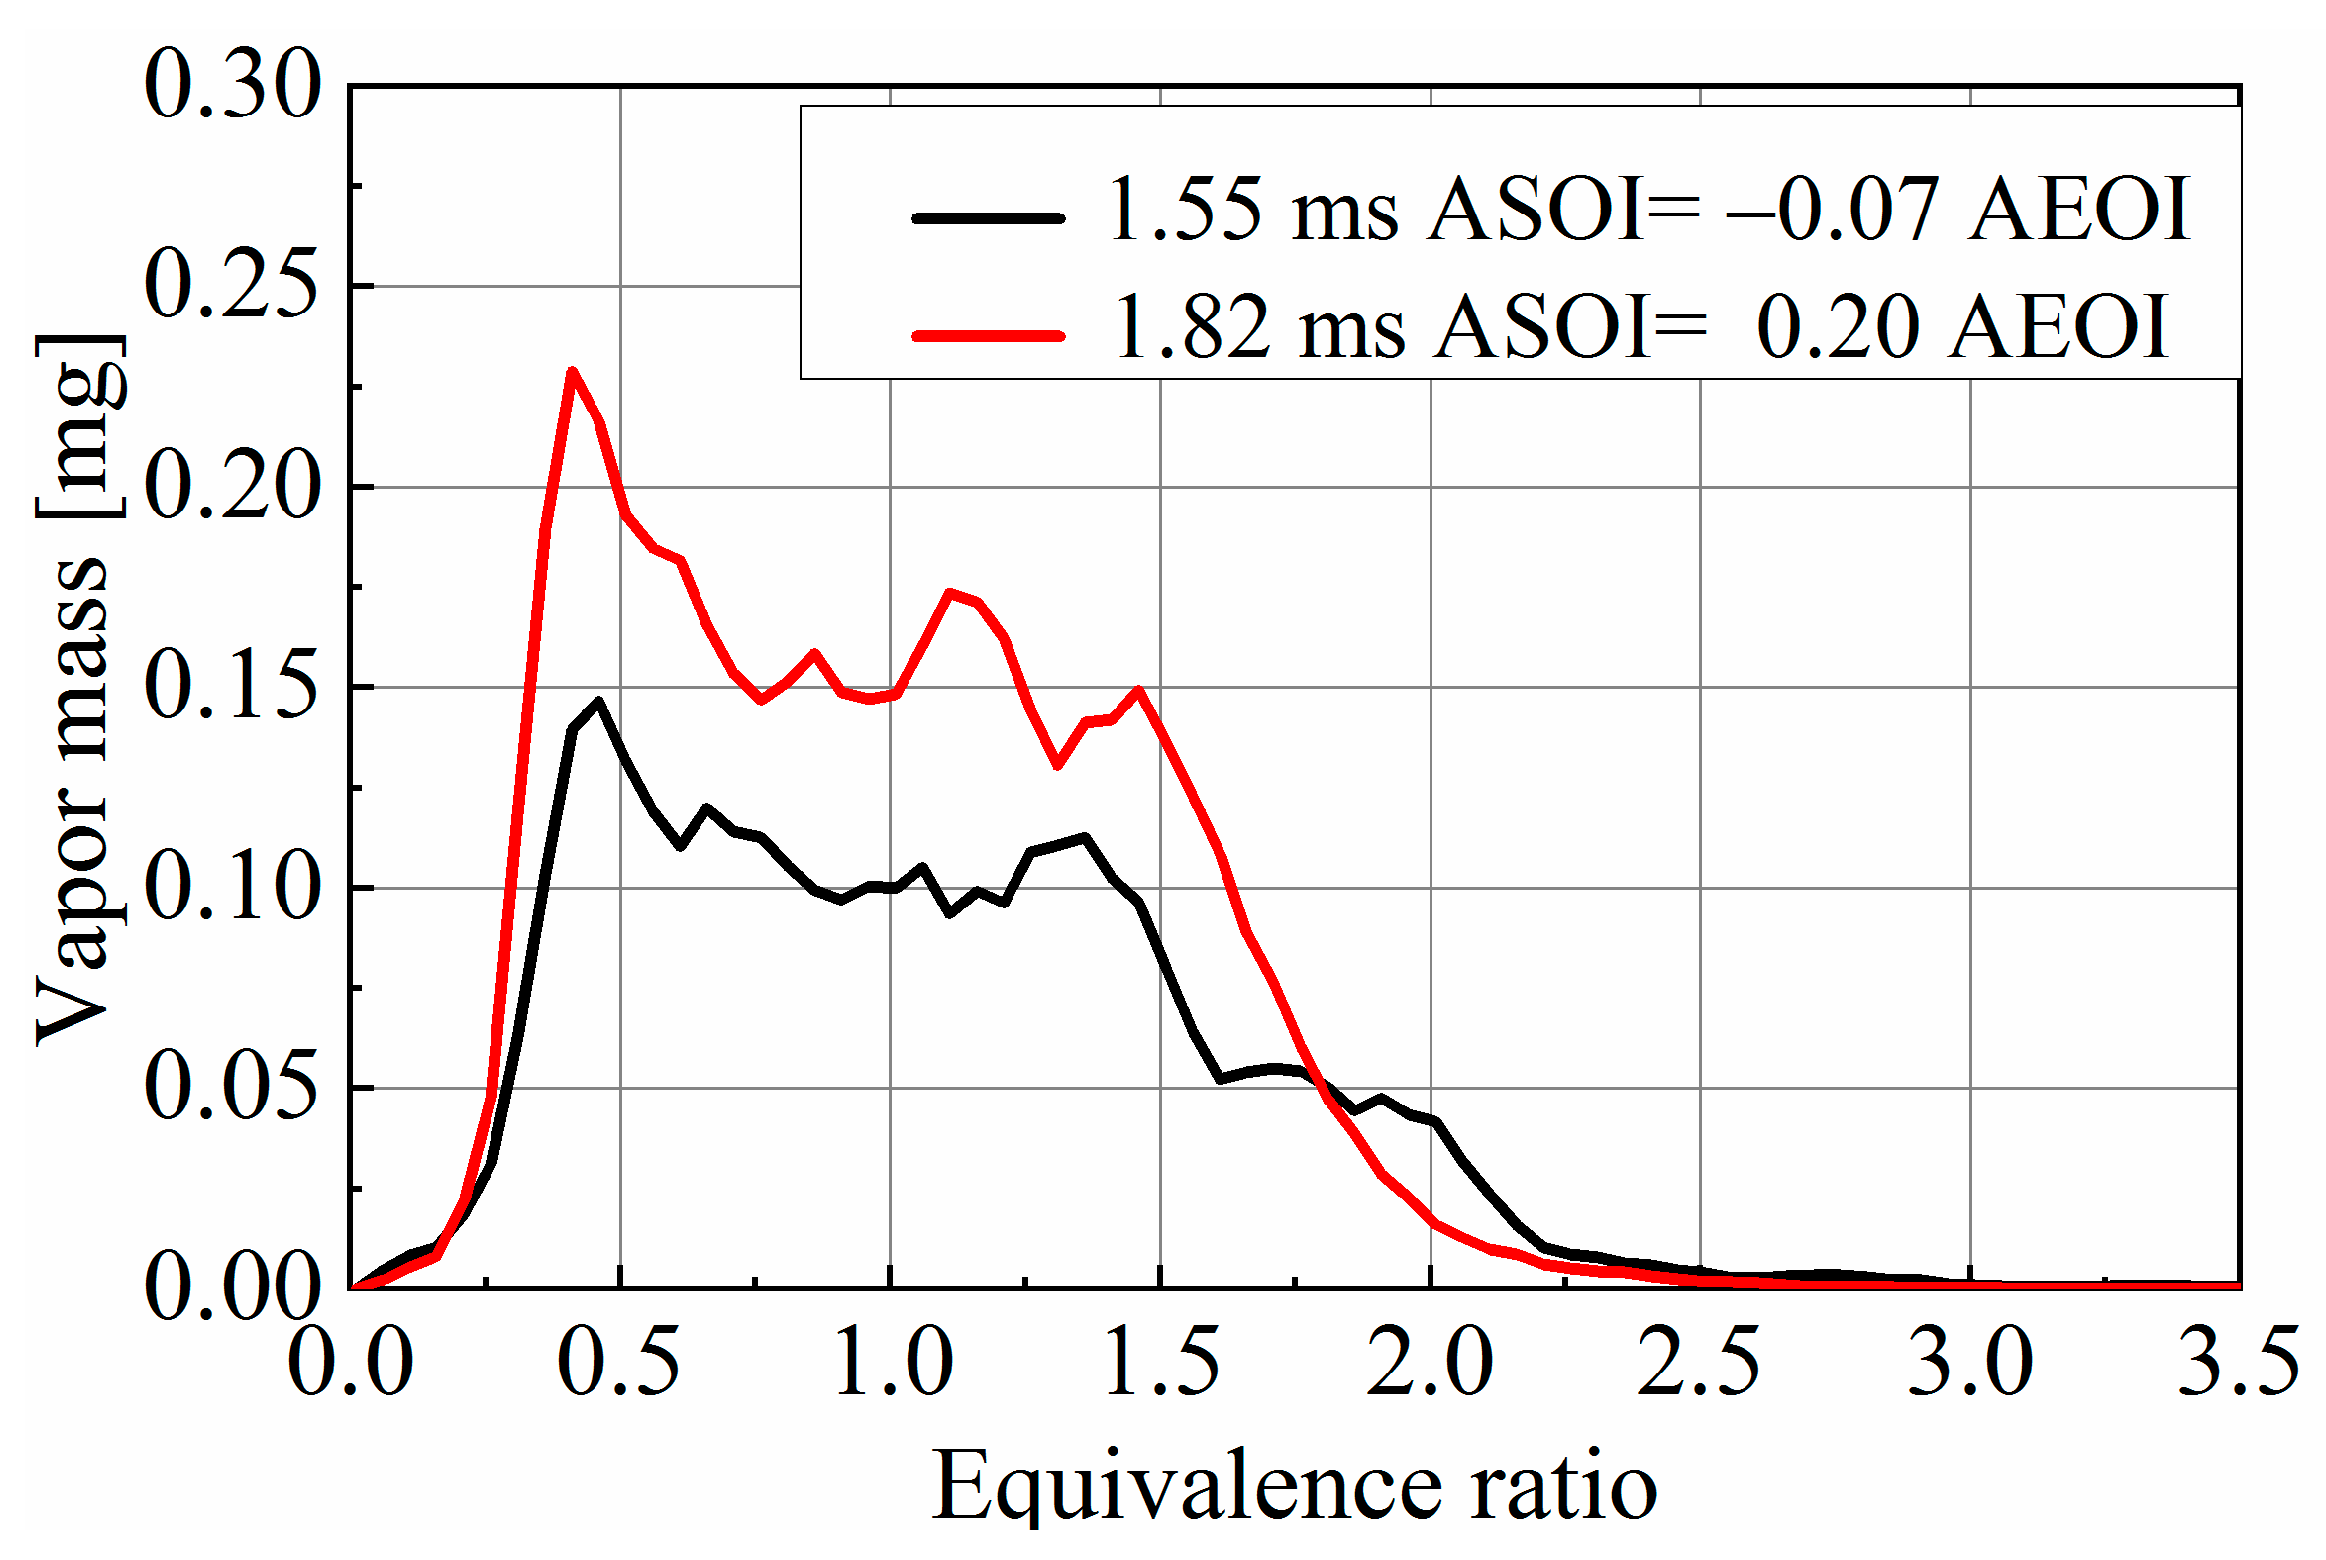
    • After end of injection, the high vapor concentration regions near the nozzle quickly mix with ambient gas, reducing vapor concentrations to low levels, while a high-vapor-concentration region remains at the spray’s tip.
In future studies, a quantitative comparison between two methods will be conducted. Moreover, a more common fuel substitute for diesel fuel will be used. In addition, a computational study will be conducted to compare the shot-to-shot variation.

Author Contributions

Conceptualization, S.C.R. and S.; Writing Original Draft Preparation, S.C.R., S. and S.N.; Supervision, M.A., K.N. and Y.O. All authors have read and agreed to the published version of the manuscript.

Funding

This research received no external funding.

Conflicts of Interest

The authors declare no conflict of interest.

Nomenclature

ASOIafter start of injection
AEOIafter end of injection
CCDcharge-coupled device
DIdirect injection
EOIend of injection
LASlaser absorption-scattering
C-LASconventional laser absorption-scattering
HS-LAShigh speed laser absorption-scattering
LIEFlaser induced exciplex fluorescence
MACmolar absorption coefficient
Mfmass of fuel
OPoptical thickness
Paambient pressure
Pinjpressure of injection
PLRSplanar laser Rayleigh scattering
SOIstart of injection
Taambient temperature
UVultraviolet
Vis.visible

References

  1. Wakisaka, Y.; Azetsu, A. Effects of Fuel Injection Rate Shaping on Combustion and Emission Formation in Intermittent Spray. SAE Tech. Pap. 2002, 111, 2051–2063. [Google Scholar] [CrossRef]
  2. Pickett, L.M.; Manin, J.; Genzale, C.L.; Siebers, D.L.; Musculus, M.P.B.; Idicheria, C.A. Relationship Between Diesel Fuel Spray Vapor Penetration/Dispersion and Local Fuel Mixture Fraction. SAE Int. J. Engines 2011, 4, 764–799. [Google Scholar] [CrossRef]
  3. Jaafar, M.N.M.; Safiullah, S. Combustion Characteristics of Rice Bran Oil Biodiesel in an Oil Burner. J. Teknol. 2018, 80. [Google Scholar] [CrossRef] [Green Version]
  4. Riess, S.; Weiss, L.; Peter, A.; Rezaei, J.; Wensing, M. Air Entrainment and Mixture Distribution in Diesel Sprays Investigated by Optical Measurement Techniques. Int. J. Engine Res. 2018, 19, 120–133. [Google Scholar] [CrossRef]
  5. Browne, K.R.; Patridge, I.M.; Greeves, G. Fuel Property Effects on Fuel/Air Mixing in an Experimental Diesel Engine; Lucas CAV Ltd.: London, UK, 1986. [Google Scholar]
  6. Atsufusa, T.; Nishida, K.; Yoshizaki, T.; Hiroyasu, H. Behaviors of DL Diesel Sprays with Split Injection in a Model Combstion Chamber. 2nd Report. Effects of the Injection Mass Ratio. Trans. Jpn. Soc. Mech. Eng. Ser. B 2000, 66, 1229–1236. [Google Scholar] [CrossRef] [Green Version]
  7. Song, Y.C.; Shi, F.M.; Gao, X.Y.; Yan, F.C.; Chen, J.H. Laser Interfero-Holographic and Tomographic Analysis of Concentration and Temperature Distribution of a Three Dimensional Transient Diesel Spray; SAE Special Publication: Warrendale, PA, USA, 1994. [Google Scholar]
  8. Nishida, K.; Murakami, N.; Hiroyasu, H. Holographic Measurement of Evaporating Diesel Sprays at High Pressure and Temperature: Heat Transfer, Combustion, Power, Thermophysical Properties. JSME Int. J. 1987, 30, 107–115. [Google Scholar] [CrossRef]
  9. Safiullah; Nishida, K.; Ogata, Y.; Oda, T.; Ohsawa, K. Effects of Nozzle Hole Size and Rail Pressure on Diesel Spray and Mixture Characteristics under Similar Injection Rate Profile–Experimental, Computational and Analytical Studies under Non-Evaporating Spray Condition. Proc. Inst. Mech. Eng. Part D J. Automob. Eng. 2021, 236, 310–321. [Google Scholar]
  10. Heinze, T.; Schmidt, T. Fuel-Air Ratios in a Spray, Determined between Injection and Autoignition by Pulsed Spontaneous Raman Spectroscopy. SAE Trans. 1989, 98, 2088–2094. [Google Scholar]
  11. Miles, P.C. Raman Line Imaging for Spatially and Temporally Resolved Mole Fraction Measurements in Internal Combustion Engines. Appl. Opt. 1999, 38, 1714–1732. [Google Scholar] [CrossRef]
  12. Espey, C.; Dec, J.E.; Litzinger, T.A.; Santavicca, D.A. Planar Laser Rayleigh Scattering for Quantitative Vapor-Fuel Imaging in a Diesel Jet. Combust. Flame 1997, 109, 65–86. [Google Scholar] [CrossRef]
  13. Idicheria, C.A.; Pickett, L.M. Quantitative Mixing Measurements in a Vaporizing Diesel Spray by Rayleigh Imaging. SAE Trans. 2007, 116, 490–504. [Google Scholar]
  14. Musculus, M.P.B.; Lachaux, T.; Pickett, L.M.; Idicheria, C.A. End-of-Injection over-Mixing and Unburned Hydrocarbon Emissions in Low-Temperature-Combustion Diesel Engines; SAE Technical Paper; SAE Special Publication: Warrendale, PA, USA, 2007. [Google Scholar]
  15. Seitzman, J.M.; Hanson, R.K. Planar Fluorescence Imaging in Gases. In Instrumentation for Flows with Combustion; Academic Press: New York, NY, USA, 1993; pp. 405–466. [Google Scholar]
  16. Bhayaraju, U.; Hassa, C. Planar Liquid Sheet Breakup of Prefilming and Nonprefilming Atomizers at Elevated Pressures. At. Sprays 2009, 19, 1147–1169. [Google Scholar] [CrossRef]
  17. Schubring, D.; Ashwood, A.C.; Shedd, T.A.; Hurlburt, E.T. Planar Laser-Induced Fluorescence (PLIF) Measurements of Liquid Film Thickness in Annular Flow. Part I: Methods and Data. Int. J. Multiph. Flow 2010, 36, 815–824. [Google Scholar] [CrossRef]
  18. Melton, L.A. Spectrally Separated Fluorescence Emissions for Diesel Fuel Droplets and Vapor. Appl. Opt. 1983, 22, 2224–2226. [Google Scholar] [CrossRef]
  19. Fujimoto, H.; Kusano, S.; Senda, J. Distribution of Vapor Concentration in a Diesel Spray Impinging on a Flat Wall by Means of Exciplex Fluorescence Method-in Case of High Injection Pressure. SAE Trans. 1997, 106, 2305–2316. [Google Scholar]
  20. Senda, J.; Fukami, Y.; Tanabe, Y.; Fujimoto, H. Vizualization of Evaporative Diesel Spray Impinging upon Wall Surface by Exciplex Fluorescence Method. SAE Trans. 1992, 101, 1054–1063. [Google Scholar]
  21. Felton, P.G.; Bracco, F.V.; Bardsley, M.E.A. On the Quantitative Application of Exciplex Fluorescence to Engine Sprays. SAE Trans. 1993, 102, 1254–1262. [Google Scholar]
  22. Bruneaux, G.; Verhoeven, D.; Baritaud, T. High Pressure Diesel Spray and Combustion Visualization in a Transparent Model Diesel Engine. SAE Trans. 1999, 108, 2122–2136. [Google Scholar]
  23. Chu, C. Laser Light Scattering: Basic Principles and Practice. Dover Publication, Inc.: Mineola, NY, USA, 2007. [Google Scholar]
  24. Suzuki, M.; Nishida, K.; Hiroyasu, H. Simultaneous Concentration Measurement of Vapor and Liquid in an Evaporating Diesel Spray. SAE Trans. 1993, 102, 1164–1186. [Google Scholar]
  25. Zhang, Y.; Nishida, K. Vapor Distribution Measurement of Higher and Lower Volatile Components in an Evaporating Fuel Spray via Laser Absorption Scattering (LAS) Technique. Combust. Sci. Technol. 2007, 179, 863–881. [Google Scholar] [CrossRef]
  26. Zhang, Y.; Nishida, K.; Yoshizaki, T. Quantitative Measurement of Droplets and Vapor Concentration Distributions in Diesel Sprays by Processing UV and Visible Images. In Proceedings of the SAE Technical Papers, SAE 2001 World Congress, Detroit, Michigan, 5–8 March 2001. [Google Scholar]
  27. Nishida, K.; Matsuo, T.; Yang, K.; Ogata, Y.; Shimo, D. Spray, Mixture and Combustion Characteristics of Small Injection Amount Fuel Spray Injected by Hole Nozzle for Diesel Engine. In Proceedings of the SAE/JSAE 2016 Small Engine Technology Conference & Exhibition SAE Technical Papers, Charleston, SC, USA, 15–17 November 2016. [Google Scholar] [CrossRef]
  28. Safiullah; Chandra Ray, S.; Nishida, K.; McDonell, V.; Ogata, Y. Effects of Full Transient Injection Rate and Initial Spray Trajectory Angles Profiles on the CFD Simulation of Evaporating Diesel Sprays- Comparison between Single-Hole and Multi Hole Injectors. Energy 2022, 263, 125796. [Google Scholar] [CrossRef]
  29. Safiullah; Mahmud, R.; Nishida, K.; Ogata, Y. Experimental and Computational Study of Diesel Spray under Nonevaporating and Evaporating Conditions—Effects of Nozzle Hole Diameter and Injection Pressure. At. Sprays 2020, 30, 627–649. [Google Scholar] [CrossRef]
  30. Safiullah; Ahmed, A.; Khuhro, A.; Tunio, I.; Nishida, K. Non-Vaporizing and Vaporizing Diesel Spray Evaluation with Experimental and Computational Approaches. Quaid-E-Awam Univ. Res. J. Eng. Sci. Technol. Nawabshah 2021, 19, 115–125. [Google Scholar] [CrossRef]
  31. Chandra Ray, S.; Kim, J.; Kakami, S.; Nishida, K.; Ogata, Y. Effects of Dwell Time of Split Injection on Mixture Formation and Combustion Processes of Diesel Spray. Proc. Inst. Mech. Eng. Part D J. Automob. Eng. 2022, 236, 1977–1990. [Google Scholar] [CrossRef]
  32. Ray, S.C.; Kim, J.; Kakami, S.; Nishida, K.; Ogata, Y. Effects of Split Ratio of Diesel Spray Injection on Mixture Formation and Combustion Process. Proc. Inst. Mech. Eng. Part D J. Automob. Eng. 2021, 235, 3404–3415. [Google Scholar] [CrossRef]
  33. Zhang, Y. A Study on Mixture Formation in Diesel Sprays with Split Injection Strategy. Ph.D. Thesis, Hiroshima University, Hiroshima, Japan, 2001. [Google Scholar]
  34. Safiullah, R.S.C.; Chandra, S.; Nishida, K.; McDonell, V.G.; Ahmed, A.; Ogata, Y. Evaluation of Multi-Hole Diesel Injectors Spray under Evaporating Conditions: Effects of Adjacent Spray Plumes on the Macroscopic and Mixture Characteristics of Target Spray. Proc. Inst. Mech. Eng. Part D J. Automob. Eng. 2022, 09544070221133880. [Google Scholar] [CrossRef]
  35. Safiullah; Nishida, K.; Ogata, Y. Evaporation and Mixture Formation Characteristics of Diesel Spray under Various Nozzle Hole Size and Injection Pressure Condition Employing Similar Injection Rate Profile. Int. Commun. Heat Mass Transf. 2021, 123, 105184. [Google Scholar] [CrossRef]
Figure 1. Principle of the C-LAS technique.
Fuels 04 00006 g001
Figure 2. High-Speed Laser Absorption Scattering (HS-LAS) schemes with optical system and constant volume chamber.
Fuels 04 00006 g002
Figure 3. Temporal variation of injection rate (Pinj = 100 MPa, Mf = 5.0 mg).
Fuels 04 00006 g003
Figure 4. Non evaporating spray image and line-of-sight optical thickness of UV vs. visible light (Ta = 300 K, Pa = 1.8 MPa, Pinj = 100 MPa, Mf = 5.0 mg). (a) Non-evaporating spray images. (b) Line-of-sight optical thickness.
Fuels 04 00006 g004
Figure 5. Spray images in optical thickness at Vis and UV wavelengths (Ta = 800 K, Pa = 4.8 MPa, Pinj = 100 MPa, Mf = 5.0 mg). (a) Single Shot. (b) Average Shot.
Fuels 04 00006 g005
Figure 6. Comparison of vapor mass measured by the C-LAS technique to injected fuel mass (Ta = 800 K, Pa = 4.8 MPa, Pinj = 100 MPa, Mf = 2.5, 5.0 mg).
Fuels 04 00006 g006
Figure 7. Temporal development of liquid and vapor phase equivalence ratio distributions (Ta = 800 K, Pa = 4.8 MPa, Pinj = 100 MPa, Mf = 5.0 mg).
Fuels 04 00006 g007
Figure 8. Axial distribution of liquid and vapor phases equivalence ratio (Ta = 800 K, Pa = 4.8 MPa, Pinj = 100 MPa, Mf = 5.0 mg).
Fuels 04 00006 g008
Figure 9. Radial distribution of liquid and vapor phases equivalence ratio at an axial distance of 30 mm from nozzle tip (Ta = 800 K, Pa = 4.8 MPa, Pinj = 100 MPa, Mf = 5.0 mg).
Fuels 04 00006 g009
Figure 10. The comparison of the vapor mass distribution against equivalence ratio (Ta = 800 K, Pa = 4.8 MPa, Pinj = 100 MPa, Mf = 5.0 mg).
Fuels 04 00006 g010
Figure 11. Evaluation of individual vapor fuel mass distribution fields for (Ta = 800 K, Pa = 4.8 MPa, Pinj = 100 MPa, Mf = 5.0 mg).
Fuels 04 00006 g011
Figure 12. Temporal development of the vapor mass distributions (Ta = 800 K, Pa = 4.8 MPa, Pinj = 100 MPa, Mf = 5.0 mg). (a) Axisymmetric. (b) Non-axisymmetric.
Fuels 04 00006 g012
Table 1. Specification of light source and image intensifier.
DeviceUVVisible
Light sourceUV LEDCW laser
Power of light26.22
CameraHS-video camera (B/W)HS-video camera color
Frame rate fps20,00020,000
Resolution512 × 512512 × 512
Image intensifierUVi camera intensifier
Table 2. Experimental conditions.
Injection Condition
FuelTracer LAS Test Fuel (97.5% n-Tridecane,2,5% 1-MN)
Injector typePiezo type
Number of holes7
Nozzle diameter [mm]0.123
Spray including angle [deg]155
Injection amount, Mf [mg/hole]2.5 5.0
Injection pressure, Pinj [MPa]100
Ambient Condition
Ambient gasNitrogen
Temperature, Ta [K]300800
Pressure, Pa [MPa]1.84.8
Density [kg/m3]20.2
Disclaimer/Publisher’s Note: The statements, opinions and data contained in all publications are solely those of the individual author(s) and contributor(s) and not of MDPI and/or the editor(s). MDPI and/or the editor(s) disclaim responsibility for any injury to people or property resulting from any ideas, methods, instructions or products referred to in the content.

